2019 State of Reliability - June 2019 - NERC
←
→
Page content transcription
If your browser does not render page correctly, please read the page content below
2019
State of Reliability

June 2019

            NERC | Report Title | Report Date
                            I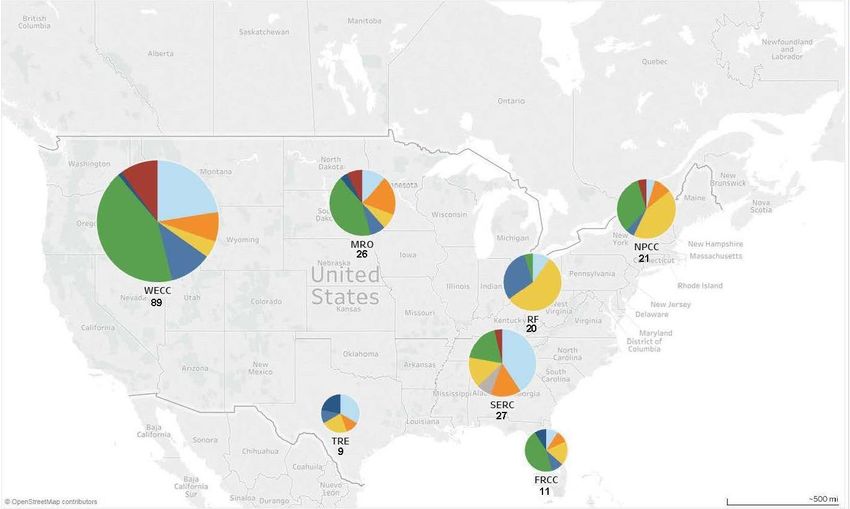
Table of Contents
Preface ........................................................................................................................................................................... iv
About This Report ........................................................................................................................................................... v
  Objective...................................................................................................................................................................... v
  Development Process .................................................................................................................................................. v
  Primary Data Sources .................................................................................................................................................. v
  Reading this Report ................................................................................................................................................... vii
Executive Summary ...................................................................................................................................................... viii
  Recommendations....................................................................................................................................................... x
Chapter 1: The North American BPS—By the Numbers ................................................................................................. 1
Chapter 2: Event Analysis Review ................................................................................................................................... 3
  Situation Awareness, Inputs, and Products................................................................................................................. 3
  2018 Event Analysis Summary..................................................................................................................................... 4
  Event Trends ................................................................................................................................................................ 6
  Review of Major Events (Category 3, 4, and 5) ........................................................................................................... 8
  2018 Lessons Learned ................................................................................................................................................. 9
  NERC Alerts ................................................................................................................................................................ 11
Chapter 3: Reliability Indicators .................................................................................................................................... 12
  Reliability Indicators and Trends ............................................................................................................................... 12
  Energy Emergency Alerts........................................................................................................................................... 15
  Planning Reserve Margin ........................................................................................................................................... 16
  Transmission-Related Events Resulting in Loss of Load ............................................................................................ 18
  Automatic AC Transmission Outages ........................................................................................................................ 20
  Automatic AC Transformer Outages ......................................................................................................................... 23
  Element Unavailability............................................................................................................................................... 25
  Weighted-Equivalent Generation Forced Outage Rate............................................................................................. 28
  Interconnection Frequency Response ....................................................................................................................... 30
  Disturbance Control Standard Failures and Events Greater than MSSC ................................................................... 33
  Protection System Misoperations ............................................................................................................................. 34
  Interconnection Reliability Operating Limit Exceedances ......................................................................................... 36
Chapter 4: Severity Risk Index....................................................................................................................................... 40
  2018 Severity Risk Index and Trends ......................................................................................................................... 42
  Transmission Outage Severity ................................................................................................................................... 48
Chapter 5: Trends in Priority Reliability Issues.............................................................................................................. 50
  BPS Planning and Adapting to the Changing Resource Mix ...................................................................................... 50
  Increasing Complexity in Protection and Control Systems ....................................................................................... 53
  Human Performance and Skilled Workforce ............................................................................................................. 57
  Loss of Situation Awareness ...................................................................................................................................... 61
  Physical Security and Cyber Security ......................................................................................................................... 63
  Resilience and Recovery from Extreme Natural Events ............................................................................................ 69
               Contributions ............................................................................................................................................ 73
               Compilation of Recommendations ........................................................................................................... 74

                                                                  NERC | State of Reliability | June 2019
                                                                                    ii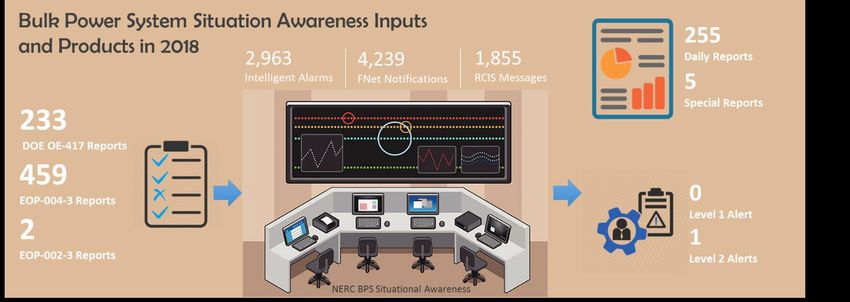
ERRATA, 1.1: June 25, 2019
Page      Section                                                Change
Page 7    Event Trends, 2014–2018                       Clarified 5-year average and annual load
                                                        loss averages in Figure 2.6. Event counts
                                                        revised to reflect corrections. Average load
                                                        loss of was also revised downward from
                                                        167 MW to 116 MW.
Page 19   Transmission-Related Events Resulting in Loss “327 MW in 2014 to 166 MW” was revised
          of Load                                       to “316 MW in 2014 to 197 MW”

                              NERC | State of Reliability | June 2019
                                                iii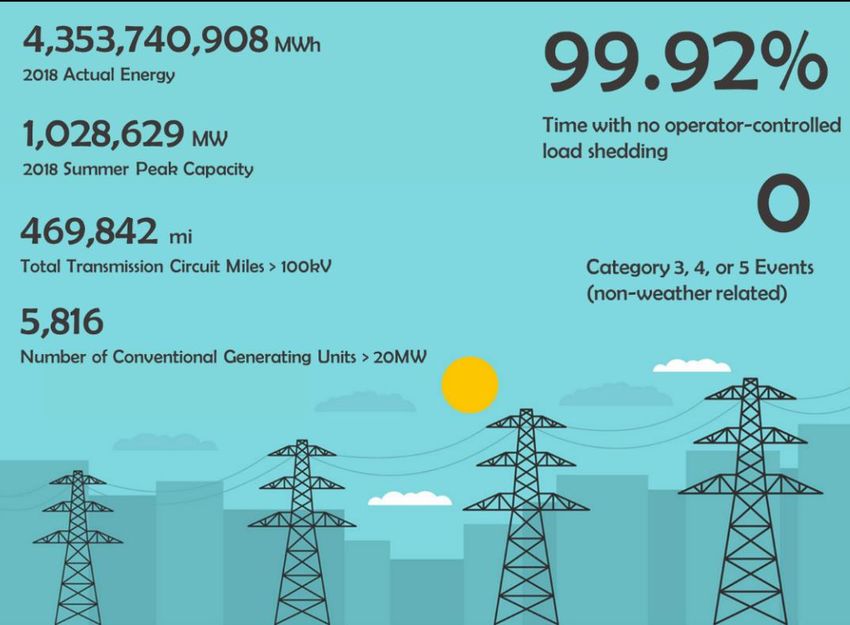
Preface

The vision for the Electric Reliability Organization (ERO) Enterprise, which is comprised of the North American Electric
Reliability Corporation (NERC) and the seven Regional Entities (REs), is a highly reliable and secure North American
bulk power system (BPS). Our mission is to assure the effective and efficient reduction of risks to the reliability and
security of the grid.

The North American BPS is divided into seven RE boundaries as shown in the map and corresponding table below.
The multicolored area denotes overlap as some load-serving entities participate in one Region while associated
Transmission Owners/Operators (TOs/TOPs) participate in another.

                                FRCC        Florida Reliability Coordinating Council
                                MRO         Midwest Reliability Organization
                                NPCC        Northeast Power Coordinating Council
                                RF          ReliabilityFirst
                                SERC        SERC Reliability Corporation
                                Texas RE    Texas Reliability Entity
                                WECC        Western Electricity Coordinating Council

                                           NERC | State of Reliability | June 2019
                                                             iv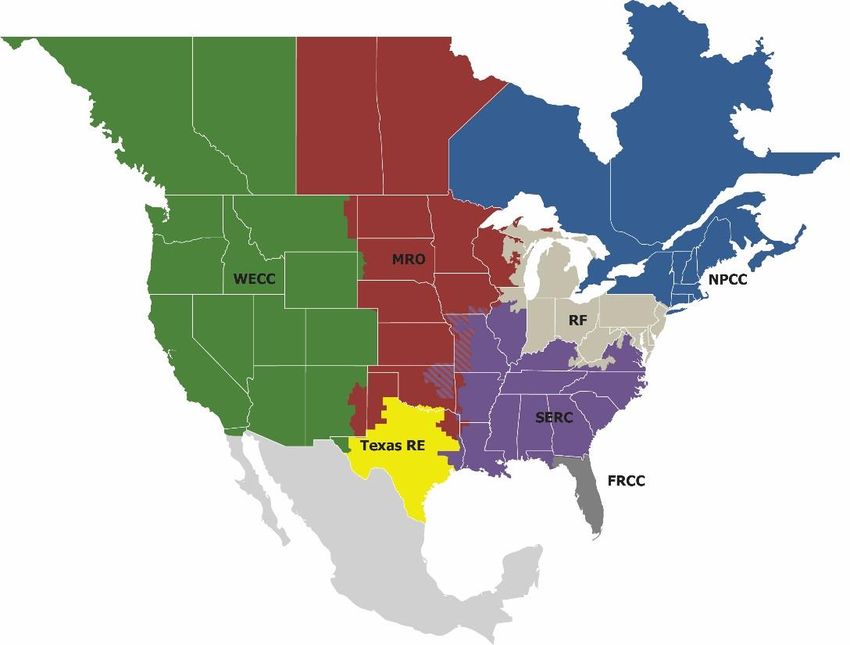
About This Report
Objective
The objective of this annual report is to provide objective and concise information to policymakers, industry leaders,
and the NERC Board of Trustees (Board) on issues affecting the reliability and resilience of the North American BPS.
Specifically, the report does the following:
Identifies system performance trends and emerging reliability risks
Reports on the relative health of the interconnected system
Measures the success of mitigation activities deployed
NERC, as the ERO of North America, assures the effective and efficient reduction of reliability and security risks for
the North American BPS. Annual and seasonal risk assessments that look to the future and special reports on
emergent risks serve to identify and mitigate potential risks. Additionally, analyses of past BPS performance serve to
document BPS adequacy and to identify positive or negative performance trends. The annual State of Reliability
report is one such analysis of past performance that informs regulators, policymakers, and industry leaders while
providing strong technical support for those interested in the underlying data and detailed analytics.
Development Process
The ERO staff developed this independent assessment with support from the Performance Analysis Subcommittee
(PAS). The 2019 State of Reliability focuses on BPS performance during the prior complete year as measured by a
predetermined set of reliability indicators and more detailed analysis performed by ERO staff and technical
committee participants. The report is accepted by the Planning and Operating Committees and approved by the NERC
Board of Trustees. The report is published annually, generally in June.
Primary Data Sources
In addition to a variety of information-sharing mechanisms, including (but not limited to) the Electricity Information
Sharing and Analysis Center (E-ISAC) and the NERC Planning, Operating, and Critical Infrastructure Committees, the
ERO administers and maintains the information systems described in Figure 1.
NERC | State of Reliability | June 2019
v
About This Report

            Figure 1: NERC Reliability Performance and Event Information Systems

                                 NERC | State of Reliability| June 2019
                                                   vi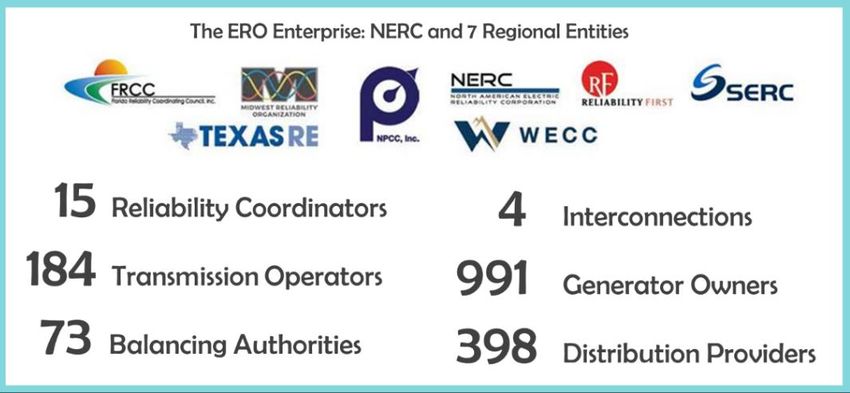
About This Report
Reading this Report
This report is divided into five chapters (see Table 1).
Table 1: State of Reliability Major Parts
The North American BPS: By the Detailed statistics on peak demand, energy, generation capacity, fuel mix,
Numbers transmission miles, and functional organizations
Event Analysis Review A detailed review of qualified events analyzed by NERC, including root cause
statistics, historical trends, and highlights of published lessons learned
Reliability Indicators A set of reliability metrics that evaluate four core aspects of system
performance: resource adequacy, transmission performance and
availability, generation performance and availability, and system protection
and disturbance performance
Severity Risk Index A composite daily severity index based on generation, transmission, and load
loss and compared to prior years
Trends in Priority Reliability Data and analysis from various NERC data sources compiled to provide clear
Issues insights on a variety of priority reliability issues (included assessments help
provide guidance to policy makers, industry leaders, and the NERC Board of
Trustees)
Additional Considerations
Additional considerations include the following:
The data in this report represents the performance for the January–December 2018 operating year unless
otherwise noted.
Analysis in this report is based on 2014–2018 data and provides a basis to evaluate 2018 performance relative
to performance over the last five years.
This report is a review of industrywide trends, not of the performance of individual entities. Accordingly,
information presented in this report is always aggregated in order to maintain the anonymity of individual
reporting organizations.
The background on approaches, methodologies, statistical tests, and procedures are available by request.
When analysis is presented by Interconnection, Quebec Interconnection is included in the Eastern
Interconnection unless specific analysis for Quebec is shown.
NERC | State of Reliability| June 2019
vii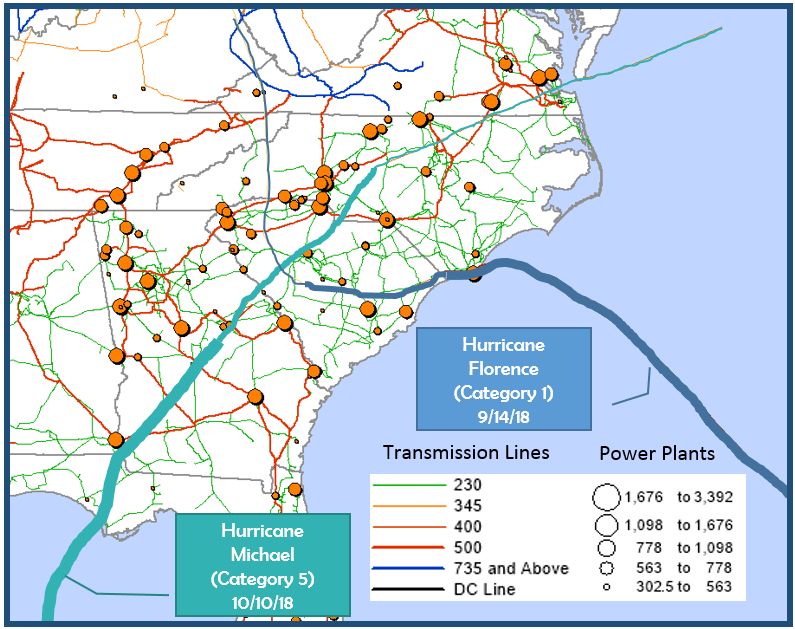
Executive Summary

The 2019 State of Reliability is NERC’s independent assessment that focuses on BPS performance during 2018 as
measured by a predetermined set of reliability indicators. This report, issued annually, is an analysis of past
performance that informs regulators, policymakers, and industry leaders of reliability and performance trends,
needed actions to address known and emerging risks, and whether mitigations have led to positive improvements on
the system.

The electricity sector is undergoing significant and rapid change, presenting new challenges and opportunities for
reliability. With appropriate insight, careful planning, and continued support, the electricity sector will continue to
navigate the associated challenges in a manner that maintains reliability. Year-over-year performance measures show
generally positive trends in terms of generation, transmission, and protection and control performance. However,
the evolving resource mix, along with persistent cyber and physical security threats, present critical challenges to BPS
reliability that require the industry and the regulators to remain vigilant. As a key element of the ERO’s mission, NERC
remains focused on identifying emerging risks in order to maintain a proactive posture to ensure that the BPS remains
highly reliable.

Based on data and information collected for this assessment, NERC has identified the following key findings:

Key Finding 1
Extreme weather events continue to be leading contributors to transmission, generation, and load loss.
While extreme weather events continue to stress transmission, generation, and distribution systems, BPS reliability
was maintained. Resilience to extreme weather was evidenced by adequate supply and strong transmission
performance compared to the benchmark performance levels experienced during the 2014 polar vortex. There were
two weather-related Category 3 events due to Hurricane Michael and Hurricane Florence. Transmission recovery
during the extreme weather events in 2018 was evidenced by quick restoration times and statistically significant
reductions in transmission outage severity. For more detailed information, refer to Chapter 4: Severity Risk Index.

Key Finding 2
There were no non-weather-related category 3, 4, or 5 events in 2018.
2018 was a year of high reliability with no non-weather related Category 3, 4, or 5 events and only one Energy
Emergency Alert–Level 3 that led to firm load shedding (675 MW of load loss consisting of UFLS activation, manual
firm load shedding action, and interruptible load curtailment actions in Nova Scotia on November 29, 2018, lasting
just over seven hours due to extreme weather). Firm load was served 99.92% of time. This does not include
inconsequential load loss or load loss due to distribution outages. For more detailed information, refer to Chapter 2:
Event Analysis Review.

Key Finding 3
In Texas, there is still reliability risk in 2019 due to the projected capacity deficit, but better than expected
performance from the generation fleet helped meet 2018 summer peak demand.
Texas continues to have insufficient resources to meet the Reference Margin Level, but still successfully met demand
throughout the 2018 summer season. Despite having set a new system-wide peak demand record of 73,308 MW on
July 19, 2018, higher than average peak availability from both wind and conventional generation (along with the use
of demand response resources) helped serve peak demand and emergency operating procedures, such as firm load
shedding, was not needed. For more detailed information, refer to Chapter 3: Reliability Indicators.

                                           NERC | State of Reliability | June 2019
                                                            viii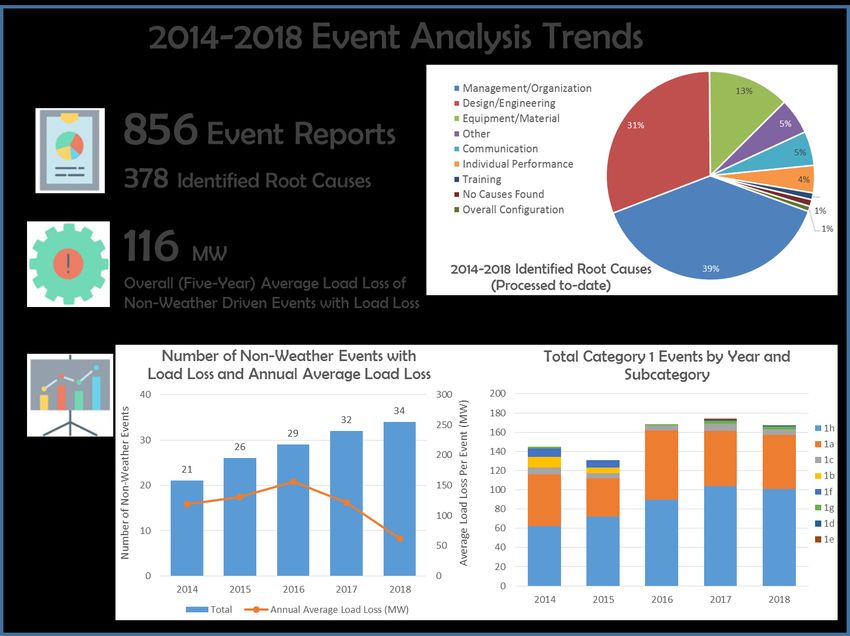
Executive Summary

Key Finding 4
Despite continually evolving threats, no cyber or physical security incidents leading to unauthorized control
actions or loss of load occurred in 2018.
In 2018, there were no reported cyber or physical security incidents that resulted in an unauthorized control action
or loss of load. Nonetheless, grid security (particularly cyber security) is an area where NERC and industry must
continually improve defenses as threats continue to rapidly evolve. While there were no NERC-reportable cyber
security incidents during 2018, this does not mean that the risk of a cyber security incident is low, as the number of
cyber security vulnerabilities are increasing. Both mandatory and voluntary reporting indicate that distribution-level
events are more frequent than those affecting BES equipment. For more detailed information, refer to Chapter 5:
Trends in Priority Reliability Issues.

Key Finding 5
Misoperations continue to be reduced.
Protection system misoperations exacerbate the severity of transmission outages. While the overall misoperations
rate is slightly higher in 2018 than 2017 (8.0%, up from 7.4% in 2017), a statistically significant downward (positive)
trend is shown over the past five-year period. The three largest causes of misoperations in 2018 were the same as in
2017: Incorrect Settings/Logic/Design Errors, Relay Failure/Malfunctions, and Communication Failures. For more
detailed information, refer to Chapter 3: Reliability Indicators.

Key Finding 6
There were frequency response improvements in all Interconnections.
Frequency response arrests and stabilizes frequency during system disturbances. NERC closely monitors the
frequency response of each of the four Interconnections and measures the margin at which under-frequency load
shedding (UFLS) would be activated. UFLS provides a vital safety net for preserving Interconnection reliability, and
measuring the margin allows NERC and the industry to ensure there is adequate frequency response on the system.
For all Interconnections, frequency response performance improved with statistical confidence in the arresting
and/or settling periods. For more detailed information, refer to Chapter 3: Reliability Indicators.

Key Finding 7
As more inverter-based resources are added, solutions to emerging reliability challenges are being identified.
Inverter-based resources includes solar photovoltaic (PV), battery storage, and many forms of wind generation. A
number of routine transmission line outages have led to the unplanned and wide-spread loss of significant amounts
of predominately BPS-connected, inverter-based generation. In 2017, NERC established the Inverter-Based Resource
Performance Task Force to study the issue and inform industry on the risks posed and options for mitigating them. In
2018, industry began implementation of the Inverter-Based Resource Performance Guideline. This, along with wide-
spread recognition of the challenge, has gathered the industry’s best technical experts to develop solutions through
a variety of new protection and control requirements, clarification to NERC Reliability Standards, and technical
specifications through IEEE. For more detailed information, refer to Chapter 5: Trends in Priority Reliability Issues.

                                           NERC | State of Reliability| June 2019
                                                             ix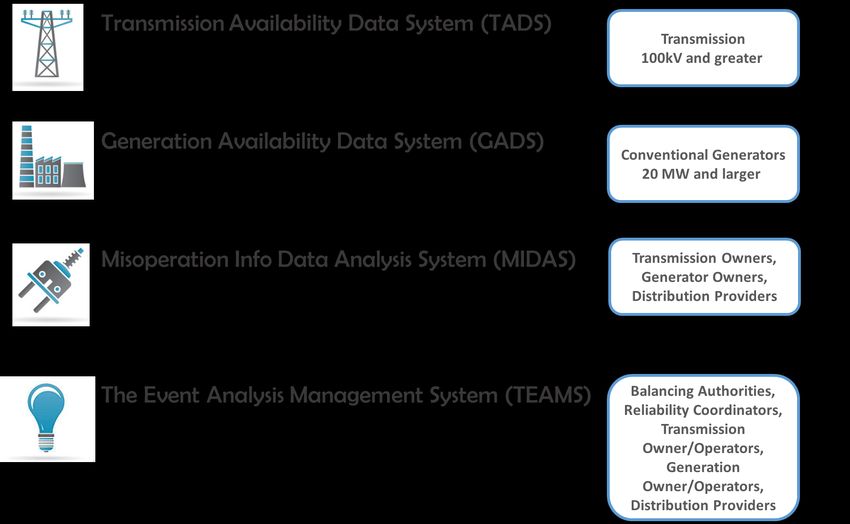
Executive Summary
Recommendations
Based on the identified key findings, NERC formulated the following high-level recommendations:
The ERO and industry should continue improving their ability to understand, model, and plan for a system
with a significantly different resource mix. Priority should be given to understanding the implications of the
following:
Frequency response under low inertia conditions
Contributions of inverter-based resources to essential reliability services
Increasing protection system and restoration complexities with increased inverter-based resources
Resource adequacy with increasing energy constraints
The ERO and industry should develop comparative measurements and metrics to understand the different
dimensions of resilience (e.g., withstanding the direct impact, managing through the event, recovering from
the events, and preparing for the next event) during the most extreme events and how system performance
changes over time.
The ERO and industry should continue to work closely together to understand and share information on cyber
and physical security threats and mitigate the risks posed by these threats through a variety of approaches,
including resilient system design, consequence-informed planning and operation, and practicing response
and recovery processes.
In addition to these high-level recommendations, Chapter 5: Trends in Priority Reliability Issues includes more
detailed and tactical recommendations for each of the six identified priorities issues:
BPS Planning and Adapting to the Changing Resource Mix
Increasing Complexity in Protection and Control Systems
Human Performance and Skilled Workforce
Loss of Situation Awareness
Physical Security and Cyber Security
Resilience and Recovery from Extreme Natural Events
NERC | State of Reliability| June 2019
xChapter 1: The North American BPS—By the Numbers
Figure 1.1 shows some numbers and facts about the North American BPS.
Figure 1.1: 2018 BPS Inventory and Performance Statistics, and Key Functional Organizations
NERC | State of Reliability| June 2019
1Chapter 1: The North American BPS—By the Numbers
How NERC Defines Bulk Power System Reliability
NERC defines the reliability of the interconnected BPS in terms of two basic and functional aspects as follows:
Adequacy: The ability of the electric system to supply the aggregate electric power and energy requirements of the electricity
consumers at all times while taking into account scheduled and reasonably expected unscheduled outages of system
components
Operating Reliability: The ability of the electric system to withstand sudden disturbances, such as electric short circuits or
unanticipated loss of system components
Regarding adequacy, system operators can and should take controlled actions or introduce procedures to maintain a
continual balance between supply and demand within a balancing area (formerly known as a control area). Emergency actions
in a capacity deficit condition include public appeals and the following:
Interruptible demand that the end‐use customer makes available to its load-serving entity via contract or agreement
for curtailment
Voltage reductions (often referred to as “brownouts” because incandescent lights will dim as voltage is lowered,
sometimes as much as 5%)
For rotating blackouts, the term “rotating” is used because each set of distribution feeders is interrupted for a limited
time, typically 20–30 minutes, and then those feeders are put back in service and another set is interrupted, and so
on, rotating the outages among individual feeders
Under the heading of operating reliability are all other system disturbances that result in the unplanned and/or uncontrolled
interruption of customer demand, regardless of cause. When these interruptions are contained within a localized area, they
are considered unplanned interruptions or disturbances. When they spread over a wide area of the grid, they are referred to
as “cascading blackouts,” the uncontrolled successive loss of system elements triggered by protective systems.
The intent of the set of NERC Reliability Standards is to deliver an adequate level of reliability (ALR).
Adequate Level of Reliability: The state that the design, planning, and operation of the Bulk Electric System (BES) will achieve
when the following reliability performance objectives are met with the following considerations:
The BES does not experience instability, uncontrolled separation, cascading, and collapse under normal operating
conditions and/or voltage when subject to predefined disturbances.
BES frequency is maintained within defined parameters under normal operating conditions and when subject to
predefined disturbances.
BES voltage is maintained within defined parameters under normal operating conditions and when subject to
predefined disturbances.
Adverse reliability impacts on the BES following low-probability disturbances (e.g., multiple contingencies, unplanned and
uncontrolled equipment outages, cyber security events, and malicious acts) are managed.
Restoration of the BES after major system disturbances that result in blackouts and widespread outages of BES elements is
performed in a coordinated and controlled manner.
For these less probable severe events, BES owners and operators may not be able to apply economically justifiable or practical
measures to prevent or mitigate an adverse reliability impact on the BES even if these events can result in cascading,
uncontrolled separation, or voltage collapse. Less probable severe events would include, for example, losing an entire right
of way due to a tornado, simultaneous or near simultaneous multiple transmission facilities outages due to a hurricane,
sizeable disruptions to natural gas infrastructure impacting multiple generation resources, or other severe phenomena.
NERC | State of Reliability| June 2019
2Chapter 2: Event Analysis Review
The ERO’s Event Analysis Process (EAP)1 is used to conduct sequence and root cause analysis of disruption events
occurring on the BPS (see Figure 2.1). The EAP begins with the ERO’s Situational Awareness program to monitor real-
time conditions and potential events on the BPS. Information is gathered for larger and more impactful events
through the EAP. Review and analysis of this information helps identify potential reliability risks or emerging threats
that can be addressed through a variety of solutions.
The primary reason for participating in an event analysis is to determine if there are lessons to be learned and shared
with the industry. The analysis process involves identifying what happened, why it happened, and what can be done
to prevent reoccurrence. Identification of the sequence of events answers the “what happened” question and
determination of the root cause of an event answers the “why” question. It also allows for events to have cause codes
or characteristics and attributes assigned that can then be used to identify trends. Trends may identify the need to
take action, such as a NERC alert, or may initiate the need for the development of or revisions to Reliability Standards.
Real-time, Uncategorized Category 1–5 Category 4 or 5 Events
Figure 2.1: Event Analysis Process
Situation Awareness, Inputs, and Products
NERC Bulk Power System Awareness (BPSA) collects and analyzes information on system disturbances and other
incidents that have an impact on the North American BPS and disseminates this information to internal departments,
registered entities, regional organizations, and governmental agencies as necessary. Also, BPSA monitors ongoing
storms, natural disasters, and geopolitical events that may potentially impact or are currently impacting the BPS. See
Figure 2.2 for more information.
Figure 2.2: Bulk Power System Awareness by the Numbers
1
EAP in effect as of January 1, 2017: http://www.nerc.com/pa/rrm/ea/ERO_EAP_Document/ERO_EAP_v3.1.pdf
NERC | State of Reliability| June 2019
3Chapter 2: Event Analysis Review
2018 Event Analysis Summary
In 2018, industry reported 177 qualified events to the ERO Enterprise. The majority of the reports, 169 specifically,
were Category 1 events. The top three most reported event categories in 2018 are Management and Organization,
Design/Engineering, and Equipment/Materials. There were two weather-related Category 3 and no Category 4 or 5
events reported on the system for 2018. Hurricane Michael and Hurricane Florence occurred during 2018 and are
Category 3 events based on the ERO EAP definitions. These weather-related events are being processed by FRCC and
SERC to determine categorization, capture impacts, and identify high-level lessons learned and effective practices
from the planning, preparation, and response to these storms. See Figures 2.3–2.5 for a summary of events.
Figure 2.3: 2018 Qualified Events by Category
In addition to the categorized events listed above, significant generator outages during early January created an
unusual operating condition in the South Central United States area. While not a categorized event, the operating
condition led to the system being postured in a certain way that had the potential to cause an adverse reliability
impact to the BPS. As a result, a joint NERC-FERC inquiry was conducted. At the time of publishing this report, the
joint report has not yet been released.
NERC | State of Reliability| June 2019
4Chapter 2: Event Analysis Review
Categories and Subcategories for Qualifying Events
Category 1: An event that results in one or more of the following
a. An unexpected outage that is contrary to design of three or more BES facilities caused by a common disturbance,
listed here:
i. The sustained outage of a combination of three or more BES facilities
ii. The outage of an entire generation station of three or more generators (aggregate generation of 500 MW to
1,999 MW); each combined-cycle unit is counted as one generator
b. Intended and controlled system separation by the proper operation of a special protection system (SPS) or
remedial action scheme (RAS) in New Brunswick or Florida from the Eastern Interconnection
c. Failure or misoperation of a BES SPS/RAS
d. System-wide voltage reduction of 3% or more that lasts more than 15 continuous minutes due to a BES emergency
e. Unintended BES system separation that results in an island of 100 MW to 999 MW. This excludes BES radial
connections and non-BES (distribution) level islanding
g. In ERCOT, unintended loss of generation of 1,000 MW to 1,999 MW
h. Loss of monitoring or control at a control center such that it significantly affects the entity’s ability to make
operating decisions for 30 continuous minutes or more. Some examples that should be considered for Event
Analysis reporting include, but are not limited to, the following:
i. Loss of operator ability to remotely monitor or control BES elements
ii. Loss of communications from supervisory control and data acquisition (SCADA) remote terminal units (RTUs)
iii. Unavailability of inter-control center protocol (ICCP) links, which reduces BES visibility
iv. Loss of the ability to remotely monitor and control generating units via automatic generator control
v. Unacceptable state estimator or real time contingency analysis solutions
Category 2: An event that results in one or more of the following
a. Complete loss of interpersonal communication and alternative interpersonal communication capability affecting
its staffed BES control center for 30 continuous minutes or more.
c. Voltage excursions within a TOP’s footprint equal to or greater than 10%, lasting more than 15 continuous minutes
d. Complete loss of off-site power to a nuclear generating station per the Nuclear Plant Interface Requirement
e. Unintended system separation that results in an island of 1,000 MW to 4,999 MW
f. Unintended loss of 300 MW or more of firm load for more than 15 minutes
g. Interconnection Reliability Operating Limit (IROL) violation for time greater than Tv
Category 3: An Event that Results in One or More of the Following
a. Unintended loss of load or generation of 2,000 MW or more.
b. Unintended system separation that results in an island of 5,000 MW to 10,000 MW
c. Unintended system separation (without load loss) that islands Florida from the Eastern Interconnection
Category 4: An Event that Results in One or More of the Following
a. Unintended loss of load or generation from 5,001 MW to 9,999 MW
b. Unintended system separation that results in an island of more than 10,000 MW (with the exception of Florida as
described in Category 3c)
Category 5: An Event that Results in One or more of the Following:
a. Unintended loss of load of 10,000 MW or more
b. Unintended loss of generation of 10,000 MW or more
NERC | State of Reliability| June 2019
5Chapter 2: Event Analysis Review
Figure 2.4: Number of Events per Category by Year
Figure 2.5: 2018 Identified Event Root Causes (processed to date)
Event Trends
There were 177 BPS events reported to NERC in 2018; this is comparable to the number of events reported per year
in the preceding four-year period. In total, 856 events reports were submitted between 2014 and 2018. The largest
portion of the cause coded events over the past five years was “Information to determine root cause less than
adequate” (351). Of the 378 identified root causes, “Management/Organization” was identified as the leading root
cause—146 events, or 39% of all identified root causes. “Design/Engineering” was second with 116 events, or 31%.
See Figure 2.6 for a summary of event trends.
NERC | State of Reliability| June 2019
6Chapter 2: Event Analysis Review
Figure 2.6: Summary of 2014–2018 Event Analysis Trends
The number of events with load loss has increased year-to-year as shown in Figure 2.6. The associated load loss
averages by year remain effectively flat over the displayed periods. This demonstrates that, although there were
more load lost events from year-to-year, the order of magnitude of loss remains relatively low and not statistically
significant. Additionally, EAP reporting shows an increase in participating entities starting in 2015, potentially
indicating an increase in the number of load loss events.
The number of Category 1 events is stable over the last five years. Starting in 2016, Category 2b—Complete Loss Of
SCADA, Control or Monitoring Functionality for 30 Minutes or more—was retired. This resulted in future reporting of
EMS-related events being shifted to Category 1h. Additionally, the EAP saw a significant increase in participating
entities from 2015 to 2016, indicating the maturation of the EAP as a potential contributor to the increase in event
counts in general. This shift in future reporting resulted in a step-increase for the Category 1 total event count, which
can be seen in Figure 2.6.
From a Regional perspective, RF had the largest group of events reported in 2018 with 41 events. FRCC, MRO, and
SERC observed the largest total change of reported events from the previous year (see Figure 2.7).
NERC | State of Reliability| June 2019
7Chapter 2: Event Analysis Review
Figure 2.7: Total Events by Regional Entity (2014–2018)
Review of Major Events (Category 3, 4, and 5)
While no Category 4 or 5 events were reported in 2018, Hurricane Florence and Hurricane Michael resulted in
significant customer disruption and damage to the BPS, ultimately resulting in two Category 3 events.
Hurricane Florence made landfall as a NOAA-Category 1 storm on September 14, 2018, near Wrightsville Beach North
Carolina (see Figure 2.8). The hurricane had 2,300 MW in forced outages/derates for the worst part of the storm as
it tracked along portions of the North and South Carolina coasts. The total number of customer outages approached
1.4 million. As many as 50 BPS transmission assets sustained damage/outage, and flooding threatened several
generation sites in the path of the storm. Generation capacity was sufficient for recovery, but damage and disruption
to transmission assets posed a continued problem during the restoration period.
Hurricane Michael made landfall as a NOAA-Category 5 storm on October 10, 2018. Based on the event report, the
hurricane had 575 MW in forced generation outages and wavered between 210 and 500 MW in restricted operation
for one nuclear plant. The total number of customer outages was approximately 1.1 million, far exceeding the
originally estimated 540,000 distribution customers. The storm’s path was from Florida to Virginia, including Georgia
and the Carolinas. The majority of the storm’s damage to the electricity system was on the distribution side; however,
the transmission system sustained outages to numerous 230 kV and 115 kV lines. Generation damage was limited
mainly to renewable solar plants.
NERC | State of Reliability| June 2019
8Chapter 2: Event Analysis Review
Figure 2.8: Path of 2018 Hurricane Michael and Hurricane Florence
2018 Lessons Learned
In support of the industry led EAP, one the ERO‘s primary objectives is to publish lessons learned. In 2018, a total of
15 lessons learned were published, up from 9 in 2017. The lifetime total for publication of lessons learned through
2018 is 149. Topics covered included operations, communications, transmission facilities, and relaying and protection
systems. See Table 2.1 for a list of lessons learned.
Table 2.1: Lessons Learned Published in 2018
LL # Category Title
LL20181203 Bulk-Power System Operations Cascading Analysis Identifies Need for Pre-Contingent Load Shed2
Communications, Transmission Avoiding IROL Exceedances with Rigorous Inspections during
LL20181202
Facilities Commissioning, Consistent IROL Alarms, and Improved Training3
Relaying and Protection
LL20181201 Initiatives to Address and Reduce Misoperations4
Systems
2 Cascading Analysis Identifies Need for Pre-Contingent Load Shed
3 Avoiding IROL Exceedances with Rigorous Inspections during Commissioning, Consistent IROL Alarms, and Improved Training
4 Initiatives to Address and Reduce Misoperations
NERC | State of Reliability| June 2019
9Chapter 2: Event Analysis Review
Table 2.1: Lessons Learned Published in 2018
LL # Category Title
Incorrect Field Modification and RAS Operation Lead to Partial System
LL20181002 Transmission Facilities
Collapse5
LL20181001 Communications Networking Packet Broadcast Storms6
LL20180802 Transmission Facilities Firewall Failure After Time Limit Exceeded7
LL20180801 Communications Loss of Substation Data Circuits to SCADA8
LL20180702 Transmission Facilities Preparing Circuit Breakers for Operation in Cold Weather9
LL20180701 Transmission Facilities Risk of Internet Accessible Cyber Assets10
LL20180603 Communications Back Office EMS Support Tools Impact Real-Time Situational Awareness11
LL20180602 Communications External Model Data Causing State Estimator to Not Converge12
LL20180601 Transmission Facilities Loss of Communication to Multiple SCADA RTUs at a Switching Center13
LL20180302 Transmission Facilities Breaker Failure Due to Trip Coil Polarity14
LL20180301 Communications State Estimator Outages Requiring Tuning/Calibrating EMS Settings15
Inadequate Battery Configuration Management Damaged a Generating
LL20180101 Communications
Station and Tripped an HVDC Conversion Station 16
5 Incorrect Field Modification and RAS Operation Lead to Partial System Collapse
6 Networking Packet Broadcast Storms
7 Firewall Failure After Time Limit Exceeded
8 Loss of Substation Data Circuits to SCADA
9 Preparing Circuit Breakers for Operation in Cold Weather
10 Risk of Internet Accessible Cyber Assets
11 Back Office EMS Support Tools Impact Real-Time Situational Awareness
12 External Model Data Causing State Estimator to Not Converge
13 Loss of Communication to Multiple SCADA RTUs at a Switching Center
14 Breaker Failure Due to Trip Coil Polarity
15 State Estimator Outages Requiring Tuning/Calibrating EMS Settings
16 Inadequate Battery Configuration Management Damaged a Generating Station and Tripped an HVDC Conversion Station
NERC | State of Reliability| June 2019
10Chapter 2: Event Analysis Review
Event Analysis Principles
The information in this report is indicative of the analytical value of studying individual disturbances and events of various
users, owners, and operators. These voluntary programs lead to the publication of lessons learned, technical
alerts/recommendations, technical reports, and technical discourse between industry and the regulator that assist the bulk
power industry as a whole. The following principals are core to the ERO’s mission:
Promoting Reliability
The principal goal of the ERO is to promote the reliability of the BPS in North America. This goal is directly supported by
evaluating qualifying BPS events, undertaking appropriate levels of analysis to determine the causes of the events, promptly
assuring tracking of corrective actions to prevent recurrence, and providing lessons learned to the industry. The EAP also
provides valuable input for training and education, reliability trend analysis efforts, and reliability standards development, all
of which support continued reliability improvement.
Developing a Culture of Reliability Excellence
Through the EAP, the ERO strives to develop a culture of reliability excellence that promotes and rewards aggressive self-
critical review and analysis of operations, planning, and critical infrastructure protection processes. This self-critical focus
must be ongoing, and the industry must recognize that registered entities are linked together by their individual and collective
performances. This focus is the root of understanding the underlying cause of events and avoiding similar or repeated events
through the timely identification and correction of event causes and through the sharing of lessons learned.
Collaboration
Successful Event Analysis depends on a collaborative approach in which registered entities, REs, and NERC work together to
achieve a common goal. The process requires clarity, certainty, and consistent adherence to reliability principles by BPS
owners, operators, and users who perform a wide array of reliability functions.
Being a Learning Organization
As a learning organization, Event Analysis serves an integral function of providing insight and guidance by identifying and
disseminating valuable information to owners, operators, and users of the BPS who enable improved and more reliable
operation. As such, event analysis is one of the pillars of a strong ERO.
NERC Alerts
NERC is responsible for issuing alerts to registered entities and the electricity sector when NERC discovers, identifies,
or is provided with information that is critical to ensuring the reliability of the BPS. One alert was issued in 2018
concerning inverter performance.
NERC ALERT: Loss of Solar Resources during Transmission Disturbances due to Inverter Settings - II
As is well known from the past few years, inverter-based generating resources are becoming more prevalent. These
resources are relatively new and provide new challenges to the inertia-dominated BPS. They require keen attention
from the power system community in North America. In October 2017, a solar generation loss event in the WECC
Region known as the Canyon 2 Wild Fire Event resulted in the publication of a disturbance report (Canyon 2 Fire
Disturbance Report)17 and a NERC alert.18
See the BPS Planning and Adapting to the Changing Resource Mix section for more analysis based on this alert.
Recommendations in the NERC alert included identification of the adverse characteristics of inverter-based
performance during faults, the need for wide-area communication of the characteristics, and recommended actions
concerning fault ride-through and restoration of current injection by all BPS inverter-based resources. The ongoing
collaboration/discussion concerning inverters led to the Event Analysis Subcommittee of the NERC Operating
Committee updating category definitions in the ERO EAP.
17 https://www.nerc.com/pa/rrm/ea/Pages/October-9-2017-Canyon-2-Fire-Disturbance-Report.aspx
18 https://www.nerc.com/pa/rrm/bpsa/Alerts%20DL/NERC_Alert_Loss_of_Solar_Resources_during_Transmission_Disturbance-II_2018.pdf
NERC | State of Reliability| June 2019
11Chapter 3: Reliability Indicators
This chapter provides a summary of the reliability indicators established by the ERO in concert with the Performance
Analysis Subcommittee. Reliability indicators tie the performance of the BPS to a set of reliability performance
objectives defined by NERC. Reliability performance objectives are established and defined using NERC’s definition
of ALR. Each reliability indicator is mapped to a specific performance objective and is then evaluated to determine
whether the actual performance of the system meets the expectations of ALR. Trending is also developed (typically,
a prior five-year historical period), which helps determine whether certain aspects of reliability are improving,
declining, or stable.
A summary and additional details on methods and approaches follows.
Reliability Indicators and Trends
The reliability indicators below represent four core aspects to system performance that are measurable and
quantifiable:
Resource Adequacy: Does the system have enough capacity, energy, and ancillary services?
Transmission Performance and Availability: Is the transmission system adequate?
Generation Performance and Availability: What are the energy limitations of the generation fleet?
System Protection and Disturbance Performance: Can the system remain stable and withstand disturbances?
The reliability indicators presented in this report can precisely describe historical reliability performance; however,
they cannot predict future reliability. Reliability performance and trends of individual metrics should be evaluated
within the context of the entire set of metrics.
Metrics are rated on a four-point color scale:
Green: Improving
White: Stable or no change
Yellow: Monitor
Red: Actionable, may lead to key finding
Table 3.1 shows a summary of the reliability indicators categories and names, the color scale applied, and links to
each indicator’s chapter of details.
Some of the reliability indicators require an extensive statistical analysis to determine whether statistically significant
trends are being observed or whether numerical changes are unchanged within a band of confidence. Where
statistically significant results are observed, NERC uses the following notation:
NERC | State of Reliability| June 2019
12Chapter 3: Reliability Indicators
Table 3.1: Summary of Reliability Indicators
Indicator Indicator Name Brief Description 2018 Performance
Category and Trend Results
BPS Planning and This metric counts the number of times EEA Level 3 Eastern
Adapting to the Alerts are issued for BAs and when actual capacity Interconnection
Changing Resource and/or energy deficiencies occur. Western
Mix
Interconnection
Resource Adequacy
Texas
Interconnection
Quebec
Interconnection
This metric counts the number of areas reporting
“marginal” or “inadequate” reserve margins for Texas RE-ERCOT
Planning Reserve Assessment Area
NERC’s prior year Summer and Winter Reliability
Margin
Assessment.
This metric counts BPS transmission-related events
Transmission-Related
resulting in the loss of load, excluding weather- Transmission
Events Resulting in
related outages. Additional metrics measure the greater than 100kV
Loss of Load
duration and magnitude of the load loss.
Protection System
This series of metrics measure the impacts of Failed
Transmission Performance and Availability
Human Error
Protection System, Human Error, Failed AC
Automatic AC
Substation Equipment, and Failed AC Element AC Substation
Transmission Outages
Equipment as factors in the performance of the Equipment
transmission system.
AC Circuit
Equipment
Protection System
This series of metrics measure the impacts of Failed
Automatic AC Protection System, Human Error, and Failed AC
Human Error
Transformer Outages Substation Equipment as factors in the performance
of the transformer fleet. AC Substation
Equipment
AC Circuits
This metric determines the percentage of BES ac
transmission elements that are unavailable when
Element Unavailability outages due to automatic and nonautomatic events
are considered. Planned outages are not included in Transformers
the unavailability values.
NERC | State of Reliability| June 2019
13Chapter 3: Reliability Indicators
Table 3.1: Summary of Reliability Indicators
Indicator Indicator Name Brief Description 2018 Performance
Category and Trend Results
Performance
Generation
Availability
Weighted-Equivalent This metric measures the rated probability that a Conventional
and
Generation Forced unit will not be available to deliver its full capacity at Generation greater
Outage Rate any given time due to forced outages and derates. than 20 MW
Eastern
Interconnection
This metric determines frequency response trends Western
for each Interconnection so that adequate primary Interconnection
Interconnection
frequency control is provided to arrest and stabilize
Frequency Response Texas
frequency during frequency excursions of a
predefined magnitude. Interconnection
System Protection and Disturbance Performance
Quebec
Interconnection
This metric measures the ability of a balancing entity
to balance resources and demand following
Disturbance Control reportable disturbances. The results help measure Disturbance
Standard Failures and the risk the system is exposed to during extreme Recovery Period
Events Greater than contingencies, how often they occur, and
MSSC disturbance performance.
This metric evaluates the performance of protection
systems—both generator and transmission. The
Protection System BES Protection
metric is the ratio of protection system
Misoperations Systems
misoperations to total system protection system
operations.
Expanded Eastern
This metric measures the number and the duration Interconnection
Interconnection
an IROL is exceeded. An IROL is a system operating Western
Reliability Operating
limit (SOL) that, if violated, could lead to instability, Interconnection
Limit Exceedances
uncontrolled separation, or cascading outages. Texas
Interconnection
NERC | State of Reliability| June 2019
14Chapter 3: Reliability Indicators
Energy Emergency Alerts
This metric counts the number of times Energy Emergency Alerts (EEA) Level 3 Alerts are issued for Balancing
Authorities (BAs) and when actual capacity and/or energy deficiencies occur (see Figures 3.1 and 3.2).
Figure 3.1: Number of EEA Level 3 Alerts by Interconnection, 2006–2018
Figure 3.2: 2018 EEAs by Interconnection
2018 Performance and Trends
In 2018, 17 EEA Level 3 Alerts were declared, 11 more than the previous year. Some increase in EEA Level 3 Alerts
can be attributed to the new EOP-011-1 that consolidated requirements from three standards: EOP-001-2.1b, EOP-
002-3.1, and EOP-003-2. EOP-011-1 became effective April 4, 2017. For some Reliability Coordinators (RCs), the ability
to access more resources from neighboring facilities now require an EEA to be initiated, which effectively has led to
a lower activation threshold than what was in place historically. Therefore, more EEA Level 3 Alerts were expected.
The 17 EEA Level 3 Alerts declared lasted a total of 60.3 hours. The largest load loss associated with an EEA Level 3
was 675 MW and consisted of UFLS activation, manual firm load shedding action, and interruptible load curtailment
NERC | State of Reliability| June 2019
15Chapter 3: Reliability Indicators
actions in Nova Scotia on November 11, 2018, over a seven-hour period. Of the 11 EEA Level 3 Alerts in the Eastern
Interconnection, there were 9 in the SaskPower RC area, none of which led to firm load shedding. There have been
no EEA Level 3 Alerts in the Quebec Interconnection, and only one in the Texas Interconnection in 2011.
Description
To ensure that all RCs clearly understand potential and actual energy emergencies in the Interconnection, NERC has
established three levels of EEAs. This metric measures the duration and number of times EEAs of all levels are issued
and when firm load is interrupted due to an EEA Level 3 declaration. EEA Level 3 declarations indicate that firm load
interruption is imminent or in progress due to the inability of meeting minimum contingency reserve requirements.
However, not all EEA Level 3 Alerts lead to an operator-controlled firm load interruption.
Purpose
EEA trends may provide an indication of BPS capacity, energy, and transmission sufficiency. This metric may also
provide benefits to the industry when considering correlations between EEA events and Planning Reserve Margins.
When an EEA Level 3 alert is issued, firm-load interruptions are imminent or in progress. The issuance of an EEA Level
3 is due to a lack of available generation or when resources cannot be scheduled due to transmission constraints.
This Indicator Answers the Following Questions:
How often is the BPS in an energy emergency condition?
What areas are experiencing the most energy emergency conditions?
Definition and Calculation
This metric counts the number of EEA Level 3 declarations.
Rating
Red (actionable): Year over year count increase and continues to be above the five-year average.
Yellow (monitor): Year over year count increase and first year that it is above the five-year average.
White (stable): Reporting year over year count is no change and is less than five-year average.
Green (good/improving): Year over year count improvement and less than the five-year average or zero.
Source, Assumptions, and Limitations
NERC collects data from RCs when an EEA is declared.
Metric Worksheet19
NERC Reliability Standard EOP-011-120
Planning Reserve Margin
This metric counts the number of areas reporting
“marginal” or “inadequate” reserve margins for Texas RE-ERCOT: Large Assessment Area
NERC’s prior year Summer and Winter Reliability 2018 Anticipated Reserve Margin: 10.53%
Assessment (see Figure 3.3). Amount Needed to Meet Reference Margin Level: 2,345 MW
19
https://www.nerc.com/comm/PC/Performance%20Analysis%20Subcommittee%20PAS%202013/ALR6-2_clean.pdf
20
https://www.nerc.com/pa/Stand/Reliability%20Standards/EOP-011-1.pdf
NERC | State of Reliability| June 2019
16Chapter 3: Reliability Indicators
Figure 3.3: 2018 Summer Peak Planning Reserve Margins (Anticipated and Prospective
Reserve Margins)
2018 Performance and Trends
In 2018, the Texas RE-ERCOT assessment area reported its reserve margin assessments to the ERO, and it was
determined by the ERO’s Reliability Assessment Process to be “Inadequate” for the 2018 summer peak.
Despite setting a new system-wide peak demand record of 73,308 MW on July 19, 2018, higher than average
performance from wind generation contributed to high reliability performance and firm load shedding was not
needed. This is more than 2,000 MW higher than the previous system-wide record set in August 2016.21
Description
This metric counts the number of areas reporting “adequate,” “marginal,” or “inadequate” Planning Reserve Margins
for the 2018 summer and 2018/19 winter. NERC assesses resource adequacy by evaluating each assessment area’s
planning reserve margins relative to its Reference Margin Level. On the basis of the five-year projected reserves,
NERC determines the risk associated using the following framework:
Adequate: Anticipated Reserve Margin is greater than Reference Margin Level and there is a high degree of
expectation in meeting all forecast parameters.
Marginal: Anticipated Reserve Margin is greater than Reference Margin Level and there is a low degree of
expectation in meeting all forecast parameters, or the Anticipated Reserve Margin is slightly below the
Reference Margin Level and additional and sufficient Tier 2 resources are projected.
Inadequate: Anticipated Reserve Margin is less than the Reference Margin Level; load interruption is likely.
Purpose
To determine how many areas and to what extent capacity deficiencies can be expected. Planning Reserve Margins
cannot precisely predict capacity deficiencies, but areas below the Reference Margin Level indicate a higher
probability of a capacity deficiency occurring than the desired target of 1-day-in-10.
21
http://www.ercot.com/content/wcm/lists/144927/2018_Summer_Performance_One_Pager_FINAL.pdf
NERC | State of Reliability| June 2019
17You can also read