Author's personal copy - arXiv
←
→
Page content transcription
If your browser does not render page correctly, please read the page content below
Author's personal copy
Empirical Software Engineering (2019) 24:854–901
https://doi.org/10.1007/s10664-018-9642-5

An empirical assessment of best-answer prediction models
in technical Q&A sites

Fabio Calefato 1                              2
                       & Filippo Lanubile & Nicole Novielli
                                                               2

Abstract
Technical Q&A sites have become essential for software engineers as they constantly seek
help from other experts to solve their work problems. Despite their success, many questions
remain unresolved, sometimes because the asker does not acknowledge any helpful answer. In
these cases, an information seeker can only browse all the answers within a question thread to
assess their quality as potential solutions. We approach this time-consuming problem as a
binary-classification task where a best-answer prediction model is built to identify the accepted
answer among those within a resolved question thread, and the candidate solutions to those
questions that have received answers but are still unresolved. In this paper, we report on a
study aimed at assessing 26 best-answer prediction models in two steps. First, we study how
models perform when predicting best answers in Stack Overflow, the most popular Q&A site
for software engineers. Then, we assess performance in a cross-platform setting where the
prediction models are trained on Stack Overflow and tested on other technical Q&A sites. Our
findings show that the choice of the classifier and automatied parameter tuning have a large
impact on the prediction of the best answer. We also demonstrate that our approach to the best-
answer prediction problem is generalizable across technical Q&A sites. Finally, we provide
practical recommendations to Q&A platform designers to curate and preserve the
crowdsourced knowledge shared through these sites.

Keywords Cross-platform prediction . Q&a . Stack overflow . Crowdsourcing . Knowledge
sharing . Imbalanced datasets

Communicated by: David Lo

* Fabio Calefato
  fabio.calefato@uniba.it

    Filippo Lanubile
    filippo.lanubile@uniba.it
    Nicole Novielli
    nicole.novielli@uniba.it

1
    Dipartimento Jonico, University of Bari BA. Moro^, via Duomo, 259, -74123 Taranto, Italy
2
    Dipartimento di Infomatica, University of Bari BA. Moro^, via E. Orabona, 4 -, 70125 Bari, Italy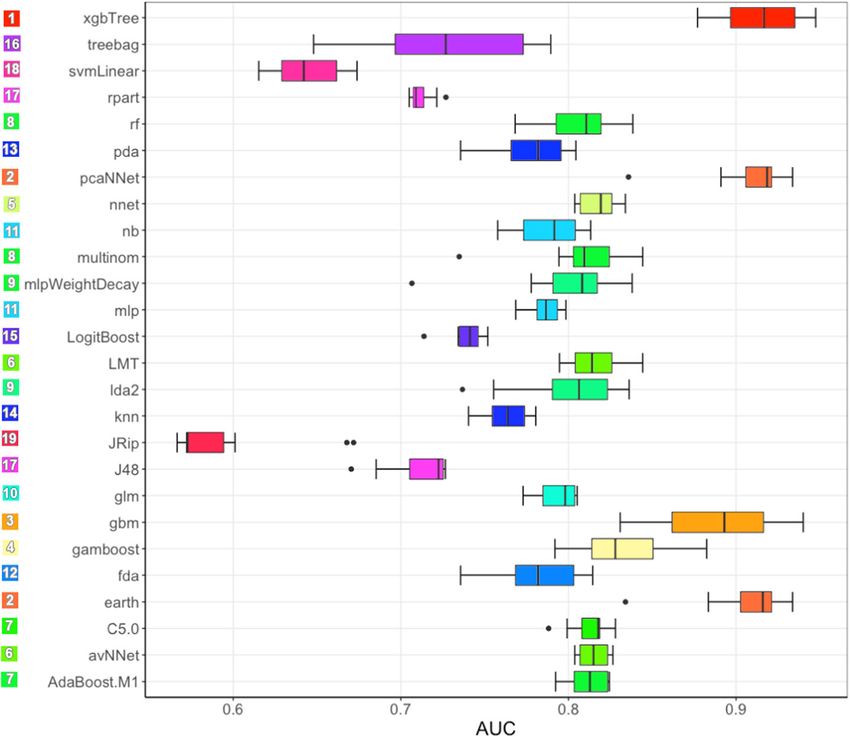
Author's personal copy
Empirical Software Engineering (2019) 24:854–901                                             855

1 Introduction

As projects grow in complexity, software developers seek information and technical support
from experts outside their inner circles (Squire 2015). This trend has been steadily increasing
over the years, at first through mailing lists, then through web-based discussion forums,
leading in the last decade to the success of community-based, question-and-answer (Q&A)
sites. Stack Overflow is the most popular technical Q&A site and represents the platform of
choice when programmers need to ask for technical help.1 Because of its impact, it is
fundamental that this huge amount of crowdsourced knowledge remains well curated.
    Technical Q&A sites have had a profound impact on the way programmers seek and
provide knowledge (Vasilescu et al. 2014; Abdalkareem et al. 2017). To make the process of
knowledge building sustainable, modern Q&A sites rely on gamification features, such as
collaborative voting and badges, which motivate experts to quickly answer questions in
exchange for visibility and reputation gain within the community (Mamykina et al. 2011).
However, the very distinguishing feature of modern Q&A sites is the best answer annotation,
that is, letting askers mark one answer as the accepted solution to their help request. This
feature ensures that best answers surface to the top and become an asset for those seeking a
solution to the same problem in the future (Anderson et al. 2012).
    Despite its success, one of the greatest issues with Stack Overflow is question starvation
(Nie et al. 2017), that is, the existence of question threads without an accepted solution. As of
this writing, about 7 million questions (~50%) are still unresolved, albeit most of them (about
4.7 M, ~70%) are provided with answers. In such cases, software engineers need help to assess
the quality of all the answers within a question thread to identify the potential solutions. We
approach this problem as a binary-classification task where a best-answer prediction model is
built to identify the best answers within question threads (Adamic et al. 2008). In real usage
scenarios, for questions that have been resolved, the model would predict whether each answer
has been marked or not as the actual accepted solution by the asker; instead, for unresolved
questions, given the absence of an accepted solution, the same model would predict whether
each answer is a potential solution – that is, one that might work for information seekers, even
though it has not been marked as accepted. In fact, it is not uncommon for users, especially
novices, to forget marking valid answers as a solution (Calefato et al. 2015).
    Furthermore, Stack Overflow helps users assess the quality of answers to unresolved
questions by sorting answers according to upvote and moving those with the largest scores
to the top of the thread. However, one issue of vote-ordering is that the answers entered last,
even when of high quality, tend to receive few or no upvotes and thus stay at the bottom of the
thread; instead, the first ones keep receiving upvotes, benefiting from the Matthew effect of
accumulated advantage (Mamykina et al. 2011; Roy et al. 2017) and, thus, remain on top. This
issue of preferential attachment calls for the development of prediction models that suggest
potential solutions to information seekers not exclusively based on the number of answer
upvotes. Besides, given the sheer volume of posts already hosted at Stack Overflow and the
growth rate of ~6 K new questions and ~8.5 K new answers posted per day over the last year,2
we argue that models focusing on features that are computationally intensive have limited
practical value.

1
    http://stackoverflow.com/research/developer-survey-2016
2
    http://data.stackexchange.com/stackoverflow/query/759408/daily-posts-in-2016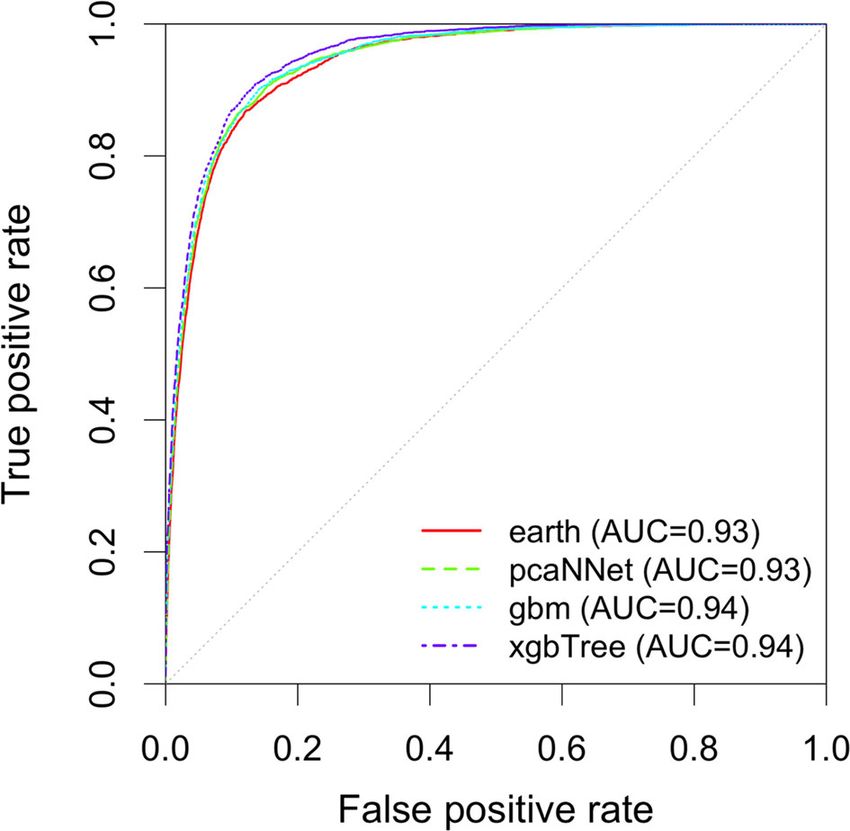
Author's personal copy
856                                                   Empirical Software Engineering (2019) 24:854–901

    Because there is at most one best answer in a question thread, in any dataset, there are
intrinsically fewer best answers (minority class) than non-accepted answers (majority class).
This problem, which is referred to as class imbalance (He and Garcia 2009), is a fundamental
issue of classification tasks because it can significantly compromise both the performance of
learning algorithms and the reliability of assessment metrics. Besides, Japkowicz and Stephen
(2002) observed that class imbalance is a ‘relative problem’ that depends on contextual factors
such as the degree of imbalance, the size of the datasets, and the classifiers involved. Previous
studies on best-answer prediction have overlooked the problem of learning from imbalanced
datasets (Adamic et al. 2008; Burel et al. 2012; Shah and Pomerantz 2010; Tian et al. 2013).
Furthermore, they do not encourage the cross-comparison of results as they apply different,
sometimes inadequate, performance measures.

Research Questions In this paper, we aim to identify the most effective approach for
predicting best answers in technical Q&A sites, while also focusing on selecting features that
are computationally inexpensive. Given the imbalanced dataset problem, we review prior work
on binary classification to select and use adequate metrics for a reliable assessment of the
performance of best-answer prediction models.
   To investigate the problem of best-answer prediction, we first focus on Stack Overflow, as it
includes the largest amount of crowd-assessed best answers. Specifically, we choose Stack
Overflow as the training set and we investigate to what extent classifiers can predict best
answers when trained and tested on the Stack Overflow site. Thus, we formulate the first
research question as follows:

       RQ1: How do classifiers perform for best-answer prediction within Stack Overflow?

Stack Overflow, however, is not the only venue for requesting technical help. There are other
Q&A platforms where developers ask for help about development in general (e.g., Program-
ming & Design category in Yahoo! Answer)3 or for specific products (e.g., SAP Community
Network).4 Furthermore, lots of crowdsourced knowledge is available in legacy developer-
support tools, such as web forums and mailing lists, where developers typically used to seek
for help before the advent of modern Q&A platforms. The benefit of best-answer prediction is
even larger for web forums as they typically lack the features for marking an answer as
accepted and moving it on top of the thread, thus potentially saving developers from the effort
of looking into each answer of a thread to assess which solution is the one working.
Accordingly, we investigate how classification models trained on Stack Overflow can predict
best answers in other developer-support Q&A sites, including both legacy web forums and
modern Q&A platforms. Web forums are included because of their relevance, since they lack
the feature of marking best answers, whereas Q&A platforms are included for assessing to a
larger extent the generalizability and robustness of the cross-prediction model. Therefore, we
define our second research question as follows:

       RQ2: How do classifiers perform for cross-platform best-answer prediction?

3
    https://answers.yahoo.com
4
    http://scn.sap.com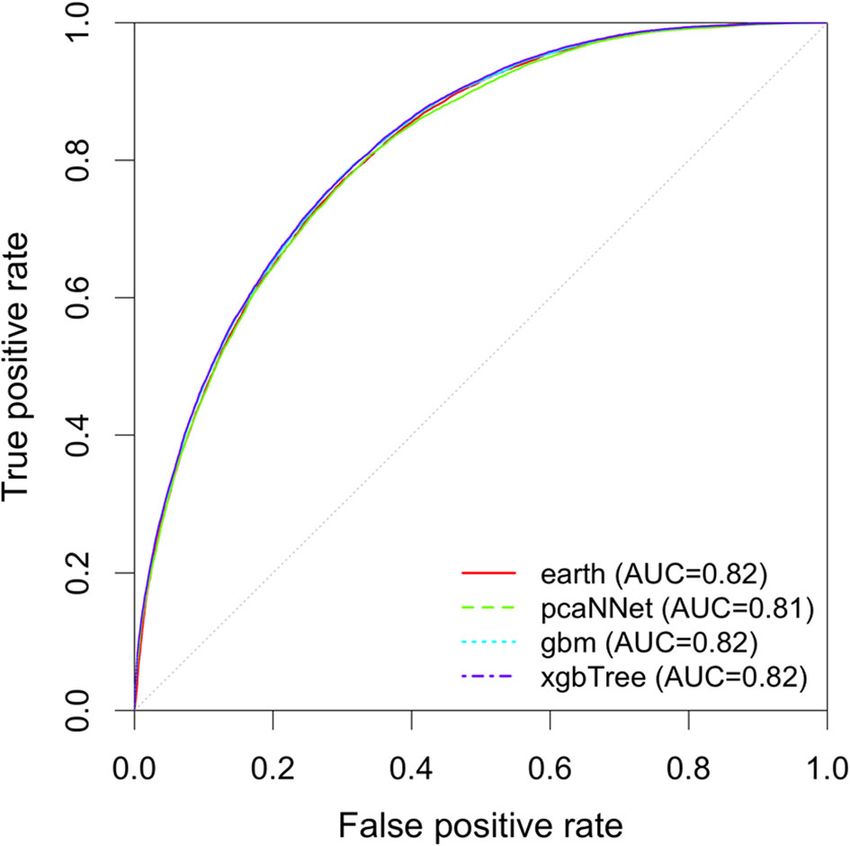
Author's personal copy
Empirical Software Engineering (2019) 24:854–901                                               857

We build our methodology upon studies based on imbalanced datasets. Due to the limited
amount of research on best-answer prediction, we also define the methodology based on
previous work on software defect prediction, which studied prediction models in cross-context
settings, that is, across projects and companies (Turhan et al. 2009; Zimmermann et al. 2009).
Then, we conduct a study in two stages, one for each of the two research questions. All the
datasets and scripts used in this study are made publicly available.5
    From the results of our study, we observe that:

1. There is a clear difference in performance among classification techniques, with perfor-
   mance improvements by over 40 percentage points in terms of AUC – i.e., the choice of
   the classifier and its parameter configuration has a significant and large impact on the
   performance of the best-answer prediction model to build.
2. The performance of models in the cross-platform setting is above the trivial rejector
   baseline and is comparable to the upper-bound performance achieved by training the
   same prediction models in a within-platform setting on all the test sets – i.e., our approach
   to the best-answer prediction problem is generalizable across technical Q&A sites.

Contributions This study extends our earlier work (Calefato et al. 2016) in which we assessed
only 4 classifiers, all from the family of decisions trees. Furthermore, in this work, we provide
a more robust empirical evaluation including automated parameter tuning, feature selection,
and, finally, employing performance metrics adequate in case of class imbalance. A more
detailed comparison is available in Section 7 – Related work.
    From a research perspective, this is – to the best of our knowledge – the first study on best-
answer prediction that (i) analyzes the performance of multiple classifiers in a cross-context
setting, where models are trained and tested on corpora from different technical Q&A
platforms, and (ii) uses a systematic approach to deal with the problem of class imbalance.
    Because we rely on training and test sets that come from entirely distinct data sources, our
findings gain in robustness and generalizability. As such, another research contribution is the
identification of computationally inexpensive features that are essential for best-answer pre-
diction in both modern and legacy platforms, rather than accidental because specific of one
technical Q&A site. Besides, most prior studies (i) built models using one classification
technique only, (ii) failed to visually assess differences by plotting performance curves, and
(iii) reported performance by single scalar measures that are unstable and sensitive to dataset
imbalance. These limitations not only prevent a proper comparison with our study findings
but, more in general, they also reduce the possibility of replicating experiments on best-answer
prediction. Therefore, as a further research contribution, in this paper, we build a reliable
benchmark for best-answer prediction studies, with recommended measures and data from five
different datasets, which sets an initial ‘baseline’ for the evaluation of future research efforts.
    From a practical perspective, this research furthers the state of practice by providing
solutions to some recurring problems such as (i) the numerous question threads that remain
unresolved in technical Q&A sites, (ii) ensuring the quality of the crowdsourced knowledge
stored therein, and (iii) the loss of knowledge caused by the phenomenon of developer-support
communities migrating from legacy forums to modern Q&A sites. In fact, as of this writing,
the entire Stack Overflow site hosts over 14 million questions of which only about 7 million
are provided with an accepted answer. Those unresolved, however, are not just ‘stale’

5
    https://github.com/collab-uniba/emse_best-answer-prediction
Author's personal copy
858 Empirical Software Engineering (2019) 24:854–901
questions asked many years ago: almost 4 million questions asked on Stack Overflow in the
last 2.5 years are still left open. Sometimes, questions are not closed because no good answer
was provided; other times, it is just because the asker did not take any action, albeit in presence
of useful answers. Yet, in every thread, there are some answers that are better than the others.
Finding good answers is even worse when threads are popular because it forces developers
seeking a solution to go through all the responses just relying on the number of upvotes as a
proxy measure of their quality. Q&A sites might implement a recommender system that
leverages our approach to highlight potential solutions when users browse unresolved ques-
tions without an accepted solution, as a preliminary step towards identifying and marking the
resolving answer. Besides, because the used features are not computationally expensive,
recommendations could be computed and updated on the fly, ensuring that also high-quality,
newly-entered answers have fair chances to be recommended against the first and most
upvoted ones. More in general, by implementing our solution, Q&A platforms would ensure
that unresolved questions become a more useful source of information to developers seeking
for technical help.
Another practical contribution is related to the importance of ensuring that the huge amount
of crowdsourced knowledge stored in Q&A sites is well curated. In fact, software developers
typically need knowledge that goes beyond what they already possess and, therefore, they
must seek further information (Shaw 2016). Anderson et al. (2012) have observed a shift in the
purpose of these Q&A sites. While initially aimed at quickly providing solutions to informa-
tion seekers’ needs, modern Q&A sites have now become platforms supporting the creative
process of community-driven knowledge with a long-term value to a broader audience. For
example, Parnin et al. (2012) observed that questions and answers contributed on Stack
Overflow covered about the 87% of the Android API classes. As such, it is fundamental to
information seekers that this huge amount of crowdsourced knowledge available through
modern Q&A sites is well curated – also from an educational perspective, considering that
most of the software developers using Stack Overflow (~70%) report to be at least partly self-
taught (Stack Overflow Developer Survey 2016).
Finally, a side effect of the Stack Overflow popularity is the growing trend of developer
communities that are abandoning their legacy support forums over Stack Overflow, seeking
more visibility, larger audience, and faster response times. Despite the evident benefits of
moving to a modern and very successful infrastructure, one consequent downside is that the
history and the crowdsourced knowledge generated through these legacy forums is at stake of
being lost. For instance, based on the analysis of 21 developer support communities that
moved from legacy sites to Stack Overflow between 2011 and 2014 (Calefato et al. 2016), we
found that about 20% of them had not archived their content, thus causing a loss of knowledge
that still surfaced in Google searches but turned out to be actually inaccessible. Moving the
content of a legacy forum to a modern Q&A site would not only preserve all that
crowdsourced knowledge but also increase its long-term value. Our research has the potential
of assisting in the migration of the content from a legacy developer forum to a modern Q&A
platform because the former typically lacks the feature of marking an answer in a thread as the
accepted solution. Therefore, our research can help identify the candidate solutions in the
entire history of question threads to be imported into the modern Q&A site of choice. To date,
none of the available modern Q&A platforms allows importing existing content from other
sources. Also, the migration of content comes with other challenges, such as coping with
different community cultures and user identities. Some initial work has been performed by
Vasilescu et al. (2014) who investigated how to match the identities of the R-help communityAuthor's personal copy
Empirical Software Engineering (2019) 24:854–901 859
members after the migration onto the Stack Overflow and Cross Validated Q&A sites from the
original mailing list. Here, instead, we demonstrate the technical feasibility of content migra-
tion from legacy to modern Q&A platforms. Finally, our research has also the potential to help
companies that want to run a private version of Stack Overflow6 without having to lose the
existing base of knowledge or maintain it elsewhere.
Structure of the Paper The remainder of this paper is organized as follows. In Section 2, we
outline the methodology for this study. In Sections 3 and 4, respectively, we illustrate the
datasets and the features extracted. Then, we illustrate the study settings and the findings,
respectively in Section 5 and 6. In Section 7, we review previous work on best-answer
prediction and discuss our findings. Study limitations are presented in Section 8 and conclu-
sions are drawn in Section 9.
2 Methodology
In this section, we define the methodology that we followed to perform the empirical study on
best-answer prediction. Our goal is to identify the adequate solutions and metrics to assess the
performance of best-answer prediction models, trained and tested on imbalanced datasets from
different Q&A platforms.
2.1 Prediction Models
The problem of using prediction models to identify best answers in technical Q&A sites is
relatively new. Nonetheless, research in software engineering has already been using predic-
tion models for decades, especially to identify defective code (Arisholm et al. 2010; Catal and
Diri 2009). To do so, historical project data about known bugs are used to train binary
classification models that are then used to classify unseen software modules as defective or
not (Menzies et al. 2010).
Because most of the standard learning algorithms assume a balanced training set, imbal-
anced datasets may generate suboptimal classification models that provide a good coverage of
the majority examples, whereas the minority ones are frequently misclassified if not complete-
ly discarded as noise (He and Garcia 2009; Lopez et al. 2013). Besides, learning algorithms are
often built to maximize metrics such as Accuracy, which is not the most appropriate perfor-
mance measure for imbalanced problems (see Section 2.3) (Lemnaru and Potolea 2011). In
recent years, ensembles of classifiers have arisen as a possible solution to the class imbalance
problem (Lopez et al. 2013). Ensemble learners, also known as multiple classifier systems, try
to improve the performance of single classifiers by inducing several classifiers and combining
them to obtain a new classifier that outperforms every one of them (Polikar 2006). These
approaches have shown to be very accurate. The downsides are the increased learning time and
difficulty in comprehending the output model.
The techniques reported in Table 1 include the most-used classifiers for software defect
prediction according to a systematic review by Malhotra (2015). In another recent literature
review, Wahono (2015) found that these classifiers account for over the 75% of the identified
primary studies. Finally, the 8 classification techniques listed in Table 1 mostly cover those
6
https://business.stackoverflow.com/enterpriseAuthor's personal copy
860 Empirical Software Engineering (2019) 24:854–901
Table 1 A breakdown of the most used classifiers and techniques employed in defect prediction studies
Technique Classifier
Regression-based Logistic Regression
Bayesian Naïve Bayes
Nearest Neighbors K-Nearest Neighbors
Decision Trees C4.5 / J48
Support Vector Machines Sequential Minimal Optimization
Neural Networks Radial Basis Functions
Ensemble (Bagging) Random Forests
Ensemble(Boosting) Adaptive Boosting
investigated by Lessmann et al. (2008) in their seminal study for benchmarking defect
prediction classifiers.
In this study, we assess 26 classifiers overall. To select them, we started from the 8 most
used classifiers reported in Table 1. Then, we extended the set with the classifiers employed for
software defect prediction in a recent study by Tantithamthavorn et al. (2016), who studied the
effects of leaners selection on classification performance – a scenario similar to our intended
assessment of best-answer prediction models. The complete list of the classifiers employed in
this study is given later in Section 5 (see Table 7).
Because performance differences can be large, previous research recommends the inclusion
of a preliminary assessment of various classification algorithms, as a former step before
selecting the most appropriate for the given context (D’Ambros et al. 2012; Denaro and Pezzè
2002; Ghotra et al. 2015). However, no general consensus exists about any specific framework
to apply for the assessment of model performance (Demsar 2006; Lessmann et al. 2008; Jiang
et al. 2008a; Zhang and Zhang 2007). Recently, Ghotra et al. (2015) have suggested an
analysis procedure based on the Scott-Knott test (Scott and Knott 1974) to find statistically
distinct clusters of classification techniques. The Scott-Knott test is a mean-comparison
approach that uses hierarchical cluster analysis to recursively partition a set of treatment means
(e.g., means of model performance) into groups until they can no longer be split into further,
statistically-distinct groups. This test overcomes the confounding issue of overlapping groups
affecting other clustering algorithms such as the Nemenyi post hoc test (Ghotra et al. 2015). By
overlapping we mean the possibility for one or more treatments to be classified in more than
one group. Furthermore, the Scott-Knott test is also capable of coping with normal and non-
normal distributions (Borges and Ferreira 2003). Recently, Tantithamthavorn et al. (2017) have
recommended using the Scott-Knott ESD (Effect Size Difference), an enhancement over the
standard Scott-Knott test, which uses Cohen’s effect size to partition groups and ensure that (i)
the magnitude of the difference for all of the treatments in each group is negligible and (ii) the
magnitude of the difference of treatments between groups is non-negligible.
We apply the Scott-Knott ESD test to compare the performance of 26 classifiers.
For projects that are new or just lack historical data on which to build defect-prediction
models, researchers have proposed cross-project defect prediction, that is, reusing models
built on datasets from other projects (Nam and Kim 2015). Previous research has shown that,
albeit viable (Kitchenham et al. 2007), cross-project defect prediction is a real challenge,
especially if conducted on projects from different companies (Turhan et al. 2009). In particular,
the conditions under which it is effective are still not entirely clear (Kitchenham et al. 2007). InAuthor's personal copy
Empirical Software Engineering (2019) 24:854–901 861
their study on over 600 cross-project predictions, Zimmermann et al. (2009) observed that
simply using datasets from projects within the same domain does not always work to build
effective models. Instead, they observed that prediction models perform better when (i)
datasets from projects with similar characteristics are used (e.g., both open source, same size
and domain, etc.) and (ii) they are trained on a project dataset that is larger than the target.
The two research questions defined are already in line with the recommendations above. As
further illustrated in Section 3, we use Stack Overflow (i.e., the largest Q&A site) as the
training set for building a best-answer prediction model that is fit to the data collected from
different technical Q&A platforms, both modern and legacy.
2.2 Parameter tuning and feature selection
Tuning parameters in classifiers is important because it changes the heuristics determining how
they learn. For example, it controls the number of decision trees to use in Random Forest or the
number of clusters in K-Nearest Neighbors (KNN). Research on software defect prediction has
widely acknowledged that models trained with suboptimal parameter settings may
underperform as parameter settings depend on the dataset (Hall et al. 2012; Jiang et al.
2008b; Mende and Koschke 2009; Tosun and Bener 2009). Furthermore, Ghotra et al.
(2015) found that without parameter tuning, most classification techniques produce models
whose performances are statistically indistinguishable. Nonetheless, parameters are often left
at their default values, even though the implementations of the classifiers provided by data
mining toolkits such as R,7 Weka,8 and scikit-learn,9 typically use very different default
settings. Therefore, relying on default parameter is a common issue that severely limits the
replicability of classification experiments (Menzies and Shepperd 2012).
Manual tuning has been so far impractical (Bergstra and Bengio 2012). For example,
Kocaguneli et al. (2012) found that there are about 17,000 possible setting combinations to
explore for the KNN classifier. However, Fu et al. (2016) have recently developed a technique
for automated parameter tuning, which avoids the need to explore all the possible combina-
tions. They found that parameter tuning (i) only takes a low number of evaluations (usually
tens) to identify the optimal setting; (ii) it improves predicting performance up to 60%; (iii) it
changes what features are the most important to the prediction; and (iv) it is heavily dataset-
dependent. These findings have been confirmed by Tantithamthavorn et al. (2016), who
performed a similar study of the effect of automated parameter tuning for a couple of dozens
of classifiers. In addition, they observed an increase in stability of classification performance,
especially for cross-project defect prediction.
We perform automated parameter tuning to optimize performance when building best-
answer prediction models.
Fu et al. (2016) have also observed that different subsets of relevant features are selected when
parameters are tuned. This is because parameter tuning changes how classification algorithms
explore the space of possible models; therefore, if the exploration process is modified, so are
the features found by it. Among the techniques available for feature selection, Menzies (2016)
7
https://www.r-project.org
8
http://www.cs.waikato.ac.nz/ml/weka
9
http://scikit-learn.orgAuthor's personal copy
862 Empirical Software Engineering (2019) 24:854–901
recommends wrapper-based feature selection methods. Wrapper methods consider feature
selection as a search problem where multiple models are evaluated using procedures that
add and/or remove predictors to find the optimal combination that maximizes model perfor-
mance. In essence, wrapper methods are search algorithms that treat predictors as the inputs
and model performance as the output to be optimized (Karegowda et al. 2010). Albeit wrapper
methods generally achieve good performance, they are also expensive for large datasets in
terms of computational complexity and time since each feature combination must be evaluated
with the algorithm used.
We perform wrapper-based feature selection to identify the set of most relevant
features for best-answer prediction.
2.3 Evaluation criteria
When learning from imbalanced datasets, the evaluation of classification performance must be
carried out using specific metrics to consider the class distribution and properly assess the
effectiveness of learning algorithms. Therefore, the selection of the evaluation criteria here is a
key factor for a reliable assessment of the classification performance of prediction models.
In a binary classification problem like best-answer prediction, a confusion matrix (or
contingency table, see Table 2) records the results of correctly and incorrectly recognized
examples of each class. From a confusion matrix, we can obtain several metrics (see Table 3)
for the classification performance of both positive and negative classes independently. In the
following, we review several performance metrics and select the most adequate to our study
setting.
Traditionally, the machine learning community has used the scalar measures of prediction
Accuracy (PA) and Error rate (E = 1 − PA) as simple performance metrics for binary classifi-
cation problems (see Table 3). However, neither Accuracy nor Error rate is able to provide
adequate information about a classifier performance in the framework of imbalanced datasets
(Provost et al. 1998; Ringrose and Hand 1997). In fact, due to the way they are defined, they
cannot distinguish between the number of correctly classified examples of different classes
(Yang and Liu 1999). As such, being highly sensitive to changes in data, they may lead to
erroneous conclusions (He and Garcia 2009). For example, a rejector that classifies all
instances as negatives may paradoxically achieve an accuracy of 90% in a dataset with a ratio
of 1:9 between the two classes in the dataset, and possibly outperform all nontrivial classifiers.
Precision is better able to capture the effect on a classifier performance of having a larger
number of negative examples (Davis and Goadrich 2006). Nonetheless, Precision is still
sensitive to changes in data distribution and it cannot assert how many positive examples
are classified incorrectly (He and Garcia 2009). Furthermore, Menzies et al. (2007) found that
Table 2 Confusion matrix for a two-class problem
Prediction
Positive Negative
Actual Positive True Positives (TP) False Negatives (FN)
Negative False Positives (FP) True Negatives (TN)Author's personal copy
Empirical Software Engineering (2019) 24:854–901 863
Table 3 Performance metrics for binary classification problems obtained from confusion matrix
Metrics (synonyms) Definition Description
Accuracy TPþTN
Acc ¼ TPþFNþFPþTN Proportion of correctly classified instances
Error rate E = 1 − Acc Proportion of incorrectly classified instances
Precision TP
P ¼ TPþFP Proportion of instances correctly classified
(Positive Predicted Values) as positive
TP
Recall R ¼ T Prate ¼ TPþFN Proportion of positive instances correctly
(Probability of Detection, classified
True Positive rate,
Sensitivity)
F-measure F ¼ 2 P#R
PþR
Harmonic mean of Precision and Recall
(F1-score)
True Negative rate T N rate ¼ TNTN
þFP
Proportion of negative instances correctly
(Specificity) pffiffiffiffiffiffiffiffiffiffiffiffiffiffiffiffiffiffiffiffiffiffiffiffiffiffiffiffiffiffi classified
G-mean G ¼ T Prate # T N rate Geometric mean of True Positive rate and
True Negative rate
False Positive rate FP
FPrate ¼ FPþTN Proportion of negative instances misclassified
(Probability of False Alarm)
þ∞ " #
AUC AUC ¼ ∫−∞ RðT Þ −FPrate ðT Þ dT The area under the graphical plot of Recall
0
(AUCROC) vs. FPrate for a binary classifier as its
pffiffiffiffiffiffiffiffiffiffiffiffiffiffiffiffiffiffiffiffiffiffiffiffiffiffiffiffi discrimination, cutoff threshold is varied
Balance ð0−FPrate Þ2 þð1−RÞ2 Euclidean distance from the point (FPrate, R)
Bal ¼ 1− pffiffi
2 of the ROC curve from the point
(FPrate = 0, R = 1), representing the
perfect classifier in the ROC space
Positive class = TP + FN and Negative class = FP + TN
Precision has instability issues, i.e., large standard deviations when coping with skewed class
distributions, which make it very difficult to show that a classifier outperforms another in its
sole terms. Unlike Precision, Recall is not sensitive to data distribution. However, any
assessment based solely on Recall would be inadequate, as it provides no insight of how
many examples are incorrectly classified as positives.
None of these scalar metrics can provide a reliable assessment of classification performance
when used by itself. Nonetheless, these individual scalar metrics can be combined to build
more reliable measures of classification performance, especially in imbalanced scenarios (Liu
et al. 2006). Specifically, these aggregated metrics of performance (see Table 3) include F-
measure – i.e., the harmonic mean of Precision and Recall, and G-mean – i.e., the geometric
mean between True Positive rate (TPrate, also known as Recall) and True Negative rate (TNrate,
the proportion of negative instances correctly classified). However, prior research (e.g.,
(Rahman et al. 2012)) has reported that these scalar metrics are all threshold dependent, that
is, they depend on the ‘cutoff’ value used to decide whether an instance is to be classified as
either positive or negative when computing the confusion matrix. In other words, a threshold
probability is selected (by default .50), above which predictions are classified as positive and
below which they are classified as negative. The default threshold works well when the
instances in the two classes are equally distributed, however, this is not the case with
imbalanced datasets.
Unlike scalar measures that impose a one-dimensional ordering, two-dimensional plots
preserve all the performance-related information about a classifier, thus allowing for a visual
analysis and comparison of the results from binary classifications (Drummond and Holte
2006). The Receiver Operating Characteristic (ROC) plot (Provost and Fawcett 1997) is aAuthor's personal copy
864 Empirical Software Engineering (2019) 24:854–901
two-dimensional graphic with FPrate as the x-axis and the TPrate as the y-axis (see Fig. 1). A
ROC plot allows the performance visualization of a binary classifier as the trade-off between
the accurate classification of the positive instances and the misclassification of the negative
instances (Hastie et al. 2009). A curve in the ROC space is formed from a set of points
obtained by choosing different ‘cutoffs’ (thresholds) to assign probabilistic predictions to
either class. The points (0, 0) and (Adamic et al. 2008) represent the trivial classifiers that
classify all the instances, respectively, as negative and positive. The diagonal line connecting
these two points represents random performance. In the ROC space, the goal is to be in the
upper-left-hand corner, as close as possible to the point (0, 1) representing the perfect
classification performance. As such, when comparing the performance of, say, two classifiers,
one is said to ‘dominate’ the other when the ROC curve of the former is above and to the left of
the other’s – i.e., it has better accuracy on both positive and negative class. According to
Fawcett (2006), ROC curves are not sensitive to changes in the skewness of class distribution,
thus making them particularly suited to compare classifiers over different datasets.
The Area Under the ROC Curve (AUC or AUROC) is a scalar value representing the ROC
performance of a classifier (see Table 3). AUC has an important statistical property: it
represents the probability that a classifier will rank a randomly chosen positive instance higher
than a randomly chosen negative one – i.e., the larger the area under the ROC curve, the higher
the classification potential of a classifier (Fawcett 2006). An AUC value is between 0
and 1. However, because random guessing produces the diagonal line between (0, 0)
and (Adamic et al. 2008), which has an area of 0.5, no realistic classifier should have
an AUC less than 0.5. Since it is threshold independent, AUC provides a reliable
measure to compare the performance of different classifiers (Lessmann et al. 2008)
even with imbalanced datasets (Huang and Ling 2005). Furthermore, Adams and Hand
(1999) recommend reporting AUC values with ROC plots. Similar to AUC, Balance is another
scalar measure related to the ROC plot (see Table 3). Balance, in fact, measures the Euclidean
distance from the point (0, 1) representing the perfect classifier in the ROC space
(Hall et al. 2012).
Fig. 1 ROC plot for graphical assessment of performanceAuthor's personal copy
Empirical Software Engineering (2019) 24:854–901 865
Rahman et al. (2012) and Zhang et al. (2016) observed that threshold-insensitive metrics are
better suited to assess the performance in cross-prediction contexts since they do not require
choosing the optimal cut-off value as other scalar metrics.
We select AUC and Balance as scalar metrics representing the ROC performance of
best-answer prediction.
We draw ROC plots to perform a graphic comparison of the performance of multiple
classifiers.
3 Datasets
We use five datasets, one as training set and the remaining four as test sets. Because all the
datasets are imbalanced, we report the skewness of their class distribution using the pos/neg
ratio (or imbalance ratio), a descriptive metric defined as the ratio of the number of instances
in the positive (minority) class to the number of examples in the negative (majority) class
(Lopez et al. 2013).
In the remainder of this section, we first present the training set built from Stack Overflow.
Then, we present the four test sets, distinguishing between legacy developer-support forums
and modern Q&A platforms; such different test sets allow us to investigate the extent to which
a model trained on Stack Overflow can predict best answers across different platforms.
3.1 Training set: Stack overflow
The training set was built using the official dump of Stack Overflow10 released in February
2016. We randomly selected a subset of questions threads from the 40 M questions in the
dump. Therefore, the final training set contains about 507 K questions and 1.37 M answers.
We use the accepted answers (∼279 K) as positive examples to train the best-answer classifiers,
whereas the remaining unaccepted answers (∼1.09 M) represent the negative examples. As
shown in Table 4, the Stack Overflow training set is skewed towards unaccepted answers, with
a pos/neg ratio of about 1:4.
3.2 Test sets: Legacy forums
The first test dataset is DocuSign,11 an electronic-signature API for securing digital transac-
tions. The original support forum of DocuSign has been abandoned as its developer commu-
nity moved to Stack Overflow. In June 2013, the forum became read-only, inviting community
members to use Stack Overflow with the custom tag docusign-api. By the end of 2015, the
forum and all its content became completely unavailable.
The second test dataset was obtained from the developer-support forum of Dwolla,12 a Web
API for real-time digital payments. The forum was abandoned during mid-2014 but the
content is still available on the web as of this writing.
10
https://archive.org/details/stackexchange
11
https://www.docusign.com
12
https://www.dwolla.comAuthor's personal copy
866 Empirical Software Engineering (2019) 24:854–901
Table 4 Breakdown of the datasets
Dataset Q&A Questions Questions Answers Answers pos/neg
Platform threads resolved (%) accepted (%) ratio
Training Stack Overflow (SO) Modern 507 K 279 K 1.37 M 279 K ∼1:4
(∼55%) (∼20%)
Test DocuSign (DS) Legacy 1572 473 4750 473 ∼1:10
(∼30%) (∼10%)
Dwolla (DW) Legacy 103 50 375 50 ∼1:7
(∼48%) (∼13%)
Yahoo! Answer Modern 41,190 29,021 104,746 29,021 ∼1:4
(YA)* (∼70%) (∼28%)
SAP Community Modern 35,544 9722 141,692 9722 ∼1:15
Net. (SCN)** (∼27%) (∼6%)
*Extracted category: Programming & Design
**Extracted spaces: Hana, Mobility, NetWeaver, Cloud, OLTP, Streaming, Analytic, PowerBuilder, Cross, 3d,
Frontend, ABAP
To obtain a dump of the content from these two legacy forums, we built two custom
scrapers using the Python library Scrapy.13 The scrapers downloaded all the question threads
from the two forums and stored them in a local database for convenience. Unlike other legacy
developer-support sites but analogously to modern Q&A sites, the DocuSign original forum
allowed the question asker to select one answer in the thread as the accepted solution. As such,
the DocuSign dataset was already annotated with accepted answers. Instead, the Dwolla forum
did not offer such feature and then a ‘gold standard’ was created by manually inspecting each
extracted question thread in the dump to identify the accepted solution (if any) among the
existing answers. Two researchers first performed the annotation independently; then, they
compared the results and iteratively resolved conflicts until complete agreement was reached.
As shown in Table 4, the DocuSign dataset, which contains 4750 answers to 1572 questions
threads, is skewed towards unaccepted answers since only the ∼10% of questions are marked
as accepted solutions, with a pos/neg imbalance ratio of about 1:10. Likewise, the Dwolla
dataset has a similar pos/neg ratio of 1:7, albeit the size is quite smaller than DocuSign, with
only 375 answers to 103 questions.
3.3 Test sets: Modern platforms
The modern Q&A sites from which the other two test sets were retrieved are Yahoo! Answers
and SAP Community Network. Unlike the legacy forums that provide all the content mostly
via pure HTML, these modern sites rely heavily on JavaScript to make their content available.
Therefore, to obtain the dump of these two sites, we first loaded pages in Selenium,14 a web
driver capable of controlling the navigation of web pages, and then we scraped their content
using Scrapy.
Yahoo! Answer is a modern community-driven Q&A site, launched in 2005 by Yahoo!,
which relies on gamification to foster participation and quality of answers. Unlike Stack
Overflow, however, Yahoo! Answers is a general-purpose Q&A site, organized by categories
13
http://scrapy.org
14
http://www.seleniumhq.org/projects/webdriverAuthor's personal copy
Empirical Software Engineering (2019) 24:854–901 867
that range from politics to art. To ignore non-technical content, we retrieved only the technical
help requests from the Programming & Design category.
SAP Community Network (SCN) is the official developer-support community of SAP AG.
Released in 2003, SCN is organized into subgroups, called ‘spaces’, dedicated to specific SAP
products, technologies, and programming languages (e.g., ABAP). In 2013, the forum was
updated to support gamification and encourage community engagement on SCN. Although the
SCN forum is still active, community members also post questions on Stack Overflow, using
dedicated tags such as hana or abap. Therefore, we decided to retrieve content only from those
SCN spaces for which a homonymous tag exist in Stack Overflow. Besides, unlike the other
Q&A sites included in this study, SCN is the only platform supporting more than two states for
a question, namely open (or unanswered), supposed answered, and answered. We aggregate
the first two categories together because an assumed-answered question is used by a question
asker who wants to close a discussion regardless of the lack of an accepted solution.
Although the two datasets are comparable in size, as shown in Table 4, the number of
accepted answers in the Yahoo! Answer dataset is much larger than SCN, with about 29 K
answers (∼28%) marked as accepted in the former as opposed to only 9.7 K accepted answers
(∼6%) in the latter. Consequently, the Yahoo! Answer dataset has a pos/neg ratio of about 1:4,
as opposed to SCN, which exhibits the largest imbalance ratio of 1:15 among the four test sets.
4 Features
In this section, we describe the features used by the classifiers to learn the prediction models.
The five datasets in this study come from data sources with different formats and structures.
To facilitate their representation and analysis, we first converted their content into a common
format and then stored it into a local database. Table 5 provides an overview of which relevant
elements are available from each data source. The extracted information elements relate to
either the thread content (e.g., question body and title) or the thread metadata (e.g., when an
answer was entered, its number of views and upvotes received).
Crossed out elements are discarded, whereas the others are retained. Specifically, we
discard all the information elements that are not available in Stack Overflow, since we use it
Table 5 Relevant information elements extracted from the five dumps
Information Elements Stack Overflow DocuSign Dwolla Yahoo! Answers SCN
Type (question/answer) Yes Yes Yes Yes Yes
Body Yes Yes Yes Yes Yes
Title Yes Yes Yes Yes Yes
Answer tags No Yes No No No
URL Yes Yes Yes Yes Yes
Question ID Yes Yes Yes Yes Yes
Question closed Yes Yes Yes Yes Yes
Answer count Yes Yes Yes Yes Yes
Accepted answer ID Yes Yes Yes* Yes Yes
Date/time Yes Yes Yes Yes Yes
Answer views No Yes No No No
Rating score (upvotes − downvotes) Yes Yes No Yes Yes
*After manual annotationAuthor's personal copy
868 Empirical Software Engineering (2019) 24:854–901
to train the prediction models in our study. Regarding the thread content, we observe that the
element answer tags is only available for the DocuSign test set and, therefore, it is removed.
Likewise, with respect to the thread metadata, we discard the answer views information
element because it is only available from DocuSign.
All the retained information elements in Table 5 provide a set of common features available
in all the five datasets. Besides, we also exclude any information element related to user
profiles and gamification (e.g., reputation, badges, the number of accepted answers and
favorited posts). This is because they are generally not available in legacy developer-support
forums and, even when existing, user-related features are very dynamic in nature and, thus,
they need to be constantly recomputed.
The information elements listed in Table 5 are used to define the set of features
employed to train and test the prediction models. The overall set of 22 features is
reported in Table 6, arranged in four main categories: linguistic, vocabulary, meta, and
thread.
Linguistic features represent the attributes of questions and answers and are intended to
estimate their quality. Such linguistic features are called ‘shallow’ because they measure
readability through the ‘surface’ properties of a text, such as the number of words and the
average word length (Pitler and Nenkova 2008). As such, they are also computationally cheap.
For example, the linguistic features include length (in characters), word count, and average
number of words per sentence in an answer. We also add a boolean feature to this category,
namely contains hyperlinks, because in our previous work we found that the presence of links
to external resources is positively related to the perception of answer completeness (Calefato
et al. 2015).
To estimate the readability of an answer we also employ two vocabulary features,
i.e., normalized Log Likelihood and Flesch-Kincaid grade. The normalized Log
Likelihood (LLn), already employed in previous work (Gkotsis et al. 2014; Gkotsis
et al. 2015; Pitler and Nenkova 2008) uses a probabilistic approach to measure to
what extent the lexicon in an answer is distant from the vocabulary used in the whole
forum community. Specifically, LLn is defined as follows:
LL ¼ ∑ws C ðws ÞlogðPðws jVocÞÞ
LLn ¼ ð1Þ
UC ðws Þ
Table 6 Summary of the overall 22 features in our model, arranged by category
Category Feature Ranked version
Linguistic Length (in characters) Length_ranked
Word count Word count_ranked
No. of sentences No. of sentences_ranked
Longest sentence (in characters) Longest sentence_ranked
Avg words per sentence Avg. words per sent._ranked
Avg chars per word Avg. chars per word_ranked
Contains hyperlinks (boolean) –
Vocabulary LLn LLn_ranked
F-K F-K_ranked
Meta Age (hh:mm:ss) Age_ranked
Rating score (upvotes – downvotes) Rating score_ranked
Thread Answer count –Author's personal copy
Empirical Software Engineering (2019) 24:854–901 869
Given s, a sentence in an answer, P (ws|Voc) is the probability of the word ws to occur,
according to the background corpus Voc, and C (ws) is the number of times the word ws occurs
in s. LL is normalized by dividing it by the number of unique words occurring in s. The
normalization in (Adamic et al. 2008) is necessary to consider answers of different lengths. LLn
is the most computationally intensive feature in our set.
The Flesch-Kincaid grade (F-K) is another readability metric defined by Kincaid et al.
(1975) and already used by Burel et al. (2012) in previous work. F-K is calculated as follows:
$ %
F−K pi awsppi ; aspspi ¼ 0:39 awpspi þ 11:8 aspspi −15:59 ð2Þ
In the definition (Adams and Hand 1999) above, for any given post pi, awpspi is the average
number of words per sentence and aspspi is the number of syllables per word.
Two are the features belonging to the meta category. The first one, age, applies only to
answers and it computes the time difference since the question has been posted. The time
dimension is a predictor that cannot be overlooked because the best (accepted) answer is often
the fastest among a set of good-enough answers (Treude et al. 2011). The second one, rating
score, is the number of upvotes minus the number of downvotes that an answer has received
from community members. This feature reflects the perceived usefulness of an answer.
The thread category includes only one feature, answer count, that is, the number of answers
to a question. As such, this feature reflects the popularity of a thread.
Furthermore, as shown in the rightmost column of Table 6, for all the features, except
answer count and contains hyperlinks, we also assign ranks after computing their numeric
values. In other words, for each question thread, we group all answers, compute a feature, and
then rank the values in either ascending or descending order. In the following, we refer to this
procedure as ranking (Calefato et al. 2016). For instance, for the word count linguistic feature,
the answer in the thread with the largest value ranks 1, the second largest ranks 2, and so on
(i.e., descending order) because we assume that long answers are more accurate and elaborate
and, hence, have a larger chance of being accepted. For the age feature, instead, we assign the
rank 1 to the quickest answer (i.e., ascending order), because previous research has demon-
strated that responsiveness plays a major role in getting answers accepted in Q&A websites
(Mamykina et al. 2011; Wang et al. 2017).
5 Empirical study
Our assessment framework is divided into two stages, one per research question: (Adamic
et al. 2008) best-answer prediction within Stack Overflow and (Adams and Hand 1999) cross-
platform best-answer prediction. Both stages are carried out using the R statistical software
package.
5.1 Best-answer prediction within stack overflow
As this stage is concerned only with the Stack Overflow dataset, the other four test sets are left
out and used in the next assessment stage.
Given the size of the Stack Overflow dataset (~1.4 M answers), to reduce the computational
time, we generated a subsample of about 341 K answers with the same pos/neg ratio as theAuthor's personal copy
870 Empirical Software Engineering (2019) 24:854–901
whole dataset. Model evaluation starts by seeking the optimal parameter configuration for the
26 classifiers (Fig. 2). Assessing all the possible settings in the parameter spaces
would be unfeasible. Thus, we rely on the caret15 R package to perform automated
parameter optimization in three steps. In the first step, caret generates the candidate
parameters for each of the classifiers. We set the tuneLength parameter to 5, as
suggested by Kuhn (2008) and Tantithamthavorn et al. (2016); this parameter
represents a ‘budget threshold’ that constrains the maximum number of different
values to be evaluated for each parameter. Then, in the second step, caret evaluates
all the potential combination of the candidate parameter settings until the budget
threshold is exceeded. Finally, in the third step, caret outputs the optimized settings
that achieve the highest performance estimate. Only 3 out of 26 classifiers (see
Table 7) require no tuning as they do not have parameters (i.e., GLM, LDA, and
BaggedCART).
At this stage, the best-answer prediction models are evaluated using a 10-fold cross-
validation approach, which divides the input dataset into 10 folds of equal size. Of the 10
folds, 9 are allocated to the training corpus (90%) and 1 is set aside for the testing (10%). This
process is repeated ten times, using each fold as the testing fold once. To further increase the
validity of our results, we repeat the entire 10-fold process ten times, for a total of 100
iterations; through these iterations, we reduce the amount of variance in the evaluation of the
prediction models. Despite the class imbalance in the Stack Overflow dataset, as suggested by
Turhan (2012), we do not apply any resample technique to rebalance the dataset. Instead, we
use a stratified technique to generate folds that preserve in both the training and test sets the
same class distribution as in the original dataset.
To compare the performance of the best-answer prediction models, as suggested by
Tantithamthavorn et al. (2017), we use the Scott-Knott ESD test, which groups the
models into statistically distinct clusters with a non-negligible difference, at level α =
0.01. The grouping is performed based on mean AUC values (i.e., the mean AUC
value of the ten × 10-fold runs for each prediction model). Therefore, this evaluation
stage eventually results in a list of all the studied classifiers ranked by performance
(mean AUC), from which we select the top-ranked ones that are statistically better at the 1%
level. In addition, to graphically identify further differences in performance, we also plot the
ROC curves for select models.
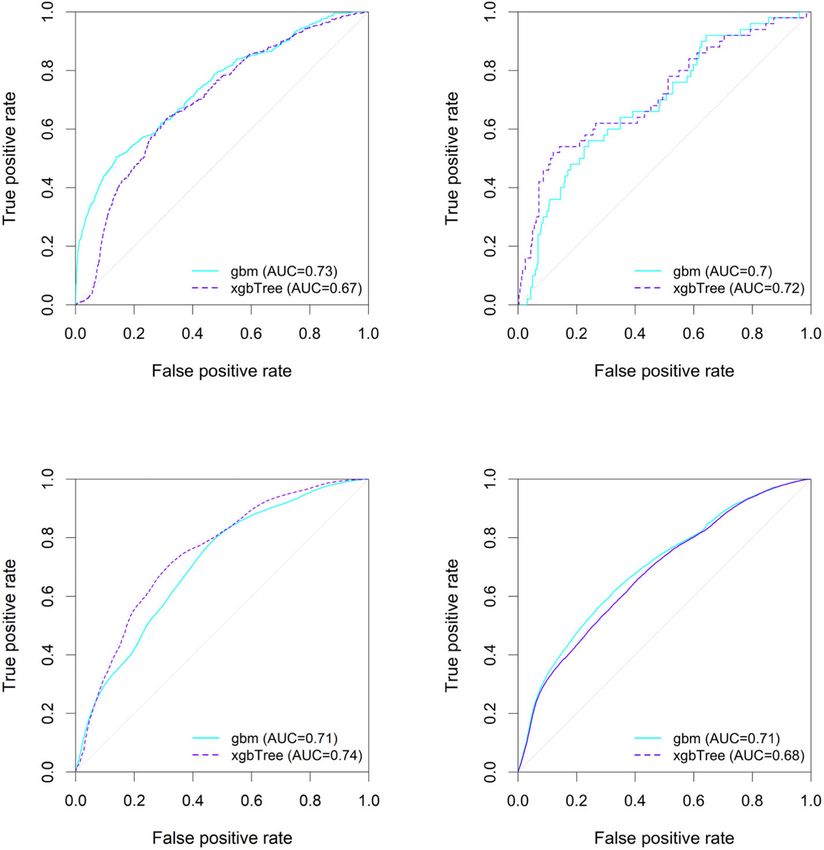
5.2 Cross-platform best-answer prediction
The second stage concerns with evaluating the performance of the selected top-ranked
classifiers in a cross-platform setting, i.e., trained on Stack Overflow and tested on four test
sets, namely DocuSign, Dwolla, Yahoo! Answers, and SCN.
This stage starts by training the best performing prediction models identified during the first
evaluation stage (Fig. 3). The training is performed using the subset of the Stack Overflow
dataset not used in the first stage, which accounts for about 1 M answers overall. Then, the
models are tested on each of the four test sets. The same set of scalar measurements and
graphical evaluations used in the first assessment stage are also applied at this stage to assess
and compare the performance of the classifiers.
15
https://cran.r-project.org/package=caretAuthor's personal copy
Empirical Software Engineering (2019) 24:854–901 871
Studied dataset Repeated 100 times
(10 x 10-fold cross-validation)
Caret parameter tuning Prediction-model assessment
(tuneLength = 5)
Model construction
Generate
candidate Logistic
param settings Regression
(LR)
Stack
Overflow …
(SO)
Evaluate
candidate Alternating
param settings 10-fold cross-
Decision
validation
Tree (ADT)
…
Identify
optimal param
settings Random
Forests
(RF)
Optimal Models
param Ranking
setting
Fig. 2 Workflow of the first assessment stage: best-answer prediction within Stack Overflow
6 Results
In this section, we present the results with respect to the two research questions.
6.1 Best-answer prediction within stack overflow
Table 8 reports the results of the Scott-Knott ESD test on the mean AUC values collected from
the first evaluation stage, with 19 statistically distinct clusters of classifier performance. The 4
best prediction models in the top 3 clusters from the Scott-Knott ESD test, namely xgbTree,
pcaNNet, earth, and gbm, achieve a mean AUC performance of about 0.9 and a maximum
value ranging between 0.93 and 0.94, as also visible in Fig. 4, which shows the box plot of the
AUC values collected during the repeated cross-validation process. On average, a large
disparity in performance is observed between these four best models (mean AUC ≈0.9) and
the worst (AUC = 0.59 for JRip), corresponding to a ~43 percentage points difference. All the
prediction models proved to be stable in terms of AUC, given the small standard deviations
values observed in this dataset (see Table 8).
Accordingly, in the following, we focus on these 4 classification techniques from the top 3
clusters. Table 9 reports their optimal parameter configurations with respect to maximizing
AUC, and the overall amount of time taken by the parameter tuning process. The complete
table is available online as additional material.16
First, as per the tuning runtime of the 4 models in the top 3 clusters, caret was able to
complete the process in 2 to 8 h. The process took a few hours, often minutes, to complete also
for the other classifiers, thus confirming that parameter tuning is computationally practical
16
https://github.com/collab-uniba/emse_best-answer-prediction/tree/master/additional_materialYou can also read