Health Disparities and Social Determinants of Health in Connecticut February 2021 - Access Health CT
←
→
Page content transcription
If your browser does not render page correctly, please read the page content below
Health Disparities and Social Determinants of Health in Connecticut February 2021
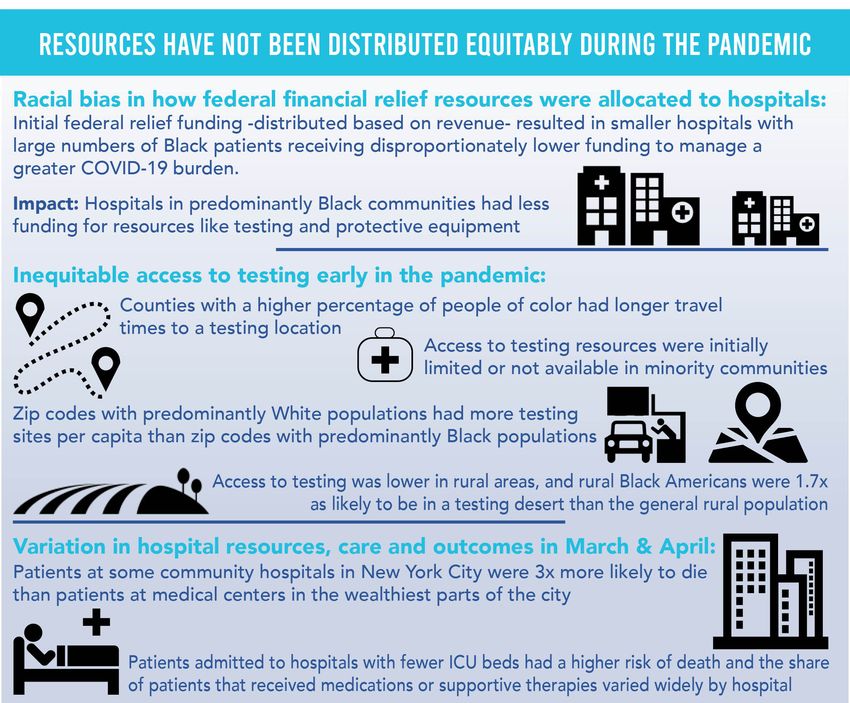
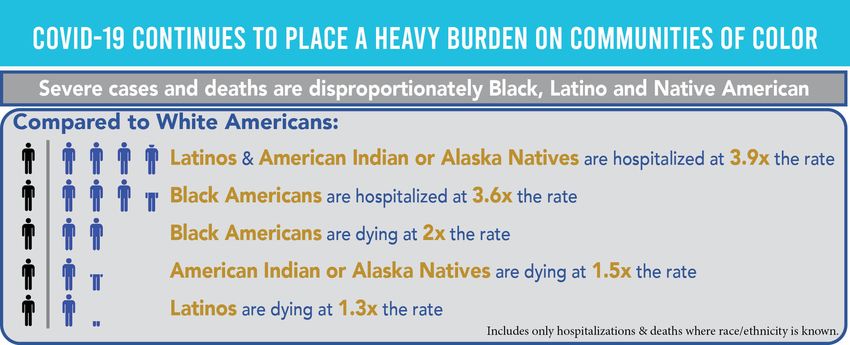
Table of Contents
I.     Executive Summary                                                                                      1

II.    Tracking Health Disparities during a Pandemic: Underlying Causes of Disparity                          6

       The Major Dimensions of Disparity in the United States and Connecticut                                10

       A Note on Racial and Ethnic Disparity                                                                 13

III.   The Social Determinants of Health (SDoH)                                                              14

       Food Access, a SDoH                                                                                   17

       Access to Healthcare, another SDoH                                                                    18

IV.    The COVID-19 Pandemic Underscores Health Disparity and a Lack of Health Equity                        22

       Racial and Ethnic Distribution of COVID-19 Cases Across Connecticut                                   25

       Plotting COVID-19 Across Connecticut Towns: Risk Factors for Morbidity                                27

       Further Exploration of the SDoH                                                                       30

V.     Stakeholder Assessment: Addressing Health Disparities in Connecticut                                  36

       Motivation and Methodology                                                                            37

       Stakeholders’ Views of Access Health CT and its Role in Addressing Health Disparities                 37

       Addressing Health Disparities in Connecticut: Stakeholder Lessons                                     39

VI.    Consumer Survey: Understanding Connecticut Residents’ Views on Health and Health-Related Topics       44

       Challenges Residents Experience Related to Social, Behavioral, and Lifestyle Determinants of Health   45

       Barriers to Equitable Healthcare Access and Engagement, and the Root Causes of These Barriers         46

       Interest in Insurance and Other Health-Related Products and Services Evaluation                       47

       Understanding Consumer Familiarity with and Image of Access Health CT                                 48

VII.   Implications and Recommendations for Access Health CT                                                 49

VIII. Appendices                                                                                             52

       Appendix 1: Activities of Important Stakeholders in Connecticut Health                                53

       Appendix 2: Description of Interview and Survey Designs                                               55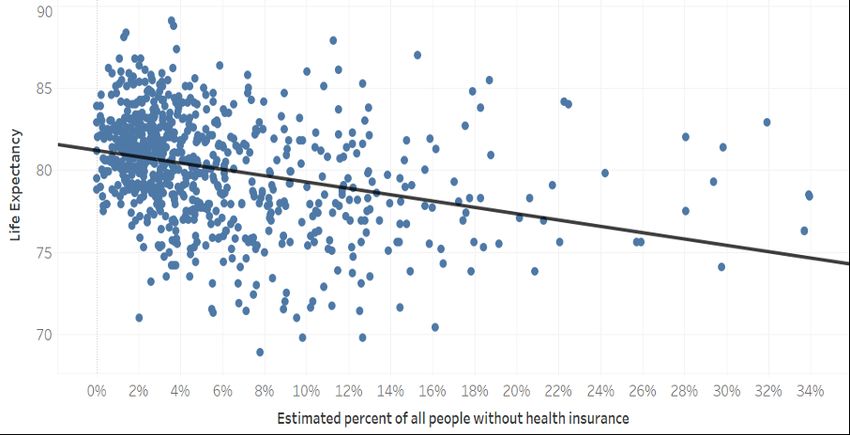
I. Executive Summary
Executive Summary                                               driven by social determinants of health (SDoH)
                                                                such as income, education, and housing, each
                                                                highly correlated with the spatial and group
Ranking 5th among states in life expectancy at 80.9
                                                                differences mentioned above
years compared to a U.S. average of 78.5, the health
                                                                • About 1-in-11 Connecticut neighborhoods
status of Connecticut’s 3.5 million people is better than
                                                                    are both food and medical deserts where
most states. However, indices of average status on
                                                                    a dearth of supermarkets selling fresh
which such comparisons rely conceal disturbingly large
                                                                    and healthy food options and a lack of
disparities in both the health status and healthcare
                                                                    medical facilities interact with other SDoH
delivered to lower income residents in general and lower
                                                                    to undermine healthy choices and health
income people of color more specifically. The fact that
                                                                    outcomes
different groups experience different burdens of disease
                                                                • African American, Hispanic, and lower to
and risk of premature death requires stressing that
                                                                    moderate income respondents to surveys are
many of these disparities are the social and economic
                                                                    significantly more likely to report barriers to
consequences of inequality and discrimination, and
                                                                    medical services and healthy lifestyle choices
importantly, are largely preventable.
                                                                    that are based on lack of access to relevant
                                                                    resources
An extensive examination of evidence leads to the
conclusion that Access Health CT’s core mission to
                                                            •   This research uncovered how consumer
improve the health of the people of Connecticut by
                                                                experiences within the healthcare delivery system
reducing the population without health insurance,
                                                                often exacerbate the impact of other SDoH and
and increasing access to and utilization of health
                                                                cause underutilization of the healthcare delivery
and medical services, cannot be achieved without
                                                                system. Particularly, there are three key areas of
addressing the substantial health disparities between
                                                                experience that provide barriers to the healthcare
the state’s racial/ethnic and income groups, its
                                                                delivery system:
cities, and within cities, across neighborhoods. This
                                                                • Not all insurance plans are accepted or
conclusion follows directly from a consideration of
                                                                    treated equally
Access Health CT’s mission:
                                                                • For consumers, the cost of healthcare is
                                                                    unmanageable
•   Reducing the uninsured population is not possible
                                                                • Poor patient/provider relations exist
    without targeting the subpopulations with
    the largest groups of uninsured. Only 5.9% of
    Connecticut’s population is uninsured, but this         What is a Health Disparity?
    relatively small number hides significant disparities
    among race/ethnic groups and across space               We adopt the definition of health disparity suggested
    • Hispanics in Connecticut are almost 4 times           by the U.S. Department of Health and Human
        more likely to be uninsured than Non-               Services. A health disparity is:
        Hispanic Whites; Blacks are 3 times more
        likely than Whites. Blacks and Hispanics            “a particular type of health difference that is closely
        have also lost health insurance coverage at a       linked with social, economic, and/or environmental
        greater rate during the pandemic                    disadvantage. Health disparities adversely affect groups
    • While most Connecticut neighborhoods                  of people who have systematically experienced greater
        cluster in a range with 2% to 6% uninsured          social or economic obstacles to health based on their
        residents, many neighborhoods across the            racial or ethnic group, religion, socioeconomic-status,
        state have 20% or more uninsured residents,         gender, age, or mental health; cognitive, sensory, or
        several exceed 30%                                  physical disability; social orientation or gender identity;
    • Invariably, the latter neighborhoods are              geographic location; or other characteristics historically
        disproportionately composed of Hispanics or         linked to discrimination or exclusion.”
        Blacks as are the cities and towns where the
        neighborhoods are located                           This Report summarizes a data-grounded project
                                                            designed to identify the needs and opportunities of
•   Both objective data and self-reports from               many communities in Connecticut to allow Access
    Connecticut consumers reveal large disparities          Health CT to build a strategic framework that brings
    in access to health and medical services that are       together appropriate public, private and non-profit

                                                                                                                      2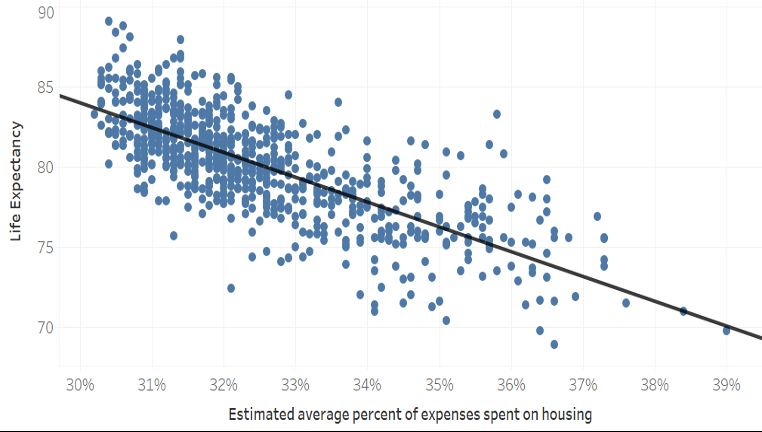
sector entities in support of developing new products,          •   18% of Hispanics and 11% of Blacks were
services and delivery methods that can address                      uninsured during 2018, compared to only 8%
health disparities and make meaningful differences in               of Whites
people’s lives. The project was completed in three parts.       •   More than 1-in-4 Hispanic adults had no
                                                                    personal doctor in 2017. Among White adults,
•   Part 1: a review of third-party public data to                  it was just over 1-in-10
    identify and quantify health and health-related             •   Hispanic adults were more than twice as
    issues, morbidity and mortality causes, and their               likely as Whites to report cost as the reason
    relationship to demographic and socioeconomic                   they did not see a doctor during the previous
    status                                                          12 months
•   Part 2: solicitation of collective feedback
    from Connecticut stakeholders to understand             •   Barriers to accessing healthcare are very
    perceptions of health disparities along with                pervasive, and residents who are experiencing
    perceptions of Access Health CT for potential               barriers often experience multiple challenges
    partnership opportunities and product, service              rather than a single isolated problem. Across the
    and support ideas                                           board, the following groups are more likely to
•   Part 3: distribution of a consumer survey designed          experience barriers to getting healthcare:
    to understand Connecticut residents’ views on               • Low socioeconomic status (SES) residents
    health and health-related topics along with                     • Residents below 400% of the federal
    interests and desires to engage with health-                        poverty level (FPL) are more likely
    related products, services and supports                             to experience barriers to healthcare
                                                                        compared to people who are above
The Drivers of Health Disparity                                         this threshold. Findings are similar for
                                                                        household income (HHI). Only when HHI
Health disparities are easily visible as differences                    exceeds $50,000–$75,000 do barriers
among race/ethnic groups, but the drivers of those                      start disappearing
disparities (their root causes) stem from a complex             • Residents insured through Medicaid, Husky, or
and interrelated set of individual, health system,                  a non-traditional plan
societal, and environmental factors including poverty,              • These residents are more likely to
poor educational attainment, inadequate housing,                        experience multiple barriers, especially
unsafe working conditions, and inadequate access to                     finding a provider who takes their insurance,
insurance and health care. They are thus reflections of                 getting an appointment when needed,
the persistent inequities that exist in society.                        and barriers related to cost or insurance in
                                                                        general. They are more likely than others to
•   Large differences in life expectancy across                         distrust or fear going to the doctor
    Connecticut towns (and within towns, across                 • Residents who are in poorer health
    neighborhoods) are driven by gross racial and                   • People who are in poorer health and/or
    ethnic differences in poverty, education, and                       have a serious health condition are more
    access to health care                                               likely to experience multiple barriers
    • The highest life expectancy, a neighborhood               • Black residents
        of Westport with an 89.1-year life expectancy,              • These residents are especially likely to
        is 91% White; by contrast, a neighborhood in                    experience various barriers, especially
        Northeast Hartford with a life expectancy 68.9                  those related to cost and insurance
        years is 94% Black and Hispanic                                 coverage, getting an appointment when
    • In the Westport neighborhood, 8 of 10 adults                      needed, and finding a doctor who accepts
        graduated college, in the Northeast Hartford                    their insurance
        neighborhood, less than 1 of 10; the Westport           • Women
        neighborhood’s poverty rate is 4 in 100, the                • Women experience some barriers to
        Northeast Hartford neighborhood’s, 44 in 100                    a greater degree, and this could be
                                                                        interrelated with other characteristics
•   Many health disparities are linked to differences                   such as SES
    in insurance coverage and associated differential           • Having other SDoH risk factors
    access to a regular health care provider. In                    • People who think they are at a health
    Connecticut:                                                        disadvantage, because something in their
                                                                                                                   3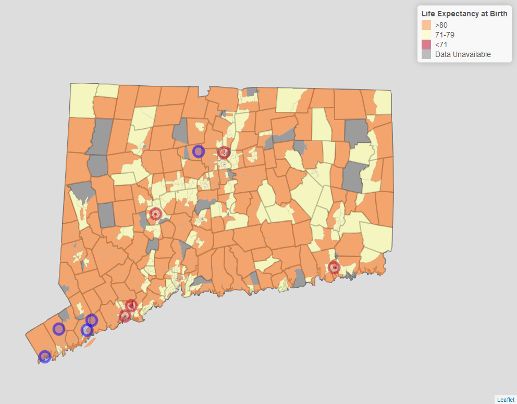
world or reality is impossible or hard to        determinants of contracting the disease versus
            change, actually are at a disadvantage—          the medical and age-related factors determining
            they are disproportionately likely to face       who dies
            barriers. This supports the idea that        •   Although Black and Hispanic residents are
            health inequity is partly grounded in the        disproportionately at risk of contracting the
            reality that we are held back because of         disease, Whites are more likely to die once they
            the world that we live in and emphasizes         have the disease
            the importance of system-level changes           • The White percent of COVID-19 cases is only
            to close the gap in health equity                    about half their population share.
                                                             • Whites with COVID-19 have died at more than
While these findings indicate relationships between              twice the rate of their population proportion
SDoH and various challenges that may have                        among those with the disease
implications for health outcomes, the fact that such         • Hispanics with COVID-19 have died at less
relationships exist does not necessarily mean that               than half their population proportion among
these factors are drivers of health inequity or that             those with the disease
Access Health CT needs address these challenges              • Blacks with COVID-19 die at about a 15%
to meaningfully reduce health disparities. We must               higher rate than their population proportion
consider other root causes.                                      among those with the disease
                                                         •   SES factors appear most significant in determining
Because the uninsured are less likely to seek                who contracts the disease
preventive care, diseases go untreated until             •   Who is more likely to die once infected is
at an acute stage or they require emergency                  determined more by health and medical factors
care. Consequently, the burden of disease and                such as age and preexisting medical conditions
consequences of poor disease management                      associated with severe COVID-19 cases. The
negatively impact health outcomes. Reducing these            relevant medical conditions are highly correlated
disparities is important not only from a health equity       with race and ethnicity.
standpoint, but also from an economic perspective.
                                                         Implications and Recommendations
•   That lack of health insurance and inadequate
    preventive care causes delayed treatment is          to Access Health CT
    consistent with the fact that for several diseases
    such as cancer and cardiovascular disease,           The research shows there are five key areas of focus
    although Whites have the highest prevalence,         and recommended actions for Access Health CT as
    Blacks have the highest hospitalization and          the organization builds out its strategic framework for
    mortality rates                                      addressing health disparities in Connecticut.
•   A recent study at Yale Medical School found that
                                                         1. Address systemic causes of health inequity:
    expansion of health insurance through Medicaid
                                                            healthcare cannot be an observer of issues
    lowered the average rate of diagnosis of breast
                                                            or continue to suggest that health inequity is
    cancer in women largely because lower income
                                                            sustained by broader social forces alone.
    women with insurance more readily sought health
    services earlier. The effects were largest among
                                                         Much of the discussion on health disparities
    African American women
                                                         addresses individual socioeconomic and behavioral
•   Largely due to emergency room use, the excess
                                                         determinants. Yet, health inequities are not a product
    hospital cost of Black residents is over $384
                                                         of such characteristics alone. Our research shows that
    million and that of Hispanics over $121 million
                                                         vulnerable groups feel that the healthcare system
    compared with non-Hispanic White residents
                                                         shuts them out and hinders their engagement in
                                                         various ways. It is clear that consumer experiences
Lessons from COVID-19 in                                 within the healthcare delivery system exacerbate the
Connecticut                                              impact of other SDoH and play a powerful role in
                                                         perpetuating unequal health outcomes.
•   Connecticut’s COVID-19 disease and mortality
    burdens differ considerably from national trends,    Implementing solutions at the system level will be
    and the differences convey the socioeconomic         critical for meaningful advances in health equity

                                                                                                              4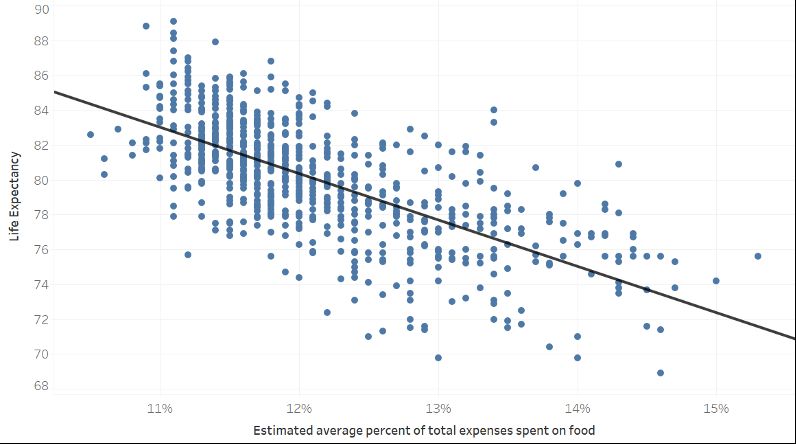
and reducing root causes of consumer healthcare            understand more about themselves and their health is
avoidance. Solutions should include efforts to:            critical and providing guidance along the way to keep
                                                           them focused and on a plan. Supporting the work of
•   Reduce cost of care                                    Community Health Workers or Care Coordinators as
    • This was consumers’ top suggestion for               “super navigators” is an area to explore further.
        improving healthcare in their community
    • This was also a high priority for stakeholders       4. Assess current work around Data and
        interviewed                                           Information centralization to see how Access
•   Improve insurance coverage                                Health CT can help
    • Health insurance is a way to pay for care but
        is not the only means of accessing care. It        True integration of care to support the whole person
        is not enough to be insured. The type and          requires information sharing. For the commissions,
        quality of coverage matters, and Access            organizations or providers that support underserved
        Health CT is well-positioned to advocate for       communities, there are limitations to how data is
        improvements or the creation of new products       shared or a lack of data sharing. For example, many
        and services in this area                          struggle with the costs of Electronic Patient Record
•   Improve quality of patient-provider interactions       (EPR) systems or are unable to access these types of
•   Increase the number of providers and choices           systems. All of this creates barriers for patients. As
    available to people; reduce disparities in insurance   the State of Connecticut is working to centralize data,
    acceptance by providers                                make data more accessible or enhance reporting to
•   Improve ability to get timely care                     better support whole person health, Access Health CT
•   Improve health and health insurance literacy           should assess this work in progress in these areas to
                                                           understand how the data Access Health CT has can
2. T
    o improve patient-provider interactions, we           support or enhance these efforts.
   must address implicit bias in healthcare and
   recognize how providers may be unwittingly              5. Access Health CT brand perception is neutral
   contributing to inequities.                                to positive

Strategies should aim to reduce the impact of bias         With a lack of trust for public and private institutions
rather than eliminate it entirely. Examples include:       growing among consumers, yet Access Health CT
                                                           brand perception being neutral or positive, Access
•   Efforts to make care more patient-centered—            Health CT has the opportunity to take on the role of
    getting physicians to see each patient as an           building trust and relationships, and represents an
    individual and fostering a team approach to            opportunity to expand its current role to better help
    patient care                                           those in need.
•   Bias training and cultural competency training that
    can help providers to become better attuned to         These initial recommendations encompass six areas
    implicit biases and develop skills to address them     that will guide development of more specific new
•   Foster an organizational climate that is truly         products, services and supports forthcoming in the
    committed to equity—this has been found to             next phase of the project.
    be more effective at reducing bias than formal
    diversity curricula
•   Encourage diversity in physicians and
    organizational leaders

3. T
    ake proactive measures to get people to engage
   with care

People benefit from both intrinsic and extrinsic
rewards to take interest in their health and well-
being and to get and stay on any form of care path.
However, they also need someone to reach out to
bring them into the system first before they can
get on this path. Once they are in, helping them
                                                                                                                      5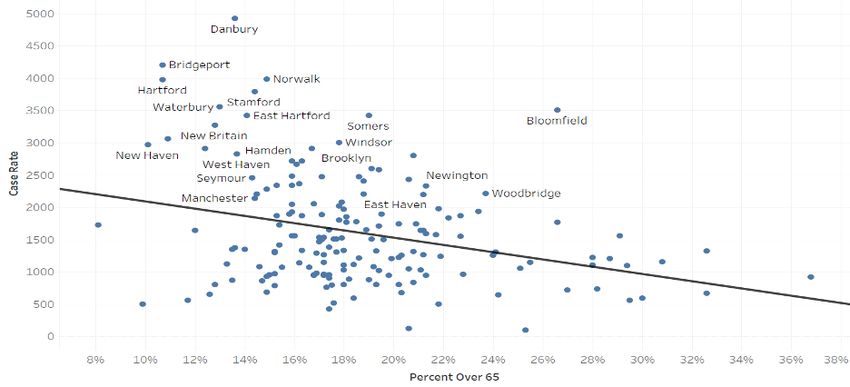
II. Tracking Health
Disparities During a
Pandemic: Underlying
Causes of Disparity
Tracking Health Disparities
During a Pandemic: Highlights
Underlying Causes of • Significant differences in the
average life expectancy of various
Disparity communities in Connecticut track
health disparities across its cities.
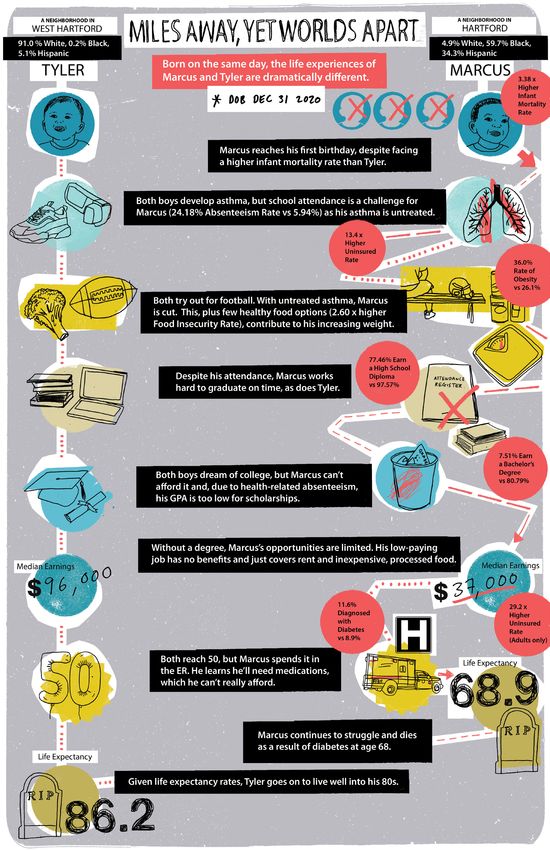
The 80.8 years of life expectancy bequeathed a baby
• Disparities in life expectancy
born in Connecticut exceeds the national average of
reflect large disparities in
78.5 years.1 However, as the hypothetical examples of
morbidity such as low birth
Marcus and Tyler illustrate, the state average obscures
rates, obesity, diabetes, and
vast differences between cities and, within cities, even
cardiovascular disease.
across neighborhoods, see Figure 1. In a neighborhood
of Northeast Hartford, life expectancy is just 68.9
• Group differences in COVID-19
years—nearly 12 years shorter than the state average
incidence reflect health disparities
and more than 20 years shorter than sections of
long recognized by experts,
Westport, the affluent coastal town whose residents
exposing the sources of these
enjoy the highest life expectancy in Connecticut.2
disparities clearly.
Given historic patterns of racial and class segregation
• COVID-19 data show how
in housing and schools, these geographic disparities
occupation, income and education,
also manifest along racial and ethnic lines. The
age, gender, and geography (each
proportion of Blacks or Hispanics living in most of
closely tied to race and ethnic
the neighborhoods with the lowest life expectancies
origin), drive health disparities.
greatly exceed their respective state population shares
of 12.2 and 16.9%, see Table 1.3 For example, in the
area of Westport with a life expectancy of 89.1 years, occupation, income and education, age, gender, and
91% of residents are non-Hispanic White. geography (recognized drivers of health disparity), are
closely tied to race and ethnicity.
By contrast, Northeast Hartford, which has a life
expectancy below 70 years, is 98% Black and This report documents Connecticut’s significant health
Hispanic. These disparities in life expectancy at disparities by focusing special attention on the public
birth reflect well known differences in the health of health lessons learned during this pandemic. Because
Connecticut residents. the virus targets subpopulations with demographic and
socioeconomic characteristics that make Connecticut’s
In furtherance of the Affordable Care Act’s mandate most vulnerable communities most at risk of contracting
to provide “quality affordable health care for all it, comparing the differential impact of COVID-19 to
Americans,” Access Health CT asked BJM Solutions measured health disparities more generally provides an
and Mintz + Hoke to assess the state of health illuminating framework for ascertaining the drivers of
disparities in Connecticut and recommend any health disparity across the state.
interventions the organization might take to help
redress such health disparities.4 This part of the report begins by defining what is
meant by the term “health disparity,” illustrating
In early 2020, just as the assessment began, the the concept with examples of disparities in those
COVID-19 pandemic erupted, catapulting concerns diseases that are the major causes of group health
about such health disparities to a new level of public differences and premature death. The report then
consciousness. Various reports indicate that group discusses the complicated relationship between
differences in the incidence of COVID-19 morbidity and racial and ethnic categorization and the demographic
mortality reflect many of the group health disparities and socioeconomic factors that mainly drive health
long recognized by public health experts. The virus disparities. The next section of the report presents
exposes the sources of these disparities in a particularly several findings documenting the distribution of
salient manner, providing clear evidence that major COVID-19 cases and deaths across Connecticut’s
causes and covariates of health disparity such as 169 towns and cities. This discussion examines
7the various social and demographic differences detailed discussions of Connecticut stakeholders’ and
that underly health disparities across the state’s consumers’ views of Access Health CT prepare a path
landscape, illuminating the role of social and spatial for making recommendations specific to the mission
inequities in driving general health disparities. of Access Health CT. An appendix contains tables and
The next two sections summarize findings from figures of supporting data as well as a summary of
qualitative and quantitative interviews and surveys important stakeholder activities.
of stakeholders and consumers. These findings with
Figure 1. Life Expectancy at Birth of Connecticut Residents by Census Tract
*The ten census tracts circled red or blue have, respectively, the lowest and highest life expectancies in
Connecticut. The average number of residents in a census tract is about 4,000, but nationwide they range from
1,200 to 8,000 persons.
8Table 1. Top 5 Census Tracts with Highest & Lowest Life Expectancy and Sociodemographic Traits
Census College
Town Expectancy5 NH White6 NH Black7 Hispanic8 Poverty10 Uninsured11
Tract Graduate9
Connecticut 80.812 67.5% 9.8% 15.7% 21.74% 10.03% 5.58%
Westport 501 89.1 90.5% 0.0% 0.7% 82.67% 3.74% 3.58%
Greenwich 112 88.8 78.5% 0.1% 18.3% 75.28% 6.13% 3.69%
Stamford 204 88.4 69% 3.4% 12.5% 67.76% 3.23% 1.42%
Avon 4622 88.1 72.8% 3.0% 2.8% 81.24% 4.41% 1.30%
Norwalk 436 87.9 65.7% 9.0% 13.0% 39.82% 7.05% 11.26%
Bridgeport 731 71.0 24.2% 28.7% 39.3% 21.21% 18.13% 9.53%
Bridgeport 709 70.4 7.1% 38.4% 51.6% 15.56% 34.83% 16.14%
New London 6905 69.8 38.6% 18.6% 28.7% 19.60% 40.46% 9.81%
Waterbury 3501 69.8 26.2% 14.6% 50.4% 7.38% 56.48% 12.67%
Hartford 5012 68.9 4.9% 59.7% 34.3% 7.51% 44.35% 7.79%
9What is a Health Disparity? A related concept is health equity.
“Health” is a complex state of being not easily A society attains health equity when each of its members
amenable to a simple definition. For the purposes “has access to the resources necessary to attain his or
of this report, we indicate a population’s relative her full health potential,”and no one is “unable to achieve
“health” status in terms of objective indicators that their potential because of their social position or other
measure the incidence, prevalence, and burden of socially determined circumstances.”15
disease or other adverse health conditions such as
premature mortality. However, given the complexity of
the concept “health,” the term health disparity carries
different meanings for different health practitioners.
Highlights
As a recent excerpt from an article in the American
• Health disparity: a health
Journal of Obstetrics and Gynecology reports, “while
difference linked to social,
the term “health disparities” appears to represent a
economic, or environmental
concept which can be intuitively understood, there
disadvantage that adversely
is much controversy about its exact meaning.”13 The
affects those who systemically
authors go on to say that most accepted definitions
experience greater social or
consider health disparities to be only those health
economic obstacles to attaining
differences that systematically and negatively impact
good health.
less advantaged groups. Common definitions also
restrict attention to health status differences created
• Health equity: occurs when
at least partially by a society itself, because that
members of society have access
focus endows the society the greatest potential to
to the resources necessary to
ameliorate the health differences. In the international
attain their full health potential;
literature, and increasingly in the United States,
no one is unable to achieve their
health disparities across socioeconomic class, gender,
potential due to their social
disability status and sexual orientation have been
position or socially determined
added to concerns of health disparities between racial
circumstances.
and ethnic groups.
These group categories present difficult measurement
issues concerning the definition of groups and even A. The Major Dimensions of Disparity in the United
the scientific validity of social concepts such as race. States and Connecticut
After considering the definitions used by several
organizations and government agencies, we adopted Significant group differences in longevity exist in
the definition of health disparity suggested by the U.S. Connecticut. Here we examine objective indices of
Department of Health and Human Services (HHS) to health that measure the extent of health disparity in
guide our report on the state of health disparities in a population. We focus on several dimensions of
Connecticut. A health disparity is: health status:
“a particular type of health difference that is closely • Longevity/Mortality: Group differences in length
linked with social, economic, and/or environmental of life and rates of mortality from disease
disadvantage. Health disparities adversely affect groups • Prevalence and Burden of Disease: Group
of people who have systematically experienced greater differences in rates of morbidity, severity of
social or economic obstacles to health based on their disease, and the onset of disease complications
racial or ethnic group, religion, socioeconomic status, • Access: Group differences in access to preventive
gender, age, or mental health; cognitive, sensory, or health screenings and prescriptive healthcare and
physical disability; social orientation or gender identity; resources for disease management, succinctly,
geographic location; or other characteristics historically differences in who becomes ill
linked to discrimination or exclusion.”14
10Table 2 exhibits the top ten causes of death in
the United States. Nationwide, Blacks and Native
Americans experience higher mortality rates both Highlights
overall (row 1) and for several specific diseases. The
mortality figures presented in Tables 2 and 3 suggest • All cause-age-adjusted mortality
that in Connecticut, all groups are faring better than rates are lower than national
national averages. averages for all Connecticut
groups.
Table 3 indicates that, in Connecticut, Black
Americans, who have the highest death rates in 6 of • However, Connecticut mortality
10 of the top causes of mortality, are the only group rates exhibit significant
experiencing systematic and significant divergences differences across racial and
from state averages. COVID-19 related deaths also ethnic groups.
follow interesting trends when studied across racial/
ethnic dimension, as will be discussed later. Public • Connecticut Blacks have the
health experts began releasing projections of highest all-cause mortality rates,
COVID-19-related deaths during the summer of 2020. and the highest mortality in 6 of
the 10 leading causes of death.
As of December 2020, the coronavirus surpassed
heart disease to become the leading cause of death. • Hispanic mortality is generally
The Institute for Health Metrics and Evaluation lower, but Hispanic diabetes
estimates there will be about 570,000 deaths from mortality is 1.67 times Whites’.
the disease by April 1, 2021.16
• Nationwide, Native Americans
have the highest mortality rate.
• COVID-19 is the leading cause of
death in 2020.
Table 2*. Age-Adjusted Mortality Rates** by Race & Ethnicity, U.S., 201717
Rank Race/Ethnicity All White Black Hispanic Asian Native
- All-Cause Mortality 731.9 755.0 881.0 524.7 395.3 800.2
1 Heart Disease 165.0 168.9 208.0 114.1 85.5 151.4
2 Cancer 152.5 157.9 178.0 108.1 95.2 130.0
3 Accidents 49.4 56.2 47.6 32.5 16.7 86.3
Chronic Lower Respiratory
4 40.9 46.4 30.2 17.2 11.8 40.7
Diseases****
5 Stroke (Cerebrovascular disease) 37.6 36.4 52.7 31.8 30.3 34.1
6 Alzheimer’s Disease 31.0 32.8 28.5 24.7 15.3 20.6
7 Diabetes 21.5 18.8 38.7 25.5 16.5 46.1
8 Influenza and Pneumonia 14.3 14.4 15.2 11.3 13.0 17.3
9 Intentional Self-harm (suicide) 14.0 17.8 6.9 6.9 6.8 22.1
Nephritis, nephrotic syndrome,
10 13.0 11.7 25.8 11.3 8.5 14.3
and nephrosis
11Table 3. Age-Adjusted Mortality Rates by Race & Ethnicity (deaths per 100,000 people), CT, 2013-201718
Rank Race/Ethnicity All White*** Black Hispanic Asian Native
- All- Cause Mortality 648.0 652.49 727.1 516.6 346.4 283.7
1 Heart Disease 144.0 145.4 157.9 136.8 102.6 57.6
2 Cancer 144.0 146.6 158.6 105.8 81.8 67.3
3 Accidents 44.7 49.5 35.6 36.5 14.6 -
Chronic Lower Respiratory
4 29.9 31.4 24.4 16.9 8.3 -
Diseases****
5 Stroke (Cerebrovascular disease) 27.1 26.2 32.4 28.0 21.7 -
6 Alzheimer’s Disease 18.6 19.2 16.0 12.2 9.1 -
7 Diabetes 14.4 12.7 30.8 21.2 9.4 -
8 Influenza and Pneumonia 12.6 12.8 10.6 10.1 9.8 -
9 Septicemia 12.6 12.1 18.6 12.5 8.6 -
Nephritis, nephrotic syndrome,
10 11.9 10.9 24.5 10.6 10.5 -
and nephrosis
* The rate of the group with the highest age-adjusted mortality appears in red. The all-cause mortality figure identifies the total number of
deaths reported by the CDC during a calendar year.
** The age-adjusted mortality rate measures the number of deaths per 100,000 individuals within a population. An age-adjustment
accounts for the age structure of a population in order to allow meaningful comparison between two groups who may have different
actual age structures.
*** Hispanic individuals can identify as any racial group. Throughout this report, White refers to Non-Hispanic Whites and Black to Non-
Hispanic Blacks.
**** Chronic Lower Respiratory Diseases affect the lungs and include Chronic Obstructive Pulmonary Disease (COPD), asthma, pulmonary
hypertension, and occupational lung diseases.
12B. A Note on Racial and Ethnic Disparity
The data reported in Tables 2 and 3 indicate why Highlights
much of the literature on health disparities is
viewed through racial and ethnic lenses. However, • Although race and ethnicity are
it is important to recognize that race and ethnicity social constructs, they are points
are socially constructed understandings of human of focus in measuring health
difference. Because they are highly correlated with disparities because race and
socioeconomic determinants of health, race and ethnicity are highly correlated
ethnicity carry significant predictive power for with socioeconomic determinants
identifying various health disparities. of health.
Thus, current understandings of racial and ethnic • Black, Hispanic, and Native
difference impact the measurement of health American populations have
disparities. Historically, comparisons of Blacks and lower educational attainment
Whites has dominated this discussion, and a vast and greater poverty rates than
literature has documented a sizable disparity between do Asian Americans and Whites,
Black and White Americans. conditions that are risk factors for
inadequate treatment of chronic
Overall, Black life expectancy is about four years less conditions.
than Whites’, but the degree of health disparity varies
by disease. For example, younger Black adults, those
in their 20s, 30s, and 40s, are more likely to live with
and die from conditions that tend to occur at older
ages in White populations.19 This is partly because
risk factors for some of these diseases—high blood
pressure among others, are not detected or are not
adequately treated in younger Black populations.
Additionally, many diseases correlate with other social
disadvantages that further exacerbate observed racial
and ethnic disparity. Compared to Asian Americans
and Whites, on average, Blacks, Hispanics, and Native
Americans have lower educational attainment and
greater poverty as well as lower home ownership
rates.
These social positions render these groups less able to
receive preventive care and to partake in “healthier”
behaviors.
13III. The Social Determinants of Health (SDoH)
The Social Determinants of
Health (SDoH)                                                              Highlights
It is critical to recognize that racial or ethnic identities   •   The roots of health disparity lie in
do not themselves drive disparate outcomes in health.              a group’s relative positioning in
Rather, they are often markers for the systemic                    the social pecking order.
discrimination and social disadvantages that do drive
health disparities: poorer living conditions, lack of          •   Social Determinants of Health
quality education, cultural and language barriers,                 (SDoH) are the material/
lower rates of health insurance, and poverty. We                   resource-based advantages
proceed with the understanding that, while medical                 or disadvantages that have
care influences health, the roots of health disparity lie          noticeable impact on a group’s
in a group’s relative positioning in the social pecking            health outcomes.
order. Such positioning is associated with various
SDoH, characteristics of which influence how a group           •   There is a powerful negative
is treated in society as well as the group’s material/             relationship between percentage
resource-based advantages or disadvantages. In                     of income spent on housing and
combination with actual clinical care and lifestyles,              life expectancy across Connecticut
SDoH shape health in powerful ways. This section                   neighborhoods (Figure 2).
examines these relationships across Connecticut
towns. The following section uses COVID-19 data to             •   Despite substandard housing,
show that health status is linked to various social,               lower income households (often
economic, and environmental disadvantages to which                 Black and Hispanic) spend
certain populations are more susceptible.                          a larger percentage of their
                                                                   income on rent. This limits
Any population’s health status and general well-                   their ability to consume healthy
being depends on three general factors, genetic                    foods, contributing to higher
propensities toward disease, socioeconomic status,                 rates of obesity and diabetes
and lifestyle choices. A discussion of genetic factors             and ultimately shortening life
is outside the scope of this report, and it should be              expectancy.
stressed that socioeconomic status and lifestyle
choices are not always separable. For example,
both obesity and diabetes are major sources of
health disparity between Blacks and Whites. It
has been well documented that much of these
disparities can be attributed directly to disparate
rates of eating unhealthy foods. Part of this can be
attributed to cultural differences in diet preferences,
but socioeconomic conditions also play a role.
Lower income individuals (disproportionately Black
Americans) may simply not be able to eat healthy
foods to the extent recommended. Despite more
frequently living in substandard housing, lower
income households must spend a larger proportion
of their income on rent, giving them less opportunity
to make healthy (often more expensive or less
conveniently obtained) food choices. Figures 2 and
3 illustrate the powerful relationship between life
expectancy and the percentages of income spent on
housing and food across Connecticut neighborhoods.

                                                                                                          15
Figure 2. Percentage of Income Spent on Housing and Life Expectancy in CT Neighborhoods
Figure 3. Percentage of Income Spent on Food and Life Expectancy in CT Neighborhoods
Description: Consumer spending data calculated by PolicyMap and Quantitative Innovations using the 2016-2017 Bureau of
Labor Statistics Consumer Expenditure Survey and the 2013-2017 U.S. Census Bureau’s American Community Survey. Housing
expenses include mortgage or rent payments, utilities, personal services such as day care or elder care, housekeeping supplies
or services, furniture, and appliances.20 Expenses on food refers to food purchased at grocery stores and meals purchased away
from home, including at restaurants, cafeterias, and vending machines.21 Life Expectancies provided by CDC 2010-2015 Small-
area Life Expectancy Estimates Project (USALEEP).22
16A. Food Access, a SDoH
Obesity and diabetes are often linked to food Highlights
insecurity. Various reports have shown alarming rates
of food insecurity among lower income minority • Diet is a determinant of many
groups. For example, in 2018, 17.3% of Hispanics and chronic diseases, such as heart
10.0% of Blacks in Connecticut reported being food disease, stroke, diabetes, and
insecure compared to 5.3% of Whites.23 cancer.
Accepted dietary guidelines indicate that people • In Connecticut, many minority
should increase consumption of nutrient-rich foods groups live in virtual food
from a young age. Intake of fruits and vegetables are deserts with limited access to
believed to reduce risk for many of the high disparity a supermarket or to affordable
diseases such as heart disease, stroke, diabetes, and fruits and vegetables.
cancers. While most individuals do not consume the
recommended distribution of food groups, those • In Connecticut, 39% of Blacks
who live in neighborhoods with better access to and 37% of Hispanics report
supermarkets and have adequate levels of income either poor or fair availability of
are better able to choose diets that support positive affordable, high-quality fruits and
health outcomes. vegetables, compared to 21% of
Whites.
Most detrimental to healthy eating habits is residence
in communities that simply lack supermarkets where
a wide variety of foods may be purchased. Many
low-income neighborhoods have become virtual
food deserts where families must either have private
transportation or spend precious income and time
on long trips on public transportation to visit a
supermarket to avoid eating fast food and buying
from relatively expensive small grocers with a lack
of variety. This phenomenon has been highlighted
by the COVID-19 pandemic because families with
low incomes living in food deserts were unable to
sufficiently stockpile supplies and practice social
distancing as much as their more advantaged
counterparts.
17B. Access to Healthcare, Another SDoH It is important to note that these SDoH are
interrelated. Neighborhoods with limited access to
Several organizations dedicated to improving health healthcare are often food deserts as well, see Figure
equity in Connecticut have identified lack of access 5. Compared to other areas, dual food desert and
to health services to be a significant problem for Medically Underserved Areas tend to have larger Black
people residing in impoverished communities. Trips to and Hispanic populations (55.2% versus 24.4%),27
hospital emergency rooms for important but relatively higher poverty rates (21.5% versus 10.1%),28 and are
mild health problems is highly expensive and leads home to higher rates of the uninsured (14.3% versus
to congestion of these services, lowering the quality 7.0%).29 The accumulation of these disadvantages
of service for those with severe conditions. Thus, translates into significant health disparities for the
lack of adequate numbers of urgent care centers in reasons discussed above.
poorer neighborhoods is a serious problem. The issue
might appear to be outside the parameters this report
has set for determining programmatic solutions to
health disparities, but that is not so. The supply of
urgent care centers in a community depends on the Highlights
demand for such services not only in the sense that
residents would be willing to use such centers, but • Life expectancy in a town falls
that they are also able to pay for them. For this reason, as the prevalence of uninsured
the expansion of health insurance to underinsured persons rises see (Figure 4).
communities should increase the supply of urgent
care centers and medical services generally in such • Blacks in Connecticut are 3 times
communities. Such reasoning was a key guiding more likely to be uninsured
principle underlying the Medicaid expansion and compared to Whites. Hispanics
insurance exchange development provisions of the are almost 4 times more likely.
Patient Protection and Affordable Care Act (ACA). These groups have also lost health
Under the ACA, more than 20 million people have insurance coverage at a greater
gained health insurance, many of whom are from rate during the pandemic.
disadvantaged groups.24
• Expansion of health insurance to
There is also a clear relationship between life underinsured communities should
expectancy and the prevalence of uninsured persons increase the supply of medical
in Connecticut neighborhoods (Figure 4a). As the services and access to care in
proportion of Blacks or Hispanics living in an area these communities.
increases, the percentage of residents who are
uninsured rises (Figures 4b and 4c). In 2018, while
only 4% of Whites were uninsured, 6% of Asian/
Pacific Islanders, 7% of Blacks and 14% of Hispanic
individuals were uninsured in Connecticut.25 Because
uninsured individuals are less likely to seek preventive
care, it is highly likely that chronic diseases go
unnoticed until they are particularly acute or require
emergency care. Consequently, the burden of disease
alongside poor disease management negatively
impacts health outcomes. Stress on the healthcare
system by the pandemic has exacerbated these
existing biases. For examples, see the notes below
Table 5.26
18Figure 4a. Uninsured Rate and Life Expectancy Across CT Neighborhoods.
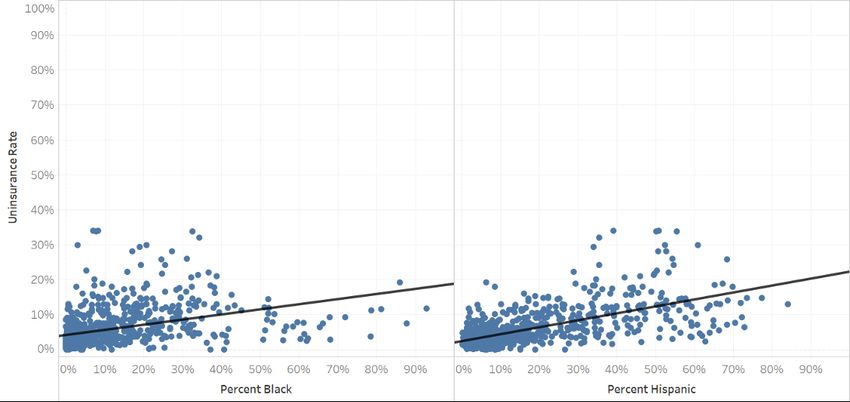
Figure 4b,4c. Percentage of Black Individuals and Percent Uninsured Across CT Neighborhoods.
Description: Uninsured rate30 and demographic percentages31 based on responses to 2014-2018 Census American Community
Survey. Life Expectancies provided by CDC 2010-2015 Small-area Life Expectancy Estimates Project (USALEEP).32 The slope of
the line in Figure 4a is -0.193035 suggesting a 5 percentage point increase in the uninsured rate reduces life expectancy by 1
year. The correlation between insurance rate and life expectancy is -0.318848.
19Figure 5. Food Deserts and Medically Underserved Areas in Connecticut Towns.
Description: Connecticut Census Tracts that have been designated as both food deserts and Medically Underserved Areas (MUAs)
are highlighted in red.
Food deserts are defined by USDA as Low-Income Tracts at least 500 people or 33% of the population living more than 0.5 miles
(in urban areas) or more than 10 miles (in rural areas) from the nearest supermarket supercenter, or large grocery store.33
Medically Underserved Areas (MUAs) are census tracts designated by the Health Resources and Services Administration to have
too few primary care providers, high infant mortality, high poverty, and/or a large elderly population.34
20Highlights
• 76 of Connecticut’s 833 census tracts are both food
and medical deserts.
• 16 Connecticut cities have two or more census
tracts that are both food and medical deserts.
• Residents of these dual desert neighborhoods are
2 times more likely to be in poverty and to
be without health insurance. They have a life
expectancy 4 years less than people not living in
food or medical deserts.
• Cities with 4 or more census tracts that are food
and medical deserts and number:
• Danbury, 8; East Hartford, 9; Hartford, 3; New
Britain, 3; New Haven, 11; Norwalk, 3; Norwich,
4; Stratford, 3; Torrington, 3; Waterbury, 5; West
Haven, 5; Windham, 4.
• In some cities, a majority of residents live in
both food and medical desert census tracts:
Danbury, 54%; East Hartford, 70%; Norwich,
63%; Windham, 72%.
Food Insecurity
• 12% of men and 15% of women report they did not
have enough money to buy food for themselves
or their family at some point during the past year.
White adults 9%; Black adults 22%, and Hispanic
adults 27% .
Data reported in highlight box above are based American Community Survey. Estimated percent of
on our calculations of data from several sources: all people without health insurance, between 2014-
2018 DataHaven Community Wellbeing Survey 2018. PolicyMap. https://plcy.mp/vL03Qy3. (14 July
Statewide Connecticut Crosstabs. New Haven, CT: 2020). CDC. Life expectancy at birth, as of 2010-2015.
DataHaven. Available at http://ctdatahaven.org/ PolicyMap. https://plcy.mp/4S9RhCT. (14 July 2020).
reports/datahaven.community.wellbeing.survey; HRSA. Medically Underserved Areas (MUA), as of 2019.
U.S. Census Bureau American Community Survey. PolicyMap. https://plcy.mp/FQn5QBJ. (3 November
Estimated percent of all people that are living in 2020). USDA. Low Income and Low Access Tract, as
poverty, as of 2014-2018. PolicyMap. https://plcy. of 2015. PolicyMap. https://plcy.mp/SCHzyYC. (3
mp/8wPZ35m. (14 July 2020). U.S. Census Bureau November 2020).
21IV. The COVID-19 Pandemic Underscores Health Disparities and a Lack of Health Equity
The COVID-19 Pandemic                                    Similarly, the proportion of deaths among Hispanics
                                                         is 12% higher than their share of the population,
Underscores Health Disparities                           although the relatively smaller discrepancy between
                                                         Hispanic population share and deaths is likely due to
and a Lack of Health Equity                              the population’s younger age distribution.

Viewing health disparities through the lens of           This phenomenon is in stark contrast to what we
COVID-19 is illuminating because risk factors for        observe among Whites, who are considerably less
infection and risk factors for death upon infection      likely to die from COVID-19 than expected given their
are clear. Although complex entanglements between        share of the population. White Americans represent
socioeconomic status (SES) and race/ethnicity still      60.4% of the population in the U.S., but they have
cannot be completely separated, exploring these          experienced 54.3% of deaths. Based on these
risk factors enables considerable separation of          estimates, if these minority groups had the same
their effects. Socioeconomic factors appear most         death rate as White Americans, about 21,200 Blacks
significant in determining who contracts the disease,    and 10,000 Hispanic Americans would not have died
while risk of death is dependent on health indicators,   from the disease.35 Clearly, minority groups are dying
namely preexisting conditions that are associated        at unnecessarily high rates.
with severe presentation of COVID-19. As discussed
previously, these medical conditions are highly
correlated with age and race/ethnicity.

Data from the 50 states and the District of Columbia
provide clear evidence of these relationships. African
Americans and Hispanics are the only groups whose
shares of COVID-19 incidence and mortality exceed
their population shares, Table 4. Hispanic Americans
represent 18.3% of the U.S. population, but as of
November 2020, suffered 24.9% of known COVID-19
cases—i.e., Hispanics contract the disease at a rate
1.3 times larger than their population share.

Similarly, Black Americans represent 13.4% of the U.S.
population, but had suffered 14.7% of known cases.
Disparities in death rates are particularly striking.
Collectively, Black Americans represent 13.4% of the
population in the U.S., but they have suffered 20.3%
of known COVID-19 deaths—i.e., they are dying at
about 1.5 times their population share. Overall, Black
Americans are over-represented in deaths in 30 states
and Washington, D.C., where their share of deaths
exceed their share of the population by as much as 10
to 30 percentage points—extremely large disparities.

                                                                                                             23
Moreover, despite much higher incidence and offer a glaring illustration of the inequities created by hospitalization rates due to COVID-19, nationwide, current policy, many of which appear race neutral on Black communities have received fewer resources to their face. combat the disease. The figures in the graphic below Original Source for the two infographics is NIHCM Data Insights 2020.
A. Racial and Ethnic Distribution of COVID-19 Cases                        seen among White residents is only about three-
   Across Connecticut                                                       quarters of the White population share, Whites are
                                                                            overrepresented in deaths, Table 5. In fact, White
Connecticut’s COVID-19 disease and mortality                                death rates are 50% greater than what would be
burdens appear to differ considerably from what                             expected if there were no group differences in mortality
might be expected given our previous discussion.                            once the disease is contracted. These findings again
While, both Black and Hispanic residents of                                 suggest that important group differences act as risk
Connecticut are disproportionately at risk of                               factors for death upon infection. This is shown by
contracting the disease, Whites are more likely to die                      Figures 7 and 8.
once infected. While the proportion of total cases

                            Table 4. U.S. COVID-19 Cases & Deaths by Race/Ethnicity, November 2020*

                                              White                 Black              Hispanic              Asian             Native

          Percent of Total
          U.S. Population36
                                             60.4%                13.4%                 18.3%                5.9%               1.3%

         COVID-19 cases37                    51.2%                14.7%                 24.9%                3.0%               1.1%

         COVID-19 deaths38                   54.3%                20.3%                 20.6%                3.8%               1.1%

                         Table 5. Connecticut COVID-19 Cases by Race/Ethnicity November 10, 202039

                                                White                     Black                   Hispanic                  Asian

     Percent of CT Population                 67.41%                   10.84%                     16.51%                   4.98%

          COVID-19 cases                      48.95%                   15.88%                     28.48%                   1.93%

         COVID-19 deaths                      73.69%                   14.69%                     9.16%                    1.09%

*The mortality data presented in tables 4 and 5 include information compiled and analyzed independently by APM research lab for 45 states
and Washington D.C. for which full or partial COVID-19 data is publicly released. It was supplemented with data available through the CDC’s
National Center for Health Statistics. Hawaii, Nebraska, New Mexico, North Dakota, South Dakota, and West Virginia were excluded because
data was not readily available.

                                                                                                                                              25
Figure 7: Share of COVID-19 Cases and Mortalities by Race/Ethnicity in Connecticut
Description: Population share, proportion of COVID-19 cases, and proportion of COVID-19 deaths by race-ethnicity in
Connecticut. Cases and deaths are cumulative as of November 10, 2020.40
Figure 8. Proportion of Cases Resulting in Death by Race/Ethnicity in Connecticut
Description: Percentage of cases resulting in death equals the number of deaths divided by the number of cases for each race-
ethnicity population subgroup. Cases and deaths are cumulative as of November 10, 2020.41
26The data in Figures 7 and 8 tells a simple but • Slightly overrepresented among deaths; their
informative story. Each section of the chart depicts share of deaths is about 9% above what they
one of the four most populous racial/ethnic groups would be were there no group differences
in Connecticut showing in succession: the group’s • Much more likely to die once infected; nearly
percentage of the state’s total population, percentage 5 times the likelihood of death within the Hispanic
of the state’s COVID-19 cases, percentage of the population
state’s COVID-19 deaths, and the likelihood of death
upon infection. If there were no group disparities, Exploring the factors contributing to the group
group observation of cases and deaths would be disparities described above allows one to understand
relatively equal to each group’s population share. the various impacts of both socioeconomic and
Each group would also be equally likely to die from medical factors, offering considerable insight into
COVID-19 once infected. However, relative to each the general patterns of health disparities present in
groups’ population share: Connecticut.
Asian or Pacific Islander Americans are: B. Plotting COVID-19 Across Connecticut Towns:
Risk Factors for Morbidity
• Significantly underrepresented with respect to
infections; 40% less than expected given their To better understand the relationship between racial/
population share ethnic disparities in disease incidence and various
• Considerably underrepresented among deaths; other covariates of the disease such as age, medical
their share of deaths is only 20% what they would conditions, and socioeconomic status, we conducted
be were there no group differences in mortality an analysis of COVID-19 case and mortality rates
• Much less likely to die once infected; only about across Connecticut towns. The findings of this
38% of Whites’ likelihood analysis illuminate how patterns of COVID-19
disparity replicate general patterns of health disparity
Blacks are: in Connecticut.
• Significantly overrepresented with respect to A statistical analysis based on multiple regression
infections; 46% more than expected given their determined that approximately 75% of the variation
population share in COVID-19 case rates within Connecticut cities
• Considerably overrepresented among deaths; could be explained by city differences in a relatively
their share of deaths is about 36% above what small number of explanatory variables. The most
they would be were there no group difference in important explanatory factors were race/ethnicity
mortality (percentage of the town’s population Black and
• Less likely to die once infected; only about 60% of Hispanic); measures of residential density (number of
Whites’ likelihood nursing home beds, presence of a carceral institution,
and percentage of detached single home residences);
Hispanics are: and distance from New York City, the epicenter of the
pandemic’s first wave.
• Significantly overrepresented with respect to
infections; 73% higher than expected given their Age. Considerable media attention has been
population share devoted to the importance of age as perhaps the
• Considerably underrepresented among deaths; most important covariate in COVID-19 mortality. As
their share of deaths is about 50% less than they expected, age is a very strong covariate of mortality in
would be were there no differences between Connecticut. 94% of all COVID-19 related deaths are
groups among people aged 60 years or greater.42 However,
• Much less likely to die once infected; only about closer examination of this phenomenon indicates that
20% of Whites’ likelihood various patterns of socioeconomic and racial/ethnic
difference persist among senior age groups.
Whites are:
Interesting dynamics underly age-related risk of
• Significantly underrepresented with respect to COVID-19 infection and mortality which can be
infections; 27% less than expected better understood when we compare variations
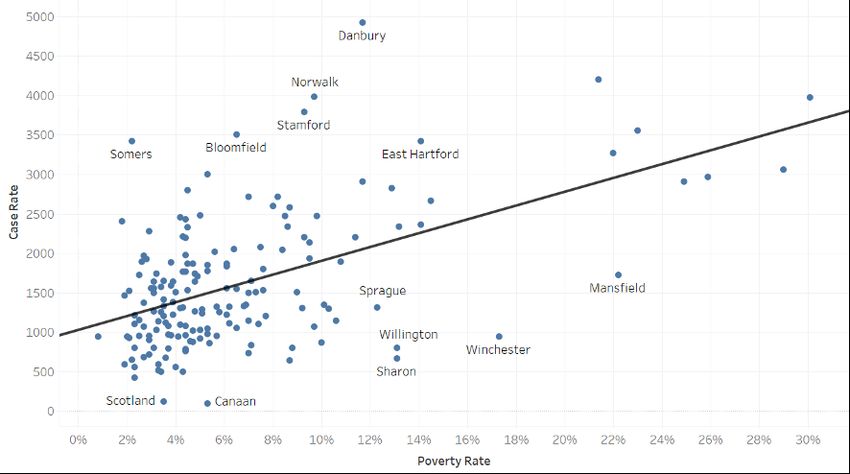
27in COVID-19 incidence across Connecticut towns.
Despite the fact that at least 81% of COVID-19 deaths
are attributed to people above age 65, as a town’s Highlights
percentage of residents above age 65 increases, the
COVID-19 caseload declines. Additionally, there is no • Over 80% of COVID-19 deaths are
relationship between a town’s COVID-19 death rate people above age 65.
and the percentage of residents age 65 or higher, see
Figures 9a and 9b. • Hispanics’ share of infections is
73% greater than their population
At first glance, the latter finding seems to contradict share.
the finding initially shared, that over 94% of all
COVID-19 deaths in Connecticut occur in people • Blacks’ share of infections is 46%
above the age of 60. How can these findings be greater than their population
reconciled? To die from COVID-19, you must first share.
contract it. The analysis of COVID-19 incidence across
Connecticut towns confirms the need to separate the • Connecticut’s elderly population
factors that lead to high rates of COVID-19 morbidity is disproportionately White and
and factors that lead to high rates of mortality among higher SES with a lower risk of
those with the disease. contracting COVID-19 unless they
live in dense housing such as a
The determinants of morbidity are more particularly nursing home.
based in those SES characteristics that put people at
risk of contraction, while the primary determinants • If they contract COVID-19, the
of mortality are underlying preexisting health factors elderly have a much higher risk of
and related demographic factors such as age. SES dying because age is correlated
differences as well as residential segregation based with health risk factors.
on SES and race/ethnicity play a strong role in causing
the disease disparities, factors making race-ethnicity
important covariates of the disease. The high
incidence of COVID-19 mortality among the elderly
occurs in nursing homes. Thus, with the exception
of towns with high proportions of nursing home beds
with dense living conditions, the risk of contracting
COVID-19 declines as the share of a Connecticut
town’s population over age 65 rises.
28You can also read