GAMES CHANGER?
An Evaluation of London as an Accessible Visitor Destination
←
→
Page content transcription
If your browser does not render page correctly, please read the page content below
GAMES CHANGER? An Evaluation of London as an Accessible Visitor Destination
COPYRIGHT

Greater London Authority
March 2013

Published by
Greater London Authority
City Hall
The Queen’s Walk
More London
London SE1 2AA
www.london.gov.uk
enquiries 020 7983 4100
minicom 020 7983 4458
Prepared by LiveTourism for the
Greater London Authority.
The views expressed in this report are
those of the consultants, and the
consumers and stakeholders who took
part in the research, and do not
necessarily represent those of the
Greater London Authority.
Copies of this report are available
from www.london.gov.uk
Games Changer?
    An evaluation of London as an
    Accessible visitor destination.

A REPORT BY LIVETOUR ISM TO THE GREATER
          LONDON AUTHORITY
              MARCH 2013
CONTENTS 1. Executive Summary 2 2. Introduction 12 3. Consumer research 17 4. Stakeholder & Desk Research 28 5. Context: The changing landscape since 2009 44 6. Conclusions 48 7. Recommendations for Change 52 8. Mapping progress - Monitoring Benchmarks 56
Games Changer?   2

  1 EXECUTIVE
    SUMMARY
Games Changer? 3
Mayor of London Boris Johnson pledged to make London’s Olympic and Paralympic Games the most
accessible ever. To help meet this pledge, in 2009 the London Development Agency (LDA)
commissioned a study to assess the accessibility of London as a visitor destination and its readiness to
welcome disabled visitors – ‘Is London Ready to Welcome Disabled Visitors?’
Following the Games, the Greater London Authority (GLA) has commissioned LiveTourism (working
with Arkenford Leisure) to replicate the study to evaluate progress made since 2009 and make
recommendations for a continuing legacy programme.
London’s can-do attitude and much celebrated visitor welcome from the Games Makers created a
positive experience subsequently communicated around the world. Wider perceptions of disability
have improved dramatically. Global success on this scale has created a legacy and an expectation of
what London can deliver in the future. The IPC Athletics World Championships in 2017 will be a major
test of whether London can live up to its enhanced reputation.
This report finds that London has become a more accessible city across all aspects of the visitor
experience since 2009. There are now opportunities to build on achievements to date.
Four key recommendations for a continuing legacy programme have emerged from the study:
Key Recommendations
Create an Accessible Visitor Experience Concordat with major stakeholders representing
every sector of the visitor journey to help continue a coordinated approach to improving
London’s accessibility
Actively promote London as an accessible visitor destination and promote the
improvements made to London’s accessibility
Review and consolidate information provided to disabled visitors
Encourage Boroughs to adopt a consistent approach to accessibility and inclusion
This study comprises three strands of research and supporting case studies:
•Consumer research into the views of disabled people and carers based on 511 online quantitative
interviews undertaken between October and November 2012
•Stakeholder research comprising 46 face-to-face and telephone interviews with businesses, public,
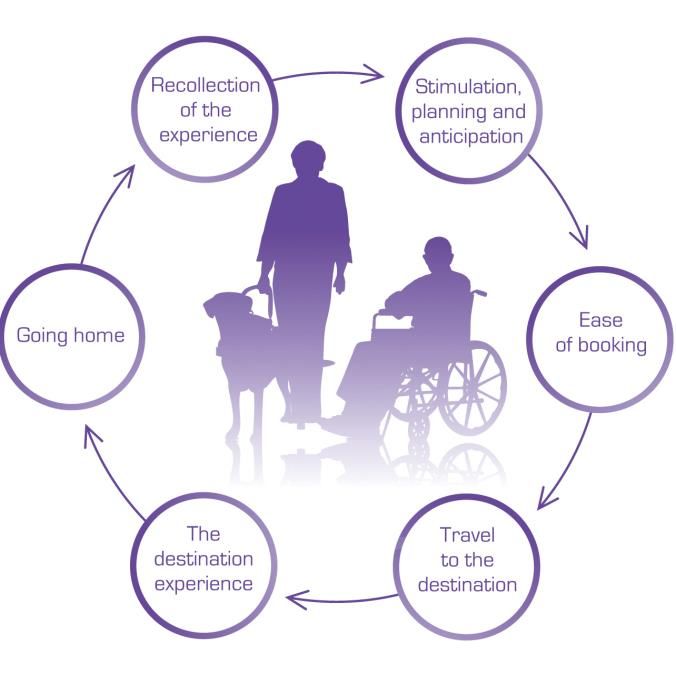
private and voluntary sector organisations (a number of which contributed to the 2009 research).Games Changer? 4 •Desk research to identify reports, studies and initiatives developed or completed since 2009 •A series of case studies (written and video) illustrating good practice in delivering an accessible visitor experience. The VisitorJourney concept is at the heart of the report’s methodology and recommendations. This recognises that the visitor experience is more than the time spent in the destination; it starts with the first decision to plan a trip, through to returning home and remembering their experience. A seamless visitor experience requires businesses and organisations to recognise the role they play in creating, delivering or influencing each stage of the journey. 1.1 Key consumer findings Between 2009 and 2012 consumer ratings of accessibility have improved across most aspects of the London visitor experience. Shopping recorded a 46% improvement (from 14% of consumers rating positively in 2009 to 60% in 2012) and transport recorded a 24% improvement (from 31% to 55%). Findings also indicate a more consistent level of access across the visitor journey resulting in a more seamless experience. In 2009, positive consumer ratings ranged widely: from a low of 14% for shopping to a high of 62% for accommodation. In 2012, positive ratings are all within a 7% range (53%-60%). However the positive ratings equate to an average of 56% across all sectors. Put in perspective a business achieving just over 50% satisfaction rates would consider there is still much to do to improve the customer experience. To ensure that the Games leave a meaningful legacy in the form of an accessible city, so must London. While findings reflect a significant shift in the views of disabled people, including that London is now regarded as being more (or at least equally) accessible than other city destinations, a caveat is the impact that the Games and the associated media coverage has had on customer perceptions. Balancing the positive consumer research with stakeholder interviews and records of what is happening ‘on the ground’ the view is that there is ‘still work to be done’. Transport: an increase; 55% of consumers rated transport positively for access (+24% increase in ratings from 2009). Consumers were more positive about: the availability of ramps/lifts, induction loops and tactile information panels; consistent audio/visual updates and staff attitude and knowledge. Reasons given for a low rating included out-of-date information and advice not being readily available. Accommodation: a decline (-9%) in positive access ratings to 53%. Mid-range hotels continue to be the most popular choice, despite a -16% decline in those using them since 2009. B&Bs are slightly more popular than they were, though a higher proportion of people consider them (23%) than actually use them (15%).
Games Changer? 5 Attractions: little change; 59% rated attractions positively for access in 2012. Strongest ratings and improvements were for information provision and staff; weaker ratings for onsite accessible facilities especially the provision of blue badge parking. 13% visited an Olympic/Paralympic venue. Eating and drinking: an increase (+12%) in positive access ratings to 59%. Some of the largest increases in ratings relate to information and staff attitude. Shopping: an increase (+46%) in positive access ratings to 60%. Improvements recorded across the board, especially in relation to information provision and staffing. Public realm: an increase (+16%) in positive access ratings to 55%. Improved ratings for accessible road crossings/dropped kerbs, clear routes and pavements, signage/way finding. Access needs: visitors ranked their most important access needs. They listed the top three as: Blue badge parking Step-free access onto public transport Staff attitude and knowledge Significant improvements have been recorded in the perceptions of staff attitude and knowledge and investment has been made in extending step-free access. However, while blue badge parking is the most important factor for visitors, customer awareness of the scheme has declined (-25%) and availability of information is a key issue. Awareness of other access schemes and initiatives is also lower, notable exceptions being access statements and the National Accessible Scheme. Similarly in relation to the websites visitors use before a trip, dedicated access sites have lost popularity and more visitors are using businesses’ own sites. Tourist board sites, while seeing lower usage than in 2009, remain popular (44% used prior to their visit). It is our view that while the research confirms significant improvements London still has some way to go and more work to do to ensure that the Olympic and Paralympic Games leave a meaningful legacy in the form of an accessible city. The chart below reflects overall access scores of key areas rated on a scale of 1 – 10 and shows the change in positive ratings – i.e. those scoring from 7 to 10 – as a comparison to 2009.
Games Changer?                                                                                        6

Overall Access Ratings – percentage positive (7 – 10)

1.2   Key stakeholder and desk research findings
Seven key themes emerged from interviews with stakeholders and desk research.

1.3 The Games provided a catalyst, focus and momentum for access improvements
Every stakeholder interviewed spoke about the positive impact of the Games in improving the
accessibility of London’s visitor experience. London’s achievements exceeded all expectations.

The Games created a reason, timeline and deadline for making access happen. Achievements came
about because organisations bought into the concept of the Games as an experience and were
committed to working differently to make change happen. Flagship projects such as the South Bank
Thames Walk improvement programme were the result of organisations working together and
recognising their role in delivering a seamless visitor journey.

1.4 Maintaining the post-Games legacy
Stakeholders reported concerns about maintaining the quality of experience post Games. The Games
created a momentum and, despite the challenges resulting from economic uncertainty and austerity
measures, there was a real determination to deliver. Without the focus of the Games, stakeholders are
now concerned that organisations will revert to their ‘normal’ ways of working.

While appreciating ‘Games time’ can’t realistically be replicated there is a risk of not sharing or
adopting the valuable lessons learned.

1.5 Existing ‘islands of good practice’ need to be linked to realise their full potential
All stakeholders cited new developments and good practice in accessibility happening around London
e.g. Oxford/Regent Street crossing, the South Bank Thames Walk improvement programme and
assisted theatre performances. There are a number of standout attractions, accommodation and
Games Changer? 7
Business Improvement Districts (BIDs) undertaking innovative works. However many examples are
potentially standalone ‘islands of good practice’. For London to become truly accessible, the visitor
needs to know where they are and be able to move easily between them.
1.6 Low awareness of available training and support
A large number of training and support resources are available for improving accessibility including
‘Destination London’ – the GLA’s online course for tourism and hospitality teams. However, low
awareness among businesses about what is available continues. Organisational change to tourism in
London requires more consideration about how best to channel resources to businesses. London &
Partners has day to day contact with tourism and hospitality businesses therefore the corporate
website would be the natural place to host Destination London.
1.7 Boroughs are balancing political agendas with evermore challenging funding
allocations
The competing demands of limited resources continue to affect London boroughs’ ability to improve
accessible facilities and services for visitors. Access Officer and Tourism Officer posts continue to
decline. Also there has been a loss of focus on visitors: boroughs’ ‘disability’ agendas are now more
concentrated on for example social welfare, benefits and housing.
Key findings relating to Boroughs:
Blue badge parking – with no one London wide online/printed reference source covering all
Boroughs, information about locations and restrictions remains fragmented and difficult to
find for visitors.
Public realm improvements – boroughs interpret guidelines differently resulting in
inconsistency of approach (and the potential for legal challenge).
Planning – some Business Improvement Districts (BIDs) report that planning policies are
preventing access improvements
Accessible toilets – boroughs are increasingly seeking alternative ways of providing facilities
due to the unsustainable cost of upkeep
Information collection – the number of access audits carried out for hospitality / tourism
businesses and organisations has increased but there are concerns about data collection and
accuracy. The resulting data rarely feeds through to mainstream visitor websites
1.8 Significant improvements made in London’s transport network
All stakeholders applauded the step-change in the accessibility of London’s transport network, while
recognising that there is a long way to go.
London Underground – massive investment and improvement since 2009. However at 150-years-
old, it remains the most inaccessible part of the city’s transport system and stakeholders urge the
Mayor not to ‘take his foot off the pedal’. Tackling London’s interchange gateways and routes to
major attractions are key factors in improving overall visitor accessibility. For example, there are nowGames Changer? 8 more step-free stations on the network, but South Kensington, which feeds several of London’s must- see attractions, is still not one of them. Overground – full upgrade since 2009 with platform extensions and a new accessible fleet. Concerns going forward are a lack of station staff and a move to automated services. Buses – led the way with the world’s first wheelchair accessible service. Despite improved facilities and training there are reports of frustration e.g. ramps not working properly, drivers not pulling into the kerb correctly. New bus driver training is planned to be introduced from summer 2013. Taxis – all 22,000 black cabs are accessible. Additional improvements made include more colour contrast, swivel seats and induction loops. River services – public sector facilities are mostly accessible, a slightly more mixed picture for the private sector. Airports – despite speculation of being underprepared for the Games, the two main London airports responded well with increased staff levels and mobility equipment. Stakeholders flagged up that this enhanced level of service is not possible outside ‘Games time’ but also recognised that lessons learnt can be taken forward and services adapted where possible. Pedestrian – many improvements made including pedestrian countdown systems, 94% of standalone pedestrian crossings with audible or tactile signals and continued work on the ‘Legible London’ way finding system. 1.9 Access information is not reaching the widest audience Since 2009, the information available to disabled visitors has undoubtedly increased, including the development of the specialist access website – ‘Inclusive London’ which offers information on tourism businesses across the capital. Inclusive London website and App has received over 12 million hits since its launch, has over 35,000 businesses registered and the App was named App of the week by the Sunday Times. This shows the value of providing such detailed information. However looking forward, stakeholders and disabled people want to see more access information available in mainstream provision and this should be the public sector focus. Private sector specialist sites will continue meeting the needs of a niche audience without public sector intervention. Public sector promotion of them however is essential. In the long term integrating access information into mainstream sites will reach a much larger audience including those people who don’t see themselves as having a disability. The above findings sit within a context of political, legislative and structural changes since 2009 which collectively carry implications for the delivery of accessibility improvements. They include the launch of the Equality Act 2010 (stakeholders flagged up a concern that ‘disability’ is losing prominence as a result); reorganisation of tourism delivery in London (loss of the quality development role for London and no specialist tourism advisor or access champion); on-going decline in the number of London borough access officers and increasing fragility of many local access groups.
Games Changer? 9 For this reason the report purposely focuses on progressive ways to maintain momentum towards the ultimate aim of an accessible city. The BIDs represent one such opportunity. They have increased in number (13-25) and have a greater impact on the visitor experience. Stakeholders identify that the pockets of investment made by BIDs need to join up in order to create a seamless visitor experience across London. 1.10 Conclusions and recommendations for change The Games created a common goal to improve accessibility, and consumer perceptions of access have improved significantly across most aspects of London’s visitor experience. Going forward, the challenge is to maintain the momentum achieved at ‘Games time’ and not revert back to ‘normal time’ (i.e. ways of operating before the Games). With the city’s access reputation at an all-time high, the pressure to meet future visitor expectation could not be greater. In 2009 we reported concern for delivery against budget restraints but stakeholders and the GLA committed to do whatever it took to showcase London during the Games. The reality going forward is that, post 2012 it will be more difficult for all businesses and organisations to make the case for allocating further funding and resources to the accessibility agenda. Without fail all stakeholders cited the need for a co-ordinating role and spoke of the clear need for political leadership to continue to progress the good practice achieved. To meet the Mayor’s vision of using the Games as a springboard for transforming London into one of the most accessible cities on earth (see http://www.london.gov.uk/accessiblegames) it is essential that there is a continuing drive to deliver the accessibility agenda with a defined action plan. In the absence of resources for one organisation to take on the London wide co-ordination role the following eight recommendations are made: 1.11 Create an Accessible Visitor Experience Concordat with major stakeholders representing every sector of the visitor journey to help continue a coordinated approach to improving London’s accessibility London needs more linkage between the main accessible tourist sites. A city wide concordat with an overall perspective of what is happening across London, coordinated by e.g. the GLA or London & Partners, would enable the many stakeholders and accessible projects to work together around the single focus of delivering a seamless visitor experience. The Mayor’s river concordat provides a good example where all parties work together, knowledgeable of what each other will deliver, support and can add. Some of the key issues to address are: Identify and work with those organisations that have direct responsibility or an influencing role in the visitor journey e.g. BIDs, and keep abreast of organisational changes Establish a communication channel for training and business support. London & Partners for example could effectively host and promote the Destination London training programme. Lobby Transport for London to continue their investment programme in step free access and other access improvements. Prioritising upgrades in line with their impact on key areas of the visitor
Games Changer? 10
economy e.g. transport options to leading attractions would help ensure that some of the main
‘attractors’ to London were accessible.
1.12 Actively promote London as an accessible visitor destination and promote the
improvements made to London’s accessibility
London’s businesses, boroughs, public sector, charities and dedicated individuals are delivering
enormous improvements and making London more accessible for visitors. This should be widely
promoted in London, nationally and internationally, helping to make substantial contributions to the
city’s visitor economy (International visitors to England with a health condition spend over £300 1
million each year). All businesses and organisations have a role to play led by London & Partners as
the official promotional organisation for London.
1.13 Review and consolidate consumer information provision
To reach the widest audience access information needs to be presented and available to visitors,
including those who don’t consider themselves to be disabled. Working with the main private sector
providers of dedicated accessibility sites to improve the prominence of the information collected, will
go some way to addressing this.
Some of the key issues to address are:
Review criteria for information collection and agree a common standard of detail - A number of
different commercial and not-for-profit organisations carry out access audits. They use different
criteria and terminology which cause confusion and mean disabled people don’t get the
information they need
Encourage London businesses to include more access information (access statement) on their own
websites
1.14 Encourage boroughs to adopt a consistent approach
Visitors don’t recognise boundaries, and inconsistent approaches leave them confused.
Some of the key issues to address are:
Blue badge parking and public toilets are particular issues and received some of the lowest positive
scores in the consumer research. To gain consistency and availability will require intervention at
different levels within boroughs.
Champion a focus on disabled visitors in borough access agendas - In tourism honey pot boroughs
a refocus on access and inclusion issues in balance with the wider remit of the Equality Act will
simultaneously benefit both visitors and residents
Showcase best practice standards in the public realm - London requires a more consistent approach
across boroughs to eliminate issues ranging from visitor confusion to legal challenge. Undertaking
more South Bank type public realm improvement schemes that link up ‘islands of good practice’
will help to achieve a more joined-up accessible visitor experience and will help to demonstrate
best practice particularly in challenging environments such as London’s historic areas.
1
Estimate based on doubling of 6 month provisional figures from International Passenger Survey 2010Games Changer? 11 1.15 Set up an official London-wide access advisory panel The Olympic Delivery Authority’s Built Environment Access Panel was very successful in helping to deliver accessible venues for the Games. This group continues to work with the London Legacy Development Corporation helping to ensure that the new development in and around the park maintain high standards of accessibility and inclusion. A similar official panel of ‘access and inclusive design professionals’ that has a London wide role could deliver the technical knowledge and experience required for access projects that is often too demanding for volunteer groups. With the demise of many local access groups and the reduction in the number of borough access officers, this recommendation becomes increasingly vital. 1.16 Share access officer resources across boroughs The decline of access officers is a continuing trend and with more funding cuts at borough level, this is unlikely to change in the short-to-medium term. More widespread and faster sharing of information and resources across boroughs would help maintain access to specialist skills as well as steer decision making. An appropriate lead on this would be London Councils. 1.17 Re-commission London’s accommodation database Disabled and older visitors should have a choice of accessible hotel accommodation in terms of location, price and facilities. Having an accurate picture of London’s accessible accommodation and the number of rooms available helps to monitor the GLA’s existing planning policy and would assist the hotel demand study. Re-commissioning the London Development Agency’s comprehensive accommodation database would be the most effective way of taking this forward and will also assist in providing information on the number of accessible hotel bedrooms in London. 1.18 Repeat consumer research to monitor progress Customer experience is the most powerful driver for change. Repeating this research every three-four years will allow a continued monitor of progress against established baselines.
Games Changer?     12

  1 INTRODUCTION
Games Changer? 13 2.1 Mayor’s Vision Speaking in Beijing ahead of the closing ceremony of the 2008 Paralympic Games, Mayor of London Boris Johnson pledged to make London’s Games the most accessible ever. The Mayor said he would work with 2012 organisers and authorities across London to ensure the capital did everything possible to maximise not only access to the Games but access to the city’s many hotels, restaurants, nightspots and other leisure venues for generations to come. “The London 2012 Games must act as a catalyst to transform access for disabled people around the city.” 2.2 London Ready to Welcome Disabled Visitors? In 2009 the London Development Agency (LDA) in partnership with the Greater London Authority (GLA) and the London Organising Committee for the Olympic Games (LOCOG) commissioned LiveTourism to study the accessibility of London as a visitor destination and its readiness to welcome disabled visitors. ‘Is London Ready to Welcome Disabled Visitors’ was published in February 2010. The report identified major initiatives underway at that time to improve accessibility in London; made recommendations on priority public sector interventions and influences and established a baseline against which to measure progress. One recommendation was to replicate the study in 2012 to enable an objective evaluation of progress and achievement. 2.3 Objectives of this evaluation This study evaluates progress made since 2009 and makes recommendations for a continuing legacy programme. The study has, using the baseline measurements and the recommendations in ‘Is London Ready to Welcome Disabled Visitors’: undertaken consumer research with a sample of 511 disabled respondents to replicate that undertaken in 2009 and evaluate progress; (see section 3) evaluated the projects and programmes put in place by the GLA and others, where appropriate, in response to these recommendations; (see Appendices) looked at the wider picture of how the public sector responded to the need to create an accessible welcome for disabled visitors to London in 2012 by undertaking key stakeholder research; (see section 4) quantified lessons learnt and identified work still needed to further improve the accessibility of the visitor experience (see section 6) considered how the economic impact to London / added value of the accessibility improvements can be measured; (see section 6) made recommendations on how to continue improving the visitor experience as part of a wider legacy programme for London; (see section 7) and identified who is best placed to continue this important work (see section 7) 2.4 The VisitorJourney Our methodology is LiveTourism’s VisitorJourney© model. It takes a visitors’ view of the six stages that make up the whole visitor experience. These stages range from their first decision to plan a visit
Games Changer?                                                                                         14

through to returning home and remembering their trip. The model clearly identifies the role each
organisation and business plays in creating a seamless and successful visitor experience.

The process recognises the crucial link between accessibility and the quality of the overall visitor
experience.

The fundamental principle of this approach is that in identifying recommendations for change, the
consumer research findings reported in section 3 should take the lead in determining how
organisations and businesses respond to visitor needs.

The recent evaluation study report (December 2012) of the Accessibility and Inclusion Integration
Group2 post-Olympic and Paralympic Games concludes that a focus on the end-to-end experience is
key to providing an all-round great experience. It is best summarised in one phrase ‘Delivering joined-
up accessibility through joined – up planning’

2.5 A note about terminology
We recognise that there are a number of different ways of defining disability and the term "disabled
people". The Greater London Authority has adopted the social model of disability, the model used by
Deaf and Disabled People’s Organisations. This includes understanding and addressing the physical
and social barriers that prevent disabled people from participating on an equal level with others.

The Equality Act 2010 defines disability as a ‘physical or mental impairment which has a substantial
and long term adverse effect on a person’s ability to carry out normal day to day activities’.

2
 The AIIG was set up by the GLA and LOCOG to focus on a joined up London 2012 Games spectator experience
across all elements of their journey - pre-trip, the London experience and travel.
Games Changer? 15 2.6 Revisiting 2009 LiveTourism commissioned a robust piece of consumer research into the views of disabled visitors staying in the capital in order to assess both London’s readiness to receive visitors and to underpin recommendations for future change. Specialist tourism market research company Arkenford conducted the research with 582 respondents in November and December 2009. 2.7 Visitor research findings from 2009: Transport was heavily criticised for being inaccessible. Facilities – where in place – were not working reliably or often enough Lack of budget accommodation options Attractions were mostly meeting the needs of disabled visitors Eating and drinking establishments received low scores for accessibility and staff attitude Disappointing access to shopping in the honey pot areas Public realm issues related to signage, pavements and lack of clear routes Experience of public toilets was hugely negative – both provision and quality Staff attitude rated low in all sectors but especially in transport, eating and drinking and shopping. LiveTourism conducted a review of recent research and policy documents including looking at the experience of other cities that hosted major sporting events. We researched the progress underway in the main sectors of the visitor economy such as accommodation, information provision and attractions. We also interviewed 46 key stakeholders in the public, private and voluntary sectors in order to identify current practice, recommendations for future improvements and baselines for monitoring progress. 2.8 Key stakeholder findings from 2009: Fragmented public sector support and intervention for access The borough role is crucial and needs reviving Information available to disabled visitors is fragmented, confusing and limited There is a proliferation of business training and support Businesses essentially go their own way Requirement to take a focused and pragmatic approach on what can be delivered between 2009 and the Olympic and Paralympic Games Recognition of the need to safeguard the legacy 2.9 The recommendations for public sector interventions were: Develop an access master plan driven by the GLA through their London 2012 City Operations Programme Appoint an access officer/mayoral advisor to manage the project Appoint an influential ‘Access champion’ Focus on public sector resources – prioritise development in Honey Pot Zones e.g. West End and South Bank Set up a single Access Advisory Forum
Games Changer? 16 Allocate responsibility for the delivery of information Review the work of all public sector bodies 2.10 Actions taken The London Development Agency published the report in February 2010 and as a result the GLA developed its Accessibility for Visitors work stream as part of its role of co-ordinating the London 2012 City Operations Programme. Following the Mayor’s devolution proposals published in June 2010, LDA functions folded into the GLA. The Accessibility for Visitors work stream transferred to the GLA’s London 2012 City Operations team, under the London Experience projects. They streamlined the work to compromise three projects: Access improvement works to the South Bank riverside walk – a capital works project to make the pedestrian route from Hungerford Bridge to Tower Bridge more accessible. Linked to the Access improvements, the project also created Photo Routes focussed on walking routes leading to the South Bank and designed for people with learning difficulties, and others who find way finding easier when illustrated by photographs (see http://photoroute.com/southbank). Information provision: Partnering with Direct Enquiries to develop Inclusive London - a website and iPhone app with information on accessible facilities throughout the capital. Website content included the results of accessibility audits of known visitor hotspots and audited hotels in the capital. Guidance and training for businesses: Destination London - a website that hosts bespoke and comprehensive training and guidance for London’s hospitality sector, to help improve accessibility in the run up to the 2012 Games. In addition, the project recruited a Paralympics Advisor to advise and identify appropriate resources and pragmatic ways to deliver an inclusive London 2012 experience across London, and to secure a Paralympic legacy for London.
Games Changer?   17

3 CONSUMER
RESEARCH
Games Changer? 18 This section reports the results of quantitative research among an audience of disabled people (either disabled individuals or someone who provides support to a disabled person) undertaken by Arkenford Ltd. Research was in the format of an online survey throughout November and early December 2012. To meet the tight timescale for the fieldwork and remain cost efficient, Arkenford used an online panel survey methodology. Online panels consist of consumers from all walks of life who are prepared to complete questionnaires on a range of subjects. The online panel we used consisted of members who stated that they have a disability, or who have a carer or support role for people with access needs. Only these members of the panel qualified to take part in the survey. We estimated that 300-500 panel members would take part in the online survey. However we achieved a higher number using this method of recruitment. We were also keen to publicise the survey to those with access needs who were not part of the online panel. To do this we invited over 70 National and local charities, representing a wide cross section of groups with access needs, to publish a link to the survey. We would like to thank those organisations who published the link encouraging people to take part. In total 511 online interviews were conducted. Please note that we have rounded- up the percentages to the nearest whole number. Some comparisons between sub-groups are based on small numbers of responses and should be treated as indicative responses. Where possible we make comparisons with the 2009 survey. 3.1 How has consumer experience changed since 2009? Consumer access ratings have shifted significantly across a number of aspects of the visitor journey since 2009, clearly indicating an improving experience for visitors to London. The 2012 study achieved a more balanced response than in 2009: Londoners made up 11% of the collected responses (compared to 46% in 2009) Regular visitors to London in the last three years made up 75% of the sample (compared to 60% in 2009) The sample contains a better cross section of day versus staying visitors to London. In 2012 the split is 66:33 day versus staying visitors (compared to 80:20 split in 2009). To complete the picture and understand perceptions of London as an accessible destination we collected responses from consumers who visited more than three years ago: In the past three years 25% of the sample hadn’t visited London (compared to 17% in 2009). In analysing the data we find that there are no significant differences between those respondents that have visited and not visited in the last three years. Where there are differences in findings we draw them out and comment accordingly.
Games Changer?                                                                                         19

As with 2009, we gathered responses from people with a range of disabilities and different age groups
and made comparisons where possible.

In 2012 we interviewed a sample of 511 online interviews compared to 589 in 2009. Analysis of the
data breaks down response by each type of consumer and the report illustrates if there are any
significant differences in response.

Overall we believe that the structure of the sample means that we have collected data that presents a
much better reflection of the visitor journey than previously. However, we should still treat the
findings with some caution.

A new question added in 2012 indicates that London is regarded as more (or at least equally)
accessible than other city destinations in the UK and abroad. Much of this reflects the substantial
investments made as a result of London’s host city status for the Olympic and Paralympic Games. This
in itself creates significant positive promotion in relation to the media coverage about how accessible
London has become (particularly for transport) which will heighten visitors’ expectations.

It is our view that while the research confirms significant improvements London still has some way to
go and more work to do to ensure that the Olympics leaves a meaningful legacy in the form of an
accessible city.

The chart below reflects overall access scores of key areas rated on a scale of 1 – 10 and shows the
change in positive ratings – i.e. those scoring from 7 to 10 – as a comparison to 2009.

Overall Access Ratings – percentage positive (7-10)
Games Changer? 20
All aspects of the visitor journey rated higher than in 2009 except for Visitor Attractions (for which the
score is similar) and accommodation (-9%). These two areas already rated significantly higher in 2009.
Retail (+52%) and transport (+24%) recorded the biggest improvements. Scores for the public realm
have also significantly improved (+16%).
What is apparent is that scores for all aspects of the visitor journey are within +/-7% indicating a more
joined up access experience for visitors.
Asked to rank their most important access needs visitors listed their top 3 as:
Blue Badge Parking
Step free access onto public transport
Staff attitude and knowledge
Comparing findings with 2009 we see that awareness of designated Blue Badge Parking is down 15%.
In fact awareness of many of the access schemes, initiatives and dedicated information sources is
much lower than recorded in 2009 (see table below).
2012 2009
Access Scheme/Initiative/Information Awareness Awareness 2012 Used
% % %
Designated Blue Badge parking 61 86 36
Shop Mobility Schemes 58 72 22
National Accessible Scheme (NAS) 34 24 7
Access Guides 30 44 14
Access Statements 29 20 9
Inclusive London Website 18 N/A 12
DisabledGo 20 34 9
None of the above 17 N/A 31
Looking at key information sources used by visitors we see a reduction in those using specific access
information sites (-12%) and specific sites run by transport providers (-12%) (This is likely to be due
to the reduced volume of Londoners in the profile) and tourism bodies (-14%), with visitors migrating
to more mainstream sites run by accommodation providers, attractions, retailers and restaurants.
Below we compare findings between 2012 and 2009 for all other aspects of the visitor journey.
Transport
The research recorded different patterns of travel behaviour compared to 2009:
A similar proportion use the underground to travel around London (2012 – 64%, 2009 – 66%)
A lower proportion use buses to travel around London (2012 – 58%, 2009 – 69%)Games Changer? 21 The river ferry is the only mode of transport being used more for travelling around London compared to 2009 (2012 – 13%, 2009 – 9%) The car is used more often for travelling to and around London than recorded in 2009: 34% used a car to travel to London (+16%) 25% used a car to travel around London (+6%) In spite of the considerable investment and effort made to improve the transport network, it would appear that fewer visitors with access needs are using the facilities. This may be due to the difference in sample profile (Londoners v non- Londoners where Londoners are more familiar with using public transport). However having a higher sample of non-Londoners will increase the proportion that have a perception of inaccessible facilities and/or lack of awareness of improvements carried out. Despite a lower % of respondents using the network, there is a significant improvement in the scores provided. As shown above, Transport receives a significantly higher overall rating than in 2009 (+24%). It also receives far higher scores in relation to certain aspects of the service: 49% are positive about the availability of ramps / lifts (+31%) 43% are positive about consistent audio / visual updates (+22%) 32% are positive about availability of induction loops (+27%) 31% are positive about the availability of tactile information panels (+25%) There has also been an improvement in relations to staff attitude and knowledge both pre and during the visit to London: 55% were positive about staff attitude and knowledge pre trip (+22%) A similar % were positive about staff during their visit The Transport sector needs to build on these improvements and continue to communicate them to visitors in a bid to give them the confidence to use the wider public transport system during their trip. Accommodation In 2012 respondents are more likely to be using mid-range accommodation more than budget hotels, a trend that is similar to 2009. Still a lower % of respondents using mid-range hotels in 2012 (37%) compared to 2009 (53%) A higher % of respondents are using B&Bs in 2012 (15%) compared to 2009 (10%) A lower % of respondents are using luxury hotels in 2012 (15%) compared to 2009 (24%) Around 10% stayed in serviced apartment / self-catering (not tested in 2009) It’s a similar position to that reported in 2009; a higher percentage consider using cheaper accommodation than the % that actually use it, indicating that this part of the sector still need to do more to meet the visitors access needs.
Games Changer? 22
The Overall Access Rating for accommodation has dropped by 9% since 2009. However the overall
scores in 2009 were higher than for other sectors and still remain on a par with all other aspects of the
visitor journey.
The positive scores however have remained consistent across all aspects of the experience. This will in
part be down to the fact that there are access schemes put in place by national tourism bodies that
clearly lay out required standards for organisations in this sector.
Pre-trip information scores are up for all aspects except for staff attitude and helpfulness
Availability of information in alternative formats during the trip is also scored less positively in 2012
Whilst this sector has continued to offer good facilities and services to those with access needs, it
cannot rest on its’ laurels, and should strive to be improving all of the time especially across lower cost
establishments.
Attractions
In 2012 we see a similar pattern in relation to the types of attractions in London that visitors go to.
The types of attraction where the research records an increase in visitors with access needs are:
66% who visited London’s Parks & Gardens (+3% on 2009)
59% who visited Heritage Sites (+20%)
35% who visited Zoos / Aquariums (+7%)
The types of attraction where the research reports a decrease include:
65% who visited Museums / Art Galleries (-4%)
50% who visited West End Theatres (-9%)
31% who visited an Exhibition Centre (-12%)
28% who visited a Music Venue (-6%)
The shift in the profile of the sample, especially the balance between traditional visitors as opposed to
Londoners, has undoubtedly had some impact on the change in behaviour, especially the increase in
visitors to London’s key visitor attractions.
It should be noted that only 13% visited an Olympic / Paralympic venue.
The overall access rating (59%) for the attractions sector was almost identical to that received in 2009
(61%).
As with the accommodation sector, attractions are in the fortunate position of having in place a
national body that has invested in a Quality Rating3 scheme that covers access needs. This means that
there are clear messages about what is required from attractions from an access point of view, and a
way of policing and assessing quality levels through rating schemes.
The result is that we have recorded a steady set of positive ratings for the sector. Information
provision and staff received the strongest ratings (and improvements) while weaker ratings are
recorded for onsite accessible facilities especially the provision of Blue Badge Parking.
3
http://www.qualityintourism.com/Games Changer? 23 63% were positive about the availability of information (+8%) 53% were positive about information in alternative formats (+14%) 65% were positive about information accuracy (+6%) 61% were positive about staff attitude and knowledge (+7%) Eating & Drinking The types of Eating and Drinking establishments respondents report visiting in 2012 follows a similar pattern to that reported in 2009. Key differences include: 56% of respondents who went to a traditional pub (+13%) 11% who visited a nightclub (-17%) We also recorded a significant proportion who visited coffee shops and sandwich bars (47% and 46% respectively). This sector has seen an increase of 12% in relation to the overall access ratings received (59% in 2012 versus 47% in 2009). The sector received a high % of positive ratings across all factors. Some of the largest increases in ratings have come from factors relating to information and staffing: 48% were positive about the availability of information (+21%) 52% were positive about information in alternative formats (+26%) 52% were positive about information accuracy (+25%) 54% were positive about staff attitude and knowledge (+24%) It is important that this sector continues to build on the fact that they have become more accessible, and these improvements must come from across the board (coffee shops through to hotel restaurants) because visitors with access needs frequent all of these types of establishment. Shopping Some comparisons can be made in relation to the shopping areas that visitors go to in London. 56% visited Oxford Street (68% visited the West End in 2009) 46% visited Covent Garden (57% in 2009) 44% visited Knightsbridge (47% in 2009) What has become clear is that while people do shop when they come to London, retail is often not the key reason or influence behind their decision to visit. It is often a secondary activity that they undertake when they are here. Despite this fact, retailers have collectively worked hard to improve the experience for people with access needs. This is reflected in the significant improvement recorded for the overall access rating that has gone up from 14% in 2009 to 60% in 2012.
Games Changer? 24 These improvements were recorded across the board, especially in relation to information provision and staffing: 51% were positive about the pre-trip availability of information (+12%) 45% were positive about pre trip information in alternative formats (+18%) 52% were positive about pre trip information accuracy (+16%) 54% were positive about staff attitude and knowledge (+29%) Even greater improvements were recorded for information provided during their visit: 55% were positive about the availability of information during their trip (+29%) 45% were positive about information in alternative formats during their trip (+35%) 52% were positive about information accuracy during their trip (+29%) This shows that the retail sector is starting to embrace the needs of those with access needs. Public Realm In 2012 we tested a different set of areas in relation to public realm, putting the emphasis on key honeypot areas in Central London that visitors were more likely to have visited. The overall access ratings for public realm have increased; 55% are now positive compared to 39% in 2009. There are specific aspects of the public realm that have improved: 56% are positive about accessible road crossings / dropped kerbs (+15%) 52% are positive about clear routes and pavements (+16%) 55% are positive about appropriate signage / way finding (+23%) 3.2 Key Conclusions from the Consumer Research All aspects of the visitor journey received a higher overall access rating. Transport and Retail record the highest % increase in relation to overall ratings Restaurants and Bars and Public Realm also record an increase in ratings Accommodation and Attractions ratings, which were most positive in 2009, have kept to the same levels The result is that London has seemingly become more accessible across all aspects of the visitor journey. Key access issues for those with access needs are: Blue badge parking Step free access Staff attitude and knowledge Significant improvement shows in relation to staff attitude and knowledge. There has also been a lot of investment in the infrastructure of the public transport network that has resulted in more stations
Games Changer? 25 offering step free access. However, despite an increase in the % of visitors travelling to and around London by car, awareness of designated Blue Badge Parking is lower than recorded in 2009. Another key change highlighted by the consumer research is in relation to information gathering. In 2012 we recorded less use of public transport or tourist board websites (-12% & -14% respectively) as well as lower use of specific access information websites (-12%). Instead we find that visitors are seeking more mainstream information, preferring to go direct to Accommodation Providers websites (+10%) as well as general hotel booking websites. They are also visiting attraction, retail and restaurant specific websites relying on these for the information in relation to accessibility. Until mainstream websites provide more detailed access information there will be a need for dedicated websites. Pleasingly this change in source has had a positive impact. Scores for the availability, content and format of information have all improved significantly since 2009 both in relation to information gathered prior to the trip as well as information gather during the trip. It should be noted however that since the 2009 survey, lots of improvements have been put in place as a result of London hosting the Olympic and Paralympic Games. This will undoubtedly have had an effect on the ratings recorded in 2012. We are hopeful therefore that London will not just rest on its’ laurels. Further needed improvements will only come if there is a continued will, level of investment and delivery of infrastructure to at least maintain overall access levels or improve them, moving forward, as has proved to be the case in the last 3 years. Research figures informing conclusions Information 91% of respondents collect information prior to their trip demonstrating the importance of getting the right information to this audience using the right channels. Mainstream – has to be in the hands of people who manage the experience for visitors, e.g. individual business websites Pre-Trip information accuracy shows improvement across all sectors. Transport 45%-63% Eating and Drinking 27%- 52% Retail 35% - 52% Accommodation & attractions have recorded some, but not marked improvement. However the ratings they received were far higher than other sectors in 2009. We know organisations in these sectors have had more sector-specific engagement with tourist boards so support has been in place since first legislation in 1995. Clearly, if you stand still you fall back in real terms because consumers have increasing demands.
Games Changer?                                                                                            26

Tools are in place that these organisations can use, but there is no channel or mechanism that enables
this insight to be cascaded down from a national organisation to a local London business.

The reasons for improvement in the transport is likely to be as a result of some of the Olympic
initiatives such as Journey Planner, better signage and way finding and a more joined up approach
amongst organisations responsible for transport. The Games proved to be a catalyst for all of this
positive activity.

We believe that the improvements recorded in the retail and eating and drinking sectors are down to
consumer demand. Many of the BIDs report that retail in particular do seize market opportunities
with both hands.

Stakeholders still have concerns in terms of how information is collected and how to keep it up to
date on specific access information websites. The consumer research shows that there is a significant
decrease in visits to these types of websites (down from 38% - 26%).

These websites have clear benefits but reach a far smaller audience than previous research has
concluded. The Stakeholder findings confirm that access information should in the long term be part
of mainstream websites as the majority of disabled people with access needs who want to manage
their whole visitor journey primarily use these.

A good example of access information that works well on mainstream websites is Access Statements.
The consumers shows an increase in awareness of these statements from 20% - 29% which coincides
with concentrated effort to increase awareness and development of them by Visit England4 and an
increase in the number of businesses writing them.

Transport
The overall access for transport has improved significantly (31% - 55%).

Public transport infrastructure received huge investment in the intervening years 2009 – 2012, e.g.
London Underground installed 90 raised platform sections in stations across the capital, confirmation
of continued use of manual platform ramps, a fully accessible bus fleet.

TfL states that despite this significant investment, a negative perception in relation to accessibility still
exists, often driven by media coverage.

The consumer research shows that numbers who use the Underground to travel around London when
they visit are in fact slightly down on 2009 (66% - 64%) and significantly lower for buses (69% -
58%).

We believe that more work is needed to publicise the investments that are being made to improve the
visit experience which will help to improve perceptions of the offer and ultimately increase numbers.
Stories such as those reported by Transport for All in relation to shorter times will help to reinforce the
positive experiences that will encourage more use.

4
    www.visitengland.com/accessstatements
Games Changer? 27 3.3 Relevant Points Coordination for Access The consumer research shows greatest improvement in overall access scores for sectors that have developed a more joined up approach since 2009, .e.g. transport operators and retailers. The Accommodation and Attraction sectors that have had a joined up approach in place since 2009 continue to receive high access scores from visitors indicating that a joined up approach can lead to longer term benefits and continued delivery of an accessible London. Blue Badge Parking Awareness of designated blue badge parking is lower than recorded in 2009. Furthermore, when we look at specific ratings across all sectors, the one that tends to be lowest is in relation to the availability of blue badge parking.
Games Changer?    28

4 STAKEHOLDER &
DESK RESEARCH
Games Changer?                                                                                         29

This section sums up the main findings from stakeholder and desk research. It draws on the visitor
research to make observations on possible future actions.

LiveTourism conducted over 46 face to face and telephone interviews with businesses, public, private
and voluntary sector organisations, a number of which contributed to the 2009 report. We sought
information about progress and successes, gaps still to address and observations about ways to
maintain the momentum created by the Games. A list of seven key themes emerged from common
strands identified by the stakeholders.

Through desk research we identified reports, studies and initiatives developed or completed since
2009.

A point of context to the research: Many consultees voiced concern about measuring the progress for
future delivery due to the challenges posed by the economic environment. Charitable organisations in
particular are finding it difficult to fulfil their access agenda and having to make some difficult
decisions in prioritising what is achievable. A number have amalgamated to strengthen resources and
impact. In 2009 we reported concern for delivery against budget restraints but stakeholders
committed to do whatever it took to ensure London delivered a seamless experience during Games
time. The reality going forward is that, post 2012 and without the catalyst of the Games, it will be
more difficult for stakeholders to make the case for allocating funding and resources to accessibility
improvements.

The Appendices list the stakeholders we consulted and an overview of industry initiatives. We thank
the consultees for their time and invaluable contributions; providing the study with informed views
and comments that helped to shape the future recommendations.

NB: this study, as in 2009, focuses on the wider visitor experience across the capital. Stakeholders
however invariably make references and comparisons to the experience at Games time.

Seven key themes emerged:
4.1 Games: provided a catalyst, focus and momentum for access improvements
London’s ability to manage the visitor experience at Games time exceeded all expectations and every
stakeholder interviewed spoke about the positive impact of the Olympic and Paralympic Games.

Pre-Games, many stakeholders, organisations and media made public pronouncements doubting
London’s ability to manage the visitor experience at Games time. In the lead up to the Games, the
public mood bought into the idea that we couldn’t do it, not realising that many organisations
responsible for delivering the visitor experience (particularly transport) were determined to show that
we could.

The results were impressive and unprecedented. The London 2012 Paralympic Games were the first
ever to sell out; they were the best and most-talked about Paralympic Games in history.

Not only did London’s stakeholders manage visitor expectations – it’s fair to say from the numerous
online reviews and positive media stories that the city exceeded them.
You can also read