ECOSOC PragueMUN 2021 - Webflow
←
→
Page content transcription
If your browser does not render page correctly, please read the page content below

PragueMUN 2021 ECOSOC
PragueMUN 2021                                                                                                        ECOSOC

 Table of Contents

 LETTER OF WELCOME ....................................................................................................... 1

 ABOUT THE COMMITTEE ................................................................................................... 2

 TOPIC A: FINDING MEASURES TO DIRECT THE GLOBAL COMMODITIES MARKET
 TOWARDS SUSTAINABLE PRODUCTION AND DISTRIBUTION ...................................... 3

     INTRODUCTION .............................................................................................................. 3

     HISTORY OF THE TOPIC................................................................................................ 5

     DISCUSSION OF THE PROBLEM ................................................................................. 10

     PREVIOUS UN INVOLVEMENT .................................................................................... 13

     POSSIBLE SOLUTIONS ................................................................................................ 14

     RELEVANT INTERNATIONAL DOCUMENTS AND FURTHER READING .................... 15

     QUESTIONS TO CONSIDER ......................................................................................... 16

 TOPIC B: ILLICIT CAPITAL ROBBING OF AFRICA ..........................................................17

     INTRODUCTION ............................................................................................................ 17

     HISTORY OF THE TOPIC.............................................................................................. 19

     DISCUSSION OF THE PROBLEM ................................................................................. 21

     PREVIOUS UN INVOLVEMENT .................................................................................... 28

     POSSIBLE SOLUTIONS ................................................................................................ 30

     BLOC POSITIONS ......................................................................................................... 34

     RELEVANT INTERNATIONAL DOCUMENTS AND FURTHER READING .................... 36

     QUESTIONS TO CONSIDER ......................................................................................... 37

 REFERENCES .....................................................................................................................38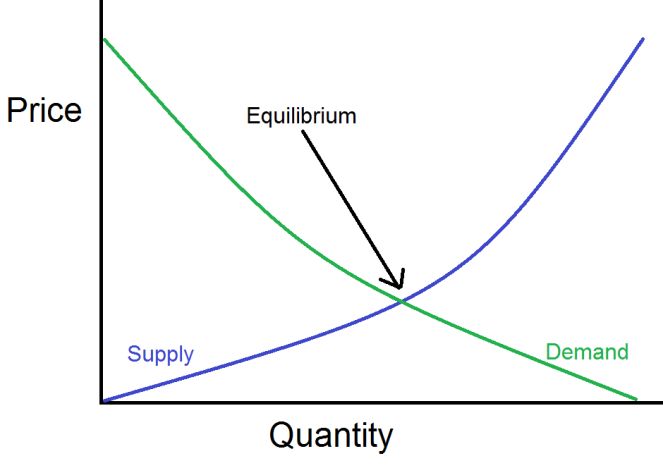
PragueMUN 2021                                                                         ECOSOC

 Letter of Welcome

 Dear delegates,

 we would like to welcome you to the Prague Model United Nations Conference 2021 and to
 the ECOSOC Committee! As your chairs we are truly excited to be part of this MUN and to
 experience how the world of MUN is adapting to the new normal of 2020/2021.

    As we are to spend a few days together, we would love to briefly introduce ourselves.
 Aspasia is a senior student at the National and Kapodistrian University of Athens. Her interests
 are mainly located within Public International Law and International Relations as well as in
 Human rights. She is an active member of AIESEC and has taken part in volunteering
 programs all over the world. Despite having participated in various MUN conferences, this will
 be her first time chairing the ECOSOC Committee.

    Žan is a citizen of Slovenia, studying Entrepreneurship at the University of Ljubljana. He
 has been MUNing for several years now and this is his second time chairing at the
 PragueMUN. MUNing has become his main hobby, while others are football, technology,
 metal/rock music, and his cats (at the moment, only Sleepy and Bela are formally his, but he
 has many “visitors” as well).

    For both of us, this is the first ECOSOC chairing experience and thus we have a lot of
 expectations. We believe that selected topics are both interesting and equally challenging and
 are looking forward to interesting and especially fruitful debates. Although the pandemic will
 limit the PragueMUN 2021 experience, we hope to have educative and exciting sessions,
 nonetheless.

 We are looking forward to our sessions!

 Aspasia and Žan

                                                1
PragueMUN 2021 ECOSOC
About the Committee
The Economic and Social Council is one of the six principal organs of the United Nations. It
was established in 1945 with the UN Charter.1 It consists of 54 Member States that have a
term for 3 years. Positions in the committee are divided according to the regional key to 14
African States, 11 Asia-Pacific States, 10 Latin American and Caribbean States and 6 Eastern
European States and 13 Western European and Other States. 2
The main goal of ECOSOC is to promote economic and social cooperation between
members of the United Nations. It is the central platform for fostering debate and innovative
thinking, forging consensus on ways forward, and coordinating efforts to achieve internationally
agreed goals. In addition, its responsibilities include following up major UN conferences and
summits. 3
It is also a coordinative body for numerous specialized agencies within the United Nations
system. The entities include regional economic and social commissions, functional
commissions facilitating intergovernmental discussions of major global issues, and specialized
agencies, programmes and funds at work around the world to translate development
commitments into real changes in people’s lives.4
The most important agenda of ECOSOC is without a doubt the 2030 Agenda for Sustainable
Development - Sustainable Development Goals (SDGs). The committee leads the way along
three pillars of the sustainable development – economic, social, and environmental.5 As of
December 2020, there were 17 SDGs, 169 targets, 1034 events, 1221 publications and 5285
actions related.6
1 ECOSOC, n.d. About Us. https://www.un.org/ecosoc/en/about-us (Last Access: January 14th, 2021).
2 ECOSOC, n.d. (b). Members. https://www.un.org/ecosoc/en/content/members (Last Access: January 14th,
2021).
3 ECOSOC, n.d. About Us. https://www.un.org/ecosoc/en/about-us (Last Access: January 14th, 2021).
4 Ibid.
5 Ibid.
6 United Nations, n.d. The 17 Goals. https://sdgs.un.org/goals (Last Access: January 14th, 2021).
2PragueMUN 2021 ECOSOC
Topic A: Finding Measures to Direct the Global Commodities
Market Towards Sustainable Production and Distribution
Introduction
In 2020, price gouging was a rather popular topic. At the beginning of the COVID-19 pandemic,
people were buying large amount of toilet paper, masks, and other necessities for the purpose
of reselling these basic commodities for a larger price. Shops were becoming empty and
people in need had no option but to buy the necessity at an exaggerated price. The
phenomenon is present in other industries as well. This is evident especially in the U.S., where
people are facing housing crisis, college debt, or issues with basic healthcare. While the U.S.
is an ideal example of this topic, the entire world lacks balance between sustainable and
massive production and distribution.
Since this topic will be discussed in ECOSOC, the issue needs to firstly be understood from
the point of basic economic graph of supply and demand. As seen in the Figure 1 below,
Supply and Demand meet at the Equilibrium. The balance between supply and demand thus
dictates, how much products will be available at what price.7
Figure 1: Relation of Supply and Demand
Source: Acting Man (2016).8
7 Kramer, L., 2019. How Does the Law of Supply and Demand Affect Prices?
https://www.investopedia.com/ask/answers/033115/how-does-law-supply-and-demand-affect-prices.asp
(December 10th, 2020).
8 Acting Man, 2016. Look Beyond Supply and Demand to Understand Labor. https://acting-man.com/?p=43953
(Last Access: January 14th, 2021).
3PragueMUN 2021 ECOSOC
While understanding the graph above in depth is beyond the scope of this Study Guide,
the following principles are essential for understanding the discussed topic:
1) If demand for a commodity increases (shifts to the right), equilibrium will move forward
the Supply curve (if ceteris paribus9), Price and Quantity will thus increase;
2) If demand for a commodity decreases (shifts to the left), equilibrium will move backward
the Supply curve (if ceteris paribus), Price and Quantity will thus decrease;
3) If supply for a commodity increases (shifts to the right), equilibrium will move forward
the Demand curve (if ceteris paribus), Price will decrease, and quantity will increase;
4) If supply for a commodity decreases (shifts to the left), equilibrium will move backward
the Demand curve (if ceteris paribus), Price will increase, and quantity will decrease.
However, the ceteris paribus condition is hard to encounter. In economics, everything is
connected, meaning that we need to find measures to direct the global supply of certain
commodities.
9
All other things held constant.
4PragueMUN 2021 ECOSOC
History of the Topic
Oil Crisis (1973)
One of the biggest events related to the global commodity market is with no doubt the Oil Crisis
of 1973. This crisis is a direct result of the Yom Kippur War (1973), between Israel (backed up
by the U.S.) and Egypt, Syria, and some other Arab States (backed up by the Soviet Union).
The war lasted almost 3 weeks and it resulted in embargo on oil towards the U.S. Since the
supply of oil dropped, the demand could no longer be satisfied. Quantity thus decreased and
prices, which were stable for decades, soared. While the crisis ended half a year later, the
prices never returned to the previous level. The U.S. market was not prepared for an oil shock
and this further resulted in a recession.10
While the oil crisis of 1973 was a result of low supply, the opposite happened in 2020. Due
to lockdowns across the globe, people spend less time in vehicles; thus, there is lower demand
for oil. Consequently, the price decreased - one barrel of crude oil cost $12.41 on April 28th,
2020.11 The oil production did, however, not stop, especially due to the additional costs that
would be incurred in case of a temporary shutdown.12
Sustainability and crude oil rarely go hand in hand. Oil spills are quite common. Such spills
destroy flora and fauna of the marine world. When we burn crude oil, greenhouse gases are
emitted into the atmosphere, which harms the ozone layer. Moreover, plastic, a product made
of crude oil, is one of the major polluters since it takes decades to disintegrate. Plastic pollutes
rivers, oceans, forests and in most cases is hard to recycle. Given the current state and style
of the world economy (consumption-driven), crude oil is produced in amounts that are not
sustainable for the planet.
10 American History USA (n.d.). The 1973 Oil Crisis and Its Effects. https://www.americanhistoryusa.com/1973-oil-
crisis-and-its-effects/ (Last Access: December 11th, 2020).
11 Statista, 2020. Weekly Brent, OPEC basket, and WTI crude oil prices from December 30, 2019 to December 7,
2020. https://www.statista.com/statistics/326017/weekly-crude-oil-prices/ (Last Access: December 11th, 2020).
12 Oberhaus, D., 2020. The world is still producing more oil than it needs. Why? https://www.wired.com/story/the-
world-is-still-producing-more-oil-than-it-needs-why/ (Last Access: December 11th, 2020).
5PragueMUN 2021 ECOSOC
Fashion Industry
Fashion industry is another industry that represents a problem for the environment. Especially
fast fashion is a major issue, since most of the clothes are produced fast, cheap and can easily
be thrown away. The global leaders in fast fashion are Spanish ZARA, Swedish H&M,
American Forever 21 and GAP.13
The entire supply chain of fast fashion cannot be considered sustainable. Disturbingly, child
labour is often included in collecting cotton and related materials for clothes present in the
developing world, where fast fashion companies seek cheap labour. The main issue with fast
fashion is the so-called “race to the bottom”, where companies need to minimalize costs to be
considered a competitor to main brands on the market.14
Production of fashion has negative effects on the environment as well as it is responsible
for 10% of all carbon emissions (more than international flights and maritime shipping
combined). Furthermore, fashion is the second largest consumer of water sources with 2,650
litres of water spent for one cotton sweater and 7,570 litres for one pair of jeans. In addition, it
pollutes waters (20% of all industrial water pollution is contributed by fashion).15
From the supply chain perspective, distribution of fashion products is also questionable.
Especially in the case of ZARA, where fashion collections are changing on a weekly basis. The
main issue with fast fashion is that supply tries to be completely suitable for demand. Trends
that are desired by consumers are quickly developed into fashion products. As soon as the life
cycle of cloth goes into the decline stage, the product is disposed.16 One garbage truck of
clothes is dumped every second. On an annual basis, disposed textile could fill one Sydney
harbour. In addition, microfibers that can be found in 60% of all garments, are released into
the wild. Approximately 500,000 tons of microfibers (equivalent to 50 billion plastic bottles) are
released into oceans due to washing clothes. Around 35% of microplastics in the ocean are
contributed to the fashion industry.17
13 Hayes, A., 2020. Fast Fashion. https://www.investopedia.com/terms/f/fast-fashion.asp (Last Access: December
13th, 2020).
14 Moulds, J, n.d. Child labour in the fashion supply chain. https://labs.theguardian.com/unicef-child-labour/ (Last
Access: December 13th, 2020).
15 McFall-Johnsen, M., 2019. The fashion industry emits more carbon than international flights and maritime
shipping combined. Here are the biggest ways it impacts the planet. https://www.businessinsider.com/fast-
fashion-environmental-impact-pollution-emissions-waste-water-2019-10 (Last Access: December 13th, 2020).
16 Ferdows, K., Machuca, J. A., & Lewis, M. A., 2014. ZARA, The world's largest fashion retailer.
https://www.thecasecentre.org/educators/ordering/selecting/featuredcases/CompetitionWinners/Zara (Last
Access: January 14th, 2021).
17 McFall-Johnsen, M., 2019. The fashion industry emits more carbon than international flights and maritime
shipping combined. Here are the biggest ways it impacts the planet. https://www.businessinsider.com/fast-
fashion-environmental-impact-pollution-emissions-waste-water-2019-10 (Last Access: December 13th, 2020).
6PragueMUN 2021 ECOSOC
Meat Industry
Meat industry is with no doubt one of the largest industries that needs to be regulated.
Nowadays, the most common types of meat are beef, veal, pork, poultry, and sheep meat. The
consumption of meat is measured in thousands of tones. Moreover, we consume animal-
related products like milk and eggs.18
In the past, there used to be numerous minor farmers that contributed their fair share.
Nowadays, there are only few big players like Tyson Foods, JBS, Cargill, Vion, etc. Moreover,
the slaughtering of animals is heavily industrialized. In 1967, there were almost 10,000
slaughterhouses in the U.S. In 2010, there are less than 3,000. Circa 88% of all animals are
slaughtered by 10 companies. To add to the perspective of industrialized process, 42 million
chickens, 170 thousand cattle and 350 thousand pigs are slaughtered per week.19
There are numerous areas associated directly or indirectly to the meat industry. Circa 70%
of usable water is spent on agriculture and 15,500 litres of water is spent for one kilogram of
beef. On the other hand, 1 out of 3 people has limited access to drinkable water and thus meat
industry is not only the environmental, but also humanitarian concern.20 Moreover, meat
industry and agriculture related to meat industry need a lot of cultivated land to operate. In
2014, 172 million hectares of the Amazon rainforest were used for animals, while the total span
of the Amazon rainforest is 670 million hectares. In addition, 32% of greenhouse gases are
connected to meat industry, 6% directly to animals in production. Approximately 27 kilograms
of CO2 is emitted to obtain one kilogram of beef. Meat industry and associated volumes of
pollution and other issues are undoubtedly one of the main obstacles towards reaching the
SDGs by the end of 2030.21
18 OECD, 2020. Meat Consumption. https://data.oecd.org/agroutput/meat-consumption.htm (Last Access: October
23rd, 2020).
19 Heinrich Böll Stiftung, 2014. Meat Atlas, Facts and figures about animals we eat.
http://www.foeeurope.org/sites/default/files/publications/foee_hbf_meatatlas_jan2014.pdf (Last Access: January
14th, 2021).
20 World Health Organization, 2019. 1 in 3 people globally do not have access to safe drinking water – UNICEF,
WHO. https://www.who.int/news/item/18-06-2019-1-in-3-people-globally-do-not-have-access-to-safe-drinking-
water-unicef-who (Last Access: October 24th, 2020).
21 Heinrich Böll Stiftung, 2014. Meat Atlas, Facts and figures about animals we eat.
http://www.foeeurope.org/sites/default/files/publications/foee_hbf_meatatlas_jan2014.pdf (Last Access: January
14th, 2021).
7PragueMUN 2021 ECOSOC
Price Gouging and Other Examples
During the 2020 pandemic, price gouging became a popular topic. While the focus will not be
placed on the most medialized commodities, such as toilet paper and other necessities,
pharmaceutical companies (the so-called Big Pharma) and housing crisis will be examined. In
addition, price gouging during popular events such as sport games and concerts, and also
piracy will be briefly presented.
When it comes to the Big Pharma, the U.S. is once more the greatest example of price
gouging. Almost 70% of all Americans use at least one prescription drug, 20% of them even
have at least 5 of them. Shockingly, medication called Xanax has for example approximately
570,000% mark-up. A consumer pays $1377,9 for 1000 tablets that cost only $0,24 to produce.
Overall, $329,2 billion was spent on medication in the U.S., while in 2013, the global revenue
of Big Pharma companies was $980 billion. Additionally, the ratio between finances spent on
research and development (R&D) and advertising is 1:19. Finally, 25% of senior Americans
skip dosage of prescribed medications in order to save money.22
Another issue that became too noticeable to ignore is the housing crisis. During the
pandemic, numerous people were left jobless or with a severe pay cut. This resulted in failure
to pay rent, which is getting absurdly high and can take more than half of one’s salary. While
in some cases, landlords reduced the rent, in other cases, eviction was a preferred option. This
then contributed to the rise of homelessness and thus faster spread of the COVID-19.23
Moreover, the rise of Airbnb cannot be ignored. Nowadays, numerous landlords around the
globe are renting flats to tourists. This not only harms the hotel industry, but also the housing
market in concerned cities. However, Airbnb is a logical decision for landlords as their daily
income is higher in comparison to renting the flat. Hence, the market is largely affected as the
supply of housing that can no longer keep up with the demand. Consequently, this results in
higher rents for non-Airbnb flats. While some major cities have already begun regulating the
housing market with regards to the Airbnb, similar practices will probably remain another
obstacle towards sustainable distribution.24
22 EMedCert, n.d. 10 Big Pharma Statistics That Will Make You Cringe. https://emedcert.com/blog/big-pharma-
statistics (Last Access: December 13th, 2020).
23 Last Week Tonight with John Oliver, 2020. Coronavirus XI: Evictions.
https://www.youtube.com/watch?v=R652nwUcJRA&list=PLAuRufR2Fo3ouO9uYxBoPDBVXdtNZmyN2&index=31
8 (Last Access: January 14th, 2021).
24 Hickey, S., Cookney, F., 2016. Airbnb faces worldwide opposition. It plans a movement to rise up in its defence.
https://www.theguardian.com/technology/2016/oct/29/airbnb-backlash-customers-fight-back-london (Last Access:
December 13th, 2020).
8PragueMUN 2021 ECOSOC
Viagogo used to be a famous example of price gouging. The platform is mainly used for
reselling tickets for numerous events (sports, concerts, etc.). In principle, it is a perfect
opportunity for people that have bought non-refundable tickets and ultimately cannot visit the
event. It is however worth noting, that this became one of the most famous examples for price
gouging on the micro level. Nowadays, people buy numerous tickets for an event and resell
them for a much higher price. Most anticipated events are sold out in few minutes. This sparked
criticism and numerous measures were done to prevent such actions, e.g. only a limited
number of tickets can be bought, or the tickets are personalized. Moreover, Google blocked
paid advertisements by Viagogo; thus, the activity on the website declined.25
Piracy, on the other hand, is illegal distribution that is exact opposite of price gouging. Illegal
downloading of copyrighted content is illegal in most countries. While there are movements
that fight for digital piracy, there are numerous arguments for prohibition of illegal downloading
of intellectual property. Moreover, according to some regulation, digital pirates could face large
fines or even 10 years in prison.26
25 Davies, R., 2019. Number of Viagogo customers dives after Google ad ban.
https://www.theguardian.com/money/2019/oct/06/number-of-viagogo-customers-dives-after-google-ad-ban (Last
Access: December 13th, 2020).
26 BBC, 2015. Online pirates could face 10 years in jail. https://www.bbc.com/news/uk-33578180 (Last Access:
December 13th, 2020).
9PragueMUN 2021 ECOSOC
Discussion of the Problem
Many problems can be directly linked to the previous issues. The main issue may be described
with the so-called Porter’s Diamond Model (Figure 2 below), an economic framework for
understanding the dynamics of a certain economy. While the framework is usually used for
domestic market, we can analyse on the global level as well. One needs to understand all six
elements (listed below) to find the issues to the global commodity market.27
Figure 2: Porter's Diamond Model
Source: Tsiligiris (2018).28
Firm Strategy, Structure and Rivalry
Nowadays, the most important market players are established in majority of economies. Most
companies also expand to other markets, use their own capital to fund joint ventures.
Franchising or Licencing is used in order to gain the competitive advantage in numerous states.
Sometimes, there are clear monopolies or oligopolies, especially in the above-mentioned
27 Business to You, 2018. Porter’s Diamond Model: Why Some Nations Are Competitive And Others Are Not.
https://www.business-to-you.com/porter-diamond-model/ (Last Access: January 14th, 2020).
28 Tsiligiris, V., 2018. An adapted Porter Diamond Model for the evaluation of transnational education host
countries.
https://www.researchgate.net/publication/322543250_An_adapted_Porter_Diamond_Model_for_the_evaluation_o
f_transnational_education_host_countries (Last Access: January 14th, 2021).
10PragueMUN 2021 ECOSOC
areas; therefore, some restrains to these areas could be beneficial. Most global companies
are located in developed countries.
Factor Conditions
Factor conditions consist of labour, resources, knowledge etc. In this area, we can notice the
shift from developed world to the developing world. As mentioned, labour and resources of the
third world countries are used by multinational companies to cheaply produce commodities
that are usually later sold at a higher margin.29 This imbalance between capital and goods
should be examined and several actions could be undertaken in this area.
Demand Conditions
In the current economic model, the supply is shaped by demand and vice versa. The free-
market economy and marketing are creating the need for a certain product. The success in the
marketing area is thus contributing to a greater demand. Higher demand creates larger issues
in relation to supply. A stabilization of the ever-growing demand is essential to prevent the rise
of mass production. However, possible measures are in various cases impossible to implement
under the current consumption-driven structure of the world economy.
Related and Supported Industries
Industries that are related to the main industry need to be well developed. Certain commodity
cannot be developed an economy without proper utilization. Consequently, shaping one
industry will directly impact all others. The spill-over effect requires a careful approach with
regards to limiting the power of one industry as the impact will be much broader. In order to
prevent any missteps, each industry should be analysed in-depth.
Government
The role of the government should never be undermined and underestimated. As the principal
actor in an economy, the government may cause the influx of certain commodity by
establishing trade deals with other nations. Moreover, it can also influence trade with certain
29Hayes, A., 2020. Fast Fashion. https://www.investopedia.com/terms/f/fast-fashion.asp (Last Access: December
13th, 2020).
11PragueMUN 2021 ECOSOC
countries by enforcing embargoes, sanctions, etc. Governmental institutions wield a great
power and influence not only over the national, but also foreign markets, the degree depending
on the overall economic strength.
Chance
The last element of the Porter’s Diamond Model is chance. Luck may sometimes shape the
economy or an industry, which is evident in the case of the 2020 pandemic, where certain
industries gained in value and certain industries collapsed. On one hand we have for instance
ZOOM, a video communication company, that gained in value since the beginning of the
pandemic.30 On another hand, we have cruise ship companies, like Royal Caribbean that are
losing value ever since the spread of the pandemic.31
30 Nasdaq, 2021. Zoom Video Communications, Inc. https://www.nasdaq.com/market-activity/stocks/zm (Last
Access: January 14th, 2021).
31 Nasdaq, 2021. Royal Caribbean Cruises Ltd. https://www.nasdaq.com/market-activity/stocks/rcl (Last Access:
January 14th, 2021).
12PragueMUN 2021 ECOSOC
Previous UN involvement
The United Nations system is already largely involved in the sustainability of humanity. The
most prominent and evident example is the 17 SDGs:32
1) No Poverty
2) Zero Hunger
3) Good Health and Well-Being
4) Quality Education
5) Gender Equality
6) Clean Water and Sanitation
7) Affordable and Clean Energy
8) Decent Work and Economic Growth
9) Industry, Innovation, and Infrastructure
10) Reduced Inequalities
11) Sustainable Cities and Communities
12) Responsible Consumption and Production
13) Climate Action
14) Life below Water
15) Life on Land
16) Peace, Justice and Strong Institutions
17) Partnership for The Goals
Especially the 12th goal is related to the discussed topic. So far, United Nations has stated
11 targets for responsible consumption and production, hosted 48 events, released 54
publications, and completed 846 actions to promote responsibility.33
32 United Nations, n.d. The 17 Goals. https://sdgs.un.org/goals (Last Access: January 14th, 2021).
33 Ibid.
13PragueMUN 2021 ECOSOC
Possible solutions
There is no evident and simple solution to fix this issue. The current economic system, so-
called “Laissez-faire” free-market economy is a system that cannot be fully sustainable. As the
saying goes: “The market will regulate itself”. The United Nations and especially ECOSOC
cannot freely intervene in the market economy. They wield a considerable influence,
nonetheless. ECOSOC can issue suggestions, recommendations; provide expertise and
assistance; serve as a common forum for international decision-makers; pressure national
leaders to uphold their commitment; utilize its reputation and powers to promote the
sustainable agenda; etc.
When it comes to oil industry, it can suggest setting an upper limit on barrels of oil per
month. When it comes to fashion industry, it can further combat child labour and promote
sustainability. It can combat meat industry by suggesting healthier diets and promote healthy
proteins and fats. ECOSOC can cooperate with World Health Organization and other
specialized UN agencies or non-governmental organizations in order to set the upper price of
medications. It should cooperate with the private sector, e.g. Airbnb to limit the current housing
crisis. Moreover, it can cooperate with tech giants to limit fraudulent practices online.
14PragueMUN 2021 ECOSOC
Relevant international documents and further reading
• Earthlings (2005) and Unity (2015)
• SDG 12: Ensure Sustainable Consumption and Production Patterns (2015)
• SDG Good Practices
• The Future is Now: Science for Achieving Sustainable Development (2019)
15PragueMUN 2021 ECOSOC
Questions to consider
1) Is your country considered developed or developing?
2) Does your country host some of the named industries or experience the associated negative
effects?
3) Does your country benefit from the current consumption-driven world economy or does it
rather suffer?
4) Would your country advocate piecemeal progress towards SGDs or would emphasize a
revolutionary change of the world economy necessary to preserve the planet?
5) How is your country successful with the implementation of the SDGs?
6) How could international community incentivise the non-state actors (esp. corporations) to
cooperate on the SDGs?
7) How can the international community protect vulnerable states against growing power and
negative influence of global corporations?
8) Should the ECOSOC assume more assertive stance and step up criticism towards
economies and corporations ignoring or even working against the overall sustainable
development agenda?
16PragueMUN 2021 ECOSOC
Topic B: Illicit Capital Robbing of Africa
Introduction
Despite the major economic development, the African continent has seen since the start of the
21st century, illicit capital flows remain one of the greatest roadblocks towards the path to
sustainable development in African countries. According to the United Nations Conference on
Trade and Development (UNCTAD) - Economic Development in Africa Report 2020, every
year, an estimated $88.6 billion, which is equivalent to 3.7% of Africa’s GDP, leaves the
continent in the form of illicit capital.34
Although there is no widely agreed-upon definition of what exactly constitutes illicit financial
flows (IFFs), an “umbrella” term would be “the illegal movement of money from one country to
the other”. As the Global Financial Integrity (an advisory organisation based in Washington)
states, IFFs constitute of money that is illegally earned, transferred or utilised. This narrow
definition of illicit financial flows covers activities including hiding the proceeds of crime,
channelling funds towards criminal destinations, and evading tariffs and taxes through
misreporting of transactions. Wider definitions generally focus on actions that are not strictly
illegal, but which are undesirable as they result in reduced tax revenues, including tax
avoidance actions such as strategic transfer pricing.35
IFFs can be limited down to three main sources: a) tax evasion, especially by government-
supported companies, and trade misinvoicing, which can be located mostly in mineral products
that are considered the power-force of African economy (diamonds, gold etc.), b) criminal
activities, such as human trafficking, gun smuggling and the drug trade and c) bribery and theft
by corrupt government officials. Historically, the majority of African countries have struggled
with these issues even before gaining their independence, so the mentality of transparency in
financial matters is still hard to find. Sub-Saharan African is the continent’s region most affected
34 UNCTAD, 2020. Economic Development in Africa Report 2020. https://unctad.org/webflyer/economic-
development-africa-report-
2020#:~:text=The%20multidisciplinary%20methodology%20adopted%20inenvironmental%20dimensions%20of%
20sustainable%20development (Last Access: January 14th, 2021).
35 Signe, Sow and Madden (2020). Illicit Financial Flows in Africa Drivers, Destinations and Policy options.
https://www.brookings.edu/wp-content/uploads/2020/02/Illicit-financial-flows-in-Africa. (Last access:December
15th,2020).
17PragueMUN 2021 ECOSOC
by those practices (38% of IFFs originated from there), with North Africa following close and
Southern African countries maintaining a steady 10-13% share.36
IFFs drain Africa of its opportunities of foreign investment and inner development. As the
UNCTAD Secretary-General Mukhisa Kituyi has stated “Illicit financial flows rob Africa and its
people of their prospects, undermining transparency and accountability and eroding trust in
African institutions”.37 Without trustworthy institutions, Africa has no hope for successful
international cooperation that could prove fruitful to its financial independence by increasing
the availability of its domestic resources. It is also far from an exaggeration to say that curbing
IFFs could help battle poverty and gender inequality, as studies have shown that it is women
and old people who are especially vulnerable to the detrimental effects of limited financing for
development.38 In OECD (Organisation for Economic Co-operation and Development)
countries, the disadvantageous treatment of low-income groups has led to feelings of
dissatisfaction towards the government and streets riots. Public outrage towards the many
cases of tax invasion by corrupt officials has been reported to other parts of the world as well,
such as the Republic of Korea and Malaysia. Is it possible, though, that Africa can change its
practices and adopt policies that will help African countries achieve the 2030 Agenda for
Sustainable Development?
36 GFI report, 2019. Illicit Financial Flows To and From 148 Developing Countries : 2006-2015.
https://gfintegrity.org/report/2019-iff-update . (Last Access: December 15th, 2020).
37 United Nations News, 2020. Illicit capital robbing Africa and its people of their future: UN trade and
development chief. https://news.un.org/en/story/2020/09/1074052 (Last Access: January 14th, 2021).
38 Laurence Boone, 2019. The time for reform is now to respond to global challenges.
http://www.oecd.org/economy/going-for-growth . (Last access : December 15th, 2020).
18PragueMUN 2021 ECOSOC
History of the Topic
IFFs in Africa are not a new phenomenon. Some of the world’s most prolific autocrats, who
have piped billions in public funds into private accounts have come from Africa. Mobutu Sese
Seko of Zaire was said to have amassed upwards of $4 billion during his 32 year tenure as
president; General Sani Abacha of Nigeria looted the Nigerian Central Bank stealing an
estimated $2 billion, only part of which has been recovered by Nigeria today; the Arab Spring
exposed the offshore assets of numerous other African leaders including Tunisian president
Ben Ali, whose family has hidden an estimated $18 billion from Tunisian authorities and the
deceased de facto ruler of Libya Muammar Gaddafi, who had assets hidden globally at
a conservative estimate of $200 billion.
Dating back to the Scramble for Africa in the late 19th century, Africa has long been the
target for resource exploitation by large multinational corporations as the continent is abundant
in diamonds, rubber, minerals, and fuels. A report issued by the Chr. Michelsen Institute
(CMI)39 suggests that given existing evidence, extractive industries are often associated with
high levels of IFFs. Reports from diamond importing countries suggest that global production
of diamonds has been routinely underreported for smuggling and tax evasion purposes, while
fuel exports accounted for almost half of IFFs from Africa between 1970 and 2008. To be more
specific, the CMI proposes four factors which make extractive industries prone to IFFs:
(1) extractive industries fall under high-level discretionary political control such as a president
or executive committee and are often prone to secrecy, (2) state companies in extractive
sectors often blur lines between personal and public interests, (3) limited competition in
extractive sectors leads to fewer corporate checks and balances, and (4) extractive sectors
often require high degrees of technical expertise and make mispricing, and falsifying reports
easier.
A lack of state capacity to enforce taxation is also another cause of IFFs in Africa. This is
best illustrated through tax revenues being lost in foreign trade through the illicit practice of
trade mispricing. Between 2005 and 2007, Nigeria, Ivory Coast, and Ghana lost $821 million,
$260 million, and $121 million, respectively, through trade mispricing to the EU and the U.S.
The OECD attributes tax evasion through trade mispricing in developing countries to a lack of
respect for the rule of law, corruption, and poor governance.40
39 Chr. Michelsen Institute (2018). Can Smallholders benefit from the new market opportunities from the extractive
industry in Tanzania? https://www.cmi.no/publications/6557-can-smallholders-benefit-from-the-new-market (Last
Access: January 14th, 2021).
40Casey Sahadath, 2014. Illicit Financial Flows and Capital Flight in Africa. https://www.e-ir.info/2014/02/14/illicit-
financial-flows-and-capital-flight-in-africa . (Last Access : December 15th, 2020).
19PragueMUN 2021 ECOSOC
However, African countries are not the only ones facing the problem of illicit capital robbing.
According to the latest report by the Global Financial Integrity (GFI)41, which studied the IFFs
in 135 developing countries from 2008 to 2017, the sum of the value gaps identified in trade
between 135 developing countries and 36 advanced economies was a staggering $8,7 trillion.
Developing countries with the largest annual average value gaps (in US dollars) in their
bilateral trade with 36 advanced economies over the ten-year period 2008-201742:
1) China – $323.8 billion;
2) Mexico – $62.9 billion;
3) Russia – $56.8 billion;
4) Poland – $40.9 billion;
5) Malaysia – $36.7 billion.
The lowest value gaps identified were between Sub-Saharan Africa’s trade with Developing
Europe, Middle East/North Africa and the Western Hemisphere. Overall, the analysis shows
that trade misinvoicing is a persistent problem across developing countries, resulting in
potentially massive revenue losses – at a time when most countries are struggling to mobilize
domestic resources to achieve the internationally-agreed 2030 Sustainable Development
Goals (SDGs).43
International cooperation is as much needed as domestically focused efforts. Low-income
countries can never become fully financially independent, if their governments rely on IFFs to
facilitate them, as prolonged reliance on revenues from natural resources or foreign aid tends
to undermine channels of responsive government, giving rise to corruption and broader failures
of accountability. However, we must not only focus on the lower-income countries, as in this
way we will miss the central driver of the problem: major financial jurisdictions like Switzerland,
the U.S. and Hong Kong, play an enormous role in producing and promoting corrupt flows
elsewhere. Tax havens undermine necessary political changes, erode good governance, and
distort economic policies. In the absence of illicit financial flows to offshore secrecy
jurisdictions, African developing countries would most probably not only have higher levels of
investment; provided that IFF negatively affect infrastructure and institutions, but investment
41 GFI Report, 2020. Trade-Related Illicit Financial Flows in 135 Developing Countries :2008-2017.
https://gfintegrity.org/report/trade-related-illicit-financial-flows-in-135-developing-countries-2008-2017 . (Last
access : December 15th, 2020).
42 Ibid.
43 GFI Report, 2020. Trade-Related Illicit Financial Flows in 135 Developing Countries :2008-2017.
https://gfintegrity.org/report/trade-related-illicit-financial-flows-in-135-developing-countries-2008-2017 . (Last
access : December 15th, 2020).
20PragueMUN 2021 ECOSOC
would also have a larger growth effect. In short, additional GDP growth might be even larger
than 3%. So, rather than asking ourselves “Why is this country corrupt”, we should ask
ourselves “What are the drivers of corruption-and where?”.
Discussion of the Problem
As stated by the previously mentioned UNCTAD 2020 report, illicitness comes from the
activities, from which flows originate, and from the cross-border characteristics of the
movements.
Tax avoidance and Trade misinvoicing
1) Evasion and Tax Havens
Tax avoidance is a global problem that affects both developed and developing countries.
Estimates of revenue losses related to global corporate taxation range from $500 billion to
$650 billion annually depending on the variables under study.44 45 Calculations of corporate tax
avoidance in the European Union, for instance, vary from €50 billion to €190 billion per year.46
Analyses of recent data show that all European Union member States have tax gaps that might
considerably exceed their health-care spending, with Italy, France and Germany topping the
list in absolute terms.
In developing countries, losses due to global corporate taxation are estimated to range from
6 to 13% of total tax revenue, versus 2 to 3% in OECD countries.47 Research findings for India,
for example, show losses of an average of $16 billion per year during 2002–2006.48 The 2008
global financial crisis played a role in raising awareness of the scale of tax evasion and other
44 Crivelli, E. et al., 2015. IMF Working Paper - Base Erosion, Profit Shifting and Developing Countries.
https://www.imf.org/external/pubs/ft/wp/2015/wp15118.pdf (Last Access: January 14th, 2021).
45 Cobham, A., Janský, P., 2018. Global distribution of revenue loss from corporate tax avoidance: re-estimation
and country results: Global Corporate Tax Avoidance. Journal of International Development.
https://www.researchgate.net/publication/323729709_Global_distribution_of_revenue_loss_from_corporate_tax_a
voidance_re-estimation_and_country_results_Global_Corporate_Tax_Avoidance/citation/download (Last Access:
January 14th, 2021).
46 Murphy, R., 2019. Corporate tax avoidance: is tax transparency the solution?: a practitioner view. Accounting
and Business Research, 49(5), p. 584-586.
https://www.tandfonline.com/doi/abs/10.1080/00014788.2019.1611728 (Last Access: January 14th, 2021).
47 Crivelli, E. et al., 2015. IMF Working Paper - Base Erosion, Profit Shifting and Developing Countries.
https://www.imf.org/external/pubs/ft/wp/2015/wp15118.pdf (Last Access: January 14th, 2021).
48 Kar, D. and Cartwright-Smith, D., 2009. Illicit Financial Flows from Developing Countries: 2002-2006.
https://ssrn.com/abstract=1341946 (Last Access: January 14th, 2021).
21PragueMUN 2021 ECOSOC
commercial dimensions of IFFs. The political urgency of addressing global corporate taxation
led to the establishment of the Base Erosion and Profit Shifting (BEPS) initiative at OECD.
Estimates by UNCTAD show that the magnitude of revenue losses due to MNE (multinational
enterprise) tax avoidance in developing countries was approximately $100 billion annually in
2012, comparable to the total annual amount of official development assistance (ODA) to
developing countries at $115 billion the same year.49
With regards to Africa, one sixth of the continent’s aggregate government revenue comes
from corporate taxation ($67 billion in 2015) and most estimates suggest that the cost of tax
avoidance is of the order of a tenth of this figure.50 Corporate taxation is a more important
share of government revenue in African countries than in OECD countries, mainly because
African countries are unable to raise as much revenue from payroll taxes.
Estimates from the African Development Bank (AfDB) show that Africa loses about $148
billion to corruption every year.51 Conservative estimates by the Stolen Asset Recovery
Initiative (StAR) based on 2007 data also show that between $20 billion and $40 billion per
year are stolen by public officials from jurisdictions in developing countries and countries with
economies in transition.52 More recently, publications by investigative journalists have
uncovered the magnitude of African private wealth in offshore accounts. In 2015, for example,
an investigation provided details on almost 5,000 individuals from 41 African countries with
assets of about $6.5 billion.53 Global-level analyses show that from 20 to 30% of private wealth
49 UNCTAD, 2015. World Investment Report 2015: Reforming International Investment Governance.
https://unctad.org/system/files/official-document/wir2015ch5_en.pdf (Last Access: January 14th, 2021).
50 Hearson, M., 2018. When Do Developing Countries Negotiate Away Their Corporate Tax Base?. J. Int. Dev.,
30(2), p. 233– 255. https://onlinelibrary.wiley.com/doi/full/10.1002/jid.3351 (last Access: January 14th, 2021).
51 African Development Bank Group, 2015. Annual Report 2015.
https://www.afdb.org/fileadmin/uploads/afdb/Documents/Generic-Documents/Annual_Report_2015_EN_-_Full.pdf
(Last Access: January 14th, 2021).
52 Van der Does de Willebois, E.; Halter, E.; Harrison, R.; Park, J.; Sharman, J., 2011. The Puppet Masters : How
the Corrupt Use Legal Structures to Hide Stolen Assets and What to Do About It. World Bank.
https://openknowledge.worldbank.org/handle/10986/2363 (Last Access: January 14th, 2021).
53 Moore, M. Et al., 2018. Taxing Africa: Coercion, Reform and Development.
https://www.researchgate.net/publication/324991438_Taxing_Africa_Coercion_Reform_and_Development (Last
Access: January 14th, 2021).
22PragueMUN 2021 ECOSOC
in many African countries is held in tax havens.54 55 56
This is higher than the global country
average of 8%.57
Financial sector representatives in secrecy jurisdictions often emphasize that capital flight
from developing countries is a morally legitimate reaction to corruption and oppression.
Banking secrecy, discretionary trusts and anonymous shell companies are argued to provide
“financial asylum” to hard-working foreigners, who want to protect their assets from predatory
and despotic regimes. However, this is “only true in a very narrow sense”.58 The problem is
that only the wealthiest and most powerful citizens in developing countries seem to have
access to offshore financial services. Capital flight to secrecy jurisdictions can therefore be
argued to undermine political progress: “… to provide an escape route for a small, wealthy and
powerful elite – the only constituency with the political strength to drive reform – is to undermine
pressure for change”.59
In a similar sense, it seems reasonable to assume that secrecy jurisdictions undermine
good governance and encourage distortions of public investment decisions in developing
countries. As a Norwegian government commission has pointed out, secrecy legislation in tax
havens provides a hiding place for various kinds of players who want to conceal the proceeds
of their activities, including the proceeds of economic crime and rent seeking. 60 By helping
kleptocratic leaders and corrupt officials hide the real sources of their income, secrecy
legislation in tax havens provides notable incentives for these persons to engage in corruption
and embezzlement in the first place. Political elites in turn may reorient public investment
towards projects and areas that offer the greatest opportunities for such illicit activities. The
most likely result is a potentially massive distortion of public investment decisions. For
54 GFI, 2017. Illicit Financial Flows to and from Developing Countries: 2005-2014. https://gfintegrity.org/gfi-iff-
report-2017_final/ (Last Access: January 14th, 2021).
55 Zucman, G., 2014. Taxing across Borders: Tracking Personal Wealth and Corporate Profits. https://gabriel-
zucman.eu/files/Zucman2014JEP.pdf (Last Access: January 14th, 2021).
56 Johannesen, N. et al., 2018. Are less developed countries more exposed to multinational tax avoidance?
https://www.nielsjohannesen.net/wp-content/uploads/WBER-RESUBMISSION-FullPaper.pdf (Last Access:
January 14th, 2021).
57Paul Akiwumi, 2020. Curbing illicit financial flows to finance sustainable development in Africa.
https://unctad.org/news/curbing-illicit-financial-flows-finance-sustainable-development-
africa#:~:text=Curbing%20illicit%20financial%20flows%20(IFFs,the%20continent%20can%20do%20so (Last
access: December 15th, 2020).
58 Herkenrath M., 2014. Tax Havens and Capital Flight from Developing Countries: The Social and Political
Implications. https://www.cairn.info/revue-d-economie-du-developpement-2014-HS02-page-131.html (Last
Access: January 14th, 2021).
59 Ibid.
60 Commission on Capital Flight from Developing Countries, 2009. Tax Havens and Development.
http://www.financialtransparency.org/wp-content/uploads/2015/04/norway_tax_report.pdf (Last Access: January
14th, 2021).
23PragueMUN 2021 ECOSOC
instance, observe that corruption correlates with larger public expenditures, but with smaller
maintenance expenditures and lower infrastructure quality.61
2) Trade misinvoicing
Trade misinvoicing can be used as a tool to move capital in or out of a country in order to
evade taxes and custom duties, to avoid quotas, for smuggling, to launder money, or as
a means of capital flight. For whatever reason misinvoicing occurs, the economic development
of the given country can be severely hindered. In the case of the African continent, the amount
of annual capital outflows to the U.S. between 2000 and 2005 increased by more than 60%.62
This capital flow occurred mostly through low priced exports, which can facilitate tax evasion,
launder money, or just move finances out of the country (capital flight). High priced imports are
in addition used for capital flows and can be used to mask illegal commissions. Data was
examined for deviations from average import and export prices as an indicator of capital flows.
Four of the top thirty African countries to move capital to the U.S. are classified as Northern
African countries. These four countries (Egypt, Algeria, Morocco, and Tunisia) alone moved
approximately $6,734 million through trade misinvoicing, while the remaining 26 Sub–Saharan
countries moved a total of $13,408 million combined. The country moving the most capital to
the U.S. through trade misinvoicing was South Africa, a Sub-Saharan country.63
The amount Africa loses to trade misinvoicing is astounding. GFI estimates that $286 billion
worth of capital was extracted out of Africa using this process over the past decade. Between
2002 and 2011, due to illicit financial flows, sub-Saharan Africa lost 5.7% of its GDP, a 20.2%
increase. Of these illicit financial flows, 62% were due to misinvoicing.64
Although the impact of trade misinvoicing is well-known, the exact technicality of it is not
understood. Poor governance and corruption may play a significant role, but the truth behind
trade misinvoicing is that it is a two-way street: it may be easy in many African countries to pay
a bribe to the customs official to make them look the other way, but that would not have been
61 Herkenrath, M. 2014. Tax Havens and CapitalFlight from Developing Countries : The Social and political
Implications. https://www.cairn.info/revue-d-economie-du-developpement-2014-HS02-page-131.html (Last
access: December 15th,2020).
62 Maria E. de Boyrie, Simon Pak, James Nelson, 2007. Capital Movement through Trade Misinvoicing : The Case
of Africa.
https://www.researchgate.net/publication/242348402_Capital_movement_through_trade_misinvoicing_The_case
_of_Africa (Last access: December 15th, 2020).
63 Ibid.
64 GFI Report, 2020. Trade-Related Illicit Financial Flows in 135 Developing Countries :2008-2017.
https://gfintegrity.org/report/trade-related-illicit-financial-flows-in-135-developing-countries-2008-2017 . (Last
access : December 15th, 2020).
24PragueMUN 2021 ECOSOC
possible without the global shadow financial system, boosted by tax havens and various
secrecy methods.
To better understand the mechanics of trade misinvoicing, we will cite an example set my
Brian LeBlanc65: imagine a hypothetical Zambian exporter of copper arranges a deal with
a buyer in the United States worth $1,000,000. Furthermore, let us assume that the Zambian
company only wishes to report $600,000 to government officials to circumvent paying mining
royalties and corporate income tax.
First, the Zambian exporter sets up a shell company in Switzerland which (because of
anonymity) cannot be traced back to him. By doing so, any transaction the Zambian exporter
conducts with the shell company will look like trade with an unrelated party. Thus, even if the
Zambian government suspects some wrongdoing, it will be very difficult, or impossible, to tie
the Zambian exporter to the shell company in Switzerland.
Second, the exporter then uses the shell company to purchase the copper from the exporter
in Zambia for a value of $600,000, $400,000 less than the true value of the copper. An invoice
that shows receipt for the $600,000 copper sale is then forwarded on to Zambia’s tax authority.
Third, the shell company in Switzerland then re-sells the copper to the ultimate buyer in the
United States for the agreed-upon $1,000,000. The importer is instructed to make a payment
to the shell company, and the goods are sent directly from Zambia to the United States without
ever even passing through Switzerland.
Thus, the Zambian exporter lowered its taxable revenue from $1,000,000 to $600,000. The
remaining $400,000 remains hidden in Switzerland where it is untaxed and unutilized for
development purposes.66
Many of such transactions are being done under the veil of anonymity and secrecy. Without
multilateral effort it is very hard for any African government to detect their roots and disclose
the beneficial owners of shell companies. Until a global solution to offshore jurisdictions and
tax havens is found, Africa will continue to struggle to achieve social and economic
development.
65 Brian LeBlanc, 2013. Trade Misinvoicing, or How to Steal from Africa. https://thinkafricapress.com/trade-
misinvoicing-how-to-steal-from-africa (Last Access: December 15th, 2020).
66 Brian LeBlanc, 2013. Trade Misinvoicing, or How to Steal from Africa. https://thinkafricapress.com/trade-
misinvoicing-how-to-steal-from-africa (Last Access: December 15th, 2020).
25PragueMUN 2021 ECOSOC
IFFs from other criminal activities
Recent estimates suggest that, on a global scale, revenues generated from 11 crimes
(trafficking in drugs, weapons, humans, human organs and cultural property; counterfeiting;
illegal wildlife trade, fishing trade, logging and mining; and crude oil theft) range from $1.6
trillion to $2.2 trillion per year.67 However, these estimates must be treated with caution as they
cannot always be equated with IFFs, given the difficulty of determining the value that moves
across borders.
Human trafficking contributes to a significant part of these flows. In 2016, along selected
routes, 2.5 million migrants worldwide were smuggled for an economic return of at least $5.5
billion to $7 billion.68 Most of these illegal activities have an impact on prospects for achieving
economic, social and environmental goals.
With regards to the illegal trade of counterfeit products, substandard malaria medicines
were responsible for the deaths of over 100,000 children in sub-Saharan Africa in 2013 alone.
Further, the global numbers associated with counterfeit malaria and tuberculosis medicines
are significantly higher.69
Similarly, illegal waste trafficking is a little-known source of illicit flows that has significant
consequences for human health and the environment. Waste trade is regulated by a number
of international environmental agreements such as the Basel Convention on the Control of
Transboundary Movements of Hazardous Waste and their Disposal, the Bamako Convention
on the Ban of the Import into Africa and the Control of Transboundary Movement and
Management of Hazardous Wastes within Africa (Bamako Convention) and the Convention to
Ban the Importation into Forum Island Countries of Hazardous and Radioactive Wastes and
to Control the Transboundary Movement and Management of Hazardous Wastes within the
South Pacific Region (Waigani Convention). Although a lack of appropriate data makes it
difficult to measure the actual extent of the problem, globally, the volume of waste traded grew
by more than 500%, from 45.6 million to 222.6 million tons during 1992–2012.70 As a part of
67 GFI, 2017. Transnational Crime is a $1.6 trillion to $2.2 trillion Annual “Business”, Finds New GFI Report.
https://gfintegrity.org/press-release/transnational-crime-is-a-1-6-trillion-to-2-2-trillion-annual-business-finds-new-
gfi-report/ (last Access: January 14th, 2021).
68 UNODC, 2018. At least 2.5 million migrants smuggled worldwide in 2016, says UNODC study.
https://www.unodc.org/unodc/en/frontpage/2018/June/at-least-2-5-million-migrants-smuggled-worldwide-in-2016--
says-unodc-study.html (Last Access: January 14th, 2021).
69 World Economic Forum, 2015. How can we stop illicit flows of money?
https://www.weforum.org/agenda/2015/02/how-can-we-stop-illicit-flows-of-money/ (Last Access: January 14th,
2021).
70 World Customs Organization, 2018. Illegal trade in waste: overview of Operation Demeter IV.
http://www.wcoomd.org/en/media/newsroom/2018/november/illegal-trade-in-waste-overview-of-operation-
demeter-iv.aspx (Last Access: January 14th, 2021).
26You can also read