New observations of NO2 in the upper troposphere from TROPOMI - Recent
←
→
Page content transcription
If your browser does not render page correctly, please read the page content below
Atmos. Meas. Tech., 14, 2389–2408, 2021
https://doi.org/10.5194/amt-14-2389-2021
© Author(s) 2021. This work is distributed under
the Creative Commons Attribution 4.0 License.

New observations of NO2 in the upper troposphere from TROPOMI
Eloise A. Marais1,2 , John F. Roberts3 , Robert G. Ryan4,5,a , Henk Eskes6 , K. Folkert Boersma6,7 , Sungyeon Choi8,9 ,
Joanna Joiner8 , Nader Abuhassan8,10 , Alberto Redondas11 , Michel Grutter12 , Alexander Cede13 , Laura Gomez14,15 ,
and Monica Navarro-Comas14
1 Department   of Geography, University College London, London, UK
2 School  of Physics and Astronomy, University of Leicester, Leicester, UK
3 Centre for Landscape and Climate Research, University of Leicester, Leicester, UK
4 School of Earth Sciences, The University of Melbourne, Melbourne, Australia
5 ARC Centre of Excellence for Climate System Science, Sydney, Australia
6 Satellite Observations Department, Royal Netherlands Meteorological Institute (KNMI), De Bilt, the Netherlands
7 Meteorology and Air Quality Group, Wageningen University (WUR), Wageningen, the Netherlands
8 NASA Goddard Space Flight Center, Greenbelt, MD, USA
9 Science Systems and Applications, Inc., Lanham, MD, USA
10 Joint Center for Earth Systems Technology, University of Maryland,Baltimore County, Baltimore, MD, USA
11 Izaña Atmospheric Research Center, AEMET, Tenerife, Canary Islands, Spain
12 Centro de Ciencias de la Atmósfera, Universidad Nacional Autónoma de México, Mexico City, Mexico
13 LuftBlick, Fritz-Konzert-Straße 4, Innsbruck, Austria
14 Instituto Nacional de Técnica Aeroespacial (INTA), Área de Investigación e Instrumentación Atmosférica, Madrid, Spain
15 Groupe de Spectrométrie Moléculaire et Atmosphérique, URM CNRS 7331, UFR Sciences Exactes et Naturelles,

Moulin de la Housse, BP 1039, 51687 Reims CEDEX 2, France
a now at: Department of Geography, University College London, London, UK

Correspondence: Eloise A. Marais (e.marais@ucl.ac.uk)

Received: 1 October 2020 – Discussion started: 8 October 2020
Revised: 13 February 2021 – Accepted: 15 February 2021 – Published: 26 March 2021

Abstract. Nitrogen oxides (NOx ≡ NO + NO2 ) in the NOx -       sliced seasonal mean UT NO2 products for June 2019 to May
limited upper troposphere (UT) are long-lived and so have a    2020 are retrieved from corrected TROPOMI total columns
large influence on the oxidizing capacity of the troposphere   using distinct TROPOMI cloud products that assume clouds
and formation of the greenhouse gas ozone. Models mis-         are reflective boundaries (FRESCO-S) or water droplet lay-
represent NOx in the UT, and observations to address de-       ers (ROCINN-CAL). TROPOMI UT NO2 typically ranges
ficiencies in models are sparse. Here we obtain a year of      from 20–30 pptv over remote oceans to > 80 pptv over lo-
near-global seasonal mean mixing ratios of NO2 in the UT       cations with intense seasonal lightning. Spatial coverage is
(450–180 hPa) at 1◦ × 1◦ by applying cloud-slicing to par-     mostly in the tropics and subtropics with FRESCO-S and ex-
tial columns of NO2 from TROPOMI. This follows refine-         tends to the midlatitudes and polar regions with ROCINN-
ment of the cloud-slicing algorithm with synthetic partial     CAL, due to its greater abundance of optically thick clouds
columns from the GEOS-Chem chemical transport model.           and wider cloud-top altitude range. TROPOMI UT NO2 sea-
TROPOMI, prior to cloud-slicing, is corrected for a 13 % un-   sonal means are spatially consistent (R = 0.6–0.8) with an
derestimate in stratospheric NO2 variance and a 50 % overes-   existing coarser spatial resolution (5◦ latitude × 8◦ longi-
timate in free-tropospheric NO2 determined by comparison       tude) UT NO2 product from the Ozone Monitoring Instru-
to Pandora total columns at high-altitude free-tropospheric    ment (OMI). UT NO2 from TROPOMI is 12–26 pptv more
sites at Mauna Loa, Izaña, and Altzomoni and MAX-DOAS          than that from OMI due to increase in NO2 with altitude from
and Pandora tropospheric columns at Izaña. Two cloud-          the OMI pressure ceiling (280 hPa) to that for TROPOMI

Published by Copernicus Publications on behalf of the European Geosciences Union.
2390                                                      E. A. Marais et al.: NO2 in the upper troposphere from TROPOMI

(180 hPa), but possibly also due to altitude differences in            Observations that have been used to better understand UT
TROPOMI and OMI cloud products and NO2 retrieval al-                NOx are mostly limited to research and commercial aircraft
gorithms. The TROPOMI UT NO2 product offers potential               campaigns. For research aircraft, the record of observations
to evaluate and improve representation of UT NOx in mod-            in the UT since the early 1990s have been sustained almost
els and supplement aircraft observations that are sporadic and      exclusively by the NASA DC8 plane, with recent contribu-
susceptible to large biases in the UT.                              tions from the German High Altitude and Long Range Re-
                                                                    search Aircraft (HALO) (Wendisch et al., 2016). There are
                                                                    also commercial aircraft campaigns, but these are mostly
                                                                    limited to heavily trafficked flight corridors that are often
                                                                    in the stratosphere at cruising altitude (Thomas et al., 2015;
1   Introduction                                                    Stratmann et al., 2016). In situ measurements of NO2 in the
                                                                    UT can also be biased by interference from NOx reservoir
Nitrogen oxides (NOx ≡ NO + NO2 ) in the upper tropo-               compounds that thermally decompose to NO2 in the instru-
sphere (UT; ∼ 8–12 km) influence the oxidizing capacity of          ment inlet (Browne et al., 2011; Reed et al., 2016). Standard
the atmosphere and global climate, as the formation and ra-         remote sensing products of NO2 from space-based nadir- and
diative forcing of tropospheric ozone are most efficient in         limb-viewing instruments provide global coverage, but ei-
the predominantly NOx -limited UT (Mickley et al., 1999;            ther as a single piece of vertical information in the tropo-
Bradshaw et al., 2000; Dahlmann et al., 2011; Worden et             sphere in the nadir as tropospheric column densities (Levelt
al., 2011). Sources of NOx to the UT include local emissions        et al., 2018) or as vertically resolved NO2 in the limb lim-
from lightning and cruising altitude aircraft, deep convec-         ited to NO2 abundances above the tropopause (Newchurch et
tive uplift of surface pollution, downwelling from the strato-      al., 1996; Brogniez et al., 2002; Sioris et al., 2004; Brohede
sphere, long-range transport, and chemical recycling of NOx         et al., 2007; Jones et al., 2012; Dubé et al., 2021).
from stable reservoir compounds (Ehhalt et al., 1992; Lamar-           Near-global research products of seasonal mean vertically
que et al., 1996; Schumann, 1997; Jaeglé et al., 1998; Brad-        resolved tropospheric NO2 have been retrieved by apply-
shaw et al., 2000; Bertram et al., 2007). The lifetime of NOx       ing the cloud-slicing technique to partial columns of NO2
in the UT varies from a few hours to a few days depending on        from the space-based Ozone Monitoring Instrument (OMI)
availability of hydrogen oxides (HOx ≡ OH + HO2 ) and per-          (Choi et al., 2014; Belmonte Rivas et al., 2015). Cloud-
oxy radicals (RO2 ) to convert NOx to reservoir compounds           slicing involves regressing clusters of partial NO2 columns
(Jaeglé et al., 1998; Bradshaw et al., 2000; Nault et al., 2016).   above optically thick clouds against corresponding cloud-top
   Current understanding of UT NOx is erroneous, as demon-          pressures. The resultant regression slopes are converted to
strated by misrepresentation in chemical transport models           NO2 mixing ratios that represent average NO2 across the
(CTMs) of the vertical distribution, relative abundance (ra-        cloud-top altitude range (Ziemke et al., 2001). The advan-
tios of NO / NO2 ), and absolute magnitude of UT NOx                tages of cloud-slicing include enhanced signal over bright
when compared to in situ measurements from research air-            optically thick clouds (van der A et al., 2020) and removal
craft (Boersma et al., 2011; Travis et al., 2016; Silvern et        of the dry stratosphere due to lack of clouds there. Near-
al., 2018). Models are used to determine the contribution of        global multiyear (2005–2007) seasonal means of UT NO2
ozone to anthropogenic climate change in the absence of re-         from cloud-sliced OMI partial columns have been shown to
liable historical measurements (Pavelin et al., 1999). Mod-         reproduce the spatial variability of UT NO2 measured with
els also provide prior information about the vertical distribu-     bias-corrected NASA DC8 aircraft measurements of NO2
tion of NO2 for retrieval of vertical column densities of NO2       over North America, though at very coarse scales (seasonal,
from space-based UV–visible instruments. Errors in these re-        32◦ × 20◦ ) (Marais et al., 2018). Even so, the OMI prod-
trievals are particularly vulnerable to biases in modelled UT       uct confirms the dominant global influence of lightning on
NO2 , due to greater sensitivity of space-based observations        UT NOx and provides global constraints on lightning NOx
to the UT than the middle and lower troposphere (Travis et          production rates (280 ± 80 mol NOx per lightning flash) and
al., 2016; Silvern et al., 2019). This impedes accurate top-        annual lightning NOx emissions (5.9 ± 1.7 Tg N) (Marais et
down inference of air quality variability, surface concentra-       al., 2018). OMI pixels are at relatively coarse resolution
tions, and precursor emissions (Stavrakou et al., 2013; Sil-        (13 km × 24 km at nadir), and there is substantial data loss
vern et al., 2019). Models include heavily parameterized rep-       after 2007 due to the so-called row anomaly (Schenkeveld
resentation of lightning (Tost et al., 2007; Allen et al., 2010;    et al., 2017; Torres et al., 2018). The recently launched (Oc-
Ott et al., 2010; Murray et al., 2012, 2013), the largest global    tober 2017) TROPOMI instrument on the Sentinel-5P satel-
influencer of NOx in the UT (Bradshaw et al., 2000; Marais          lite has the same spatial coverage as pre-row-anomaly OMI
et al., 2018), and may misrepresent the reaction kinetics and       (swath width of 2600 km) but with a finer nadir pixel reso-
physical processing of NOx for the cold, low-pressure condi-        lution of 7.2 km × 3.5 km (along track × across track) until
tions of the UT (Chang et al., 2011; Henderson et al., 2011,        5 August 2019, further refined thereafter to 5.6 km × 3.5 km
2012; Stavrakou et al., 2013; Amedro et al., 2019).                 (Argyrouli et al., 2019). This offers better cloud-resolving

Atmos. Meas. Tech., 14, 2389–2408, 2021                                              https://doi.org/10.5194/amt-14-2389-2021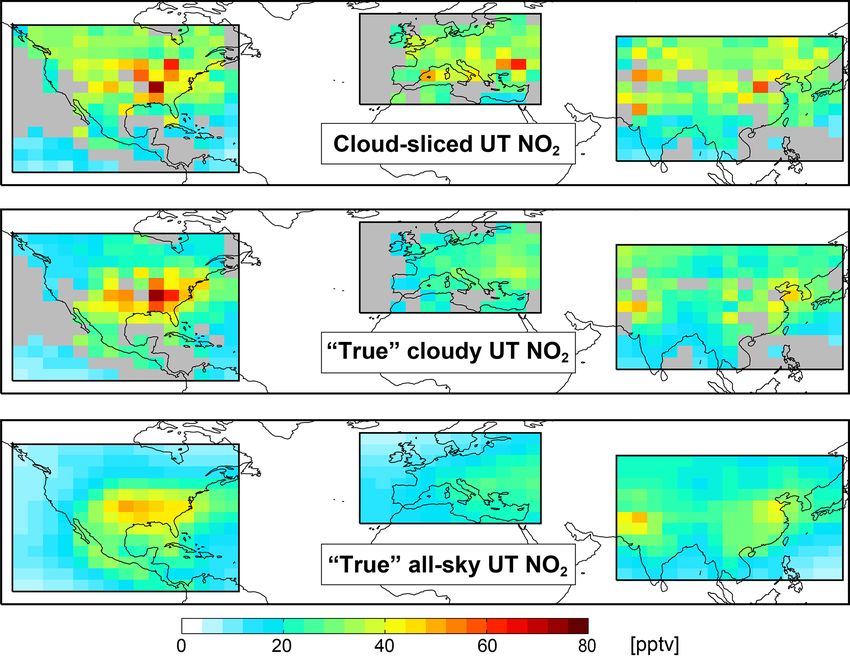
E. A. Marais et al.: NO2 in the upper troposphere from TROPOMI                                                               2391

capability and greater data pixel density than OMI with po-       years predate TROPOMI, but this has no bearing on assess-
tential to retrieve finer-resolution NO2 in the UT.               ment of the cloud-slicing technique.
   Here we refine and test the cloud-slicing retrieval us-           The cloud-slicing approach we apply to synthetic partial
ing synthetic partial NO2 columns from the GEOS-Chem              columns above synthetic clouds to estimate seasonal means
CTM before retrieving UT NO2 from TROPOMI partial                 of UT NO2 is the same as will be applied to TROPOMI, so
NO2 columns with cloud information from two distinct              model variables are only used if these are also available in
TROPOMI cloud products. Application of cloud-slicing to           or can be derived from publicly available TROPOMI data
TROPOMI follows evaluation of TROPOMI total, strato-              products. GEOS-Chem daily partial NO2 column densities
spheric, and tropospheric columns with ground-based mea-          (stratosphere + partial troposphere) and the corresponding
surements of NO2 from Pandora and multi-axis differen-            GEOS-FP cloud-top pressures at 450–180 hPa and 0.25◦ ×
tial optical absorption spectroscopy (MAX-DOAS) at free-          0.3125◦ are gathered into grid squares of the target resolution
tropospheric monitoring sites. We also evaluate TROPOMI           of 4◦ × 5◦ . Any 4◦ × 5◦ grids of gathered pixels with non-
UT NO2 with the OMI UT NO2 product.                               uniform overlying stratospheric column NO2 are discarded,
                                                                  as diagnosed with a strict stratospheric column NO2 relative
                                                                  standard deviation of 0.02. Variability in stratospheric NO2
2   Cloud-slicing of GEOS-Chem synthetic partial                  is mostly from oxidation of nitrous oxide (N2 O) in the mid-
    columns                                                       stratosphere (Crutzen, 1970). Its variability is dominated by
                                                                  solar insolation and stratospheric circulation but is also influ-
Targeting cloudy scenes could yield representation errors in      enced by upwelling from the troposphere and downwelling
NO2 mixing ratios in the UT, due to the influence of clouds       from the mesosphere (Randall et al., 1998; Gruzdev and
on NOx photochemistry (Holmes et al., 2019), large en-            Elokhov, 2011). GEOS-FP thermal tropopause heights are
hancements in NOx from lightning and convective uplift of         used to determine the vertical extent of the stratosphere in
surface pollution that accompany cloud formation (Price and       the model. As many as 256 0.25◦ × 0.3125◦ partial columns
Rind, 1992; Bertram et al., 2007), and low sampling fre-          can be gathered in a 4◦ × 5◦ grid, so we increase the num-
quency due to strict data filtering (Choi et al., 2014). We       ber of possible cloud-sliced NO2 retrievals by subdividing
test the ability of the cloud-slicing technique to return accu-   clusters of at least 100 partial NO2 columns into clusters of
rate, representative mixing ratios of NO2 in the UT by apply-     at least 40. A threshold of 80 instead of 100 yields similar
ing this technique to synthetic partial columns from GEOS-        seasonal mean UT NO2 . Subdividing the clusters of partial
Chem. The “true” NO2 used to evaluate cloud-sliced NO2 is         columns doubles the number of cloud-sliced NO2 data used
obtained by averaging NO2 across the same vertical range as       to obtain multiyear seasonal means. Additional filtering is
the cloud-sliced NO2 for the same cloudy model grid squares       applied to clusters to remove extreme NO2 partial columns
as are cloud-sliced (true cloudy UT NO2 ) and for all clear and   (partial columns falling outside the 10th to 90th percentile
cloudy model grid squares (true all-sky UT NO2 ).                 range) that have a large influence on regression of NO2 par-
   Synthetic NO2 is from GEOS-Chem version 12.1.0 (the            tial columns against cloud-top pressures, clusters with fewer
International GEOS-Chem User Community, 2018) simu-               than 10 partial columns after screening for extreme values,
lated at a horizontal resolution of 0.25◦ × 0.3125◦ (lati-        and clusters that do not extend across a sufficiently wide alti-
tude × longitude) extending over 47 vertical layers from          tude range (cloud-top pressure range ≤ 140 hPa and standard
the surface to 0.01 hPa for the nested domains available in       deviation ≤ 30 hPa). GEOS-Chem cloud-top heights are di-
version 12.1.0. These include North America (9.75–60◦ N,          agnosed in the model as the pressure at the top edge of the
130–60◦ W), western Europe (30–70◦ N, 15◦ W–61.25◦ E),            highest model layer of GEOS-FP upward moist convective
and Southeast Asia (15–55◦ N, 70–140◦ E). Dynamic (3-             mass flux.
hourly) boundary conditions are from a coarse-resolution             The slope of the relationship between cloud-top heights
(4◦ ×5◦ ) global GEOS-Chem simulation. The model is driven        and partial columns for each cluster is estimated with re-
with NASA GEOS-FP assimilated meteorology and includes            duced major axis (RMA) regression, and the standard de-
comprehensive emission inventories from anthropogenic and         viation of the slope, obtained with bootstrap resampling,
natural sources. These include local emissions of NOx in          is used as the error estimate of the slope. Additional fil-
the UT from lightning as described by Murray et al. (2012)        tering is applied to retain slopes that have low relative er-
and from aircraft using the Aviation Emissions Inventory          ror (relative error on the slope ≤ 1.0). We find that a rel-
Code (AEIC) inventory detailed in Stettler et al. (2011). The     atively large proportion of slopes (15 %) are negative and
model is simulated in boreal summer (June–August) when            would yield negative cloud-sliced UT NO2 . Most of these
variability in UT NOx in all nested domains is dominated          occur over remote regions with low NO2 concentrations.
by lightning (Marais et al., 2018). The model is sampled          These are diagnosed as slopes significantly less than zero
daily at 12:00–15:00 local time (LT) to be consistent with        (sum of slope and slope error < 0) and removed. The retained
the TROPOMI overpass time (13:30 LT). Two years (2016             slopes and errors (molec. cm−2 hPa−1 ) are converted to mix-
and 2017) are simulated to increase data density. The model       ing ratios (pptv). The derivation of the mathematical expres-

https://doi.org/10.5194/amt-14-2389-2021                                            Atmos. Meas. Tech., 14, 2389–2408, 2021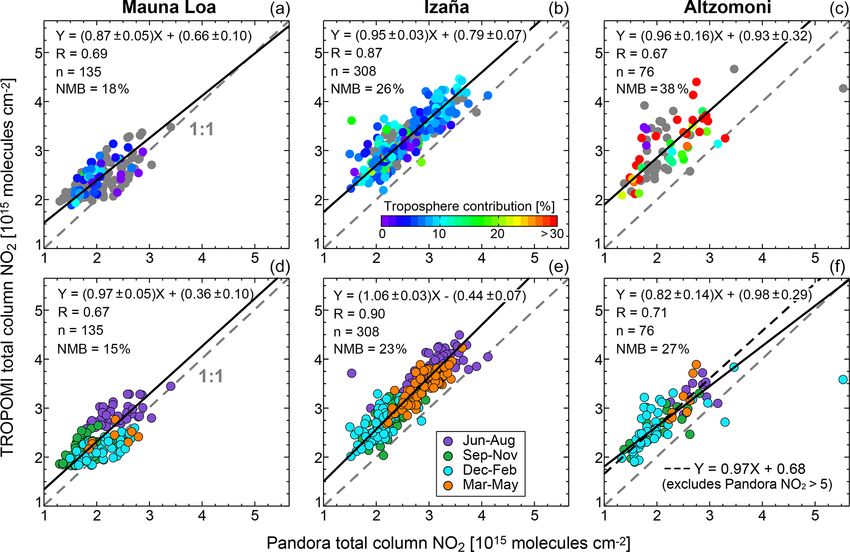
2392                                                   E. A. Marais et al.: NO2 in the upper troposphere from TROPOMI

sion for this conversion is detailed in Ziemke et al. (2001).
The final step is to remove outliers (UT NO2 > 200 pptv)
caused by steep slopes. A threshold of 200 pptv is used, as
this far exceeds the maximum seasonal mean UT NO2 of
145 pptv in the OMI cloud-sliced UT NO2 product (Marais
et al., 2018). We find that only three cloud-sliced retrievals
exceed 200 pptv. Seasonal means are obtained by Gaussian-
weighting individual estimates of cloud-sliced UT NO2 to
the pressure
            centre (315 hPa).  Gaussian
                                            weights are calcu-
lated as exp −(p − 315)2 2 × 1352 , where p is the
mean cloud-top pressure of the gathered points used in the
cloud-sliced UT NO2 retrieval, 315 hPa is the pressure cen-
tre, and 135 hPa is the distance from the pressure centre to
the edges.
   The cloud-slicing retrieval adopted here is mostly simi-
lar to that applied to OMI to estimate mid-tropospheric NO2
at 900–650 hPa (Choi et al., 2014) and UT NO2 at 450–
                                                                 Figure 1. Comparison of synthetic cloud-sliced and true NO2 in the
280 hPa (Marais et al., 2018). We extend the ceiling of the
                                                                 upper troposphere (UT) for June–August 2016–2017. Maps show
retrieval to 180 hPa (∼ 12.5 km) to better capture the ver-
                                                                 UT NO2 at 4◦ ×5◦ from cloud-slicing GEOS-Chem partial columns
tical extent of the upper troposphere. Another notable dis-      above all clouds with cloud-top pressures at 450–180 hPa (top), as
tinction is that the method applied to OMI used vertical gra-    grid-average mixing ratios from GEOS-Chem for the same scenes
dients of NO2 from the NASA Global Modeling Initiative           as are cloud-sliced (middle), and for all-sky (clear and cloudy)
(GMI) CTM to diagnose scenes with non-uniform NO2 , to           scenes (bottom). Data are Gaussian-weighted to the pressure cen-
satisfy the assumption that NO2 is vertically uniform for        tre (315 hPa). Grey grids have < 5 data points.
conversion of regression slopes to mixing ratios (Ziemke et
al., 2001; Choi et al., 2014). The threshold used for this is
0.33 pptv hPa−1 . We dispense with this step, as its applica-    and 37 % more at 8◦ × 10◦ . The increasingly positive bias
tion to TROPOMI requires a model at a similar fine spatial       with spatial resolution is because a greater relative proportion
resolution to TROPOMI, and CTMs may underestimate ver-           of clusters with NO2 vertical gradients ≥ 0.33 pptv hPa−1 are
tical NO2 gradients in the UT (Boersma et al., 2011; Travis      retained at coarser resolution. The percentage retained rela-
et al., 2016; Silvern et al., 2018). Anyway, we find that the    tive to all clusters with more than 10 data points and uniform
strict filtering applied to GEOS-Chem partial columns re-        overlying stratospheric NO2 increases from 9 % for 2◦ ×2.5◦
moves most (85 %) scenes with absolute NO2 vertical gra-         to 15 % for 4◦ × 5◦ and 23 % for 8◦ × 10◦ . Maps of syn-
dients ≥ 0.33 pptv hPa−1 for a target resolution of 4◦ × 5◦ .    thetic cloud-sliced UT NO2 at 2◦ × 2.5◦ and 8◦ × 10◦ are in
   Figure 1 shows GEOS-Chem seasonal mean cloud-sliced           Fig. S1 in the Supplement. Strict data filtering in the cloud-
and true cloudy UT NO2 at 4◦ × 5◦ . The latter is also           slicing steps removes 90 % of the clusters of GEOS-Chem
Gaussian-weighted to 315 hPa. The uncertainty in individ-        partial columns for the 4◦ × 5◦ product. Most (33 %) data
ual cloud-sliced values, estimated as the RMA regression         loss is due to the strict relative standard deviation threshold
slope error, ranges from 6 % to the imposed error limit, 99 %.   applied to stratospheric NO2 . Cloud-slicing is very sensitive
This is reduced to < 2 % for the multiyear seasonal means        to this threshold. Relaxing it from a relative standard devi-
in Fig. 1 due to temporal averaging. Agreement between           ation of 0.02 to 0.03 increases data retention from 10 % to
the cloud-sliced and true cloudy UT NO2 is shown in the          17 % but increases the positive bias in cloud-sliced UT NO2
scatterplot in Fig. 2. Successful cloud-sliced retrievals can    from 17 % to 45 %. This is due to an increase in the contri-
exceed 35 for many grid squares, though these do not ex-         bution of variability in the stratosphere to the cloud-slicing
hibit better agreement with the “truth” than the grid squares    regression slopes.
with fewer (< 10) retrievals. The two datasets are spatially        Also shown in Fig. 1 is the true all-sky UT NO2 obtained
consistent (R = 0.64) and exhibit similar variance (slope =      for all (cloudy and clear) scenes across 450–180 hPa. Model
1.1±0.1). The cloud-sliced UT NO2 has a small positive off-      grids with stratospheric influence are identified and removed
set in background UT NO2 (intercept = 2.3 ± 1.2 pptv). On        using GEOS-FP tropopause heights that are updated hourly
average, cloud-sliced UT NO2 is 17 % more than the true          in the model. The true cloudy UT NO2 is 17 % more than
cloudy UT NO2 , but this depends on the spatial resolution       the true all-sky UT NO2 . Spatial resolution influences the
of the retrieved cloud-sliced product. Regression slopes in-     size of this difference, increasing from 11 % at 2◦ × 2.5◦ to
crease from 0.87±0.03 for cloud-sliced UT NO2 obtained at        22 % at 8◦ × 10◦ . This suggests that isolating cloudy scenes
2◦ × 2.5◦ to 1.4 ± 0.2 at 8◦ × 10◦ , and the cloud-sliced UT     induces a 11 %–22 % bias in seasonal mean NO2 that could
NO2 is 4.1 % less than the true cloudy UT NO2 at 2◦ × 2.5◦       be due to a combination of poor data retention (low sam-

Atmos. Meas. Tech., 14, 2389–2408, 2021                                            https://doi.org/10.5194/amt-14-2389-2021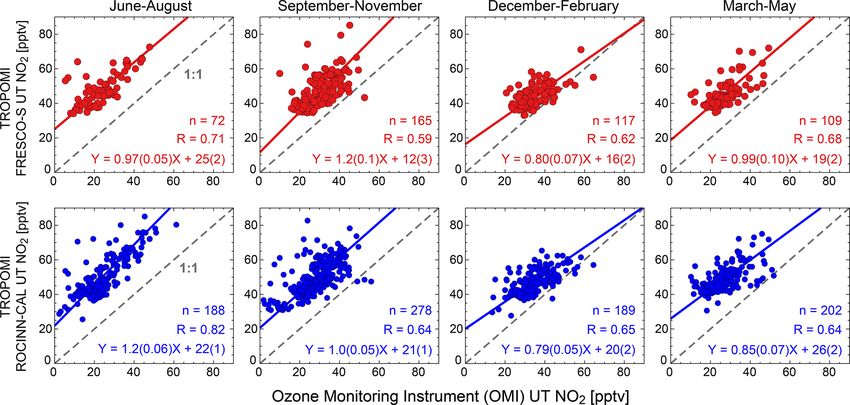
E. A. Marais et al.: NO2 in the upper troposphere from TROPOMI                                                                  2393

                                                                       true cloudy UT NO2 increases from 17 % to 24 %. This is be-
                                                                       cause a 1 km decrease in cloud-top altitude leads to a larger
                                                                       relative increase in the column above high-altitude clouds
                                                                       than low-altitude clouds, leading to steeper regression slopes
                                                                       and larger UT NO2 .

                                                                       3   Evaluation of TROPOMI with ground-based
                                                                           instruments at high-altitude sites

                                                                       Pandora spectrometer systems provide observations of to-
                                                                       tal and free-tropospheric columns of NO2 using direct sun,
                                                                       direct moon, and sky radiance observations (Herman et
                                                                       al., 2009; Cede et al., 2019). Those at high-altitude sites (>
Figure 2. Scatter plot of synthetic cloud-sliced versus true cloudy    2 km or < 800 hPa) have limited influence from the planetary
NO2 in the upper troposphere (UT). Points are 4◦ × 5◦ seasonal         boundary layer (typically extending to 1–2 km altitude) and
means from Fig. 1 (top and middle panels) coloured by the number       so are used here to evaluate TROPOMI NO2 total columns
of successful cloud-sliced retrievals. Values inset are the RMA re-    of the free troposphere (middle and upper troposphere)
gression statistics and Pearson’s correlation coefficient (R). Slope   and stratosphere. These include long-term Pandora instru-
and intercept errors are from bootstrap resampling.                    ments at Mauna Loa, Hawaii (19.48◦ N, 155.60◦ W, 4.2 km
                                                                       above sea level or a.s.l., ∼ 600 hPa); Izaña, Tenerife, Ca-
                                                                       nary Islands (28.31◦ N, 16.50◦ W, 2.4 km a.s.l., ∼ 760 hPa);
pling frequency of cloudy scenes), the influence of clouds             and Altzomoni, Mexico (19.12◦ N, 98.66◦ W, 4.0 km a.s.l.,
on NOx photochemistry (Pour-Biazar et al., 2007; Holmes et             ∼ 620 hPa). Mauna Loa and Izaña are remote and have lim-
al., 2019), and local enhancements in NOx from events like             ited anthropogenic influence (Toledano et al., 2018), whereas
lightning and deep convective uplift of surface pollution that         Altzomoni is ∼ 70 km southeast of Mexico City and is often
accompany clouds (Crawford et al., 2000; Ridley et al., 2004;          within the mixed layer of the city in the afternoon (Baum-
Bertram et al., 2007).                                                 gardner et al., 2009) after the TROPOMI overpass. On aver-
   Cloud-slicing applied to GEOS-Chem considers all cloudy             age, multiyear mean tropospheric NO2 columns from OMI
scenes, whereas cloud-slicing of satellite observations is ap-         are ∼ 10 × 1015 molec. cm−2 lower over Altzomoni (< 5 ×
plied to partial columns above optically thick clouds, so that         1015 molec. cm−2 ) than the city (> 15 × 1015 molec. cm−2 )
the clouds shield against contamination of NO2 from be-                (Rivera et al., 2013). At Izaña, there is also a MAX-DOAS
low the cloud. If we only consider synthetic partial columns           instrument that we use to retrieve free-tropospheric columns
above clouds with a physical (geometric) cloud fraction                of NO2 to assess these from Pandora and TROPOMI. MAX-
across 450–180 hPa of at least 0.7, the cloud-sliced UT                DOAS offers vertical sensitivity in the troposphere and has
NO2 positive difference is similar (18 %) to that obtained             been used extensively to determine free-tropospheric con-
for all cloudy scenes, but half the number of data are re-             centrations of NO2 at high-altitude sites (Gomez et al., 2014;
tained. Cloud fractions retrieved with TROPOMI are effec-              Gil-Ojeda et al., 2015; Schreier et al., 2016). There are also
tive or radiometric cloud fractions that are systematically            Pandora instruments at remote sites in the northern middle
more than the physical cloud fraction from the model (Buc-             and high latitudes in Eureka, Canada, and Ny-Ålesund, Nor-
sela et al., 2013; Laughner et al., 2018). Our results sug-            way, but the total columns of these sample the planetary
gest that representation error is not sensitive to the cloud           boundary layer. The Eureka site is at 617 m altitude and the
fraction threshold. Another distinction in GEOS-Chem and               Ny-Ålesund site is at 18 m.
TROPOMI cloud variables is that the model provides the                    Pandora level 2 total and tropospheric columns are from
physical cloud-top height, whereas TROPOMI cloud re-                   the Pandonia Global Network (PGN, 2020). We use ver-
trievals that use models that assume clouds are uniform re-            sion 1.7 “nvs1” retrieval of total columns and “nvh1” re-
flective boundaries retrieve cloud-top heights that can be             trieval of tropospheric columns (described below). Obser-
∼ 1 km lower than the physical cloud top (Joiner et al., 2012;         vations are for a full year (1 June 2019 to 31 May 2020)
Choi et al., 2014; Loyola et al., 2018a). We again apply the           at Izaña. The data record is shorter at Mauna Loa (ends
cloud-slicing algorithm to the simulated partial columns, but          29 March 2020) and Altzomoni (ends 9 March 2020). Total
with the altitude of the cloud-top heights artificially lowered        slant columns (NO2 abundances along the instrument view-
by 1 km. This approach assumes that the difference in alti-            ing path) are retrieved by fitting a fourth-order polynomial to
tudes of effective (radiometric) clouds and physical clouds is         spectra at 400–440 nm using an NO2 effective temperature
systematic and vertically and horizontally uniform. The dif-           of 254.4 K. These are then converted to total vertical col-
ference between the resultant cloud-sliced UT NO2 and the              umn densities by accounting for the geometry of the view-

https://doi.org/10.5194/amt-14-2389-2021                                                Atmos. Meas. Tech., 14, 2389–2408, 2021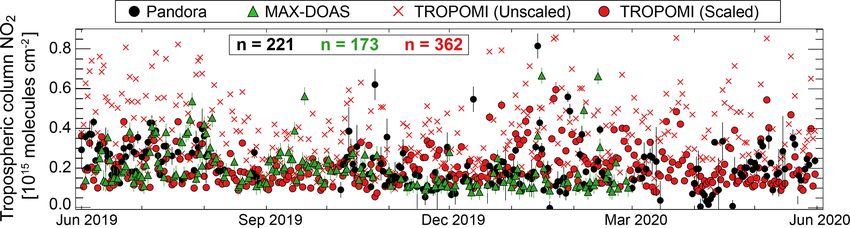
2394                                                   E. A. Marais et al.: NO2 in the upper troposphere from TROPOMI

ing path (Cede et al., 2019). The Pandora tropospheric NO2       instrument (the total slant column or SCDtot ), NO2 verti-
columns have not yet been validated against other observa-       cal column densities in the stratosphere (VCDstrat ), and the
tions. Retrieval of these involves simultaneous retrieval of     stratospheric air mass factor (AMFstrat ). A detailed descrip-
slant columns of NO2 and the O2 −O2 dimer at multiple ele-       tion of retrieval of SCDtot and VCDstrat is described in the
vation angles (typically 0, 60, 75, 88, and 89◦ ). The O2 −O2    product Algorithm Theoretical Basis Document (van Geffen
dimer slant columns are used to calculate a representative air   et al., 2019) and by van Geffen et al. (2020). In brief, SCDtot
mass factor (AMF) that is applied to the difference in NO2       values are obtained by spectral fitting of TROPOMI top-
slant columns at multiple pointing elevation angles to cal-      of-atmosphere radiances at 405–465 nm by accounting for
culate a tropospheric vertical column. The data also include     light absorption by NO2 and other relevant gases. VCDstrat
estimates of the uncertainty on the total and tropospheric       are from assimilation of TROPOMI and modelled total slant
columns due to instrument noise and atmospheric variabil-        columns over locations diagnosed by the model to have lim-
ity (Cede et al., 2019). The NO2 effective temperature used      ited tropospheric influence (predominantly remote oceans)
in the total NO2 column retrieval is greater than the column     (Boersma et al., 2004; Dirksen et al., 2011; van Geffen
average ambient temperature at high-altitude sites. This in-     et al., 2019). The modelled slant columns are the product
duces a positive bias in the total columns estimated by Ver-     of vertical columns from the TM5-MP CTM (Williams et
hoelst et al. (2021) to be ∼ 10 % that we address by decreas-    al., 2017) and AMFs calculated using TROPOMI viewing
ing the Pandora total columns and associated errors by 10 %.     geometries and surface reflectivities. The CTM is simulated
No correction is applied to the tropospheric columns, due to     at 1◦ ×1◦ and driven with ECMWF meteorology updated ev-
variable contribution of the troposphere to the total column.    ery 3-hourly. SCDtot values are separated into a stratospheric
   MAX-DOAS vertical tropospheric columns of NO2 at              (SCDstrat ) and tropospheric (SCDtrop ) component, and a tro-
Izaña are from RASAS-II sky radiance spectra for June 2019       pospheric AMF (AMFtrop ) is applied to SCDtrop to obtain
to February 2020. The spectra are fitted for NO2 and O2 −O2      tropospheric vertical columns (VCDtrop ). AMFtrop accounts
in the wavelength range 425–490 nm, and slant columns are        for viewing geometry, surface reflectivity, atmospheric ab-
calculated as the difference between these spectra at high-      sorption and scattering of light by trace gases and aerosols,
sun (90◦ instrument elevation angle) and multiple elevation      and sensitivity to the vertical distribution of NO2 . A verti-
angles (1, 2, 3, 5, 10, 30, and 70◦ ) (Hönninger et al., 2004;   cally resolved correction is also applied to the AMFtrop to
Gil et al., 2008; Puentedura et al., 2012; Gomez et al., 2014;   correct for the fixed NO2 effective temperature (220 K) used
Gil-Ojeda et al., 2015). Vertical columns are estimated us-      to retrieve SCDtot . The light path in the UT is relatively un-
ing optimal estimation that solves an ill-constrained problem    obstructed by aerosols and, for cloud-slicing, would mostly
by introducing prior information (Rodgers, 2000). Prior in-      be impacted by treatment of the reflectivity of optically thick
formation for Izaña includes fixed (with altitude) aerosol ex-   clouds. We choose to use an AMF that only accounts for
tinction of 0.01 km−1 and NO2 of 20 pptv from the surface        viewing geometry (AMFtrop, geo ) due to uncertainties in the
to the tropopause. Aerosol abundances at Izaña are some-         modelled vertical distribution of NO2 in the UT (Stavrakou et
times influenced by windblown dust from the Sahara Desert,       al., 2013; Travis et al., 2016) and representation errors from
but are typically low (aerosol optical depth or AOD < 0.05)      a model at coarser resolution (∼ 100 km) than TROPOMI
(Gomez et al., 2014; Gil-Ojeda et al., 2015). The prior NO2      (< 10 km at nadir). Choi et al. (2014) found that OMI partial
profile is within the range of background NO2 in the UT (10–     NO2 columns calculated with AMFtrop, geo above optically
20 pptv) (Marais et al., 2018) and MAX-DOAS NO2 concen-          thick clouds in the mid-troposphere (650 hPa) were at most
trations previously retrieved at Izaña (20–40 pptv) (Gomez       14 % more than those calculated with a detailed AMF that
et al., 2014). Filtering is applied to remove vertical column    assumed clouds are near-Lambertian surfaces with albedo
retrievals with limited independent information (degrees of      of 0.8 and NO2 is constant with altitude. The effect of not
freedom for signal < 1) and significant light path attenua-      including a temperature correction will be small in the UT
tion by aerosols (AOD > 0.1) and clouds (effective cloud         where temperatures are ∼ 220 K anyway. To confirm this,
fraction > 0.5). AOD is derived with MAX-DOAS O2 −O2             we find that GEOS-Chem cloud-sliced UT NO2 values cal-
dimer differential slant columns retrieved over the same         culated with the TROPOMI AMF temperature correction ex-
wavelength range as NO2 (Frieß et al., 2006), and cloud frac-    pression in van Geffen et al. (2019) are only 6 % less than
tion is from the Fast Retrieval Scheme for Clouds from the       those in Figs. 1 and 2.
Oxygen A band version S (FRESCO-S) product provided                 We calculate VCDtrop by first obtaining SCDtrop as the dif-
with the TROPOMI NO2 product. Filtering removes 40 %             ference between SCDtot from the data product and SCDstrat
of the retrieved vertical tropospheric NO2 columns at Izaña.     calculated as the product of the reported VCDstrat and
   TROPOMI data are from the Sentinel-5P Pre-Operations          AMFstrat :
Data Hub (S5P Data Hub, 2020). We use a year of NO2
                                                                 SCDtrop = SCDtot − (VCDstrat × AMFstrat ) .                (1)
data (1 June 2019 to 31 May 2020) from the level-2 offline
(OFFL) product version 01-03-02. The data product includes       This we use to estimate the above-cloud VCDtrop using
NO2 abundances along the optical path from the sun to the        AMFtrop, geo that we calculate with the reported solar zenith

Atmos. Meas. Tech., 14, 2389–2408, 2021                                           https://doi.org/10.5194/amt-14-2389-2021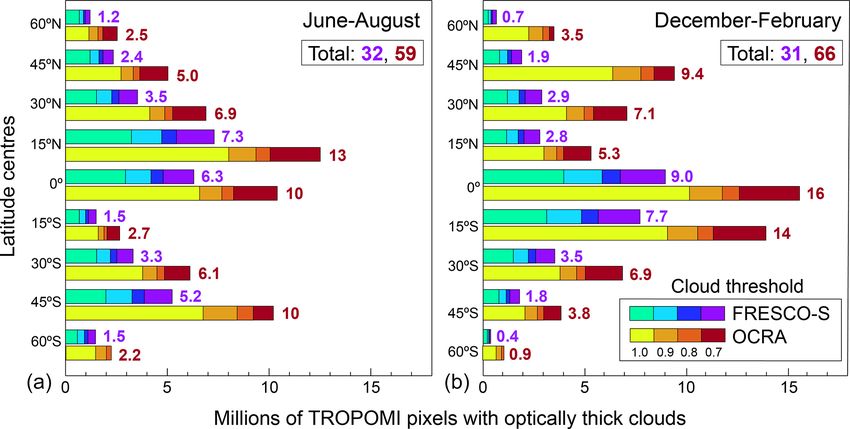
E. A. Marais et al.: NO2 in the upper troposphere from TROPOMI                                                           2395

angle (SZA) and viewing zenith angle (VZA) values:                  At Mauna Loa, the free-tropospheric column contribu-
                                                                 tion to the total averages 5.1 % (range of 0.2 %–16 %), ac-
             SCDtrop               SCDtrop                       cording to Pandora. This is likely an overestimate, as few
VCDtrop =                =                         .       (2)
            AMFtrop, geo   (sec (SZA) + sec (VZA))               (33 %) Pandora tropospheric daily means could be estimated,
                                                                 as indicated by the grey points in Fig. 3a. The contribu-
The TROPOMI VCDtot values we compare to Pandora are              tion of the free troposphere to the total column at the other
calculated as the sum of reported VCDstrat and our calculated    sites is 8.3 % (0.2 %–38 %) at Izaña and 31 % (8 %–91 %)
VCDtrop (Eq. 2). Only data with quality flags (“qa_value”        at Altzomoni. Due to the small contribution of the free tro-
in the data product) of at least 0.45 are used. This removes     posphere to the total at Mauna Loa, we use the compari-
data affected by sun glint, poor precision in the retrieval      son of Pandora and TROPOMI at this site to evaluate the
and radiances, and SZA > 84.5◦ (van Geffen et al., 2019).        TROPOMI stratospheric column, as has been done previ-
Similarly, good-quality Pandora retrievals of total and tro-     ously (Verhoelst et al., 2021). At Mauna Loa, TROPOMI
pospheric columns are identified as those with data quality      underestimates stratospheric NO2 variance by 13 % (slope =
flags of 0, 1, 10, or 11 (Cede et al., 2019), consistent with    0.87 ± 0.05). A regression slope less than unity suggests that
Ialongo et al. (2020). Coincident satellite and ground-based     higher-resolution features are smoothed by the coarser spa-
data are identified as TROPOMI pixels within a 0.2◦ ra-          tial resolution of the TM5-TMP model (1◦ × 1◦ ) and time
dius (∼ 20 km) of the station and ground-based data ±30 min      resolution of the meteorology (3-hourly). The underestimate
around the TROPOMI overpass.                                     in stratospheric NO2 variance would lead to an overesti-
   Figure 3a–c compare collocated daily mean Pandora and         mate in the relative contribution of the stratosphere to the
TROPOMI total columns. This compares predominantly               total column for small column densities and vice versa. This
clear-sky observations from Pandora and all-sky observa-         would result in an overall overestimate in cloud-sliced UT
tions from TROPOMI, as the larger sampling footprint of          NO2 , increasing with decline in UT NO2 values, as the rel-
TROPOMI will include influence from clouds. TROPOMI              ative overestimate in column densities will be greater for
cloud fractions from the FRESCO-S product coincident with        high-altitude clouds than for low-altitude clouds. The 18 %
Pandora range from cloud free (< 0.1) to cloudy (0.8 for         higher TROPOMI than Pandora total columns at Mauna
Mauna Loa and Izaña, 0.5 for Altzomoni) and average 0.3          Loa are larger than and opposite in sign to the < 10 %
at Mauna Loa and Izaña and 0.2 at Altzomoni. Errors on           (−2×10¹⁴ molec. cm−2 ) meridional difference in TROPOMI
the daily means, obtained by adding in quadrature reported       stratospheric columns from the near-real-time (NRTI) NO2
uncertainties of individual columns, are small at all sites.     product and those obtained with twilight measurements from
These vary from 0.1 % to 19 % for Pandora and 1.5 % to           the near-global Système d’Analyse par Observation Zénitale
16 % for TROPOMI. TROPOMI and Pandora total columns              (SAOZ) network of zenith-scattered-light differential optical
are temporally consistent (R = 0.69 at Mauna Loa, R = 0.87       absorption spectroscopy (ZSL-DOAS) instruments (Lambert
at Izaña, R = 0.67 at Altzomoni), but there is a system-         et al., 2019). The implied difference between SAOZ and Pan-
atic positive offset in TROPOMI (intercepts in Fig. 3a–          dora stratospheric columns coincident with TROPOMI (Pan-
c) ranging from 6.6 × 10¹⁴ molec. cm−2 at Mauna Loa to           dora < SAOZ) may be due to the need to account for time
9.3 × 10¹⁴ molec. cm−2 at Altzomoni. TROPOMI is on aver-         differences between the SAOZ measurements (twilight) and
age 18 % higher than Pandora at Mauna Loa, 26 % at Izaña,        TROPOMI (midday) (Verhoelst et al., 2021). This difference
and 38 % at Altzomoni. Verhoelst et al. (2021) also report a     warrants further investigation, as these ground-based mea-
positive bias in TROPOMI total columns at the same Pandora       surements are crucial for validating space-based sensors that
sites of 6 % at Mauna Loa, 19 % at Izaña, and 28 % at Alt-       measure NO2 .
zomoni for April 2018 to February 2020. Our higher values           We apply a variance correction to TROPOMI strato-
compared to Verhoelst et al. (2021) is because of the 10 %       spheric columns by dividing these by 0.87 (the slope of
downward adjustment we apply to Pandora total columns.           the TROPOMI versus Pandora total columns at Mauna Loa
The difference in sampling footprints of space- and ground-      in Fig. 3a) and subtracting the resultant mean increase in
based instruments can influence agreement between the two        TROPOMI stratospheric columns of 3 × 10¹⁴ molec. cm−2 .
(Pinardi et al., 2020). We find though that the difference be-   This reduces the intercepts in Fig. 3a–c to 4.4 ×
tween TROPOMI and Pandora at Mauna Loa and Izaña is              1014 molec. cm−2 for Mauna Loa, 7.9 × 10¹⁴ molec. cm−2
relatively insensitive to the choice of sampling coincidence.    for Izaña, and 7.3 × 10¹⁴ molec. cm−2 for Altzomoni (not
The difference is 17 %–20 % at Mauna Loa and 25 %–26 %           shown). Likely causes for the remaining discrepancy be-
at Izaña for a TROPOMI sampling radius range of 0.05–0.3◦        tween TROPOMI and Pandora could be a positive offset
and for a Pandora sampling time window range of ±15–             in the TROPOMI radiance intensity that is estimated to be
60 min. The comparison at Altzomoni, though, is very sensi-      5 % of the total column or 0.1–1 × 10¹⁵ molec. cm−2 (van
tive to the sampling radius due to proximity to Mexico City.     Geffen et al., 2020), challenges obtaining a Pandora refer-
There the difference increases from 22 % at 0.05◦ for 45 co-     ence measurement (atmospheric column without NO2 ) (Her-
incident points to 48 % at 0.3◦ for 76 coincident points.        man et al., 2009), and an overestimate in TROPOMI free-

https://doi.org/10.5194/amt-14-2389-2021                                          Atmos. Meas. Tech., 14, 2389–2408, 2021
2396 E. A. Marais et al.: NO2 in the upper troposphere from TROPOMI Figure 3. Comparison of TROPOMI and Pandora total NO2 columns at high-altitude sites located in the free troposphere (> 2 km altitude). Points are daily means with at least five coincident observations at Mauna Loa (a, d), Izaña (b, e), and Altzomoni (c, f) before (a, b, c) and after (d, e, f) applying correction factors to TROPOMI stratospheric and tropospheric columns (see text for details). Colours in (a, b, c) are the relative contribution of the free troposphere to the total column according to Pandora where available and grey otherwise. Data in (d, e, f) row are coloured by season. Lines are the 1 : 1 relationship (grey dashed) and RMA regression (black solid). Inset values are Pearson’s correlation coefficients, RMA regression statistics, number of data points (n), and the TROPOMI normalized mean bias (NMB). Also shown for Altzomoni (f) is the RMA regression without the Pandora > 5 × 10¹⁵ molec. cm−2 observation (black dashed line). Axes do not start at the origin. tropospheric NO2 . The radiance intensity offset has been DOAS are due to challenges retrieving tropospheric columns shown to mostly affect retrievals over open oceans (van Gef- routinely close to instrument detection limits (Gomez et fen et al., 2020), and an overestimate in free-tropospheric al., 2014), lack of dynamic variability in the retrieved NO2 would have a larger effect on the total column com- columns, and differences in the sampling extent of the two parison at Izaña and Altzomoni than at Mauna Loa. instruments. The MAX-DOAS sampling footprint, for exam- Figure 4 compares time series of free-tropospheric col- ple, shifts by at least 4◦ in latitude between its most northerly umn densities of NO2 at Izaña from Pandora, MAX-DOAS, extent in winter solstices to its most southerly extent in sum- and TROPOMI. As with the total columns, Pandora and mer solstices (Robles-Gonzalez et al., 2016). Most MAX- MAX-DOAS are sampled 30 min around the satellite over- DOAS and Pandora data are at 1–4 × 10¹⁴ molec. cm−2 , pass and TROPOMI 0.2◦ around the site. We impose a mod- whereas the range for TROPOMI calculated using Eqs. (1) est threshold to only use TROPOMI tropospheric columns and (2) extends to ∼ 8 × 10¹⁴ molec. cm−2 . The range is the > 4 × 10¹³ molec. cm−2 to mimic the detection limits of the same as the comparison of TROPOMI and shipborne MAX- instruments (Gomez et al., 2014) and mitigate the influence DOAS tropospheric columns by P. Wang et al. (2020). In of TROPOMI data that would be susceptible to errors in that study, TROPOMI was on average 4 × 10¹⁴ molec. cm−2 distinguishing the stratosphere from the troposphere. This more than MAX-DOAS. In our comparison, TROPOMI free- brings the lower-end TROPOMI values into better agree- tropospheric columns (red crosses in Fig. 4) are 77 % more ment with the ground-based values and has no effect on than Pandora and 84 % more than MAX-DOAS. The overes- TROPOMI columns > 2 × 10¹⁴ molec. cm−2 . On average, timate is similar if the reported detailed tropospheric AMF is Pandora is 14 % more than MAX-DOAS for coincident mid- used instead of AMFtrop, geo (Eq. 2) to calculate TROPOMI day daily means, and the temporal correlation is modest (R = tropospheric columns. 0.4). Temporal inconsistencies between Pandora and MAX- Atmos. Meas. Tech., 14, 2389–2408, 2021 https://doi.org/10.5194/amt-14-2389-2021
E. A. Marais et al.: NO2 in the upper troposphere from TROPOMI                                                                           2397

Figure 4. Time series of free-tropospheric column densities of NO2 at Izaña. Points are daily midday means from Pandora (black circles),
MAX-DOAS (green triangles), and TROPOMI (red) before (crosses) and after (circles) applying scaling factors to the stratospheric and
tropospheric columns (see text for details). Error bars are individual retrieval uncertainties added in quadrature. Inset values are the number
of midday daily means from each instrument.

   The stratospheric variance correction reduces the differ-              anthropogenic influence from Mexico City that the coarser
ence between TROPOMI and coincident ground-based mea-                     TROPOMI sampling footprint is not able to resolve. Points
surements to 40 % compared to Pandora and 47 % com-                       in Fig. 3 are coloured by season to show that all sites ex-
pared to MAX-DOAS (not shown). This is due to an in-                      perience a modest decline in NO2 from summer (purple)
crease in the relative contribution of the stratosphere to to-            to winter (cyan) due to the influence of solar variability on
tal columns > 2 × 10¹⁵ molec. cm−2 following the strato-                  photochemical production of NOx in the stratosphere (Gil
spheric column variance correction. A 40 %–47 % overesti-                 et al., 2008; Robles-Gonzalez et al., 2016) and seasonal-
mate in free-tropospheric columns would induce a system-                  ity in long-range transport and subsidence in the free tro-
atic positive bias in cloud-sliced UT NO2 . To address the                posphere (Gil-Ojeda et al., 2015). The distinct distribution
remaining difference between TROPOMI free-tropospheric                    of points in December–February compared to June–August
columns and the ground-based observations, we decrease                    and September–November at Mauna Loa suggests there
TROPOMI free-tropospheric columns by 50 % (red circles in                 may be seasonality in the size of the discrepancy between
Fig. 4), leading to a difference of −4 % with Pandora and 1 %             TROPOMI and Pandora stratospheric columns. The remain-
with MAX-DOAS. There is no temporal correlation between                   ing TROPOMI positive offset of ∼ 4 × 10¹⁴ molec. cm−2 is
daily coincident observations of TROPOMI and the ground-                  consistent with the 2–4 × 10¹⁴ molec. cm−2 positive offset
based measurements (R < 0.1), consistent with the compar-                 in TROPOMI stratospheric columns reported by P. Wang et
ison of TROPOMI to shipborne MAX-DOAS (P. Wang et                         al. (2020) from comparison to shipborne MAX-DOAS mea-
al., 2020).                                                               surements. If the remaining offset is exclusively due to the
   Figure 3d–f compare Pandora to TROPOMI total columns                   stratospheric column, this would cancel in the cloud-slicing
after increasing TROPOMI stratospheric column variance                    retrieval for clusters of partial columns with uniform strato-
by 13 % and reducing TROPOMI free-tropospheric columns                    spheric NO2 .
by 50 %. This correction reduces the difference between                      In what follows, we use TROPOMI total columns with a
TROPOMI and Pandora by just 3 percentage points at Mauna                  13 % increase in stratospheric column variance and a 50 %
Loa and Izaña and 11 percentage points at Altzomoni.                      decrease in free-tropospheric columns that are based on com-
The variance at Altzomoni degrades from 0.96 ± 0.16 to                    parison to Pandora and MAX-DOAS.
0.82 ± 0.14, but this is because the relatively few coinci-
dent points (76 compared to 308 at Izaña) are influenced
by the single Pandora observation > 5.5 × 10¹⁵ molec. cm−2                4   Retrieval of TROPOMI NO2 in the upper
(coincident corrected TROPOMI is < 4 × 10¹⁵ molec. cm−2 )                     troposphere
that may be detecting NO2 from fires that typically occur
in December–February in the National Park where the in-                   Seasonal mean UT NO2 values are obtained from TROPOMI
strument is located (Bravo et al., 2002; Baumgardner et                   for June 2019 to May 2020 at 1◦ × 1◦ . The same cloud-
al., 2009). The TROPOMI free-tropospheric column con-                     slicing retrieval and data-filtering steps applied to synthetic
tribution at Mauna Loa and Izaña is more consistent with                  spectra from GEOS-Chem (Sect. 2) are applied to corrected
that from Pandora after applying the stratospheric and free-              TROPOMI total columns. The corrections include a 13 % ad-
tropospheric column corrections, decreasing from 8 % to 6 %               justment to the stratospheric column variance and 50 % de-
at Mauna Loa and 12 % to 7 % at Izaña. This is not the                    crease in tropospheric columns based on comparison to the
case for Altzomoni (decrease from 14 % to 9 %), due to                    three high-altitude Pandora sites (Sect. 3). The degradation in

https://doi.org/10.5194/amt-14-2389-2021                                                     Atmos. Meas. Tech., 14, 2389–2408, 2021
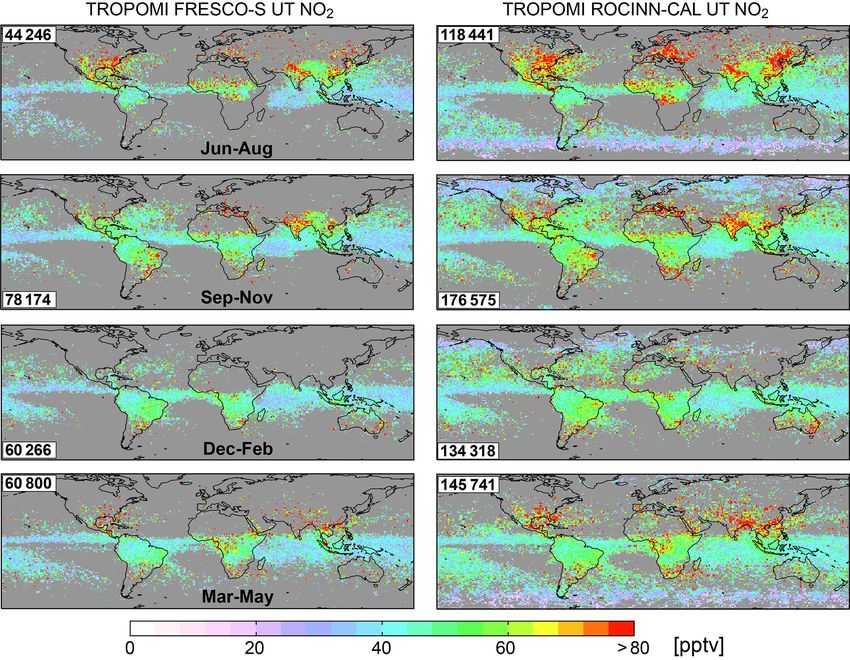
2398                                                   E. A. Marais et al.: NO2 in the upper troposphere from TROPOMI

resolution of TROPOMI nadir pixels from 5.6 km × 3.5 km          over Northern Hemisphere land masses in June–August, the
to the target resolution (1◦ × 1◦ ) is 400-fold compared to      year-round 40–60 pptv band over tropical landmasses that
250-fold for the synthetic experiment in Sect. 2 and a much      shifts meridionally with the Intertropical Convergence Zone
greater (1300-fold) degradation in OMI nadir pixel resolution    (ITCZ), and relatively low concentrations (< 30 pptv) over
(13 km × 24 km) for the 5◦ ×8◦ product (Marais et al., 2018).    the remote Pacific Ocean. We find reasonable spatial cor-
The finer relative resolution we choose for TROPOMI cloud-       relation (R = 0.4–0.6) between seasonal mean TROPOMI
sliced UT NO2 compared to OMI is informed by the syn-            UT NO2 and lightning flash densities from the Lightning
thetic experiment applied to GEOS-Chem and the superior          Imaging Sensor–Optical Transient Detector (LIS–OTD) in
cloud-resolving capability of TROPOMI than OMI. Cloud-           all seasons, except September–November for FRESCO-S
slicing is applied to partial columns above optically thick      (R = 0.34). Seasonal LIS–OTD lightning flash densities at
clouds, diagnosed with an effective cloud fraction ≥ 0.7, as     1◦ × 1◦ are calculated from version 2.3 of the monthly cli-
in Marais et al. (2018), to limit contamination from light       matology (OPeNDAP, 2020). RMA slopes from regressing
transmitted through clouds. Though the cloud-slicing re-         TROPOMI UT NO2 against LIS–OTD lightning flash densi-
trieval steps applied to GEOS-Chem and TROPOMI are the           ties range from 0.3 to 0.6 pptv (106 flashes km−2 min−1 )−1 ,
same, there are differences in the modelled and retrieved        and UT NO2 in the absence of lightning flashes in the trop-
cloud parameters that we discuss below.                          ics and subtropics (RMA intercepts) is very similar, 37–
   Two TROPOMI cloud-sliced UT NO2 products are de-              41 pptv, for both products in all seasons. In the cold po-
rived using cloud-top heights and cloud fractions from dis-      lar regions in Fig. 5, UT NO2 values, limited to ROCINN-
tinct cloud products. The first are FRESCO-S cloud frac-         CAL, are near background (< 30 pptv) as NO2 is preferen-
tions and cloud-top pressures from the same data file as         tially present as NOx reservoir compounds such as peroxy-
TROPOMI NO2 . These are determined by minimizing the             acetyl nitrates (PANs) (Bottenheim et al., 1986). Large en-
difference between measured and simulated spectra in the         hancements (NO2 > 80 pptv) over northern China and the
O2 A-band (758–766 nm) using lookup tables and assum-            northeast US in June–August and Australia in December–
ing clouds are single layer Lambertian reflectors with an        February most prevalent in the ROCINN-CAL product likely
albedo of 0.8 (Wang et al., 2008; van Geffen et al., 2019).      reflect contamination from surface pollution below clouds.
The second is the Optical Cloud Recognition Algorithm            These result from intense anthropogenic activity in North
(OCRA) cloud fractions and Retrieval of Cloud Information        China and the northeast US (Zhao et al., 2013; Jiang et
using Neural Networks (ROCINN) cloud-top heights. OCRA           al., 2018; Z. Wang et al., 2020) and routine pyrocumulonim-
cloud fractions are retrieved by determining the difference,     bus injection of fire plumes into the free troposphere and
in colour space, between cloudy and clear reflectances (Loy-     lower stratosphere during the extreme 2019–2020 fire season
ola et al., 2007, 2018a, b). ROCINN cloud-top heights are        in Australia (Kablick et al., 2020).
retrieved in kilometres by minimizing the difference be-            FRESCO-S and ROCINN-CAL UT NO2 are spatially
tween measured O2 A-band radiances and neural-network-           consistent for coincident grid squares (R of 0.82 to 0.88),
trained radiances modelled using OCRA cloud fractions            though ROCINN-CAL UT NO2 are 4.2–9.1 pptv more than
(Loyola et al., 2007, 2018b). In ROCINN, clouds are mod-         FRESCO-S UT NO2 . As with the synthetic experiment, UT
elled as multiple optically uniform layers of light-scattering   NO2 increases with degradation in resolution due to the rela-
water droplets (the clouds-as-layers or CAL model). We con-      tive increase in tropospheric columns with steep vertical gra-
vert the ROCINN-clouds-as-layers (ROCINN-CAL) cloud-             dients in NO2 . Depending on the season, cloud-sliced UT
top heights to pressures for cloud-slicing and comparison        NO2 values are 2 %–4 % more at 2◦ ×2.5◦ and 3 %–9 % more
to FRESCO-S. FRESCO-S data are quality screened using            at 4◦ ×5◦ than at 1◦ ×1◦ . Good quality retrievals and optically
the same qa_value threshold (0.45) as NO2 . A qa_value           thick clouds with cloud-top pressures at 450–180 hPa ac-
threshold of 0.5 is used for OCRA and ROCINN-CAL.                count for ∼ 2 % of TROPOMI pixels using FRESCO-S and
Snow and/or ice scenes potentially misclassified as clouds       ∼ 3 % using ROCINN-CAL. Of these, 44 000–78 000 cloud-
by FRESCO-S are identified as differences in reported scene      slicing retrievals are retained in each season for FRESCO-S
and surface pressures > 2 %, as in van der A et al. (2020),      and 118 000–177 000 for ROCINN-CAL (Fig. 5). Most data
as having snow cover > 80 % or classified as permanent ice       loss in the cloud-slicing retrieval is because of too few points
cover. In what follows, we distinguish the two cloud-sliced      (clusters < 10) or a cloud-top pressure range < 140 hPa. Dis-
TROPOMI UT NO2 products as FRESCO-S and ROCINN-                  carded extreme values of cloud-sliced NO2 > 200 pptv are
CAL.                                                             only 0.1 %–0.5 % of retained data. More cloud-sliced re-
   Figure 5 shows maps of seasonal mean FRESCO-S and             trievals with ROCINN-CAL are due to greater abundance of
ROCINN-CAL UT NO2 at 1◦ × 1◦ . The spatial features              optically thick clouds and clusters with greater cloud height
are consistent with a combination of the density of light-       range.
ning flashes (Cecil et al., 2014) and lightning properties          Figure 6 compares the meridional abundance of optically
such as flash footprint, duration, and energy (Beirle et         thick clouds in the UT from the two cloud products for
al., 2014). These include elevated concentrations (> 80 pptv)    June–August and December–February. The same informa-

Atmos. Meas. Tech., 14, 2389–2408, 2021                                           https://doi.org/10.5194/amt-14-2389-2021
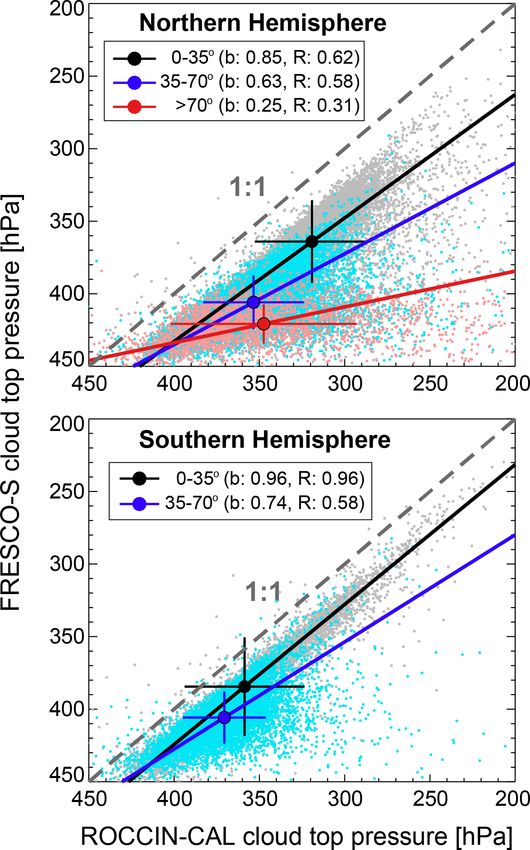
E. A. Marais et al.: NO2 in the upper troposphere from TROPOMI                                                                  2399

Figure 5. Seasonal mean NO2 in the upper troposphere from TROPOMI. Maps are UT NO2 at 1◦ × 1◦ in June–August 2019 (first row),
September–November 2019 (second), December 2019 to February 2020 (third), and March–May 2020 (fourth) using FRESCO-S (left) or
ROCINN-CAL (right) cloud information and with corrections applied to TROPOMI stratospheric and tropospheric columns (see text for
details). Inset numbers give total successful cloud-sliced retrievals. Grey grid squares have fewer than five cloud-sliced retrievals.

tion for the other two seasons is in Fig. S2. Both products re-      ber of pixels in each cloud fraction threshold in Fig. 6 sug-
trieve effective (radiometric) cloud fractions. These are sys-       gests that a stricter cloud fraction threshold of 1.0 applied to
tematically more than the physical (geometric) cloud frac-           the ROCINN-CAL product might lead to a more consistent
tions from GEOS-Chem, though the two converge for opti-              spatial distribution of UT NO2 to that from FRESCO-S in
cally thick clouds with physical cloud fractions approaching         Fig. 5. The resultant ROCINN-CAL UT NO2 values using a
1 (Stammes et al., 2008; Laughner et al., 2018). The num-            cloud fraction threshold of 1.0 are in Fig. S3. Half the number
ber of OCRA optically thick clouds is always more (often             of cloud-sliced retrievals are obtained, as expected, and there
double) than that of FRESCO-S in all seasons and across              are fewer retrievals over Northern Hemisphere high latitudes
all latitudes. The greatest difference in the number of opti-        than in Fig. 5. Those over the Southern Ocean in austral
cally thick clouds tracks the ITCZ and is also typically at          autumn and winter persist and may reflect enhanced occur-
45◦ N/S. The majority (61 %–62 %) of OCRA cloud frac-                rence of high-altitude clouds in these seasons over Antarc-
tions exceed 0.975 compared to 42 %–45 % for FRESCO-S.               tica (Verlinden et al., 2011). The average difference between
Loyola et al. (2018a) determined that OCRA cloud fractions           ROCINN-CAL and FRESCO-S decreases from 5 %–8 % for
retrieved over oceans are 0.1 unit more than those from re-          the same cloud fraction threshold of 0.7 to 0.2 %–1.6 % using
trievals like FRESCO-S that assume fixed cloud albedo. Dif-          a cloud fraction threshold of 1.0 for ROCINN-CAL and 0.7
ferences over land are not as systematic and vary from neg-          for FRESCO-S, likely due to reduced contamination of NO2
ligible in the tropics and subtropics to > 0.1 unit more in the      from below clouds with the stricter cloud fraction threshold.
Arctic (Loyola et al., 2018a). ROCINN-CAL retrieves cloud               Figure 7 compares gridded cloud product cloud-top pres-
optical thicknesses alongside cloud heights. These exceed 20         sures for June–August sampled where FRESCO-S cloud-
for most (84 %–93 %) 1◦ × 1◦ grid squares used to cloud-             top pressures are at 450–180 hPa and cloud fractions are
slice TROPOMI, confirming that a cloud fraction threshold            at least 0.7. Cloud-top pressures are spatially consistent
of 0.7 is sufficient to isolate optically thick clouds. The num-     in the tropics (R = 0.62 at 0–35◦ N, R = 0.85 at 0–35◦ N)

https://doi.org/10.5194/amt-14-2389-2021                                               Atmos. Meas. Tech., 14, 2389–2408, 2021
You can also read


