Exploring valence bias as a metric for frontoamygdalar connectivity and depressive symptoms in childhood
←
→
Page content transcription
If your browser does not render page correctly, please read the page content below
Received: 15 April 2020   |   Revised: 11 December 2020   |   Accepted: 12 December 2020

DOI: 10.1002/dev.22084

RESEARCH ARTICLE

Exploring valence bias as a metric for frontoamygdalar
connectivity and depressive symptoms in childhood

Nathan M. Petro1                     | Nim Tottenham2                      | Maital Neta1

1
 Department of Psychology, Center for
Brain, Biology, and Behavior, University of      Abstract
Nebraska-Lincoln, Lincoln, NE, USA               Negativity bias is a core feature of depression that is associated with dysfunctional
2
 Department of Psychology, Columbia
                                                 frontoamygdalar connectivity; this pathway is associated with emotion regulation
University, New York, NY, USA
                                                 and sensitive to neurobiological change during puberty. We used a valence bias
Correspondence
                                                 task (ratings of emotional ambiguity) as a potential early indicator of depression
Nathan M. Petro, Center for Brain, Biology,
and Behavior, University of Nebraska –           risk and differences in frontoamygdalar connectivity. Previous work using this task
Lincoln, B76 East Stadium, Lincoln, NE
                                                 demonstrated that children normatively have a negative bias that attenuates with
68588-0156, USA.
Email: npetro@unl.edu                            maturation. Here, we test the hypothesis that persistence of this negativity bias as
                                                 maturation ensues may reveal differences in emotion regulation development, and
Funding information
National Institute of Mental Health, Grant/      may be associated with increased risk for depression. In children aged 6–13 years, we
Award Number: NIMH111640; Nebraska
                                                 tested the moderating role of puberty on relationships between valence bias, depres-
Tobacco Settlement Biomedical Research
Enhancement Fund                                 sive symptoms, and frontoamygdalar connectivity. A negative bias was associated
                                                 with increased depressive symptoms for those at more advanced pubertal stages
                                                 (within this sample) and less regulatory frontoamygdalar connectivity, whereas
                                                 a more positive bias was associated with more regulatory connectivity patterns.
                                                 These data suggest that with maturation, individual differences in positivity biases
                                                 and associated emotion regulation circuitry confer a differential risk for depression.
                                                 Longitudinal work is necessary to determine the directionality of these effects and
                                                 explore the influence of early life events.

                                                 KEYWORDS
                                                 amygdala, emotion, medial prefrontal cortex, negativity bias, puberty

1 | I NTRO D U C TI O N                                                          during the years of puberty (Tottenham & Gabard-Durnam, 2017), a
                                                                                 change that is intimately tied to the release of gonadal hormones
Individual differences in internalizing problems, like depression,               (Lebron-Milad & Milad, 2012; van Wingen et al., 2011). These brain
are associated with amygdala–prefrontal cortex (PFC) circuitry                   changes accompany profound changes in emotional behavior during
(Gee, Gabard-Durnam, et al., 2013; Pezawas et al., 2005; Wang                    this period of development that support functional social behav-
et al., 2009), and have been shown to emerge during the transition               ior (Denham, 1998; Eisenberg et al., 1993; John & Gross, 2004;
from childhood to adulthood (Emslie et al., 2005; Hankin et al., 1998;           Saarni, 1984).
Kessler et al., 2001). Notably, a number of studies have linked the                  In adulthood, connections between amygdala and a network of
emergence of these individual differences to neurobiological                     subregions in the PFC are understood to underpin emotion regu-
changes during pubertal development (Andersen & Teicher, 2008;                   lation mechanisms (Banks et al., 2007; Phillips et al., 2008; Wager
Angold & Costello, 2006; Paus et al., 2008). In particular, the medial           et al., 2008) vis-a-vis downregulation of amygdala activity during
prefrontal cortex (mPFC) strengthens connections with the amygdala               emotional processing (Hare et al., 2008; Hariri et al., 2003; Pezawas

Developmental Psychobiology. 2021;00:1–16.                    wileyonlinelibrary.com/journal/dev                      © 2021 Wiley Periodicals LLC   |   1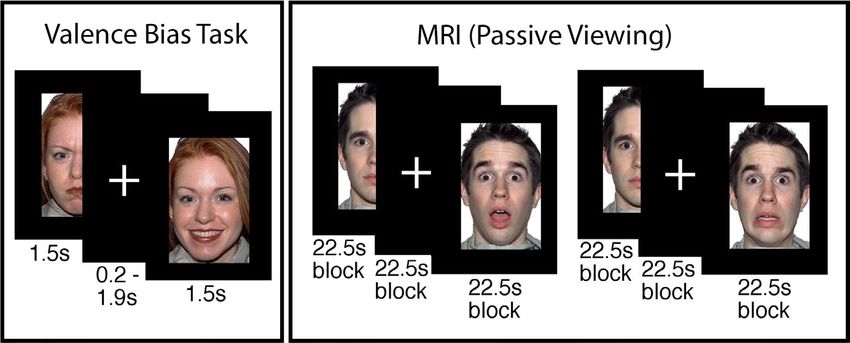
2   |                                                                                                                                   PETRO ET al.

et al., 2005). In particular, the mPFC and amygdala, in addition to         Zimmermann et al., 2019). The neurobiological processes associated
sharing numerous structural connections (Ghashghaei et al., 2007),          with these relatively early pubertal stages may produce measureable
show inverse functional connectivity during explicit emotion regula-        individual differences in frontoamygdalar function critical to mental
tion (Urry, 2006) that is suggestive of a downregulation of amygdala        health outcomes.
(Gee, Humphreys, et al., 2013). Further, adults compared to children           Reliably measuring emotional biases in children during these
show greater inverse amygdala–mPFC connectivity (Gabard-Durnam              early pubertal stages poses a methodological challege. For example,
et al., 2014; Gee, Humphreys, et al., 2013; Perlman & Pelphrey, 2011)       extant literature on negativity bias, which includes subclinical symp-
in addition to relatively decreased amygdala activation (Guyer              tomology (Pagliaccio et al., 2014), tends to measure emotional biases
et al., 2008; Hare et al., 2008; Monk et al., 2003; Swartz et al., 2014;    using stimuli that rely on developmentally advanced cognitive/lin-
but see Moore et al., 2012) in response to negative emotional in-           guistic abilities not ideally suited for younger children. An emerging
formation. Indeed, younger children show a non-regulatory positive          alternative approach has measured emotional biases using valence
amygdala–mPFC connectivity pattern, but older children and ado-             ratings of facial expressions, which are reliably identified in early
lescents show an inverse regulatory connectivity (Gee, Humphreys,           childhood (Bruce et al., 2000; Widen & Russell, 2008). Although
et al., 2013). Moreover in adults, this more positive amygdala–mPFC         some expressions (e.g., happy or angry) signal clear valence informa-
connectivity has been implicated in the development of men-                 tion about the emotions and intentions of others, other expressions
tal health disorders (Das et al., 2007; Gee, Gabard-Durnam, et al.,         (e.g., surprise) are ambiguous because they signal both positive (e.g.,
2013; Phillips et al., 2008). Taken together, this work suggests that       an unexpected gift) and negative events (e.g., witnessing an acci-
although emotion regulation relies on a broad network of regions,           dent). Notably, children compared to adults tend to rate surprised
the connections between the mPFC and the amygdala lie at the core           expressions as having a more negative meaning (i.e., more negative
of emotion regulation abilities in adulthood.                               valence bias; Tottenham et al., 2013). Given that surprised expres-
        One notable feature of internalizing symptoms is a negativity       sions may be reliably identified across all ages and their ratings track
bias, or an enhanced attention to and memory for negative informa-          developmental changes in emotional behavior, the ambiguity con-
tion (Browning et al., 2010; Roy et al., 2008; Vasey et al., 1995), which   veyed through surprised expressions is ideally suited to probe dif-
is central to a variety of mood and anxiety disorders (e.g., depres-        ferences in negativity bias at early pubertal stages.
sion; Beck, 1976; Williams et al., 2007). Interestingly, negativity bias       Neuroimaging work suggests that normative developmental
is associated with more positive amygdala–mPFC connectivity (i.e., a        shifts in emotional biases might reveal how pubertal changes cor-
non-regulatory pattern) (Etkin et al., 2009; Roy et al., 2013; see also     relate with variability in the neurobiology of depression. For in-
Kim et al., 2011). Given that this same circuitry is sensitive to puber-    stance, in adults, positive ratings of surprised faces depend upon
tal changes (Blakemore et al., 2010; Goddings et al., 2014; Herting         slower and more deliberate processing (Kaffenberger et al., 2010;
et al., 2014; Mills et al., 2014; Vijayakumar et al., 2018, 2019) and       Neta et al., 2011; Neta & Tong, 2016), and appear to rely on emo-
is related to mental health disorders which emerge during puberty           tion regulation mechanisms (Kim et al., 2003; Petro et al., 2018).
(Burghy et al., 2012; Hulvershorn et al., 2011; Kessler et al., 2005;       This work suggests that the development of a more positive va-
Lee et al., 2014; Roy et al., 2013), understanding how this circuitry       lence bias and a more mature (inverse) amygdala–mPFC connectivity
is associated with individual differences in negativity bias across pu-     during puberty can powerfully impact the emergence of internal-
berty is essential to understanding the development of depression.          izing symptoms during this developmentally sensitive period. For
        Because the release of gonadal hormones which drive neu-            example, maintaining a negative valence bias and a more immature
robiological changes can begin as early as 8 years (Blakemore               (positive) amygdala–mPFC connectivity into adulthood may be a risk
et al., 2010; Dorn et al., 2006), whereas depression tends to onset         factor for the onset of depression. However, no study has yet used
at around 14 years of age (Burke, 1991; Lewinsohn et al., 1994), the        neuroimaging to explore valence bias in youth populations. Thus,
construction of this system may begin in relatively early pubertal          measuring normative shifts in valence bias and its associated amyg-
stages prior to the onset of internalizing symptoms. That is, puber-        dala–mPFC connectivity is an innovative approach that could reveal
tal transitions may act as a developmental “prism”, revealing indi-         how pubertal changes correlate with variability in the neurobiology
vidual differences in emotion regulation behaviors. In particular, the      of depression.
period from early to middle puberty is met with structural (Blanton            Using a cross-sectional design, we explored the relationships
et al., 2012; Goddings et al., 2014; Hu et al., 2013; Pfefferbaum           between valence bias, depressive symptoms, and emotion regu-
et al., 2016) and functional (Clark & Beck, 2010; Forbes et al., 2011;      lation circuitry within an age range demonstrated to show a more
Moore et al., 2012; Pfeifer et al., 2013; Vijayakumar et al., 2018,         negative valence bias (ages 6–13 years; Tottenham et al., 2013),
2019) changes within both the amygdala and mPFC, as well as in              a developing regulatory circuitry (Gabard-Durnam et al., 2014;
their connectivity (Asato et al., 2010; Herting et al., 2014; Menzies       Gee, Humphreys, et al., 2013; Perlman & Pelphrey, 2011; Silvers
et al., 2015; see also Gee, Humphreys, et al., 2013). This evidence is      et al., 2017), and prior to the typical emergence of depression (age
consistent with detailed animal models which find that the onset of         14 years; Burke, 1991; Lewinsohn et al., 1994). This methodolog-
puberty triggers reorganization within both the mPFC and its white          ical choice enabled us to explore how relatively early pubertal
matter fibers shared with the amygdala (Juraska & Willing, 2017;            changes contribute to the emergence of internalizing problems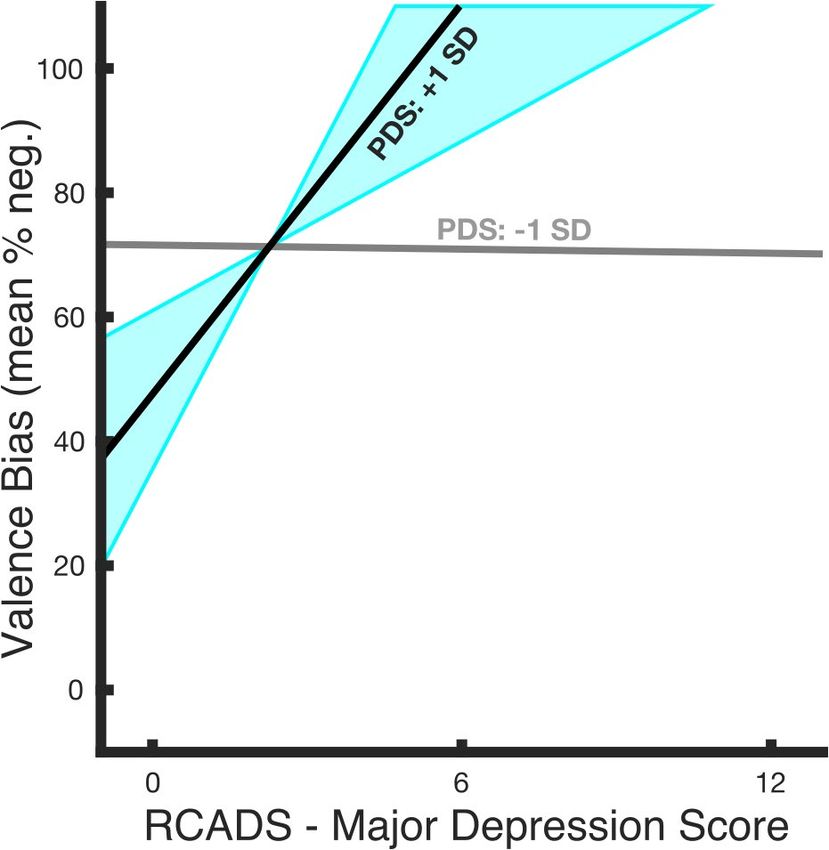
PETRO ET al.                                                                                                                                  |   3

in depression. We examined functional brain connectivity while            2.1.1 | Individual difference measures
viewing facial expressions during magnetic resonance imaging
(MRI). We used pubertal scores as our proxy for maturity because          We assessed puberty using the Petersen Puberty Development
(a) puberty is more closely tied than age to neurobiological changes      Scale (PDS; Petersen et al., 1988), and calculated scores as the aver-
in brain structure and function (Blakemore et al., 2010; Goddings         age of each of the five items assessing physical development (out
et al., 2012) and especially amygdala–mPFC circuitry (Gabard-             of the items numbered 1–7, where the five items included varied
Durnam et al., 2014; Gee, Humphreys, et al., 2013; Herting                based on the participant's sex; each with a possible response of 1–4),
et al., 2014; Perlman & Pelphrey, 2011; Silvers et al., 2017), and        as described by Petersen and colleagues (possible range = 1–4).
(b) age represents a different stage in maturation for males and          Because PDS scores tend to deviate from 1 only after the age of 8
females (Schuiling & Likis, 2016). For our exploratory analysis, we       (Hu et al., 2013), all participants under the age of 8 were assigned
predict that with increasing maturation (within this relatively im-       the lowest score of 1 (i.e., prior to the onset of puberty). The data
mature sample), a more negative valence bias and a more imma-             for each of these variables were submitted to a Shapiro–Wilk test
ture amygdala–mPFC connectivity pattern may pose an increased             to determine normality. The PDS score (Shapiro–Wilk: W = 0.90,
risk for depression.                                                      p = .001), age (Shapiro–Wilk: W = 0.94, p = .03), and depressive
                                                                          symptoms (see below; Shapiro–Wilk: W = 0.78, p < .001) were non-
                                                                          normally distributed and valence bias trended toward a non-normal
2 | M ATE R I A L S A N D M E TH O DS                                     distribution (W = 0.95, p = .07). Because of the non-normality of
                                                                          these distributions, robust regression was used for all analyses of
2.1 | Participants                                                        these variables.
                                                                             As expected, given our targeted age range, the current sam-
We collected data from 61 participants (29 female; ages 6–13 years,       ple subtended to relatively low PDS scores (range = 1–2.8,
mean(SD) age = 9.18(2.13)). All participants and their parent re-         mean(SD)    =      1.67(0.56),   skewness(SD)   =   0.71(0.37),   kurto-
ported that the participant had no history of neurological or psychi-     sis(SD) = −0.54(0.72)) rather than representing the full spectrum of
atric disorders, nor were any taking psychotropic medications. All        possible scores. This questionnaire was completed by the child with
protocols were approved by the University of Nebraska Committee           instruction from the experimenter and is comprised of questions
for the Protection of Human Subjects. The participants and their          related to secondary sex characteristics (e.g., growth of body hair,
parent were informed of all procedures prior to the child's participa-    deepening of voice), the appearance of which are a marker of go-
tion, and a parent of each participant gave written informed consent      nadal hormone release during gonadarche (Susman & Rogol, 2013).
prior to testing in accordance with the Declaration of Helsinki.          The PDS score was not related to sex (Figure 1a; t39 = 0.16, p = .87,
   Six participants did not complete the neuroimaging portion of          d = 0.05), but was positively corelated with age (Figure 1b; t39 = 6.68,
the task. An additional fourteen participants were excluded for fail-     p < .001, d = 2.14). The average full-scale intelligence quotient of
ing to accurately rate the clearly valenced angry (N = 4) and happy       the sample was within normal range as assessed by the two subset
(N = 10) expressions on at least 60% of trials, an accuracy thresh-       Wechsler Abbreviated Scale of Intelligence (WASI; range = 88–142;
old used for adult participants (Brown et al., 2017; Neta et al., 2009,   mean(SD) = 114.18(14.53), however there were missing data for one
2013, 2018; Neta & Tong, 2016). The exclusion criteria for accuracy       participant; Wechsler, 1999), and was not related to age (t38 = −0.92,
is particularly important because, if participants are not accurately     p = .36, d = −0.30) or PDS score (t38 = −0.66, p = .52, d = −0.21).
rating angry faces as negative and happy faces as positive, then it is       Depressive symptoms were quantified using the major de-
difficult to discern the specific valence interpretations of emotional    pression subscale of the Revised Child Anxiety and Depression Scale
ambiguity (i.e., valence bias). The final sample consisted of 41 par-     (RCADS; Chorpita et al., 2000) administered to the child's par-
ticipants (23 female; ages 6–13 years, mean(SD) age = 9.46(2.12))         ent to maintain consistency across the sample given the young
that did not differ in age from those excluded (t59 = 1.44, p = .16,      ages. The non-normality of these data (range = 0–12, possible
d = 0.38; range = 6–13; mean(SD) age = 8.60(2.06)), and who iden-         range = 0–30, mean(SD) = 2.20(2.40), skewness(SD) = 2.06(0.37),
tified as either Caucasian (N = 38), Black/African-American (N = 1),      kurtosis(SD) = 5.95(0.72)) was characterized by a skewness toward
Asian (N = 1), or Unknown (N = 1).                                        to the lower end of the RCADS scale. This scale has been validated in
   Albeit relatively small given the analysis of individual differences   ages as young as 3 years (Ebesutani et al., 2015). However, because
(Dubois & Adolphs, 2016), this sample size allowed us to explore the      our age range (6–13 years) extends below the minimum of stan-
potential relationship between pubertal development, depressive           dardized T scores (grades 3–12), raw scores of the major depression
symptoms, valence bias, and amygdala–mPFC functional connectiv-           subscale were used in the analyses, consistent with a recent study
ity. Further, given that no study has combined this valence bias task     (Vantieghem et al., 2017). One participant reported a major depres-
with neuroimaging in childhood, this exploration aims to serve as         sion score of 12 which, while the age of this participant (7 years) was
a first step in developing a testable model of the development of         below the range included in the published T scores, was associated
depressive symptoms and emotion regulation circuitry as measured          with a T score in the youngest standardized sample (3rd grade) of
by the valence bias task.                                                 74, exceeding the cut-off associated with clinical diagnoses (T = 70;
4 | PETRO ET al.
F I G U R E 1 Descriptive illustration of measures. (a) The sample's PDS scores ranged from 1 to 2.8, out of a highest possible score of 4.
These scores subtend to a low range (mean(SD) = 1.67(0.56), skewness(SD) = 0.71(0.37), kurtosis(SD) = −0.54(0.72)), consistent with the
fact that the age range (6–13 years) of the sample subtended to relatively low PDS scores. Females (N = 23) and males (N = 18) did not differ
as a function of PDS score (t39 = 0.16, p = .87). In each violin plot, the black circle indicates the median (females = 1.60, males = 1.60), and
the lower and upper ends of the black line indicate the first (females = 1.05, males = 1.40) and third (females = 2.15, males = 2.00) quartile
cut-off, respectively. (b) Age was positively related to PDS score (t39 = 6.68, p < .001). Darker dots represent an overlap of participants with
identical age/PDS values. (c) Valence bias scores, computed as the percent of negative ratings of surprised expressions, ranged from 14.29%
to 100% with a mean of 64.66%. The black circle indicates the median (68.42%), and the lower and upper ends of the black line indicate the
first (49.41%) and third (81.12%) quartile cut-offs, respectively
F I G U R E 2 Depiction of procedure. In the valence bias task, participants viewed happy, angry, and surprised faces, and indicated whether
each image “felt good or felt bad.” In the MRI, participants passively viewed new faces (i.e., not overlapping with the valence bias task) during
two runs with blocks of surprised and neutral faces. Two runs with blocks of fearful and neutral faces followed, but were not included in the
present analysis. Faces shown here are from the NimStim Set of Facial Expressions (Tottenham et al., 2009)
Chorpita et al., 2000). However, the inclusion of this participant did valence bias in which they viewed positive (e.g., happy), negative (e.g.,
not qualitatively affect the reported results (see Sections 3.1.2 And angry), and ambiguous (e.g., surprised) images on a black background.
3.2.1). For each image, participants were asked to make a two-alternative,
forced-choice decision (via keyboard press) as quickly and as accu-
rately as possible, indicating whether each image “felt good or felt
2.2 | Procedure bad”; this language and stimuli have been in previous work within
similar age groups (Kestenbaum, 1992; Tottenham et al., 2013). This
2.2.1 | Session 1: behavioral included a set of 48 faces, 24 with an ambiguous valence (surprised
expression), and 24 with a clear valence (12 angry and 12 happy ex-
All experimental stimuli were presented on E-Prime software (ver- pressions). Of the 48 faces, 34 discrete face identities were used (17
sion 2.0.10; Psychology Software Tools, Pittsburgh, PA). In Session males, 17 females) posing angry, happy, and surprised expressions.
1 (Figure 2), participants performed a task to assess their baseline Fourteen identities (seven females, ages 21–30 years) were taken fromPETRO ET al. | 5
the NimStim Set of Facial Expressions (Tottenham et al., 2009) and 20 was unrelated to the behavioral (see Section 3.1.2) and neuroim-
(10 female, age 20–30 years) from the Karolinska Directed Emotional aging results (see Section 3.2.1). Participants viewed a new set of
Faces database (Goeleven et al., 2008). All identities were European/ European/European American faces from the Umeå University
European American. In separate but alternating blocks, scenes from the Database of Facial Expressions (Samuelsson et al., 2012) across
International Affective Picture System (IAPS; Lang et al., 1997) were four experimental runs while positioned in a MRI scanner (Figure 2).
presented, consisting of 24 scenes with an ambiguous valence and 24 Prior to entering the MRI, all participants underwent a mock scan-
with a clear valence (12 negative and 12 positive). The purpose of rat- ning session to acclimate to the environment and practice instruc-
ing the IAPS scenes was outside the scope of the current report, and tions to remain still during scanning. Padding was used to secure the
did not contribute to the valence bias score nor were they included in participants' head in a comfortable, static position. The experiment-
any analysis. All blocks of stimuli included 24 images (12 ambiguous, ers provided feedback and reminders to remain still throughout the
six positive, and six negative) presented in a pseudorandom order (see session.
Figure 2 for a depiction of tasks). Each stimulus was presented for Each experimental run consisted of four blocks of 15 image
1,500 ms followed by a fixation cross for either 200 or 1,900 ms. presentations. Faces were presented for 500 ms and separated by
We calculated the valence bias for each participant as the per- a fixed interstimulus interval of 1,000 ms. The first two runs con-
centage of times that a participant indicated that a particular sur- sisted of two blocks of surprised faces and two blocks of neutral
prised face felt bad (e.g., a valence bias was 100% if that participant faces. Then, two additional runs followed which contained fearful
rated surprised faces as bad on all trials). Note that only the ratings of instead of surprised faces, but their analysis was outside the scope
the surprised faces were used to calculate each valence bias score. of the present report. For the purpose of monitoring participants'
Indeed, ratings of angry and happy faces serve primarily as anchors attention to the stimuli, participants were instructed to make a but-
that support the validity of the valence bias measure. For this rea- ton response each time a flower appeared (instead of a face) on the
son, we excluded participants whose ratings of angry and happy faces screen; within each block, three images of flowers were pseudo-ran-
were below 60% accuracy. Thus, the variability in ratings for angry and domly presented amid the presentation of 12 face stimuli. All stimuli
happy faces is necessarily restricted and would not be a useful mea- during this session were 500 × 750 pixels with a black background.
sure to include when calculating valence bias. Perhaps more impor- Note that, consistent with extant work measuring valence bias, we
tantly, ratings of surprised faces are the best representation of one's used angry and happy faces in the behavioral task because they are
tendency to interpret dual-valence ambiguity as having a positive or clearly negative and positive and also perceptually distinct from
negative meaning, which is indeed what the valence bias measure is surprised faces. However, for the MRI session, we used fearful and
intended to capture. Participants and parents then completed surveys surprised faces because both recruit a similar dorsal region of the
(see above) and participants completed a mock scan (see below). amygdala due to their increased uncertainty (Whalen, 2007) and be-
cause fearful faces are commonly used in studies measuring amyg-
dala reactivity in development (Gee, Gabard-Durnam, et al., 2013;
2.2.2 | Session 2: MRI Gee, Humphreys, et al., 2013; Perlman & Pelphrey, 2011). However
the scope of the current report is focused on the neural responses
Session 2 followed Session 1 by approximately 9 days (mean(SD) to surprised faces given their dual-valence ambiguity and use in the
days = 9.34(6.69), range 1–46 days; Table 1). Days between sessions valence bias task.
TA B L E 1 Descriptive statistics for
Min Max
behavioral variables
Variables Mean (SD) Min Max possible possible
Valence bias (mean % 64.66% (21.76%) 14.29% 100% 0% 100%
negative)
Depressive 2.20 (2.40) 0 12 0 30
Symptoms (RCADS
– Major Depression;
Chorpita
et al., 2000)
Petersen Pubertal 1.67 (0.56) 1 2.8 1 4
Development
Scale (PDS)
score (Petersen
et al., 1988)
Days between 9.34 (6.69) 1 46 — —
sessions6 | PETRO ET al.
2.3 | MRI Parameters impacts valence bias). We conducted two separate moderation anal-
yses, first within the behavioral data, and second related to the MRI
2.3.1 | MRI data acquisition parameters data (see section 2.4.4).
First, to determine whether a more negative valence bias was
The MRI data were collected at the University of Nebraska-Lincoln, related to higher depressive symptoms, the two measures were
Center for Brain, Biology, & Behavior, on a Siemens 3T Skyra scanner submitted to a robust bivariate regression (calculated using the fitlm
using a 32-channel head coil. Structural images were acquired using a command in Matlab) in which valence bias was a predictor of depres-
T1-weighted MPRAGE sequence (TR = 2.20 s, TE = 3.37 ms, slices = 192 sion. Then, the moderating effect of pubertal score on the relation-
interleaved, voxel size = 1.0 × 1.0 × 1.0 mm matrix = 256 × 256, ship between valence bias and depressive symptoms was tested in
FOV = 256 mm, flip angle = 7°, total acquisition time = 5:07). Blood ox- a robust regression with valence bias as the outcome variable; this
ygen level-dependent (BOLD) activity was measured using an EPI scan- model had a constant term and four predictors: (a) depressive symp-
ning sequence (TR = 2.50 s, TE = 30 ms, slides = 42 interleaved, voxel toms, (b) PDS score, (c) the interaction between depressive symp-
size = 2.50 × 2.50 × 2.80 mm, matrix = 88 × 88 mm, FOV = 220 mm, toms × PDS score, and (d) age, which was included in the model as a
flip angle = 80°, total acquisition time = 3:14 per block) in which slices covariate. The interaction term coefficient represented the modera-
were acquired parallel to the intercommissural plane and the volume tion effect. Importantly, the covariate of age was included to assess
positioned to cover the extent of the entire brain. the effect of maturity as measured by PDS score, above and beyond
the effect of age (Wierenga et al., 2014).
Previous studies have shown that differences in relative puber-
2.3.2 | Preprocessing tal timing, or the relative individual differences in pubertal score at
each age, are related to differences in emotion regulation and men-
Preprocessing of MR images was conducted using the Analysis of tal health outcomes (Gee, Gabard-Durnam, et al., 2013; Vantieghem
Functional Neuroimages (AFNI) program suite (Cox, 1996). The first et al., 2017). One possibility is that a moderation effect including va-
four TRs of each run were excluded to allow for scanner stabiliza- lence bias and puberty could reflect a difference in relative pubertal
tion. Voxel time-series were first despiked by removing values with timing, such that those who have a more negative valence bias are
outlying data in each separate voxel's time-series. Then, slice timing those who are either more or less developmentally mature than is
correction was accomplished by re-referencing each scan to the first typical for that age. To test for this possibility, the relative pubertal
slice. These slice time corrected volumes were realigned to the mini- timing scores were submitted to a robust regression with valence
mum outlier image. Each volume was then aligned to the anatomical bias.
image before being warped to the Talairach template atlas (Talairach
& Tournoux, 1988) provided by AFNI. Functional volumes were then
spatially smoothed using a 6 mm3 full width at half maximum kernel. 2.4.2 | BOLD reactivity
The BOLD time-series, in each voxel separately, was normalized by di-
viding each time point by its average across all time points and then To identify brain regions in which BOLD activity related to each
multiplying each time point by 100. Any images containing movements stimulus condition, the BOLD data were submitted to a general
>0.9 mm3, as determined by the motion parameters calculated during linear model (GLM) in which surprise, fear, and neutral blocks were
spatial realignment, were censored frame-wise from further analysis. modeled separately for the four runs of the experiment. These re-
No participants showed excessive movements in more than 16% of gressors included a boxcar function modeling the onset and duration
their scans (mean(SD) = 2.47%(4.37%)), consistent with previous work of each block that was convolved with the hemodynamic response
(Gee, Humphreys, et al., 2013). The number of censored scans did not function. Each run included a constant term and nuisance regres-
differ between surprise and neutral trials (t40 = 0.74, p = .46, d = 0.23), sors: six motion parameters (three rotational and three translational
and was not related to participant age (t39 = −1.50, p = .14, d = −0.48). vectors) calculated during realignment, and both a linear and cubic
polynomial trend model to control for BOLD signal drifts, consistent
with AFNI guidelines given each runs' 172.5 s duration.
2.4 | Statistical analysis
2.4.1 | Behavioral 2.4.3 | BOLD context-dependent connectivity
See Table 1 for descriptive information of analyzed behavioral varia- To assess the functional connectivity between the amygdala and
bles. Although this study aimed to explore a puberty-moderated link the rest of the brain specific to each condition, a context-depend-
between valence bias and both depressive symptoms and amygdala– ent connectivity analysis (i.e., psychophysiological interaction or
mPFC connectivity, the cross-sectional design limited the possibility PPI) was conducted using AFNI commands. Given that previous
of inferring directional associations between these variables (e.g., research has shown that a dorsal region of the amygdala—which is
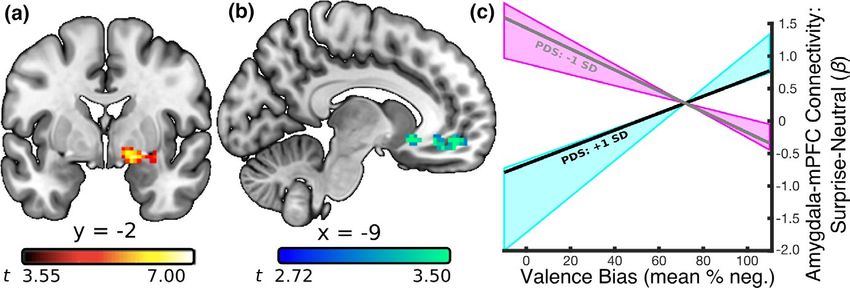
valence bias impacts depressive symptoms or depressive symptoms not typically captured in a structural amygdala region of interest—isPETRO ET al. | 7 particularly sensitive to the ambiguity conveyed by surprised faces the condition-specific amygdala regressors reflect changes in amyg- (Kim, Somerville, McLean, et al., 2003; Whalen et al., 2009), a func- dala connectivity evoked by the blocked stimulus presentation. As tional, rather than structural, amygdala region was used as the seed. in the previously described analysis of BOLD reactivity, nuisance This functional amygdala seed region was defined as the voxels regressors consisted of the six motion models to control for move- showing activation while viewing surprised expressions compared ment artifacts and, because the BOLD activity was analyzed across to baseline (the fixation period between blocks). This contrast was all runs continuously (690 s), five polynomial trends to control for used to identify all voxels functionally related to the surprised ex- BOLD signal drifts, consistent with AFNI guidelines. pressions. The resulting amygdala clusters were considered signif- icant if exceeding a corrected threshold (FWE: p < .05) based on Gaussian Random Field theory (Friston et al., 1994; Hayasaka & 2.4.4 | mPFC–amygdala BOLD connectivity and Nichols, 2003) that avoids the spatial autocorrelation issue raised valence bias by Eklund and colleagues (Eklund et al., 2016). This threshold con- sisted of both a cluster-forming (p < .001) and cluster-extent (k > 21) Connectivity between the amygdala and mPFC during emotional threshold. One voxel cluster, which thus served as the seed region in processing changes across development, such that there is a shift the context-dependent connectivity analysis, showed peak activa- toward more inverse connectivity around age 10 years, thought to tion in the right basal forebrain (peak-t40 = 7.01, p < .001, d = 2.22; support age-related changes in emotion regulatory behaviors (Gee, k = 86; x = 16, y = −4, z = −11) and extended into the dorsal amyg- Humphreys, et al., 2013). The amygdala seed region used in this con- dala (Figure 3a). Highlighting the importance of using this function- nectivity analysis was defined as voxels showing significant activa- ally defined amygdala region, this seed region overlapped in only 10 tion for surprise relative to baseline, a criterion chosen in order to voxels with a structural amygdala region in an atlas from Faria et al. include as many voxels sensitive to the surprised face expressions (2012). as possible. For comparison with valence bias and puberty, the con- To model the face-evoked BOLD activity in this amygdala region, nectivity beta differences for surprise relative to neutral were used the BOLD activity from this dorsal amygdala region was first decon- in order to isolate amygdala connectivity specific to the ambiguity volved with a hemodynamic response function, and then multiplied conveyed through the surprised expressions rather than a general with boxcar functions modeling stimulus onsets and durations sepa- response to facial expressions. Thus, these surprise > neutral con- rately for each condition, resulting in four condition-specific models nectivity beta differences for each participant were submitted to of amygdala activity. Lastly, these condition-specific amygdala re- a robust multiple regression (calculated using the fitlm command in gressors were convolved with a hemodynamic response function. Matlab), separately at each voxel, with a constant term and four pre- These regressors entered a GLM with a constant term, task onset dictors: (a) valence bias, (b) PDS score, (c) the interaction between regressors, and a model of the amygdala activity across the whole valence bias × PDS score, and (d) age, which was included in the duration of the experiment. Thus, the beta values associated with model as a covariate. To determine whether puberty moderated the F I G U R E 3 Relationship between amygdala–mPFC connectivity and negative valence bias as a function of PDS score. (a) A seed region in the right amygdala was defined using the contrast of surprised facial expressions versus baseline (p < .0005). The dorsal position of this cluster within the amygdala is consistent with previous work demonstrating that content conveying ambiguous valence recruits the amygdala/substantia innominata in particular (Kim, Somerville, McLean, et al., 2003; Whalen et al., 2009). (b) A PPI analysis based on surprise > neutral activity in the amygdala seed revealed a relationship between amygdala connectivity and valence bias that was moderated by PDS score in the mPFC (peak-t36 = 4.50, p = .00007). (c) The estimated regression slopes between valence bias and the surprise > neutral amygdala–mPFC connectivity betas, at a lower (gray line; 1 standard deviation below the mean PDS score; t36 = −4.89, p = .00002) and relatively higher (black line; 1 standard deviation above the mean PDS score; t36 = 3.52, p = .001) PDS scores. More mature children (within this relatively immature sample) that have a mature (inverse) connectivity pattern were more likely to have a positive valence bias while those that have the less mature (positive) connectivity pattern were more likely to show a negative valence bias; this relationship reached significance for PDS scores between 2.0 and 2.8 (blue shaded area). Lower PDS scores predicted the opposite relationship between valence bias and amygdala–mPFC connectivity; this relationship reached significance for PDS scores between 1.0 and 1.4 (pink shaded area)
8   |                                                                                                                               PETRO ET al.

relationship between valence bias and amygdala connectivity in any         models and found moderate support for the hypothesis that puberty
mPFC region, the interaction term coefficients, computed at each           moderates the relationship between depression and valence bias
voxel separately, were passed through a cluster-forming (p < .01)          compared to the null hypothesis of no moderation (see Supporting
and -extent threshold (k > 75) according to Guassian Random                Information).
Field theory guidelines for multiple comparison correction (Friston           To explore this moderation, the relationship between valence
et al., 1994; Hayasaka & Nichols, 2003).                                   bias and depressive symptoms was calculated for each PDS score.
                                                                           This relationship became significant between a PDS score of 1.6
                                                                           and 2.8 (out of the sample's range of 1.0–2.8; Figure 4, blue shaded
2.4.5 | Individual differences between BOLD,                               area). To test for potential confounding effects, we ran similar mod-
age, and puberty                                                           eration analyses that included sex (male or female), or number of
                                                                           days between sessions 1 and 2, or excluded the participant with a
Lastly, we examined the direct relationship between the BOLD               supra-threshold clinical major depression score, or excluded partic-
measures (amygdala activation and connectivity with mPFC) and age          ipants who did not identify as Caucasian. Notably, the effects were
and puberty. Specifically, we calculated the average betas values,         qualitatively the same with each of these modifications, suggesting
separately for each participant, for (a) the surprise > neutral BOLD       these variables did not impact the reported findings.
activation for all voxels in the amygdala seed (see Section 2.4.3) and        As an additional analysis we tested whether a difference in rel-
(b) the surprise > neutral amygdala connectivity for all voxels in the     ative pubertal timing is associated with valence bias, which may po-
mPFC (see Section 3.2.1). These average beta values were submit-           tentially confound the moderation effects reported above. Relative
ted to a robust regression with both age and PDS score, yielding four
separate beta coefficients.

3 | R E S U LT S

3.1 | Behavioral

3.1.1 | Valence ratings – Characterizing valence bias

Participants rated angry faces as negative (mean(SD) % nega-
tive = 85.91(11.75); range = 62–100), and happy faces as positive
(mean(SD) % negative = 10.18(9.10); range = 0–30). In contrast,
ratings of surprised faces showed greater variability (Figure 1c;
mean(SD) % negative = 64.66(21.75); range = 14.29–100), and rep-
resented the valence bias for each individual, such that higher scores
indicated a more negative bias. Within this age range, which sub-
tended to relatively low PDS scores, valence bias was not signifi-
cantly related to age (t39 = −0.48, p = .63, d = −0.15) or PDS score
(t39 = −0.42, p = .68, d = −0.14).

                                                                           F I G U R E 4 Relationship between valence bias and depressive
                                                                           symptoms as a function of PDS score. The relationship between
3.1.2 | Depressive symptoms and valence bias                               depressive symptoms and valence bias was moderated by PDS
moderated by puberty                                                       score (t36 = 2.48, p = .02) such that valence bias and depressive
                                                                           symptoms shared a stronger positive relationship at relatively
Table 1 lists the descriptive statistics for the behavioral variables. A   higher PDS scores. The estimated regression slopes for the
                                                                           relationship between valence bias and depressive symptoms at
bivariate robust regression revealed that valence bias was positively
                                                                           different PDS scores illustrate that a lower PDS score (gray line; 1
related to depressive symptoms (t39 = 2.29, p = .03, d = 0.73), such       standard deviation below the mean PDS score; t36 = −0.06, p = .95)
that those with a more negative bias had higher depressive symp-           predicted no relationship, whereas a higher PDS score (black line;
toms. For the moderation analysis, the interaction between depres-         1 standard deviation above the mean pubertal score; t36 = 2.63,
sive symptoms and PDS score was significant (t36 = 2.48, p = .02,          p = .01) predicted a positive relationship; this relationship reached
                                                                           significance for PDS scores between 1.6 and 2.8 (blue shaded area).
d = 0.83; Figure 4) indicating that puberty, when controlling for age,
                                                                           At no point did lower PDS scores predict a significant relationship
moderated the relationship between depression and valence bias.
                                                                           between valence bias and depressive symptoms, therefore no
As an additional means to address the concern of sample size in            shaded area (region of significance) is illustrated around the −1 SD
this model, we also conducted the moderation analyses in Bayesian          line
PETRO ET al. | 9
pubertal timing was operationalized as the residuals of the rela- (inverse) connectivity pattern had a more positive valence bias. The
tionship between PDS score and age. These relative pubertal tim- opposite effect (i.e., a more negative valence bias predicted more
ing scores were not related to valence bias across all participants inverse amygdala–mPFC connectivity) was significant at PDS scores
(t39 = −0.17, p = .86, d = −0.05). 1.0–1.4 (Figure 3c, pink shaded area).
As with the behavioral results (see Section 3.1.2), we tested for
potential confounding effects by rerunning the moderation analy-
3.2 | MRI ses and including sex, or number of days between sessions 1 and 2,
or excluding the participant with a supra-threshold clinical major
3.2.1 | Context-dependent amygdala–mPFC depression score, or excluding participants who did not identify
connectivity and valence bias as Caucasian. In addition, although surprise > neutral amygdala
activation was not related to amygdala connectivity (t39 = −1.10,
The relationship between surprise > neutral amygdala connec- p = .28), we ran another moderation which included amygdala acti-
tivity and valence bias, when controlling for age, was moderated vation as a covariate to test whether the connectivity moderation
by puberty in two clusters (Table 2). In other words, those with a effect was confounded by the level of BOLD activation. Notably,
higher PDS score (within this relatively immature sample) showed the effects were qualitatively the same with each of these modi-
an effect whereby a more positive valence bias was associated fications, suggesting these variables did not impact the reported
with a more inverse (mature, i.e., suggestive of emotion regulation) findings.
connectivity in these regions. The first cluster showed peak acti- It is also important to note that the BOLD signal within the
vation in the right subcollosal gyrus (peak-t36 = 5.52, p = .000003, amygdala is sensitive to signal dropout (Krasnow et al., 2003).
d = 1.84; k = 170; Talaraich (x, y, z) coordinates: 11, 11, −14) and Because the PPI analysis consists of correlations between BOLD
extended into the right rectal gyrus and right anterior cingulate. signals in different brain regions, the diminished signal may lead
The second cluster showed peak activation in the left medial fron- to false-positive or false-negative correlations related to noise.
tal gyrus (Figure 3b; peak-t36 = 4.50, p = .00007, d = 1.50; k = 92; To rule out the possibility that the current results were driven
Talaraich (x, y, z) coordinates: −11, 49, −11) and extended into by signal dropout, we performed the same PPI and moderation
the left anterior cingulate, consistent with reports of amygdala analysis, but applied an intensity-based mask, calculated as de-
connectivity with the mPFC (Kim, Somerville, Johnstone, et al., scribed by Peer et al. (2016) and implemented using these au-
2003). Again, as an additional means to address the concern of thors' Matlab code as provided on their webpage (Computational
sample size in this model, we conducted the moderation analyses Neuropsychiatry Lab - Intensity Based Masking (IBM) Tool, n.d.) to
in Bayesian models and found strong support for the hypothesis remove amygdala voxels with low signal in each individual partici-
that puberty moderates the relationship between valence bias and pant. The results of this analysis were qualitatively identical to the
amygdala–mPFC connectivity compared to the null hypothesis of moderation analysis reported above.
no moderation (see Supporting Information).
To explore the moderation within this latter mPFC cluster, the
conditional effects of puberty were calculated from the intercept 3.2.2 | Individual differences between BOLD,
and slope of the relationship between valence bias and the voxel age, and puberty
averaged amygdala–mPFC connectivity beta values; this was done
separately at each PDS score in this sample (range = 1.0–2.8). These To describe the basic relationship between the BOLD measures and
conditional effects (Figure 3c) indicated that for those with a rela- age and puberty, the surprise > neutral amygdala BOLD activation
tively higher PDS score (2.0–2.8; i.e., the highest scores in this sam- betas and the amygdala–mPFC connectivity betas were submitted
ple), the relationship between valence bias and amygdala–mPFC to a robust regression with age and PDS score. Neither amygdala ac-
connectivity was more positive (Figure 3c, blue shaded area). In tivation nor connectivity were related to age (activation: t39 = 0.68,
other words, children with both a higher PDS score and a less mature p = .50, d = 0.22; connectivity: t39 = −0.19, p = .85, d = −0.06) or
(positive) connectivity pattern had a more negative valence bias. In PDS score (activation: t39 = 0.08, p = .94, d = 0.03; connectivity:
contrast, children with both a higher PDS score and a more mature t39 = −0.37, p = .72, d = −0.12).
Finally, we used a Cox test (Greene, 2003) to compare the fit
TA B L E 2 Clusters of significant BOLD surprise > neutral
of the model that measures the moderating effect of puberty (see
amygdala connectivity whose relationship with valence bias was
moderated by pubertal score section 3.2.1) with a second model in which puberty is replaced by
age as the moderating variable. This analysis found that the model
Region x y z Peak-t k including puberty compared to the model including age explained
R Subcollosal 11 11 −14 5.52 170 more variance in amygdala–mPFC connectivity (z = −3.72, p = .0002;
Gyrus but note that both models explained significant variance in depres-
L Medial −11 49 −11 4.50 92 sion symptomology). In other words, as expected, brain activity was
Frontal Gyrus
more sensitive to the biological changes that occur during puberty,10 | PETRO ET al.
as there does appear to be a unique role for pubertal variability in Thus, the valence assigned to surprised expressions presented
moderating these overarching effects. without context is more pliable to interpretation. The use of stimuli
with dual-valence ambiguity represents a methodological advance in
conceptualizing negativity bias in that it side-steps limitations pres-
4 | D I S CU S S I O N ent in extant literature. For instance, negativity bias is often mea-
sured via either an attentional bias toward clearly negative or away
Within this relatively pubertally immature sample, higher PDS scores from clearly positive stimuli (see Fales et al., 2008) or by examining
coupled with a more negative valence bias were associated with responses to ambiguous stimuli with alternate meanings that could
more depressive symptoms and less inverse amygdala–mPFC con- be either negative or neutral, but not positive (e.g., “lie”; Mathews
nectivity (suggestive of weaker emotion regulation). Broadly, this et al., 1989). These findings not only rely on cognitive/linguistic abil-
pattern of exploratory results is consistent with the notion that in- ities not developmentally appropriate for children, but by not exam-
ternalizing problems, such as depression, arise from dysfunctional ining responses to stimuli with a dual-valence representation (i.e.,
emotion regulation circuitry (Banks et al., 2007; Phillips et al., 2008) negative and positive possible interpretations), these earlier findings
and, more specifically, that this link arises from developmental dif- are skewed toward the extremes of the valence spectrum. As such,
ferences (Gee, Gabard-Durnam, et al., 2013; Gee, Humphreys, et al., this earlier work is limited in its ability to identify individual differ-
2013; Hare et al., 2008; Perlman & Pelphrey, 2011). ences in responses to emotional stimuli during sensitive periods of
Given that this amygdala–mPFC circuit is intimately tied to bio- development, and thus has more limited findings regarding the de-
logical changes during puberty (Andersen & Teicher, 2008; Angold & velopmental origins of negativity bias. Future work will benefit from
Costello, 2006; Paus et al., 2008), the early pubertal period explored incorporating our valence bias task to examine individual differences
in this study may be critical in the construction of healthy emotion in emotion reactivity and regulation, particularly in young ages.
regulation mechanisms. These exploratory results support a model These findings make a meaningful first step toward establishing
for future research which predicts that, while negative valence bias the developmental origins of negativity bias. One caveat is the rela-
in early childhood is normative, negative bias in later development tively small sample size with somewhat limited variance in depressive
is putatively maintained by the failure to develop a more mature, symptoms, and that the PDS was only administered to children ages
regulatory frontoamygdalar circuitry, which may increase the risk for 8 years and older. Future work should replicate our exploratory find-
depression. ings in larger samples with a wider range of depressive symptoms
These findings are consistent with our “initial negativity hypoth- and also determine the extent to which these findings, which use
esis” that posits that the initial or default interpretation of surprise parent-reported subclinical depression (see; Muris et al., 2003), gen-
is more negative (Neta et al., 2011; Neta & Tong, 2016; Neta & eralize to those with clinically diagnosed or self-reported depression.
Whalen, 2010). In contrast, positive ratings depend upon slower and Further, future work should also explore the extent to which the ef-
more elaborate emotion regulation processes which override the ini- fects generalize to the range of mental health disorders in which in-
tial negativity and putatively downregulate the amygdala response ternalizing problems manifest. Finally, although there was no explicit
(Kaffenberger et al., 2010; Kim, Somerville, Johnstone, et al., 2003; emotion regulation task, a more inverse frontoamygdalar connec-
Neta et al., 2011; Neta & Tong, 2016; Neta & Whalen, 2010; Petro tivity is thought to represent emotion regulation (Gee, Humphreys,
et al., 2018), processes that are likely compromised in depression et al., 2013; Ochsner et al., 2004). Indeed, the connectivity in these
and anxiety (Beck, 1976; Reef et al., 2011; Williams et al., 2007). children spanned both positive and negative values, consistent with
Indeed, age-related differences in this emotion regulation circu- previous studies (Gee, Humphreys, et al., 2013; Hare et al., 2008)
ity (i.e., amygdala–mPFC connectivity; Gee, Humphreys, et al., which suggest that inverse connectivity (rather than a lack of posi-
2013) are associated with mental health risk factors in adults (Hare tivity connectivity) may be associated with a more adult-like regula-
et al., 2008). The current results extend this “initial negativity hy- tory circuitry. While this study treated connectivity as a continuous
pothesis” by suggesting that individual differences in valence bias measure in order to test its relationship to valence bias and puberty,
may originate during pubertal development, alongside the develop- future work with larger sample sizes in normative adults should aim
ment of this emotion regulatory circuitry that putatively overrides to identify the point at which negative frontoamygdalar connectivity
the default, or initial negativity. defines an emotion regulatory process.
The utility of surprised faces in tracking individual differences Whether or not long-term mental health trajectories are im-
in negativity bias and emotion regulation brain circuits is broadly pacted by environmental factors may also be explored in future re-
consistent with a functional—contextual account of facial displays search. For instance, early life stress is a risk factor for mental health
(Crivelli & Fridlund, 2018), which predicts that an expression's emo- disorders (Tottenham et al., 2011) and is associated with develop-
tional value depends on its social, environmental, and/or cultural mental differences in regulatory circuitry (Cohodes et al., 2020;
context (Barrett & Kensinger, 2010). Whereas happy and angry ex- Heim & Binder, 2012; Lupien et al., 2009). Recent work suggests
pressions signal predominantly positive or negative social outcomes, that positive affect (Sewart et al., 2019) and even more specifically,
respectively, surprised faces signal multiple possible outcomes span- an earlier developmental shift toward a more positive valence bias
ning positive and negative valence (i.e., dual-valence ambiguity). (Gee, Gabard-Durnam, et al., 2013; Vantieghem et al., 2017) mayPETRO ET al. | 11 serve as a buffer from the development of depressive symptoms. Finally, there are a few limitations worth noting. First, although This suggests that resiliency, or the ability to find a positive outlook the face stimuli used here were taken from previous work examining in potentially negative situations (Gross & John, 2003), may impli- valence bias (Neta et al., 2009) even using a developmental sample cate the same emotion regulation mechanism explored in this study (Tottenham et al., 2013), one potential limitation of this work is that (Tugade & Fredrickson, 2004). the face stimuli were exclusively adult facial expressions. Indeed, The moderating role of puberty on the relationship between previous research has shown better facial identity recognition and valence bias and depressive symptoms occurred earlier in matura- memory for own-age faces (Anastasi & Rhodes, 2005; Denkinger tion (starting at a PDS score of 1.6 and up to the highest score in & Kinn, 2018). Having said that, children appear to perform equally this sample of 2.8) than the relationship between valence bias and well at identifying facial expressions (Vetter et al., 2018) of children brain connectivity (starting at a PDS score of 2 and up to the highest versus adult faces. In addition, given that the participants range from score in this sample of 2.8). Although cross-sectional, these findings 6 to 13 years of age, the use of appropriately age-matched actors provide preliminary evidence that a change toward a more positive would introduce a new challenge of providing different stimuli to valence bias and away from depressive symptoms may have down- participants of different ages. Future studies comparing valence bias stream effects on developing more adult-like brain connectivity pat- across child and adult facial expressions in a developmental sam- terns. Future longitudinal work should extend our exploratory work ple will be useful for identifying the impact of this methodological and aim to (a) test the prediction that the maintenance of negative choice. Second, the present findings did not replicate the age-related valence bias is associated with both an increase in depressive symp- decrease in amygdala activity (Gee, Humphreys, et al., 2013; Guyer toms and a slower development of (inverse) amygdala–mPFC con- et al., 2008; Hare et al., 2008). This discrepancy may have arisen nectivity, and (b) establish the directionality these relationships. The because the current sample was aged 6–13 years, which is on the opposite relationship between valence bias and amygdala–mPFC low end of pubertal maturation and thus may not capture the full connectivity was also observed at a PDS score of 1.4 and below. range of biological changes which affect the amygdala (Blakemore However, our predictions about the effects in those at the earliest et al., 2010; Goddings et al., 2014; Vijayakumar et al., 2019). Indeed, stages of puberty were less clear, particularly before the point at previous work showing an age-related decrease in amygdala activity which puberty moderates the link between valence bias and depres- reported such an effect only after adolescence (Gee, Humphreys, sive symptoms (below a PDS score of 1.6) and given the assumed et al., 2013; Hare et al., 2008). Third, we note that the reported ef- scores in children ages 6–7 years. fect sizes may be inflated, given recent work showing that lower Because females and males show different age onsets in pu- sample sizes are susceptible to biased and unstable effect sizes berty (Schuiling & Likis, 2016), maturity was measured via a scale (Marek et al., 2020). Lastly, the pattern of results reported here was of pubertal development. While sex differences in depression tend achieved using two separate moderation analyses and did not di- to emerge after the age of 13 (i.e., outside of this sample's range; rectly test the relationship between depression and brain activity, Ferguson et al., 1999; Hankin & Abramson, 2001), other work has given there was insufficient power to relate these measures in the shown that there are important sex differences in the emergence of context of both valence bias and puberty. In other words, additional depression (Graber, 2013; Hankin et al., 1998). If negative valence work may test the degree to which developmental differences in de- bias is a risk factor for depression, then sex may moderate the rela- pression are linked with emotion regulation circuitry, and if valence tionship between these two variables. Relatedly, early pubertal tim- bias is a risk factor for these developmental differences. ing is also a risk factor for depression in females in particular (Hankin & Abramson, 2001). Given that this study was underpowered to test AC K N OW L E D G E M E N T S potential sex differences, continued work should explore, in wider This work was supported by the National Institutes of Health ranges of age and PDS, whether sex differences in the relationships (NIMH111640; PI: Neta), and by Nebraska Tobacco Settlement between valence bias, depression, and emotion regulation circuitry Biomedical Research Enhancement Funds. We thank Rebecca L. emerge in older ages. Further, this future work could also explore Brock for consultation regarding statistical analyses. We thank Lisa whether or not normative pubertal timing differences predict differ- Crockett for consultation regarding the use and interpretation of the ences in valence bias and emotion regulation skills. Pubertal Development Scale. We thank R. James Blair and Leah H. Future longitudinal work may also hold broad implications for Somerville for helpful comments on the manuscript. We also thank treating mental health. For instance, the effects reported here may Ruby Basyouni, Kayla Clark, Daniel J. Henley, and Tien T. Tong for pinpoint developmental periods most sensitive to long-term men- assistance in data collection and management. tal health outcomes. Such information will be critical for inform- ing potential interventions (e.g., mindfulness), which can improve C O N FL I C T S O F I N T E R E S T emotion regulation success and decrease negativity bias (Goldin & The authors declare that they have no competing interests. Gross, 2010; Jazaieri et al., 2014). These types of training may be particularly useful for individuals that putatively maintain a negativ- DATA AVA I L A B I L I T Y S TAT E M E N T ity bias beyond a normative developmental stage such that this bias The data relevant to this manuscript are available on the NIH interferes with normal, healthy functioning. National Database Archive.
You can also read