Review article: A systematic review and future prospects of flood vulnerability indices
←
→
Page content transcription
If your browser does not render page correctly, please read the page content below
Nat. Hazards Earth Syst. Sci., 21, 1513–1530, 2021
https://doi.org/10.5194/nhess-21-1513-2021
© Author(s) 2021. This work is distributed under
the Creative Commons Attribution 4.0 License.

Review article: A systematic review and future
prospects of flood vulnerability indices
Luana Lavagnoli Moreira1 , Mariana Madruga de Brito2 , and Masato Kobiyama1
1 Institute
         of Hydraulic Research, Federal University of Rio Grande do Sul, Porto Alegre 91501-970, Brazil
2 Departmentof Urban and Environmental Sociology, Helmholtz Centre for Environmental Research,
Leipzig 04318, Germany

Correspondence: Mariana Madruga de Brito (mariana.brito@ufz.de)

Received: 26 January 2021 – Discussion started: 29 January 2021
Revised: 14 April 2021 – Accepted: 14 April 2021 – Published: 17 May 2021

Abstract. Despite the increasing body of research on flood         1   Introduction
vulnerability, a review of the methods used in the construc-
tion of vulnerability indices is still missing. Here, we ad-
dress this gap by providing a state-of-art account on flood        Floods affect billions of people worldwide (Zarekarizi et al.,
vulnerability indices, highlighting worldwide trends and fu-       2020). Indeed, according to the Emergency Events Database
ture research directions. A total of 95 peer-reviewed articles     (CRED, 2019), around 50 000 people died and approxi-
published between 2002–2019 were systematically analyzed.          mately 10 % of the world population was affected by floods
An exponential rise in research effort is demonstrated, with       between 2009 and 2019. Due to population growth and cli-
80 % of the articles being published since 2015. The major-        mate change, more frequent and widespread floods are an-
ity of these studies (62.1 %) focused on the neighborhood          ticipated (Hirsch and Archfield, 2015; Leung et al., 2019).
followed by the city scale (14.7 %). Min–max normalization         Therefore, flood risk management is required for mitigating
(30.5 %), equal weighting (24.2 %), and linear aggregation         potential damages.
(80.0 %) were the most common methods. With regard to                 Nowadays there is a consensus that risk (i.e., the poten-
the indicators used, a focus was given to socioeconomic as-        tial for adverse impacts) is not driven solely by natural haz-
pects (e.g., population density, illiteracy rate, and gender),     ards (e.g., floods, droughts) but depends on the interactions
whilst components associated with the citizen’s coping and         between hazards, exposure, and vulnerability (IPCC, 2012,
adaptive capacity were slightly covered. Gaps in current re-       2014). In this regard, vulnerability plays an important role in
search include a lack of sensitivity and uncertainty analyses      flood risk assessment. It encompasses multiple social, eco-
(present in only 9.5 % and 3.2 % of papers, respectively), in-     nomic, physical, cultural, environmental, and institutional
adequate or inexistent validation of the results (present in       characteristics which influence the susceptibility of the ex-
13.7 % of the studies), lack of transparency regarding the ra-     posed elements to the impact of hazards (Birkmann et al.,
tionale for weighting and indicator selection, and use of static   2013; UNDRR, 2017). Due to its importance, the need to un-
approaches, disregarding temporal dynamics. We discuss the         derstand and assess flood vulnerability has been highlighted
challenges associated with these findings for the assessment       by international initiatives such as the Sendai Framework for
of flood vulnerability and provide a research agenda for at-       Disaster Risk Reduction 2015–2030 (UNISDR, 2015).
tending to these gaps. Overall, we argue that future research         In response to this, numerous studies have been under-
should be more theoretically grounded while, at the same           taken to better understand flood vulnerability. Nevertheless,
time, considering validation and the dynamic aspects of vul-       both the terminology and methodology used in these assess-
nerability.                                                        ments are still a subject of discussion (Aroca-Jiménez et al.,
                                                                   2020; Kelman, 2018). In fact, some consider vulnerability as
                                                                   being a function of exposure and susceptibility (Balica et al.,
                                                                   2009; IPCC, 2001; Turner et al., 2003; UNDP, 2014), while

Published by Copernicus Publications on behalf of the European Geosciences Union.
1514         L. L. Moreira et al.: Review article: A systematic review and future prospects of flood vulnerability indices

others separate these concepts (Dilley et al., 2005; Fedeski       investigation of the methods used for normalizing, weight-
and Gwilliam, 2007) as it is possible to be exposed to a haz-      ing, aggregation, and validation and the implications for each
ard and not be vulnerable. For instance, a person may live in      choice for vulnerability assessment have received little at-
an area prone to natural hazards but have sufficient alterna-      tention so far. In addition, even though there have been re-
tives to modify the structure of their house to prevent poten-     cent advancements in the field (e.g., Cutter and Derakhshan,
tial losses (Cardona et al., 2012).                                2020), the temporal dynamics of flood vulnerability have
   A wide range of approaches have been proposed for as-           not been tackled by the existing reviews. This is particu-
sessing flood vulnerability. The most commonly used meth-          larly important given that certain adaptation policies and
ods are stage damage functions (Papathoma-Köhle et al.,            strategies may reduce short-term risk probability but increase
2012, 2017; Tarbotton et al., 2015), damage matrices (Bründl       long-term vulnerability and exposure (Cardona et al., 2012).
et al., 2009; Papathoma-Köhle et al., 2017), and vulnerabil-       Therefore, a better understanding of the methods used in
ity indices (Birkmann, 2006; de Brito et al., 2017; Kappes         each step of the index construction, the vulnerability tempo-
et al., 2012; Moreira et al., 2021). The first two methods as-     ral dynamics (e.g., pre- and post-flood), and the uncertainty
sess only the physical vulnerability, neglecting the social vul-   involved is needed for advancing research on flood vulnera-
nerability of their inhabitants (Koks et al., 2015). However,      bility assessments.
the capacity of households to cope, adapt, and respond to             Considering the aforementioned gaps, and given the pro-
hazards is equally important for assessing the potential im-       liferation of methods for building vulnerability indices, it is
pacts of floods (de Brito et al., 2018). Therefore, given the      pertinent to review the development of this field. Hence, here,
importance of holistic studies on vulnerability to ensure a        we carried out a systematic literature review of indices used
better representation of reality, the use of vulnerability in-     to assess flood vulnerability. The focus is given to urban and
dices is recommended (Balica et al., 2013; Birkmann et al.,        riverine floods. The following questions guided the analysis:
2013; Fuchs et al., 2011; Nasiri et al., 2016). Indices serve      (1) which spatial scale was considered? (2) Which indica-
as a summary of complex and multidimensional issues to as-         tors were most commonly used to measure flood vulnerabil-
sist decision-makers, to facilitate the interpretation of a phe-   ity? (3) How were the temporal dynamics of vulnerability
nomenon, and to increase public interest through a summary         addressed (e.g., pre- or post-flood event)? (4) Which meth-
of the results. Flood vulnerability indices are, therefore, a      ods were most commonly applied in each stage of the index
tool for measuring the vulnerability degree throughout the         building process (i.e., normalization, weighting, or aggrega-
aggregation of several indicators or variables. Despite their      tion)? (5) To which extent did these studies conduct valida-
advantages, indices can present misleading messages if they        tion and apply uncertainty and sensitivity analysis? In ad-
are poorly constructed or misinterpreted. Hence, a clear un-       dition to highlighting existing challenges, we also point out
derstanding of the normalization, weighting, and aggregation       directions for further research.
methods used to build an index is required (Moreira et al.,
2021).
   Over the past few years, several review articles about          2   Overview of indicators and indices
flood vulnerability have been published. For instance, Ru-
fat et al. (2015) reviewed 67 articles to identify the             In general, indicators consist of various pieces of data ca-
leading drivers of social vulnerability to floods. Rehman          pable of synthesizing the characteristics of a system. When
et al. (2019) and Fatemi et al. (2017) reviewed different          these indicators are aggregated, they are called index or com-
methodologies used for assessing flood vulnerability. Jurgile-     posite indicators (Saisana and Tarantola, 2002). Overall, the
vich et al. (2017) systematically reviewed 42 climate risk and     construction of an index comprehends seven steps (Fig. 1).
vulnerability assessments. More recently, Diaz-Sarachaga           First, the phenomenon to be measured is defined, so that the
and Jato-Espino (2020) evaluated 72 articles related to the        index results can provide a clear understanding of this phe-
appraisal of vulnerability in different types of hazards in ur-    nomenon (Nardo et al., 2008). Then, the indicators used to
ban areas. Some studies also analyzed different methods and        measure the phenomenon are selected. This should be done
indexed construction designs to understand which decisions         carefully as the results reflect the quality of the selected indi-
have the greatest influence on the vulnerability outcomes. For     cators.
instance, Nasiri et al. (2016) compared damage curves, com-           In the third step, the relationships between the selected in-
puter modeling, and indicators to evaluate flood vulnerabil-       dicators are identified. Indicators with similar characteristics
ity. Similarly, Schmidtlein et al. (2008) and Tate (2012, 2013)    can be grouped, aiming to reduce the number of variables.
examined the sensitivity of the results to changes in the con-     To this end, statistical analysis (e.g., principal component
struction of the vulnerability index.                              analysis – PCA) or expert knowledge can be used to decide
   Notwithstanding these advances, to the best of our knowl-       whether the indicators are sufficient or appropriate for de-
edge, no study has conducted a systematic review of flood          scribing the phenomenon (Nardo et al., 2008). After select-
vulnerability indices with a focus on the different stages in-     ing the indicators, they need to be normalized to a common
volved in the construction of flood vulnerability indices. The     scale before being aggregated into an index as they usually

Nat. Hazards Earth Syst. Sci., 21, 1513–1530, 2021                                 https://doi.org/10.5194/nhess-21-1513-2021
L. L. Moreira et al.: Review article: A systematic review and future prospects of flood vulnerability indices 1515
Table 1. Characteristics of the main normalization methods used for building indices.
Method Equation Description Reference
Ranking yin = Rank(xin ) Based on ordinal variables that can be turned Carlier et al. (2018)
into quantitative variables.
Z scores yin = xinσ− x̄in
x̄in
Converts all indicators to a common scale with Gerrard (2018)
a mean of 0 and a standard deviation of 1.
xin −min(xin )
Min–max yin = max(x Rescales values between 0 (worst rank) and 1 Jha and Gundimeda (2019)
in )−min(xin )
(best rank). It subtracts the minimum value and
divides it by the range of the maximum value
subtracted by the minimum value.
xin
Distance from the yin = max(x Rescales values between 0 and 1. It is defined Munyai et al. (2019)
in )
group leader as the ratio of the value of the indicator to its
maximum value.
Division by total yin = Px(xin ) It is defined as the ratio of the value of the Jamshed et al. (2019)
in
indicator to the total value for the indicator.
0 if xin < P 15
20 if P 15 ≤ xin < P 25
40 if P 25 ≤ xin < P 65
Categorical scale yin = Assigns a value for each numeric or qualitative De Andrade and Szlafsztein
60 if P 65 ≤ xin < P 85
indicator. Values are based on percentage. (2018)
80 if P 85 ≤ xin < P 95
100 if x ≤ x t
in qc
Binary standard None It is calculated using simple Boolean 0 and 1 Garbutt et al. (2015)
(false and true) values.
Note: y is the transformed variable of x for indicator i for unit n. P i is the i th percentile of the distribution of the indicator xin , and p is an arbitrary threshold around the mean.
Figure 1. Overview of the different steps involved in constructing an index.
have different units of measurement (see Table 1 for the main The sixth step consists of sensitivity and uncertainty anal-
normalization methods). By doing so, problems with outliers yses (see Table 3 for the main uncertainty and sensitivity
can also be reduced (Jacobs et al., 2004). methods). The first evaluates the contribution of the uncer-
The fifth step comprises the weighting and aggregation tainty source of each indicator to the variance of the results,
of the indicators. Weights can be assigned to indicators to while the latter focuses on how the uncertainty of each indi-
demonstrate their importance in relation to the studied phe- cator propagates through the index structure and affects the
nomenon (see Table 2 for the main weighting methods). outputs (Saisana et al., 2005; Saisana and Tarantola, 2002).
Given that it may be difficult to find an acceptable weight- The final step comprises the validation of the index results.
ing scheme, equal weights are often used, which implies that This is crucial for verifying if they are consistent with the
all criteria are worth the same (de Brito et al., 2018). Alter- real system and have a satisfactory precision range. Valida-
natively, an equal weighting scheme could be the result of tion can be achieved by using independent secondary data
a lack of knowledge about the indicators’ importance. After that refer to observable outcomes. Since vulnerability is not
the indicators are weighted, they are aggregated. The most a directly observable phenomenon, its validation requires
common aggregation methods are linear and geometric. The the use of proxies such as mortality and built environment
linear method consists of the weighted and normalized sum damage (Schneiderbauer and Ehrlich, 2006), post-event sur-
of indicators, whereas the geometric aggregation represents veys (Fekete, 2009), number of disasters (Debortoli et al.,
the output of the indicators for which the exponent is their 2017), and emergency service requests (Kontokosta and Ma-
assigned weight (Nardo et al., 2008). lik, 2018).
https://doi.org/10.5194/nhess-21-1513-2021 Nat. Hazards Earth Syst. Sci., 21, 1513–1530, 20211516 L. L. Moreira et al.: Review article: A systematic review and future prospects of flood vulnerability indices
Table 2. Characteristics of the main weighting methods used for building indices.
Type Method Description Reference
– Equal weighting All indicators receive the same weight. Hernández-Uribe
et al. (2017)
Statistically Principal component analy- PCA is used for factor extraction. The weights Gu et al. (2018)
based sis (PCA)/factor analysis are obtained from the rotated factor matrix since
the area of each factor represents the proportion
of the total unit of the variance in the indicators
that is explained by the factor.
Entropy method Weights are assigned based on the degree of Lianxiao and Morimoto
variation in the indicator values. (2019)
Participatory or Expert opinion Experts agree on the contribution of each Shah et al. (2018)
expert based indicator for the studied problem.
Public opinion They focus on the notion of people’s concern Schuster-Wallace
about certain problems measured by the et al. (2018)
indicators.
Multicriteria decision- It is a set of methods based on multiple De Brito et al. (2018)
making (MCDM) criteria and objectives for structuring and
evaluating alternatives.
Table 3. Characteristics of the main methods for uncertainty and sensitivity analysis used for building indices.
Method Description Reference
One-at-a-time sensitiv- By changing input data parameters, it was verified how these De Brito et al. (2019)
ity analysis disturbances affected the results when all the other parameters
remained constant.
Monte Carlo simulation Computational algorithm which uses a probabilistic method that Feizizadeh and Kienberger (2017)
uses repeated random sampling.
Statistical tools Use of statistical tools such as regression, correlation analysis Moreira et al. (2021);
and cross validation. Nazeer and Bork (2019)
3 Methods words “index” or “composite indicator” were not mentioned
in the article’s abstract, title, or keywords. Hence, this limi-
tation should be acknowledged, as relevant articles may have
A bibliographic search was performed by focusing on studies been disregarded.
that constructed flood vulnerability indexes. The Web of Sci- Following their selection, the articles were classified ac-
ence (WoS) database was used to identify peer-reviewed arti- cording to (1) publication year, (2) study area country, (3)
cles published since 1945, using the following Boolean key- spatial scale (e.g., neighborhood, household, or city), (4) re-
words: (“flood” OR “flooding”) AND (“index” OR “compos- gion classification (e.g., urban, rural,1 or both), (5) number of
ite indicator”) AND (“vulnerability” NOT “coast*”). Only indicators, (6) whether or not there was a reduction in the in-
the abstract, title, and keywords were searched. This nar- dicators (e.g., PCA and expert knowledge), (7) temporal dy-
rowed the search space substantially. namics (pre- or post-flood), (8) normalization, aggregation,
These queries elicited over 348 articles published between and weighting methods used, and (9) if there uncertainty and
January 2002 and December 2019. At first, the title, abstract, validation analysis were performed. A complete list of the
and keywords were screened manually to exclude articles reviewed papers is presented in the Supplement.
that were not useful for the purpose of the present study. Af-
ter this preselection, the full text of 84 selected papers was
revised in detail. An additional 11 key articles were included.
They were not found in our original search even though they 1 Here, rural areas are defined as sparsely populated areas,
built vulnerability indices. This occurred because the key- whereas urban areas are considered densely populated regions.
Nat. Hazards Earth Syst. Sci., 21, 1513–1530, 2021 https://doi.org/10.5194/nhess-21-1513-2021L. L. Moreira et al.: Review article: A systematic review and future prospects of flood vulnerability indices 1517
Figure 2. Flood vulnerability index studies. (a) Temporal distribution from 2002 to 2019. For the standardized number of articles according
to the total number of publications in the WoS database, see Appendix A (Fig. A1). (b) Geographical distribution.
4 Results and discussion Overall, most of the assessments were conducted in Asia
(45.3 %), followed by the Americas (24.2 %), and encom-
4.1 Flood vulnerability indices at a glance passing 38 countries (Fig. 2b). This was expected as, ac-
cording to the Emergency Events Database (EM-DAT) statis-
An increasing number of studies that built flood vulnerabil- tics, between 2002 and 2019 Asia showed the highest num-
ity indices can be observed in recent years, with about 80 % ber of deaths caused by floods (1027 deaths; CRED, 2019).
(n = 76) of the articles being published since 2015 (Fig. 2a), As such, the studies are highly concentrated in a few coun-
which is also the year that the Sendai Framework for Disaster tries, namely China (n = 14), Brazil (n = 8), India (n = 6),
Risk Reduction (UNISDR, 2016) was agreed among several Pakistan (n = 6), and the United States (n = 6). Meanwhile,
member states. Therefore, the growing number of publica- there were fewer studies in East and West Africa, despite
tions may result from the increasing awareness of flood dis- the frequent occurrence of floods and the high mortality they
aster prevention and reduction policies. The increasing num- cause across these regions.
ber of vulnerability indices studies could also be attributed In terms of spatial scale, most of the studies were con-
to the ease of using indices to address complex and multi- ducted at the neighborhood scale (62.1 %), followed by city
dimensional issues such as flood vulnerability in contrast to (14.7 %), household (12.6 %), group of cities (7.4 %), vari-
methods that demand more data (e.g., damage curves). Alter- ous scales (2.1 %), and state scale (1.1 %). Similar outcomes
natively, this increase may just match a general rise in pub- were obtained by Diaz-Sarachaga and Jato-Espino (2020),
lished papers. To investigate this, we calculated the increase who found out that vulnerability studies at national and re-
in flood vulnerability studies in relative terms, based on a gional scales are infrequent. The neighborhood scale was the
normalization according to the number of all flood publica- dominant scale in all continents (Fig. 3) as it is the smallest
tions in the WoS database. Results show that the increase in unit for which data are available for large areas, generally
research on flood vulnerability indices is significantly greater through census data. Only eight studies (8.4 %) were con-
than the increase in published flood articles (Appendix A; ducted at the basin level (i.e., group of cities), and a few ar-
Fig. A1). ticles (n = 2) conducted assessments across various scales.
https://doi.org/10.5194/nhess-21-1513-2021 Nat. Hazards Earth Syst. Sci., 21, 1513–1530, 20211518 L. L. Moreira et al.: Review article: A systematic review and future prospects of flood vulnerability indices
Figure 3. Classification of papers of flood vulnerability in terms of scale by continents.
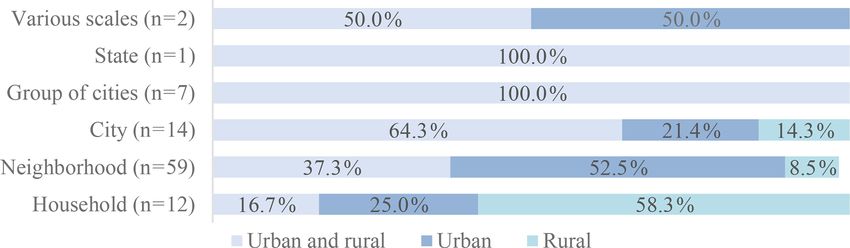
Figure 4. Classification of studies in terms of rural and urban areas and spatial scale.
For instance, Balica et al. (2009) evaluated the vulnerability come, unemployment rate, the elderly, and children. Never-
at the basin, subbasin, and city scales. Similarly, Remo et al. theless, widely used indicators found by the authors were not
(2016) compared three scales (i.e., census blocks, commu- identified or were rarely used in our sample. These include,
nities, and counties) and found out that the results generally for example, stress and mental health, hygiene and sanitation,
mirrored each other. None of the considered articles draw social networks, and experience with floods (Schneiderbauer
conclusions at the national or global level. and Ehrlich, 2006).
Around 40.0 % of the studies were applied to urban ar- The studies used a median of 16 indicators. Although
eas, 15.8 % to rural areas, and 44.2 % to both. The high 32.6 % (n = 31) of the studies used more than 20 indicators
prevalence of studies that consider both urban and rural ar- (e.g., Sam et al., 2017), most of them (58.0 %) did not apply
eas is related to the data availability, as the census tracks any method for reducing the number of variables. Among the
usually encompass the entire perimeter of a municipality. At studies which conducted reduction, the most used technique
the neighborhood scale, most studies considered only urban was the PCA, which was applied to 35.5 % (n = 11) of the in-
areas (53.4 %; Fig. 4). Conversely, studies at the household dices that used more than 20 indicators (e.g., Aroca-Jimenez
scale were developed mainly in rural areas (58.3 %). This can et al., 2017; Grosso et al., 2015; Török, 2018). In addition
be explained by a lower availability of detailed geospatial to PCA, some studies used other approaches, for example,
data in rural areas worldwide (Zhang and Zhu, 2018; Zielstra based on expert opinion (e.g., de Brito et al., 2018) or based
and Zipf, 2010). Therefore, in these cases, it is necessary to on indicators with a high Pearson correlation (e.g., Kotzee
collect data via household surveys. and Reyers, 2016).
4.3 Temporal dynamics
4.2 Indicators used to characterize flood vulnerability
In order to identify if the articles included the temporal
Table 4 shows the most frequent indicators grouped into so- dynamics of vulnerability, the indices were classified into
cial, economic, physical, and coping capacity dimensions. In pre-event (before), event (during) and post-event (after; Ko-
summary, social and economic indicators such as population biyama et al., 2006). Most of the studies focused on as-
density (37.9 %), illiteracy rate (32.6 %), unemployment rate sessing past vulnerability trends (88.4 %) and only 12.6 %
(29.5 %), female rate (28.4 %), per capita income (25.3 %), explored post-event flood vulnerability (e.g., Carlier et al.,
and elderly rate (22.1 %) were the most commonly used vul- 2018; Miguez and Veról, 2017). None focused on the vul-
nerability indicators (Table 4). This is similar to the results nerability during the event or elaborated on projections for
obtained by Rufat et al. (2015), who found out that the most future vulnerabilities.
used indicators are poverty and deprivation, per capita in-
Nat. Hazards Earth Syst. Sci., 21, 1513–1530, 2021 https://doi.org/10.5194/nhess-21-1513-2021L. L. Moreira et al.: Review article: A systematic review and future prospects of flood vulnerability indices 1519
Table 4. Most commonly used flood vulnerability indicators. Only ered (Abbas et al., 2018). For instance, Rogelis et al. (2016)
indicators used in at least five articles are shown here. This cut-off compared the results of the most vulnerable areas by ranking
point was defined for clarity purposes as more than 600 different the basins according to the observed impacts from highest to
indicators were mentioned in the 95 reviewed articles. lowest damage in terms of number of fatalities, injured peo-
ple, evacuated people, and number of affected houses.
Dimension Indicator No. of
articles
4.4 Indicator normalization, weighting, and
Social Population density 36 (37.9 %) aggregation
Illiteracy rate 31 (32.6 %)
Unemployment rate 28 (29.5 %)
Concerning the indicators normalization, the most used ap-
Female rate 27 (28.4 %)
Elderly rate 27 (28.4 %)
proach was min–max (30.5 %), followed by Z score (12.6 %)
Education level 23 (24.2 %) and distance from the group leader (12.6 %; Table 6a). A total
Male rate 11 (11.6 %) of five studies applied other methods. For example, Aroca-
Children rate 11 (11.6 %) Jimenez et al. (2017, 2018) expressed the indicators’ values
Inhabitants aged 0–15 11 (11.6 %) in percentage or per capita value, and de Brito et al. (2018)
Population growth 10 (10.5 %) used fuzzy functions to normalize the indicators. It is impor-
Total population 9 (9.5 %) tant to note that most papers did not specify the normalization
Persons with disabilities 7 (7.4 %)
method used (11.6 %), which limits the reproducibility of the
Family members 7 (7.4 %)
Single parents with young children 6 (6.3 %)
study results.
Household headed by females 6 (6.3 %) Among the weighing approach types, statistical methods
Cultural heritage 5 (5.3 %) were the most applied (30.5 %), especially the PCA method
Household member with illness 5 (5.3 %) (21.1 %). The high use of PCA can be attributed to the pio-
Children mortality 5 (5.3 %) neering work by Cutter et al. (2003), who recommended the
Economic Per capita income 24 (25.3 %) use of a factor analytic approach. Other less common statisti-
Gross domestic product (GDP) per 11 (11.6 %) cal methods include dividing the indicator values by the total
capita or maximum value (Okazawa et al., 2011), hot spot analy-
Population poor 10 (10.5 %) sis (Kubal et al., 2009), and the unequal weighting method
Rented houses 10 (10.5 %) (Kablan et al., 2017).
Household income 9 (9.5 %) Many authors recommend the use of participatory meth-
Dependency rates 9 (9.5 %) ods for weighing the indicators, such as the use of multi-
Own vehicle 8 (8.4 %)
criteria decision-making (MCDM) tools (Evers et al., 2018).
Percent of home ownership 5 (5.3 %)
It is assumed that, if practitioners and experts are involved
Physical Households without sanitation 19 (20.0 %) in creating an index that they find useful, it is more likely
Households without safe water 14 (14.7 %) that they will trust its results (Oulahen et al., 2015). Fur-
Building material 14 (14.7 %)
thermore, participation is believed to be a key component
Road network 12 (12.6 %)
Physical conditions of the building 11 (11.6 %)
in fostering effective disaster risk reduction (Fekete et al.,
Building location 9 (9.5 %) 2021). In the present study, the analytical hierarchy process
Population in flood area 9 (9.5 %) (AHP) was the most common MCDM technique, which cor-
Urban area 8 (8.4 %) roborates the results by de Brito and Evers (2016). These
Households without electricity 8 (8.4 %) authors attributed this preference to the fact that AHP is a
Number of floors 6 (6.3 %) straightforward and flexible method. This method was ap-
Building age 5 (5.3 %) plied separately in 10 papers and together with other meth-
Building type 5 (5.3 %)
ods in five papers, totaling 16.0 % of the reviewed articles.
Number of hospitals 5 (5.3 %)
Among the less common MCDM methods, Promethee (Pref-
Coping Early warning system 11 (11.6 %) erence Ranking Organization METHod for Enrichment of
capacity Past flood experience 7 (7.4 %) Evaluations; Daksiya et al., 2017) and the analytical network
Emergency committee 5 (5.3 %) process (de Brito et al., 2018) techniques are worth mention-
Flood insurance 5 (5.3 %)
ing.
A total of seven articles used other weighting methods, in-
cluding the entropy method (Lianxiao and Morimoto, 2019),
The indicators used are different according to the tempo- Delphi technique (Yang et al., 2018b), and expert scoring
ral scale considered. Post-event indices encompassed human, (Wu et al., 2015). Furthermore, about one-quarter (24.2 %)
economic, and material damages to quantify the flood vulner- of the papers attributed equal weighting, and 6.3 % did not
ability (Table 5). Variables such as mitigation, damages, and specify the weighting method used (Table 6b). Some authors
coping behavior after experiencing a flood were often consid- preferred not to weight indicators because they assumed that
https://doi.org/10.5194/nhess-21-1513-2021 Nat. Hazards Earth Syst. Sci., 21, 1513–1530, 20211520 L. L. Moreira et al.: Review article: A systematic review and future prospects of flood vulnerability indices
Table 5. Indicators used for flood vulnerability assessment through post-event approach.
Damage Type Indicator Reference(s)
Human Human deaths Chaliha et al. (2012); Baeck et al. (2014); Abbas et al. (2018)
Injured family members or human losses Abbas et al. (2018); Ahmad and Afzal (2019)
People suffering from poor health conditions due to floods Chaliha et al. (2012); Jamshed et al. (2019)
Population affected Chaliha et al. (2012)
Displacement Okazawa et al. (2011)
Domestic violence after a flood Abbas et al. (2018)
Left house due to flood Abbas et al. (2018)
Vulnerability to the dissemination of water-borne diseases Abbas et al. (2018); Miguez and Veról (2017)
Access to safe water after a flood Jamshed et al. (2019)
Access to sanitation after a flood Jamshed et al. (2019)
Degradation of water quality Jamshed et al. (2019)
Economic Affected villages Chaliha et al. (2012); Jamshed et al. (2019)
Crop loss value Chaliha et al. (2012)
Economic loss regarding animal husbandry Ahmad and Afzal (2019)
House damage value Chaliha et al. (2012)
Borrowed money Abbas et al. (2018)
Decrease in food expenditure Abbas et al. (2018)
Increase in medical cost Abbas et al. (2018)
Material Area affected by flood Chaliha et al. (2012); Carlier et al. (2018); Okazawa et al. (2011)
Building damage Chaliha et al. (2012); Carlier et al. (2018); Bertilsson et al. (2019); Jamshed et al. (2019)
Damages to public utilities Chaliha et al. (2012)
Number of killed livestock Chaliha et al. (2012)
Crop damage Abbas et al. (2018); Jamshed et al. (2019)
Damage to house, livestock, and assets Abbas et al. (2018); Jamshed et al. (2019)
Schools damaged by flood Jamshed et al. (2019)
these indicators are equally important for the vulnerability 4.5 Uncertainty, sensitivity, and validation
calculation (Yoon, 2012), whereas others pointed out that
there is insufficient evidence to attribute importance to one Each step in the construction of flood vulnerability indices
factor over another (Fekete, 2011). carries uncertainty (Saisana et al., 2005), which is added
In terms of aggregation, the majority of the articles to the ones associated with the randomness of flood events
(80.0 %) used linear aggregation, followed by geometric ag- (Merz et al., 2008). Therefore, to ensure a better index
gregation (10.5 %) and mixed methods (4.2 %). The linear quality and verify the results’ robustness, uncertainty anal-
method is useful when all indicators have the same unit or ysis should be conducted. Despite its importance, only three
after they have been normalized. The geometric aggregation (3.2 %) of the reviewed papers performed uncertainty anal-
is preferred when the interest is assessing the degree of non- ysis. Nazeer and Bork (2019) observed variations in the fi-
compensation between the indicators. In linear aggregation, nal results that changed input variables, and Feizizadeh and
compensation is constant, while in geometric aggregation the Kienberger (2017) and Guo et al. (2014) applied a Monte
compensation is lower for indices with low values (Nardo Carlo simulation and set pair analysis, respectively.
et al., 2008). Nevertheless, the geometric method has a limi- With respect to the sensitivity analysis (SA), only nine pa-
tation when indicators with very low scores are compensated pers (9.5 %) performed it. Most articles applied local SA
by indicators with high scores (Gan et al., 2017). by comparing the results obtained by changing input meth-
It is important to mention other aggregation methods used ods, such as choosing different weights (Müller et al., 2011;
(5.3 %). For instance, Abebe et al. (2018) used the Bayesian Nazeer and Bork, 2019; Rogelis et al., 2016), aggregation
belief network, which is formed by a graphical network methods (Fernandez et al., 2016; Nazeer and Bork, 2019),
representing the cause–effect relationships between the dif- or indicators (Rogelis et al., 2016; Zhang and You, 2014). In
ferent indicators (Pearl, 1988). Yang et al. (2018b, a) ap- addition, Abebe et al. (2018) quantified sensitivity through
plied the Shannon entropy method. More recently, Amadio variance reduction and mutual information. Spatial SA was
et al. (2019) used a non-compensatory aggregation method conducted by de Brito et al. (2019) by computing the vul-
to compensate for the low performance of one indicator nerability class switches when the indicator weights were
with some higher performance of another indicator. Finally, changed. Only Feizizadeh and Kienberger (2017) performed
Chiu et al. (2014) used the fuzzy comprehensive evaluation the global sensitivity analysis.
method to aggregate the indicators. Although the number of flood vulnerability studies has
increased, few studies attempted to validate the obtained
outcomes (Fekete, 2009). Of the reviewed articles, only
11 (11.6 %) validated the results, mostly using maps with
Nat. Hazards Earth Syst. Sci., 21, 1513–1530, 2021 https://doi.org/10.5194/nhess-21-1513-2021L. L. Moreira et al.: Review article: A systematic review and future prospects of flood vulnerability indices 1521
Table 6. Normalization and weighting methods. et al., 2010). Conversely, studies at the household level were
rare in our sample (n = 12). Yet, aspects related to the citi-
(a) Normalization method N % zens’ coping capacities can only be captured at this spatial
Min–max 29 30.5
scale.
Z score 12 12.6 An additional issue is the problem of down- or upscaling
Distance from the group leader 12 12.6 that implies different levels of generalization. Hence, multi-
Unspecified 11 11.6 level and cross-scale studies are needed. They allow for a bet-
None (all indicators had the same unit) 11 11.6 ter understanding of scale implications, including their ben-
Ranking 7 7.4 efits and drawbacks. A better understanding of urban–rural
Categorical scale 3 3.2 linkages is also required, instead of studying them in iso-
Binary standard 3 3.2 lation. To this end, the framework proposed by Jamshed et
Division by total 2 2.1 al. (2020) could be used. This framework considers, either
Others 5 5.3 qualitatively or quantitatively, how rural–urban linkages can
Total 95 100 influence the occurrence of floods and how these shape the
vulnerability of rural households. It considers rural areas not
(b) Type Weighting method N %
as secluded units but rather as being interlinked with cities.
Statistically PCA – weighting by factor scores 17 17.9 A further gap is that indicators related to the populations’
based methods PCA – equal weighting 3 3.2 coping and adaptive capacity were rarely used. The focus
Entropy method 1 1.1 was given to social indicators that increase people’s vulner-
Other statistical methods 8 8.5
ability. Similar to the scale choice, the preference for these
Participatory or Analytical hierarchy process 10 10.5 indicators is driven due to data availability, as social indica-
expert-based Public opinion 6 6.3 tors (e.g., age and gender) are easily accessible. Neverthe-
methods Expert opinion 2 2.1
less, the capacity of people to anticipate, cope with, resist,
Other MCDM techniques 3 4.2
and recover from disasters is equally important for under-
Others Equal weighting 23 24.2 standing the risk. In fact, even poor and vulnerable people
Other methods 7 7.4 have the capacity to cope (Wisner et al., 2012). Therefore,
Defined by the authors 8 8.4
when dealing with flood vulnerability, other relevant indica-
Unspecified 6 6.3
tors, such as risk perception (Carlier et al., 2018) and past
Total 95 100 flood experience (Beringer and Kaewsuk, 2018), are impor-
tant. However, data on these are often not readily available,
thus requiring local research, which demands time, financial
flooded areas (n = 7), flood damage (n = 3), and expert opin- resources, and a multidisciplinary team. Indeed, information
ion (n = 1). on citizens’ adaptive behavior and perception requires lon-
gitudinal or quasi-experimental studies that allow the cap-
turing of behavioral dynamics over time (Kuhlicke et al.,
5 Persisting gaps and future research 2020). For instance, recent advancements have been made by
applying geostatistical methods to psychosocial survey data
Despite the increasing amount of research on flood vulner- (Guardiola-Albert et al., 2020). As an alternative, people’s
ability indices since 2015, a series of persistent knowledge risk perception could be derived from widely available data
gaps of methodological nature were found in our systematic sources, including, for instance, Google trends (e.g., Kam
review (Table 7). Here, we summarize these gaps and pro- et al. 2019) and Twitter statistics (Dyer and Kolic, 2020).
vide a research agenda with needs that should be addressed Nevertheless, it should be noted that such approaches can be
in the future. considered only where the use of social media and search en-
The first challenge refers to the spatial scale, as vulnerabil- gines are prevalent across the society. In countries where the
ity is not only site specific but also scale dependent (Ciurean use of digital technologies is not widespread, there is the risk
et al., 2013). The choice of the spatial scale in the reviewed that the marginalized population is left out of the analysis.
articles was mostly driven by data availability, and hence, Still with regard to the indicators used, many studies used
most of them were applied at the neighborhood level using variables that thematically overlap with each other. In this
census tracks. Despite the availability of census data at the context, some indices used more than 20 indicators to mea-
country level, there were no studies at the national level, and sure flood vulnerability and did not apply any technique (e.g.,
only eight papers (8.4 %) constructed vulnerability indices PCA or expert based) to reduce this number. This can de-
using data at the basin scale. Nevertheless, these scales are crease the explanatory power of the index. In this context,
often used for flood risk management and are necessary to besides PCA, the potential exists to apply dimensionality re-
enable the comparability of regions and to define hot spot ar- duction techniques such as the t-distributed stochastic neigh-
eas where intervention is needed (Balica et al., 2009; Fekete bor embedding (t-SNE; Anowar et al., 2021). A further is-
https://doi.org/10.5194/nhess-21-1513-2021 Nat. Hazards Earth Syst. Sci., 21, 1513–1530, 20211522 L. L. Moreira et al.: Review article: A systematic review and future prospects of flood vulnerability indices
Table 7. Summary of the identified knowledge gaps and need for building flood vulnerability indicators.
Topic Gaps Research needs
Scale – The choice of the spatial scale is mostly driven – More attention should be devoted to multilevel
by data availability and cross-scale studies
– There are few assessments at the national and – The understanding of how rural–urban linkages
local levels can influence the vulnerability requires further
attention
Selection of indicators – The choice of the indicators is mostly driven by – Risk perception indicators should be considered
data availability – Longitudinal or quasi-experimental studies that
– Often no justification is provided for the selec- capture behavioral dynamics over time are
tion of indicators needed
– Coping and adaptive capacity indicators were – Potential exists to derive data on risk perception
rarely used from widely available data sources (e.g,. social
– Assessments often use the same set of indica- media, newspapers, search engines)
tors for different scales and contexts, disregard- – The selection of indicators should be scale and
ing inherent discrepancies context specific
– Theoretically grounded research is needed to
generate robust evidence for selecting the input
indicators
Indicators reduction – Several studies used variables that thematically – Dimensionality reduction techniques could be
overlap with each other applied in future studies (e.g., t-SNE and PCA)
– Indicator reduction techniques were hardly used
Dynamics – The vulnerability indices reviewed were static – Studies that assess post-flood and future vulner-
and represent a snapshot of vulnerability in time ability scenarios are needed
and space – Research on the inter-indicator relations is
– Assessments focus on current vulnerability con- needed to understand how one indicator affects
ditions another
Normalization, aggrega- – Several articles did not indicate why a specific – Future studies need to be more rigorous and
tion, and weighting normalization, aggregation, and weighting tech- present the reasoning behind such choices
nique was chosen – Different alternatives for indicator weighting
– There was an overreliance on the use of the (e.g., expert-based, MCDM, and statistical ap-
AHP weighting method proaches) can be compared
– Studies comparing different normalization and
weighting techniques were rare
Sensitivity, uncertainty, and – Few vulnerability indices conducted any sort of – Technical and user validation should become
validation validation, sensitivity, and uncertainty analysis more widespread; potential exists to apply
global sensitivity analysis and spatial sensitiv-
ity analysis
– Analysis of the sensitivity of different modeling
steps in the outcomes is needed (i.e., how differ-
ent aggregation methods affect the outcomes)
Nat. Hazards Earth Syst. Sci., 21, 1513–1530, 2021 https://doi.org/10.5194/nhess-21-1513-2021L. L. Moreira et al.: Review article: A systematic review and future prospects of flood vulnerability indices 1523 sue is that the reason for variable selection was often not ysis. Fewer than 14 % of the studies validated the obtained re- given, or it was justified based on previous studies, without sults. To this end, impact data were often used (e.g., Rezende taking into consideration the study area specificities or con- et al., 2019). Only 9.5 % conducted sensitivity or uncertainty ceptual frameworks. Due to the difficulty and time involved analysis. This can lead to vulnerability outputs that are in- in developing indicators, low-quality databases are normally coherent with the local reality by either over- or underes- used (Freudenberg, 2003). For adequate indicator selection, timating the vulnerability. This, in turn, has direct implica- the analytical soundness, measurability, relevance to the phe- tions for flood risk management. In this regard, Fekete (2009) nomenon being measured, and the relationships to each other points out the difficulty in finding empirical evidence about (e.g., interrelationships and feedback loops) should be taken vulnerability because vulnerability is multidimensional and into account. Furthermore, more theoretically grounded re- not directly observable. Thus, further research is needed on search is needed to generate robust evidence for selecting the the validation of vulnerability outcomes (including technical input indicators. and user validation) and analysis of the sensitivity of the con- All of the vulnerability indices reviewed here are static tribution of individual indicators to the obtained results. The and represent a snapshot of vulnerability. Hence, they do not potential exists to apply a global sensitivity analysis, which is capture the complexities and temporal dynamics of vulnera- already widely applied for building composite indicators for bility. Few studies focused on measuring flood vulnerability other fields of study (Luan et al., 2017; Saisana and Saltelli, post-event. Nevertheless, the drivers of vulnerability can vary 2008). considerably over time. Results by Kuhlicke et al. (2011) Besides the aforementioned methodological gaps, it is im- and Reiter et al. (2018) show that the exposed citizens (e.g., portant to emphasize that the theoretical framework adopted the elderly and children) may be less vulnerable during the influences the methodological choices that are made when preparatory phase of a flood but highly vulnerable during the constructing vulnerability indices. Even though we have not recovery phase. Hence, incorporating the phase of the flood analyzed the theoretical constructs used by each study, when disaster is key for improving the validity of vulnerability in- reading the articles it became clear that several of them do dices (Rufat et al., 2015). To account for temporal context, not specify how they conceptualize vulnerability. Further- the indicators can be differentiated according to the differ- more, there are ambiguities in how vulnerability is under- ent phases of a disaster, i.e., preparedness, response, and re- stood (Kelman, 2018). For instance, some authors consider covery phases. Such a phase-oriented approach could inform coping and adaptive capacity as components of flood vulner- variable selection and weighting. In addition to this, there is ability (e.g., de Brito et al., 2018; Feizizadeh and Kienberger, a need for research looking into future vulnerabilities, and 2017). Others include flood hazard characteristics or expo- a forward-looking perspective is needed for preventive flood sure (e.g., Carlier et al., 2018; Chaliha et al., 2012) as part of risk reduction (Birkmann et al., 2013; Garschagen and Kraas, vulnerability. Hence, we argue that a stronger theoretical un- 2010). These could make use of, for instance, population derpinning of research is needed for producing scientifically growth projections or employ tools such as qualitative futur- rigorous and comparable research. Within this context, future ing techniques (Hoffman et al., 2021). Nevertheless, it is im- work could investigate how different terminologies and the- portant to notice that this can further increase the uncertainty oretical constructs are defined and applied across different of the vulnerability modeling outcomes. Still, exercises like flood vulnerability case studies. Future reviews could also this can provide a glimpse of plausible futures. look into the methodology used to collect information on Similar to the selection of the indicators, several articles vulnerability indicators (e.g., surveys and public databases) did not indicate why a specific normalization and weight- as this influences the choices that can be made at each stage ing technique was chosen. Additionally, some did not explic- of the index construction. itly specify any normalization (11.6 %) or weighting (6.3 %) method. Nevertheless, the use of arbitrary techniques with- out testing different methods and their assumptions increases 6 Conclusions the subjective judgment error. Hence, it is imperative for fu- ture studies to be more rigorous and present the reasoning be- The present study reviewed 95 articles from 38 countries hind such choices. Furthermore, there was an overreliance on that constructed flood vulnerability indices. In summary, de- the use of the AHP weighting method, and studies compar- spite the increasing number of studies and advances made, ing different normalization and weighting techniques were the review has revealed and reconfirmed a number of per- rare (7.4 %). Future research should tackle this by exploring sistent knowledge gaps. Temporal dynamic aspects of vul- different alternatives for evaluating indicator weights (e.g., nerability were often disregarded. Only 11.6 % of the studies expert-based, MCDM, or statistical approaches) and com- focused on indicators that address post-event conditions re- pare the findings by means of validation and sensitivity anal- lated to flood damage and consequences, and none of them yses. investigated future vulnerabilities. Coping and adaptive ca- A final persisting gap is that few vulnerability indices con- pacity indicators were frequently ignored, as obtaining these ducted any sort of validation, sensitivity, or uncertainty anal- data demands time and effort. Most did not apply sensitiv- https://doi.org/10.5194/nhess-21-1513-2021 Nat. Hazards Earth Syst. Sci., 21, 1513–1530, 2021
1524         L. L. Moreira et al.: Review article: A systematic review and future prospects of flood vulnerability indices

ity (90.5 %) and uncertainty analyses (96.8 %) nor did they
perform results validation (86.3 %). This demonstrates a lim-
itation in the reliability of these indices. It is clear from the
literature that the challenge for further research is to foster
the development of dynamic vulnerability assessments that
consider the coping capacity of citizens and take the uncer-
tainty involved in all steps of the index building process into
account, including the selection of indicators, normalization,
weighting, and aggregation. This is required in order to ad-
vance our understanding of flood vulnerability and support
pathways towards flood risk reduction.

Nat. Hazards Earth Syst. Sci., 21, 1513–1530, 2021                            https://doi.org/10.5194/nhess-21-1513-2021
L. L. Moreira et al.: Review article: A systematic review and future prospects of flood vulnerability indices     1525

Appendix A

Figure A1. Normalized number of flood vulnerability indices and
flood articles according to the Web of Science database. For the
flood articles search, the keyword “flood*” was used.

https://doi.org/10.5194/nhess-21-1513-2021                           Nat. Hazards Earth Syst. Sci., 21, 1513–1530, 2021
1526          L. L. Moreira et al.: Review article: A systematic review and future prospects of flood vulnerability indices

Data availability. The underlying research data are available in the     rithms (PCA, KPCA, LDA, MDS, SVD, LLE, ISOMAP,
Supplement.                                                              LE, ICA, t-SNE), Comput. Sci. Rev., 40, 100378,
                                                                         https://doi.org/10.1016/j.cosrev.2021.100378, 2021.
                                                                       Aroca-Jimenez, E., Bodoque, J. M., Garcia, J. A., and Diez-
Supplement. The supplement related to this article is available on-      Herrero, A.: Construction of an integrated social vulnerabil-
line at: https://doi.org/10.5194/nhess-21-1513-2021-supplement.          ity index in urban areas prone to flash flooding, Nat. Hazards
                                                                         Earth Syst. Sci., 17, 1541–1557, https://doi.org/10.5194/nhess-
                                                                         17-1541-2017, 2017.
Author contributions. LLM contributed to the conceptualization,        Aroca-Jiménez, E., Bodoque, J. M., García, J. A., and Díez-
data curation, investigation, methodology and writing (original          Herrero, A.: A quantitative methodology for the assessment of
draft preparation and review and editing). MMB contributed to the        the regional economic vulnerability to flash floods, J. Hydrol.,
methodology, supervision, validation and writing (review and edit-       565, 386–399, https://doi.org/10.1016/j.jhydrol.2018.08.029,
ing). MK contributed to project administration, methodology, su-         2018.
pervision and writing (review and editing).                            Aroca-Jiménez, E., Bodoque, J. M., and García, J. A.: How to
                                                                         construct and validate an Integrated Socio-Economic Vulner-
                                                                         ability Index: Implementation at regional scale in urban ar-
                                                                         eas prone to flash flooding, Sci. Total Environ., 746, 140905,
Competing interests. The authors declare that they have no conflict
                                                                         https://doi.org/10.1016/j.scitotenv.2020.140905, 2020.
of interest.
                                                                       Baeck, S. H., Choi, S. J., Choi, G. W., and Lee, D. R.: A study of
                                                                         evaluating and forecasting watersheds using the flood vulnerabil-
                                                                         ity assessment index in Korea, Geomatics, Nat. Hazards Risk, 5,
Acknowledgements. The authors thank CNPq for the research                208–231, https://doi.org/10.1080/19475705.2013.803268, 2014.
scholarship.                                                           Balica, S. F., Douben, N., and Wright, N. G.: Flood vulnerability
                                                                         indices at varying spatial scales, Water Sci. Technol., 60, 2571–
                                                                         2580, https://doi.org/10.2166/wst.2009.183, 2009.
Financial support. This research has been supported by the             Balica, S. F., Popescu, I., Beevers, L., and Wright, N. G.: Paramet-
Conselho Nacional de Desenvolvimento Científico e Tecnológico            ric and physically based modelling techniques for flood risk and
(grant no. 141387/2019-0).                                               vulnerability assessment: A comparison, Environ. Model. Softw.,
                                                                         41, 84–92, https://doi.org/10.1016/j.envsoft.2012.11.002, 2013.
The article processing charges for this open-access                    Beringer, A. L. and Kaewsuk, J.: Emerging livelihood vulnerabili-
publication were covered by the Helmholtz Centre for                     ties in an urbanizing and climate uncertain environment for the
Environmental Research – UFZ.                                            case of a secondary city in Thailand, Sustainability, 10, 1452,
                                                                         https://doi.org/10.3390/su10051452, 2018.
                                                                       Bertilsson, L., Wiklund, K., de Moura Tebaldi, I., Rezende, O. M.,
Review statement. This paper was edited by Sven Fuchs and re-            Veról, A. P., and Miguez, M. G.: Urban flood re-
viewed by three anonymous referees.                                      silience – A multi-criteria index to integrate flood re-
                                                                         silience into urban planning, J. Hydrol., 573, 970–982,
                                                                         https://doi.org/10.1016/j.jhydrol.2018.06.052, 2019.
                                                                       Birkmann, J.: Indicators and criteria for measuring vulnerability:
References                                                               Theoretical bases and requirements, in: Measuring Vulnerability
                                                                         to Natural Hazards: Towards Disaster Resilient Societies, vol. 02,
Abbas, A., Amjath-Babu, T. S., Kächele, H., Usman, M.,                   United Nations University Press, Tokyo, New York, Paris, 55–77,
  Amjed Iqbal, M., Arshad, M., Adnan Shahid, M., and                     2006.
  Müller, K.: Sustainable survival under climatic extremes: link-      Birkmann, J., Cardona, O. D., Carreño, M. L., Barbat, A. H.,
  ing flood risk mitigation and coping with flood damages in             Pelling, M., Schneiderbauer, S., Kienberger, S., Keiler, M.,
  rural Pakistan, Environ. Sci. Pollut. R., 25, 32491–32505,             Alexander, D., Zeil, P., and Welle, T.: Framing vulnerability, risk
  https://doi.org/10.1007/s11356-018-3203-8, 2018.                       and societal responses: the MOVE framework, Nat. Hazards, 67,
Abebe, Y., Kabir, G., and Tesfamariam, S.: Assessing urban ar-           193–211, https://doi.org/10.1007/s11069-013-0558-5, 2013.
  eas vulnerability to pluvial flooding using GIS applications and     Bründl, M., Romang, H. E., Bischof, N., and Rheinberger, C. M.:
  Bayesian Belief Network model, J. Clean. Prod., 174, 1629–             The risk concept and its application in natural hazard risk man-
  1641, https://doi.org/10.1016/j.jclepro.2017.11.066, 2018.             agement in Switzerland, Nat. Hazards Earth Syst. Sci., 9, 801–
Ahmad, D. and Afzal, M.: Household vulnerability and resilience          813, https://doi.org/10.5194/nhess-9-801-2009, 2009.
  in flood hazards from disaster-prone areas of Punjab, Pakistan,      Cardona, O.-D., Aalst, M. K. van, Birkmann, J., Fordham, M., Mc-
  Nat. Hazards, 99, 337–354, https://doi.org/10.1007/s11069-019-         Gregor, G., Perez, R., Pulwarty, R. S., Schipper, E. L. F., and
  03743-9, 2019.                                                         Sinh, B. T.: Determinants of risk: Exposure and vulnerability,
Amadio, M., Mysiak, J., and Marzi, S.: Mapping Socioeconomic             in: Managing the Risks of Extreme Events and Disasters to Ad-
  Exposure for Flood Risk Assessment in Italy, Risk Anal., 39,           vance Climate Change Adaptation, vol. 34, Cambridge Univer-
  829–845, https://doi.org/10.1111/risa.13212, 2019.                     sity Press, Cambridge, UK, and New York, NY, USA, 65–108,
Anowar, F., Sadaoui, S., and Selim, B.: Conceptual and                   2012.
  empirical comparison of dimensionality reduction algo-

Nat. Hazards Earth Syst. Sci., 21, 1513–1530, 2021                                      https://doi.org/10.5194/nhess-21-1513-2021
You can also read