Germany's vulnerability to Climate Change - 24/2015 Summary
←
→
Page content transcription
If your browser does not render page correctly, please read the page content below
CLIMATE CHANGE

 24/2015

Germany’s vulnerability to
Climate Change
Summary


CLIMATE CHANGE 24/2015

Project No. (FKZ) 24309
Report No. (UBA-FB) 002226

Germany’s vulnerability to Climate Change
Summary

by

Mareike Buth, Walter Kahlenborn, Jonas Savelsberg, Nina Becker, Dr. Philip
Bubeck, Sibylle Kabisch, Christian Kind, Annkathrin Tempel, Franziska Tucci
adelphi, Berlin, Germany
Prof. Stefan Greiving, Dr. Mark Fleischhauer, Dr. Christian Lindner, Dr. Johannes
Lückenkötter, Marcel Schonlau, Hanna Schmitt, Florian Hurth, Felix Othmer,
René Augustin, Dennis Becker, Marlena Abel, Tjark Bornemann, Helene Steiner
plan + risk consult, Dortmund, Germany
Dr. Marc Zebisch, Dr. Stefan Schneiderbauer, Christian Kofler
Europäische Akademie, Bozen, Italy

On behalf of the Federal Environment Agency (Germany)
Imprint

Publisher:
Umweltbundesamt
Wörlitzer Platz 1
06844 Dessau-Roßlau
Tel: +49 340-2103-0
Fax: +49 340-2103-2285
info@umweltbundesamt.de
Internet: www.umweltbundesamt.de

  /umweltbundesamt.de
  /umweltbundesamt

Study performed by:
adelphi
Caspar-Theyß-Str. 14A
14193 Berlin, Germany

Study completed in:
October 2015

Edited by:
Fachgebiet I 1.6 KomPass – Klimafolgen und Anpassung in Deutschland
Inke Schauser

Publication as pdf:
http://www.umweltbundesamt.de/publikationen/vulnerabilitaet-deutschlands-
gegenueber-dem

ISSN 1862-4359

Dessau-Roßlau, November 2015

The Project underlying this report was supported with funding from the Federal
Ministry for the Environment, Nature Conservation, Building and Nuclear safety
under project number 24309. The responsibility for the content of this
publication lies with the author(s).
Germany‘s vulnerability to climate change – Summary

Contents
1     Introduction ...........................................................................................................................5
2     Concept and methodology.....................................................................................................6
3     Germany’s climate and climate change .................................................................................9
4     Socio-economic developments ............................................................................................17
5     Generic adaptive capacity and adaptive capacity of spatial planning ...................................20
6     Analysis of existing vulnerability studies ..............................................................................22
7     Climate impacts and vulnerability in the action fields ...........................................................24
      7.1          Action field “Soil” ...................................................................................................24
      7.2          Action field “Biodiversity” .......................................................................................25
      7.3          Action field “Agriculture” ........................................................................................27
      7.4          Action field “Forestry” ............................................................................................28
      7.5          Action field “Fisheries” ...........................................................................................29
      7.6          Action field “Coastal and marine protection” ..........................................................31
      7.7          Action field “Water balance, water management” ..................................................32
      7.8          Action field “Transport, transport infrastructure”.....................................................35
      7.9          Action field “Building industry” ...............................................................................36
      7.10         Action field “Industry and commerce” ....................................................................38
      7.11         Action field “Energy industry”.................................................................................40
      7.12         Action field “Tourism industry” ...............................................................................42
      7.13         Action field “Financial industry”..............................................................................43
      7.14         Action field “Human health” ...................................................................................44
      7.15         Cross-sectoral areas "Civil and disaster protection" and "Spatial planning,
                   regional and urban development ...........................................................................45
8     Integrated approach ............................................................................................................46
      8.1          Comparison of the action fields’ key conclusions...................................................46
      8.2          Linking the action fields .........................................................................................47
      8.3          Implications for climate area types ........................................................................49
      8.4          Overall evaluation .................................................................................................52
9     Conclusions and need for further research ..........................................................................54
      9.1          Need for research .................................................................................................54
      9.2          Methodological recommendations .........................................................................55
10    Sources ...............................................................................................................................56

                                                                                                                                              2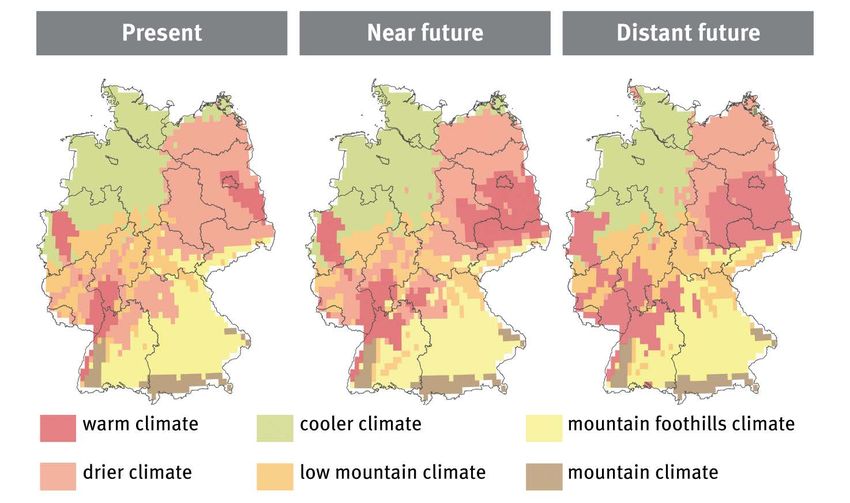
Germany‘s vulnerability to climate change – Summary
Figure 1: Vulnerability concept of the Vulnerability Network ................................................ 6
Figure 2: Long-standing average air temperature and changes of the
climate signal between the projection periods and the present .......................... 10
Figure 3: Long-standing average precipitation in the meteorological
summer months (June, July, August; above) and winter months
(December, January, February; below) and changes in the
climate signal between the projection periods and the present .......................... 11
Figure 4: Long-standing average number of hot days (Tmax ≥ 30 degrees
Celsius) and changes in the climate signal between the
projection periods and the present ..................................................................... 12
Figure 5: Average number of days with heavy precipitation (precipitation
≥ 20 millimetres) and changes in the climate signal between the
projection periods and the present ..................................................................... 13
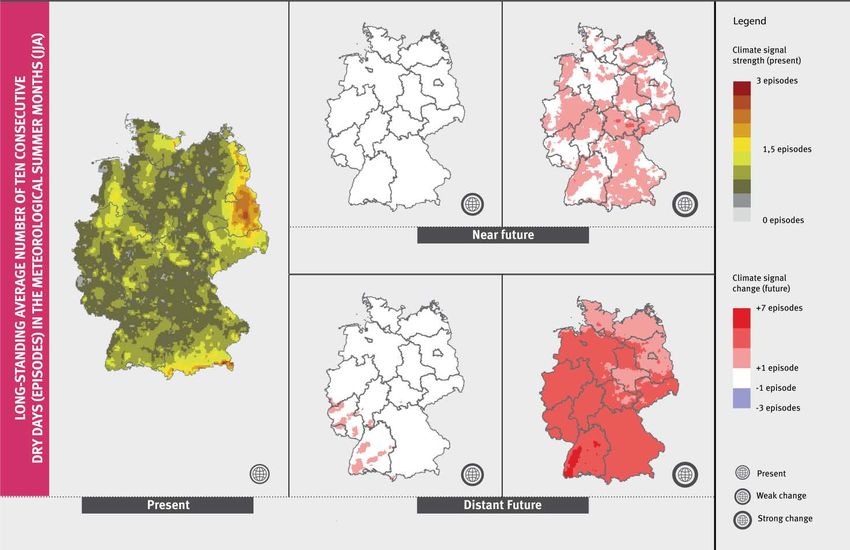
Figure 6: Long-standing average number of ten consecutive dry days
(episodes) in the meteorological summer months (June, July,
August) and changes in the climate signal between the
projection periods and the present ..................................................................... 14
Figure 7: Long-standing average potential flooding area in counties and
changes in the climate signal between the projection periods
and the present.................................................................................................. 15
Figure 8: Potential flooding areas by storm surges in counties and
changes in the climate signal between the projection periods
and the present.................................................................................................. 16
Figure 9: "Growth" and "stagnation" scenarios for the relative change in
the number of inhabitants (2010 to 2030) .......................................................... 18
Figure 10: Change in the housing and transport area between 2010 and
2030 expressed as a percentage (community level) for the
growth scenario and the stagnation scenario ..................................................... 19
Figure 11: Exploiting the adaptive capacity of regional planning ......................................... 22
Figure 12: Interrelationships between action fields ............................................................. 48
Figure 13: Climate area types in Germany for the identification of "similarly
affected areas" .................................................................................................. 50
Figure 14: Regional impacts and consequences across all action fields of
climate change in Germany (near future) ........................................................... 53
3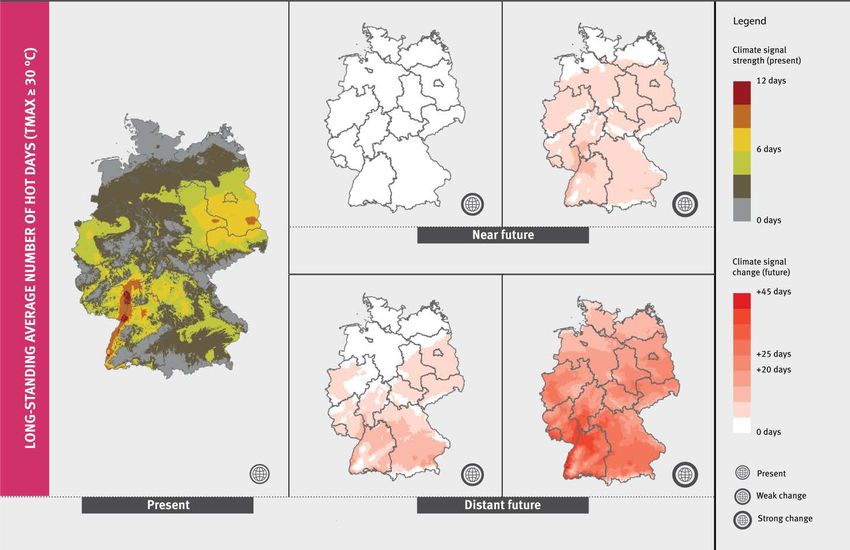
Germany‘s vulnerability to climate change – Summary

Table 1:             Parameters and statistical values of socio-economic
                     development for land-use scenarios (2009 to 2030) .......................................... 17
Table 2:             Climate impacts in the action field ”Soil“ ............................................................ 25
Table 3:             Climate impacts in the action field “Biodiversity“ ................................................ 26
Table 4:             Climate impacts in the action field “Agriculture“ ................................................. 27
Table 5:             Climate impacts in action field "Forestry" ........................................................... 29
Table 6:             Climate impacts in action field "Fisheries" .......................................................... 30
Table 7:             Climate impacts in action field "Coastal and marine protection" ......................... 32
Table 8:             Climate impacts in action field "Water management, water
                     balance" ............................................................................................................ 34
Table 9:             Climate impacts in action field "Transport, transport
                     infrastructure" .................................................................................................... 36
Table 10:            Climate impacts in action field "Building industry" .............................................. 37
Table 11:            Climate impacts in the action field ”Industry and commerce“ ............................. 39
Table 12:            Climate impacts in the action field “Energy industry“ .......................................... 41
Table 13:            Climate impacts in the action field “Tourism industry“ ........................................ 42
Table 14:            Climate impacts in the action field “Financial industry“ ....................................... 43
Table 15:            Climate impacts in the action field “Human health“ ............................................ 45

                                                                                                                                           4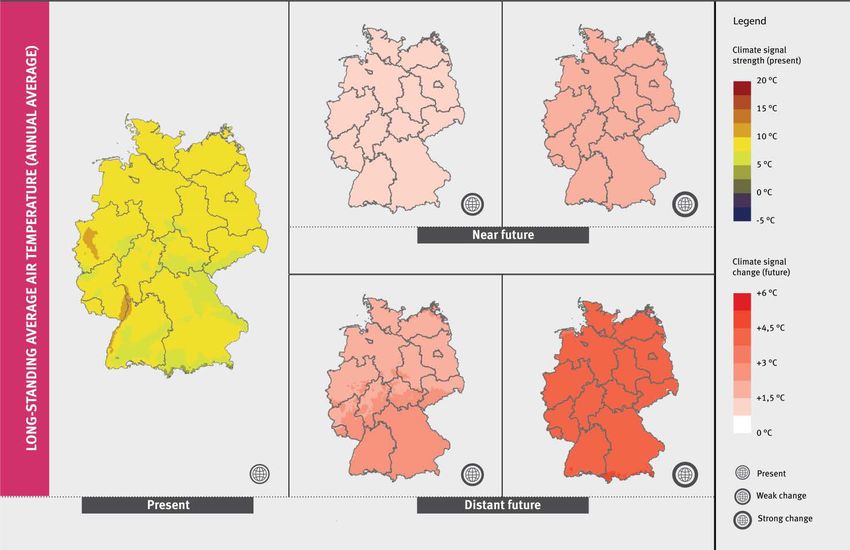
Germany‘s vulnerability to climate change – Summary

1      Introduction
The planning and implementation of adaptation measures have steadily gained importance over the
course of recent years. This is due to progressive climate change whose consequences for Germany
have also become increasingly clear. Vulnerability assessments are key to adaptation planning in
order to identify adaptation needs and develop a strategy or an action plan with specific actions for
adapting to climate change. They can answer the question as to which a country or region is
particularly vulnerable to climate change – both spatially and thematically.
In 2008, the German Federal Cabinet adopted the German Strategy for Adaptation to Climate Change
(DAS) to mitigate Germany’s vulnerability to climate change consequences. The aim is to maintain or
enhance natural, economic and social systems skills to adapt to climate change and its
consequences. The 2011 Adaptation Action Plan (APA) specified that "Germany needs an up-to-date
cross-sectoral vulnerability assessment prepared in line with uniform standards". In response, a
cross-sectoral and consistent vulnerability assessment for Germany was prepared from 2011
to 2015 which served as a basis for the progress report of the German Adaptation Strategy and
the further development of the German adaptation policy.
An analysis of Germany’s vulnerability to climate change is an interdisciplinary scientific task and
requires the cooperation of different disciplines and authorities as well as the integration of regional
and action field-specific expertise. The Federal Ministry for the Environment, Nature Conservation,
Building and Nuclear Safety and the German Environment Agency therefore undertook the task in
2011 to establish the "Vulnerability Network".
This network comprised sixteen Federal authorities and institutes from nine ministries and
was supported by a Consortium commissioned by the German Environment Agency within a
project sponsored by the Federal Ministry for the Environment. The consortium was composed
of adelphi, plan + risk consult, the European Academy of Bozen and IKU – the dialogue initiator. The
willingness of the participating authorities to engage in interdisciplinary cooperation and provide
their sectoral expertise were key to the network’s success. The Network partners are the Federal
Office for Civil Protection and Disaster Assistance, the German Federal Agency for Nature
Conservation, the Federal Maritime and Hydrographic Agency, the Federal Office for Economic
Affairs and Export Control, the Federal Institute for Geosciences and Natural Resources, the German
Federal Institute of Hydrology, the Federal Highway Research Institute, the Federal Agency for
Technical Relief, the Federal Institute for Research on Building, Urban Affairs and Spatial
Development, the German Society for International Cooperation, the German Meteorological Services,
the Johann Heinrich von Thünen Institute (Federal Research Institute for Rural Areas, the Forestry
and Fisheries), KfW (Reconstruction Credit Institute), the DLR Project Management Agency, the
Robert Koch Institute, and the German Environment Agency.
The aim of the network was to consolidate current scientific knowledge on vulnerability assessment
and information from the specialist authorities about the consequences of climate change in
Germany to enable an interdisciplinary assessment of Germany's vulnerability. Using the
vulnerability assessment, an interdisciplinary screening procedure identified those regions
and systems across Germany that are particularly endangered by climate change.
Alongside substantive findings, the Vulnerability Network’s added value is that it initiated the
networking of those Federal authorities and institutions involved. It encouraged the trans-
disciplinary thematic work in terms of vulnerability assessment and provided links for inter-agency
cooperation to the authorities via the network, for example, for the integration of data and models.
The network has already initiated new projects and further developments for individual network
partners. Thus the Vulnerability Network is a key element of the climate change adaptation process
in Germany.
                                                                                                           5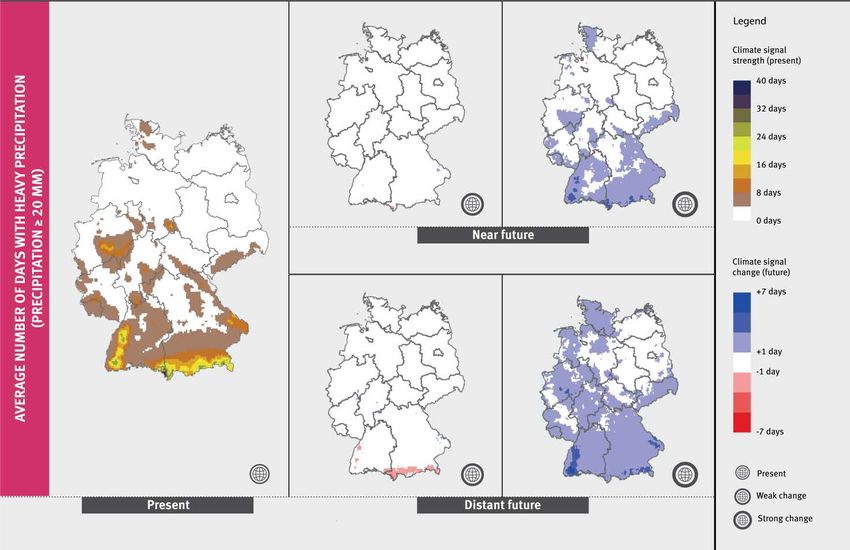
Germany‘s vulnerability to climate change – Summary

2      Concept and methodology
The Vulnerability Network amalgamates the specialist and methodological expertise of several
Federal agencies and disciplines. Thus it was of key importance for assessing Germany’s
vulnerability to climate change to create a common working document comprising a generally
accepted specialist terminology and a common understanding of "vulnerability" and the components
of the concept. Collaboration between network partners and the Consortium followed a pattern of
"co-production of knowledge" which was an important factor of success for the integrated
vulnerability assessment of the network.
The network defined “impact chains” for each action field of the German Adaptation Strategy to
visualise the cause-effect relationships between climate signals and potential climate impacts. They
clarify which climate signal influences which potential climate impacts and provide indications
about interrelationships to other action fields. The network partners chose 72 climate impacts as
potentially relevant from a large number of identified potential climate change impacts in the
15 action fields of DAS. The selection criteria included social, economic, ecological and
cultural and spatial significance for Germany. Key sensitivities for these selected climate impacts
were discussed in expert workshops. An assessment methodology (impact models, proxy indicators
or expert survey) was identified with network partners, which constituted the basis for further
assessment steps. In addition, the impact chains served as a basis for the analysis of the
interrelationships between the individual action fields.
The conceptual approach considers climate influence and the impacts of climate change in the
German Adaptation Strategy’s action fields for the present, the near future (the period from
2021 to 2050) and the distant future (the period from 2071 to 2100). The vulnerability
assessment approach developed by the Vulnerability Network provides a system that enables clear
guidance with reference to time. It is based on the Intergovernmental Panel on Climate Change’s
vulnerability concept as described in the Fourth Assessment Report (see Figure 1).

Figure 1:            Vulnerability concept of the Vulnerability Network

                                                                                                   6
Germany‘s vulnerability to climate change – Summary
The focus of the investigation was directed to the present and the near future because the need for
action in the coming years was at the forefront. In order to map the range of future climate and
socio-economic developments, two scenario combinations for the near future were examined:
▸ Strong change: The 85th percentile of the results of DWD (German Weather Service’s)
climate model ensemble 1 was normally used for climate projections. Another starting point is
a relatively strong socio-economic development, among other things with an average annual
economic growth of 1.1 percent, an average daily land-take of 59 hectares and a population
decline to 78.68 million inhabitants by 2030 2.
▸ Weak change: The 15th percentile of the results of the DWD (German Weather Service)’s
climate model ensemble was normally used for climate projections. The socio-economic
scenario, compared to the strong change scenario, is based on a lower annual economic
growth (0.58 percent on average), a lower daily land-take (49.3 hectares) and a larger
decrease in population to 75.67 million inhabitants by 2030 (see Vulnerability Network’s
final report for details).
No plausible, spatially differentiated and quantitative socio-economic scenarios – e.g. population or
land use – were available for the distant future. Therefore, the assessment of climate impacts in
the period of 2071-2100 was only based on climate projections. Based on that, the potential
climate impacts were characterised qualitatively using verbal descriptions.
A climate signal refers to the stimulus provided by today’s climate, or by the climate in the near and
distant future. The difference between the present and the near or the distant future describes
changes to the climate such as rising temperatures, changes in precipitation, changes in weather
extremes.
Sensitivity indicates the extent to which a non-climate system (action field, population group, or
biophysical factors) reacts to specific present or future climate signals in the present or future.
Distinction was made between the sensitivity of today's human-environment system to the current
climate and the sensitivity of the future human-environment system to the future climate.
1 The DWD climate model ensemble includes 19 regional climate projections until the end of the century based on the
emission scenario A1B (see overview of the results in Progress Report, Chapter D1, further explanations at
www.dwd.de/klimaatlas). The quantiles may in principle be interpreted as follows (Federal Government 2011):
15-percent quantile: The change signals shown will be exceeded in the ensemble with an 85-percent probability; i.e. 85
percent of projections forecast higher and 15 percent the rates of change shown or lower.
85-percent quantile: The change signals shown will not be exceeded in the ensemble with an 85-percent probability,
i.e. 85 percent of the ensemble forecast the rates of change shown or lower and 15 percent predict higher rates of
change.
The area between the lower and upper barriers selected thus includes a probability of 70 percent with respect to the
ensemble considered. (Note: The terms probability and quantile used here are only based on the climate projection
ensemble used. This ensemble represents only one part of possible future climate developments so that the results
presented here are not statistical probabilities in the narrower sense.)
At times, climate data of the Potsdam Institute for Climate Impact Research (PIK) had to be used. Here the 95th
percentile was used for a strong change and the 5th percentile for a weak change. Where existing model results were
used, different climate projections are also incorporated. Here it was made sure that the assumptions of the model
calculations are similar to those of the project. A moist and a dry scenario were generally calculated for precipitation-
driven models.
2 The two socio-economic land-use scenarios used were calculated using the PANTA RHEI REGIO model composite of the
Institute of Economic Structures Research (GWS) and the Land Use Scanner of the Federal Institute for Research on
Building, Urban Affairs and Spatial Development (BBSR) for 2030 at the county level.
7Germany‘s vulnerability to climate change – Summary
A climate impact describes the impact of today's climate on today's system for the present, or the
impact of the future climate on a future system for the future. The change of climate impacts from the
present to the future enables us to see the potential impact of climate change as well as other
processes of change. The procedure for the present and near future periods followed the same
methodology. In addition to the states of the system at any given time, the change between the states
was also considered. The climate impacts were operationalised through impact models, proxy
indicators and expert surveys. Impact models can map the complex and non-linear relationships
between a climate signal and a climate impact. If scientific impact models were available in the
necessary spatial resolution and for the whole of Germany, they were used for estimating the climate
impact. If this was not the case, the climate impacts were operationalised based on proxy indicators.
Indicators identified by experts for a climate signal and sensitivity were blended - primarily at district
level. If climate impacts could not be quantified using impact models or indicators, expert surveys
were conducted. The experts were asked to estimate currently existing and possible future climate
impacts (near future) for the case of a weak and a strong change.
Both calculated results and those obtained from expert surveys may be subject to uncertainty. To
facilitate interpretation of the results, the Vulnerability Network has therefore assessed the degree of
confidence of its results at the climate impact level. This was done separately for the calculated
climate impacts (operationalised via models or proxy indicators) and climate impacts surveyed
(operationalised via surveys).
Since the operationalisation of climate impacts via impact models and indicators shows possible
temporal and spatial patterns of climate impacts in Germany, but not their absolute strength, the
Vulnerability Network went a step further and assessed the significance of the single climate
impacts for Germany. Network partners evaluated this significance on a scale from "low" through
"medium" to "high" within a structured query. They considered the social, economic, ecological and
cultural as well as the spatial significance of climate impacts in their assessment.
Adaptive capacity is the ability of a system to adapt to climate change and alleviate potential
damage. The adaptive capacity can only reduce the impacts of climate change in the future when it
has been used for concrete adaptation measures. By definition, the adaptive capacity therefore
always refers to the future, or the opportunity to take additional measures. Thus it includes potential
prevention, mitigation and protection measures that go beyond what already exists. Within this
project, the generic and sector-specific adaptive capacities to climate change in Germany were
analysed. To determine the sector-specific adaptive capacity, interviews were carried out with
network partners and external experts for all fields of action of the German adaptation strategy with
the exception of the cross-sectoral areas "spatial planning" and "civil protection". The sector-specific
adaptive capacity includes in principle the resources available for adaptation in the respective field
of activity such as finance or technical options as well as potentially supportive and hindering factors
such as lack of knowledge or awareness of the impacts of climate change. When estimating the
adaptive capacity, potentially available resources were taken into account, but not the actually
existing economic and technical capacity of the federal government, other institutions or individual
players. The adaptive capacities arising from the options of the cross-sectoral areas "spatial
planning" and "civil protection" were considered in the context of generic adaptive capacity. The
information obtained was narratively integrated into the final report.
Vulnerability was described qualitatively for each action field based on the results of the climate
impacts in the specific action field and the sectoral adaptive capacities only for the near future. The
basis for assessing the vulnerability of each action field was the assessed significance of its climate
impacts for Germany.
8Germany‘s vulnerability to climate change – Summary
An integrated approach was carried out in Chapters 8.1 to 8.3 to be able to detect the changes not
only at the sectoral level, but also to make statements on the overall importance of climate change for
Germany. For this purpose the key findings of the individual action fields were pooled from Chapter 7
and analysed, interrelationships between the action fields were considered and the implications of
the climate area types for the action fields were discussed. The results of this integrated analysis were
merged in Section 8.4 and an overall picture of Germany’s vulnerability to climate change was
derived.
3 Germany’s climate and climate change
To be able to make statements about the future development of our climate, climate models are
needed that possibly take into account all relevant processes of the climate system. The
interpretation and application of the results of climate projections for planning adaptation measures
should not be based on individual model runs because of uncertainties in the future development.
Therefore, as many climate projections are collected and evaluated collectively as possible in order to
estimate the range of possible development. However, it must be remembered that any selected
ensemble of climate projections is never able to take into account all influences within the climate
system. The bandwidth of climate changes resulting from the analysis of climate projection scenarios
must therefore be interpreted as a subset of the changes possible in reality. This analysis presents
the changes of the 30-year averages of the climate elements considered for the 2021-2050
period ("near future") and for the 2071-2100 period ("distant future") and compares them to
the 1961-1990 reference period. Important climate elements are: air temperature, precipitation,
drought, hot days, tropical nights, frost days, strong winds, snow days, swimming days, home-
heating days and climate impacts of the first order such as potential flood areas from storm surges or
flash floods or potential inundation areas of river flooding.
The annual average temperature in Germany may increase by 0.5 degrees Celsius and more in the
near future (see Figure 2). A temperature increase of up to two degrees Celsius in northern Germany
and 2.5 degrees Celsius in southern Germany is possible. For the period 2071-2100 an increase in the
average air temperature of at least 1.5 degrees Celsius and a maximum of 3.5 degrees Celsius in
northern Germany or four degrees Celsius in southern Germany is expected. The largest temperature
increases, as well as greater spatial effects from significant temperature increases, may be expected
more in the winter months than in summer. Currently, the highest temperatures are recorded in the
east of Germany (especially in Berlin and Brandenburg) and along the Rhine in the summer months.
In the near future summer temperature increases of up to 1.5 degrees Celsius and in the distant
future of up to three degrees Celsius are expected over large areas. During the winter months,
temperature increases of one to 2.5 degree Celsius in the near future and 2.5 to 4.5 degrees Celsius in
the distant future are possible.
9Germany‘s vulnerability to climate change – Summary
Figure 2: Long-standing average air temperature and changes of the climate signal
between the projection periods and the present
Source: Compiled based on German Weather Service (Deutscher Wetterdienst) 2013
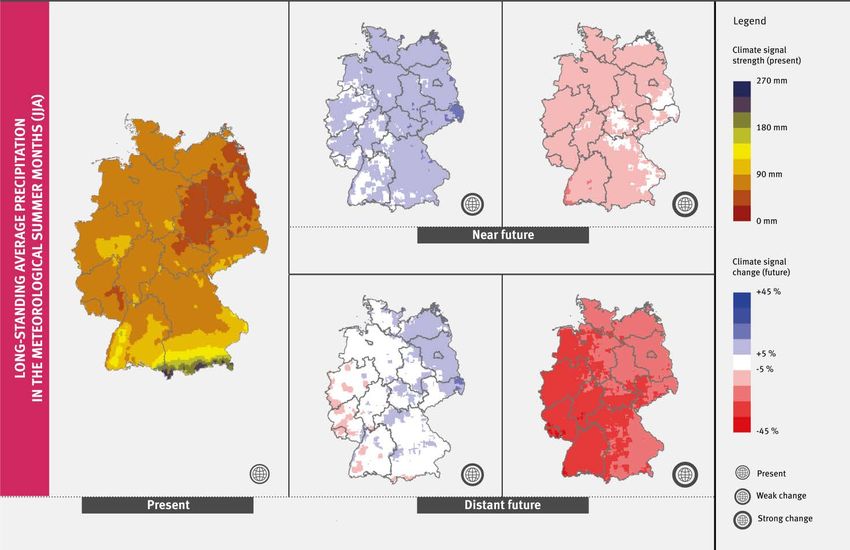
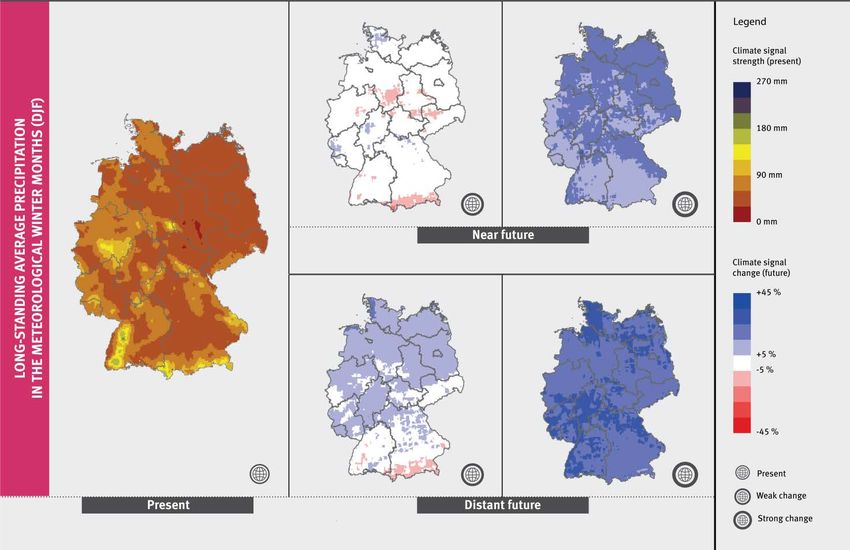
The evaluation of climate projections for precipitation for the future shows a decreasing trend in
summer precipitation (June to August) and an increasing trend in winter precipitation (December to
February) (see Figure 3): the models calculate slight decreases in rainfall nationwide for the strong
change in the summer months in the near future, but in contrast, they calculate nationwide increases
in summer precipitation for the weak change. Only in the distant future a clear reduction of 20
percent in summer precipitation is expected. For the winter months an increase in precipitation can
be considered for large parts of the Federal territory; up to 15 percent in the near future and up to 30
percent for the distant future.
10Germany‘s vulnerability to climate change – Summary
Figure 3: Long-standing average precipitation in the meteorological summer months (June,
July, August; above) and winter months (December, January, February; below)
and changes in the climate signal between the projection periods and the present
Source: Compiled based on German Weather Service (Deutscher Wetterdienst) 2013
11Germany‘s vulnerability to climate change – Summary
Climate classification days – days on which threshold events take place – are used in the projection
of meteorological extremes. The days analysed are those on which, for example, the maximum
temperature exceeds a given threshold. This allows the number of hot days, tropical nights and frost
days to be determined. Currently, eight hot days per year are measured across Germany on average
and ten to twelve hot days per year along the Upper and Middle Rhine and in parts of eastern
Germany. In the near future, the model projections used show an increase of five to ten hot days per
year throughout most of Germany and an increase of ten to 15 hot days per year in the Upper Rhine
Valley (see Figure 4). The smallest changes are found in the coastal regions. In the distant future, the
maximum increases in hot days are projected at ten to 15 days (North Germany) and 30 to 40 days
(Southwest Germany). The number of tropical nights can be expected to slightly increase by up to
ten nights in the Upper Rhine Valley. In the event of strong change projected over the distant future,
the number of tropical nights could display an increase of up to 20 nights per year in the Alpine
foothills, in southern Brandenburg, in East Saxony and in west North Rhine-Westphalia, and an
increase of up to 30 nights per year along the Upper Rhine Valley.
Figure 4: Long-standing average number of hot days (Tmax ≥ 30 degrees Celsius) and
changes in the climate signal between the projection periods and the present
Source: Complied based on German Weather Service (Deutscher Wetterdienst) 2013
Depending on the location, values of between approximately 40 and 290 frost days are currently
experienced per year. A particularly high number of frost days is observed in higher locations in the
low mountain ranges and in the Alps. The number of frost days is at its lowest in the Upper Rhine
Valley region, in the northwest of Germany (particularly on the Lower Rhine) and on the coasts. A
decline in the number of frost days can be assumed for both of the future projection periods. This
decrease could be particularly strong at the edge of the Alps, where up to 76 fewer frost days are
projected for the distant future.
12Germany‘s vulnerability to climate change – Summary
The number of days with a total rainfall of at least 20 millimetres is counted for the analysis of
extremes of precipitation (see Figure 5). At present, the highest number of heavy rain events is
recorded in the Alpine foothills. In addition, a comparatively high number of days of heavy
precipitation is displayed in the low mountain range regions (including the Black Forest, the Rothaar
Mountains, the Westerwald and the Bavarian Forest). Scrutiny of the projections shows that the trend
is particularly unclear in the south of Germany. However, it is possible for the number of days with
heavy summertime precipitation to increase by up to six (in the southern Black Forest) in the near
future.
Figure 5: Average number of days with heavy precipitation (precipitation ≥ 20 millimetres)
and changes in the climate signal between the projection periods and the present
Source: Compiled based on German Weather Service (Deutscher Wetterdienst) 2013
The number of episodes per year with at least ten consecutive precipitation-free days is evaluated for
the presentation of potential dry periods. The number of these episodes occurring in summer will
either be insignificant (weak change) or show an increase of up to three episodes (strong change) in
the near future (see Figure 6). In the distant future, however, a maximum increase of two episodes is
projected in the event of weak change (in southwest Germany and Rhineland-Palatinate), and an
increase of up to six episodes is forecast in the case of strong change (in the Black Forest). In the
event of strong change in the distant future, an increase of two to four episodes per year may be
assumed in North and East Germany.
13Germany‘s vulnerability to climate change – Summary
Figure 6: Long-standing average number of ten consecutive dry days (episodes) in the
meteorological summer months (June, July, August) and changes in the climate
signal between the projection periods and the present
Source: Compiled based on German Weather Service (Deutscher Wetterdienst) 2013
Average daily wind speeds that equal or exceed the 98th percentile of the universal daily average are
defined as extreme wind speeds. The projections show no clear trend for this statistical value in the
near or distant future. Overall, the projected changes are rather low, showing an increase or decrease
of three days in the near future.
Days with a snow cover of at least 30 centimetres and changes in the number of such days are of
interest to various parties, including winter tourism. The highest current values are recorded in the
low mountain ranges (including the Harz Mountains, the Ore Mountains, the Black Forest and the
Bavarian Forest) and in the Alps. Snow cover of over 30 centimetres is currently present on around
100 days per year in the highest locations in the low mountain ranges. A somewhat larger number of
such days is seen in the Alps. While the trend is still uncertain for the near future, the number of days
with a snow cover of at least 30 centimetres could diminish significantly by the end of the century –
in the case of strong change, this could amount to a decrease of more than 90 days in parts of the low
mountain ranges and of more than 100 days in parts of the Alps.
On the basis of the parameters used, the number of swimming days displays a similar pattern to the
average air temperatures in summer. The highest numbers of swimming days are found along the
southern part of the Upper Rhine, in large parts of Bavaria and in Brandenburg, which currently
experience up to 30 such days per year. The German coasts exhibit relatively few swimming days at
present, with five to ten such days per year. In the near future, the biggest increase of over 30 days
per year is projected in large parts of Baden-Württemberg, Rhineland-Palatinate, Hesse and in Berlin.
In absolute terms, the increase would only be half as large on the coasts. In the distant future, the
fifth percentile (weak change) displays an average increase of around ten swimming days per year in
14Germany‘s vulnerability to climate change – Summary
Germany as a whole. In the event of strong change (95th percentile), an increase of more than 50
days per year would be possible in south and north Baden-Württemberg and in parts of Bavaria,
Hesse and Rhineland-Palatinate. Somewhat lower increases of just over 20 days per year are
projected for sections of the North and Baltic Sea coasts.
The term "home-heating days" – defined as days with an average daily temperature of under 15
degrees Celsius – is employed to indicate the number of days per year on which heating is used. The
number of home-heating days currently lies between 34 and 191 days per year. The focal areas with
the most home-heating days (more than 100 home-heating days per year) are found in higher
locations in the low mountain ranges and in the Alpine region. This is due to the lower air
temperature displayed in these regions overall. A decrease in home-heating days is predicted for both
of the two future time periods and for the entire development corridor. The projections considered for
the near future show changes between 10 to 30 fewer home-heating days per year. For the distant
future, a decrease of between 20 and 30 annual home-heating days is to be expected in large parts of
Germany.
Figure 7: Long-standing average potential flooding area in counties and changes in the
climate signal between the projection periods and the present
Source: Compiled based on Joint Research Centre 2013
The LISFLOOD hydrological rainfall-runoff model was used to model potential flood events caused
by rivers (see Figure 7). In quantitative terms, the areas that may potentially be affected by river
flooding are concentrated around the northern half of Germany, specifically in the regions
surrounding the rivers Eider, Elbe, Ems, Havel, Oder, Rhine, Schlei/Trave and Weser. These locations
are also where the largest notable changes to potential flooding areas can be expected. In the event of
weak change, a nationwide decline is predicted in the near future, with the exception of the
Schleswig-Flensburg district, which displays a slight increase. Should strong change occur, increases
15Germany‘s vulnerability to climate change – Summary
in potential flooding areas are the only changes that might take place. Increases are to be particularly
expected in the Eider area in North Friesland, in the Cleves district in the Lower Rhine region and in
the districts within the Saxony, Saxony-Anhalt and Brandenburg (Havel and Elbe) tri-border area. For
the weak change (15th percentile), these developments would be slightly more pronounced in the
distant future. In the event of strong change (85th percentile), however, a trend reversal becomes
evident in the districts around Berlin in the northeast of Germany. A decrease in potential flooding
areas is expected in the Mittelelbe-Elde, Havel and Oder regions. The districts of North Friesland,
Cleves and additional districts along the Ems and Weser rivers will potentially still be affected by
more flooding.
The "Seaside Flooding Areas" function of the "HWRM-RL Flooding Scenarios" geoportal from the
German Federal Institute of Hydrology (BfG) was used to analyse the impact of potential storm surge
events (see Figure 8). Assessments were made for the present and the near future (weak change)
using areas of 'medium probability (HQ100)' events. The flooding areas of an HQextreme were applied for
the near future (strong change) under the assumption that changes in climate conditions could lead
in the future to HQ100 events corresponding more closely to today’s HQextreme. This was determined
using the scenario of a very severe storm surge. The information is based on data from the relevant
state (Land) authorities. The differences between the two scenarios with regard to the potentially
affected areas are comparatively low on the Baltic Sea coast. The extreme event (HQextreme) displays
minor increases in the potential flooding area. Clear increases in the areas at risk from potential
flooding are expected during an extreme event on the North Sea coast, however. In such an event, the
entire coastal area and large parts of land situated away from the coast would be assessed as
potentially at risk from flooding.
Figure 8: Potential flooding areas by storm surges in counties and changes in the climate
signal between the projection periods and the present
Source: Compiled based on German Federal Institute of Hydrology 2013
16Germany‘s vulnerability to climate change – Summary
4 Socio-economic developments
Socio-economic developments were considered within the framework of the Vulnerability
Network to assess sensitivity at the present time and in the near future. No scenarios are
available for socio-economic developments in the distant future. However, two scenarios –
"growth" and "stagnation" – were considered for the near future to estimate the potential
range of future developments (see Table 1). The relative change in the population figures, the
population over 60 years, the number of employed people, the gross domestic product (GDP), the
disposable income in private households, the size of the working population and the number of
households were all used as indicators.
Table 1: Parameters and statistical values of socio-economic development for land-use
scenarios (2009 to 2030)
Parameter Growth scenario Stagnation scenario
Annual external migration balance
+150,000 +70,000
(long-term, projected target figures)
Annual gross domestic product +1.1 percent +0.58 percent
(long-term, projected target figures) average per year average per year
-3.92 percent -7.56 percent
Population development 2009 to 2030 (-0.19 percent (-0.37 percent
average per year) average per year)
Absolute population 2030 78.68 million 75.67 million
Absolute number of households 2030 41.3 million 40.3 million
Daily land-take 2009 to 2030
59.0 hectares 49.3 hectares
(nationwide, conversion of
average per year average per year
undeveloped into developed areas)
Source: Federal Institute for Research on Building, Urban Affairs and Spatial Development 2012
The development of population figures differs strongly from region to region (see Figure 9). States
(Länder) in the east of Germany and some regions in the west of the country show a particularly
significant decrease in the "growth" scenario. A decrease in the population is to be expected in the
Frankfurt (Oder) and Oberspreewald-Lausitz districts, in Suhl and in Neubrandenburg by 2030 in the
"stagnation" scenario. The development of households shows a very similar picture. In the "growth"
scenario, the number of households displays a particular decline in the states (Länder) in the east of
Germany. Some regions show a strong increase in the number of households, however. Particularly
noteworthy in this respect is the Greater Munich area, where the increase could stand at over 20
percent. The developments are much more pronounced in the "stagnation" scenario. Although its
spatial patterns correspond to those of the "growth" scenario, the "stagnation" scenario nevertheless
differs in that it displays a larger total quantity of regions that show a significant decrease in the
number of households.
17Germany‘s vulnerability to climate change – Summary
Figure 9: "Growth" and "stagnation" scenarios for the relative change in the number of
inhabitants (2010 to 2030)
Source: Compiled based on Federal Institute for Research on Building, Urban Affairs and Spatial
Development 2012; Federal Ministry for Transport, Building and Urban Affairs 2011; Distelkamp et al., The
Institute of Economic Structures Research 2009; Distelkamp et al. 2011
In both scenarios, the absolute number of older people in less economically dynamic regions (e.g.
Saxony-Anhalt, Saxony and some peripheral regions) remains roughly similar in the near future.
Nevertheless, there is an increase in the proportion of older people in the population as a whole. This
is because younger people leave these regions to a large extent during periods of overall economic
stagnation. A certain economic dynamism is assumed in the growth scenario, even in rather
economically problematic regions. This leads to the proportion of older people being lower than in
the stagnation scenario.
The changes in gross domestic product (GDP) show very large spatial differences when the two
scenarios are compared with one another. The two scenarios have something in common – they can
both expect a positive development in gross domestic product overall. The majority of counties
display growth of between 40 and 60 percent in the "growth" scenario. Regions in the east and south
of the country in particular can expect very positive developments in the "stagnation" scenario. In
contrast, regions in the states (Länder) to the west of Germany can expect lower growth figures.
The scenarios differ in how pronounced their spatial characteristics are with regard to the relative
change in private households' disposable income. Regions with the highest losses include
Magdeburg, Dessau-Roßlau, Brandenburg (Havel) and Halle (Saale). The largest increases in
disposable income are forecast for the Greater Munich area, the Saar-Palatinate district, the Rhine-
Neckar district, the Wartburg district, Braunschweig, Wolfsburg, Sömmerda and northwest
Mecklenburg. In the "growth" scenario, the majority of Germany can expect a positive development
in disposable income. A similar situation arises in the "stagnation" scenario, but the effect is far less
18Germany‘s vulnerability to climate change – Summary
pronounced. Some regions that can expect a reduction in disposable income in the "growth" scenario
have to face an even more significant decrease in the "stagnation" scenario.
An increase in the size of the working population is to be particularly expected in the northwest
Mecklenburg region and in such regions as Dingolfing-Landau, the Rhine-Neckar district, Wolfsburg,
Dahme-Spreewald and Vechta. In the event of the growth scenario, most counties can expect an
increase in the size of the working population. However, a slight decrease in the size of the working
population may be particularly expected in the east of Germany and in isolated rural regions in the
north and west of the country. The reduction in the size of the working population is significantly
stronger on average in the "stagnation" scenario than in the "growth" scenario. Whether the size of
the working population increases or decreases, however, no difference can be found in the regional
characteristics.
The land use scenarios, which also have an influence on sensitivity, anticipate an overall increase
in the land area used for housing and transport in the year 2030 (see Figure 10). The change in the
development of the land area used for housing and transport in Germany between 2010 and 2030
shows that the regions displaying higher land-take in the future are predominantly those regions that
already use a large proportion of their land for housing and transport today. This particularly applies
to regions around the major metropolitan areas of Hamburg, Berlin, Munich and Rhine-Main. At the
same time, the regions with particularly low land-take are also clearly discernable. As a result of
demographic development, only small increases in the area used for housing and transport can be
expected from the following regions in particular: Saxony-Anhalt, Mecklenburg-Western Pomerania,
the Black Forest and the Swabian Jura.
Figure 10: Change in the housing and transport area between 2010 and 2030 expressed as
a percentage (community level) for the growth scenario and the stagnation
scenario
Source: Compiled based on Federal Institute for Research on Building, Urban Affairs and Spatial
Development 2014; Distelkamp et al., The Institute of Economic Structures Research 2009; Hoymann and
Goetzke 2014
19Germany‘s vulnerability to climate change – Summary
5 Generic adaptive capacity and adaptive capacity of spatial
planning
Adaptive capacity entered vulnerability analysis as a status quo. From today's perspective it
represents the scope of options available to adapt to the expected climate change using
additional measures. The Vulnerability Network considered three forms of adaptive capacity:
1. Sector-specific adaptive capacity determined for each action field by expert surveys, describes
how adaptable the action field is;
2. Generic adaptive capacity, which describes key conditions for an adaptable society in general
using indicators independently from action fields;
3. Adaptive capacity of the cross-sectoral topics "Spatial planning, regional and urban
development" and "Civil protection", which describes their contribution towards adaptation to
climate change.
Together with an integrated consideration of the climate change impacts, these three forms of
adaptive capacity were merged into a summary assessment of vulnerability for each action field.
Generic adaptive capacity of a society describes the structural framework for the implementation of
adaptation measures. Adaptation takes place in various governing entities. Public administration, the
private sector and civil society were selected as the main governing entities within the Vulnerability
Network for the assessment of generic adaptive capacity. These governing entities were broken down
into dimensions, to which appropriate indicators were assigned in agreement with the Vulnerability
Network’s authorities and institutions. For each indicator, the information of its generic adaptive
capacity map is subdivided into five categories from "very low adaptive capacity" to "very high
adaptive capacity". The maps for the different indicators were normalised and merged on a map to
show a quantifiable section of the generic adaptive capacity in a general synopsis. The final results
indicate high generic adaptive capacity in large cities and densely populated areas. Berlin exhibits
the highest adaptive capacity among all counties and county-free cities studied. This is followed by
major cities such as Munich, Nuremberg, Stuttgart, Dusseldorf and Wolfsburg. A medium generic
adaptive capacity can be seen in almost all counties and county-free cities of North Rhine-
Westphalia. Also adjoining counties and county-free cities in Lower Saxony and some counties in
Bavaria and Hesse exhibit a medium generic adaptive capacity. A relatively low generic adaptive
capacity can be observed in large parts of Rhineland-Palatinate, Baden-Württemberg, Schleswig-
Holstein and Bavaria. Alongside Saarland, large parts of eastern Germany in particular exhibit the
lowest adaptive capacity. Overall however, the meaningfulness of generic adaptive capacity is
limited since only the potential ability to adapt to climate change has been mapped, not the
willingness to adapt. Thus an attempt was made to approach this issue via spatial planning’s
contribution to adaptive capacity because this shows the formal options the regions use for
adaptation.
The fields “Spatial planning, regional and urban development" and "Civil Protection" are especially
highlighted in the German Adaptation Strategy as cross-sectoral topics: while regional planning,
spatial and urban development, and thus spatial planning in a cross-sectoral way, is at the beginning
of the risk prevention chain, civil protection is composed of the elements ‘precaution and reaction’
and includes all civil measures taken to protect the population and their livelihoods.
Adaptation activities in the context of spatial planning were taken into account at both a regional and
local level.
The analysis of the adaptive capacity of spatial planning was carried out as a full survey for the
whole of Germany at the spatial planning level of regions in 2014 (territorial status as of
20Germany‘s vulnerability to climate change – Summary
31/12/2013). It provided quantitative conclusions for taking into account the adaptation
possibilities of formal spatial planning. This analysis considers which regional plans identified
priority and restricted areas 3 for the 7 action fields of MKRO 4 that are important for adaptation to
climate change 5. Thus the analysis only includes formal stipulations of spatial planning. Informal
instruments and measures such as contribution and cooperation are not taken into account since
they cannot be acquired and their impacts cannot be evaluated in a standardised way. Furthermore,
the city states of Berlin, Bremen (including Bremerhaven) and Hamburg are not included as their
spatial planning is covered by land-use planning at a local level and they have therefore no regional
plans. The same applies to the six county-free towns of Lower Saxony, which is why these were also
not considered. Moreover, the analysis did not refer to the city region of the Ruhr district for which a
regional land-use plan (RFNP) is available, and Saarland whose regional planning is currently being
performed at the state (Land) development level. Of note are the regional planning regions of
Brandenburg and two planning regions of Lower Saxony where no spatial planning was
implemented. This follows from the fact that no integrated regional plans 6 were available in
Brandenburg’s planning regions on the date of reporting. The regional plans had expired and thus
were invalid in Lower Saxony’s two planning regions by the date of reporting. A comparison of the
regional planning regions of the states (Länder) reveals that many formal regional planning options
to adapt to climate change have already been used, especially in Saxony, Saxony-Anhalt and North
Rhine-Westphalia (see Figure 11).
Because of the large number of municipalities (over 4,000), at the local spatial planning level, the
number of climate adaptation projects per community carried out and funded by the Federal
Government was used as an indicator for adaptation activities. The results show that in the majority
of counties, no climate adaptation projects documented in the above databases have been completed.
However, many activities have taken place at the local level in particular, which have not been
registered under the notion of adaptation to climate change (e.g. municipal water management,
municipal landscape planning) and carried out outside the funded activities.
3 While certain functions and uses are envisaged and other uses excluded for priority areas, they have only a special
importance in the weighing process in restricted areas, but the use has not been finally stipulated.
4 The Ministerial Conference on Spatial Planning (MKRO) specified seven action fields for climate change adaptation in
2013: risk prevention for flood protection in river basins (1), risk prevention for coastal protection (2), protection of
mountain regions (3), protection from heat effects (4) and from water shortages (5) and the consideration of climate-
induced changes in tourism behaviour (6) and the habitats of animals and plants (7) of key significance. In addition,
MKRO may add other subjects to the continuation of its Resolution on "Spatial Planning and Climate Change" in the
future.
5 However, this analysis cannot make any comment about the adaptive capacity of other action fields, since identifying
priority and restricted areas in relevant plans does not mean that appropriate adaptation measures are implemented by
the relevant specialist planning.
6 No partial climate adaptation plan is available either that could contribute to adaptive capacity.
21You can also read