CLASSIFICATION OF BIVALVE MOLLUSC PRODUCTION AREAS IN ENGLAND AND WALES SANITARY SURVEY REPORT - EC Regulation 854/2004 Holy Island ...
←
→
Page content transcription
If your browser does not render page correctly, please read the page content below
www.cefas.defra.gov.uk

EC Regulation 854/2004

CLASSIFICATION OF     BIVALVE  MOLLUSC
PRODUCTION AREAS IN ENGLAND AND WALES
SANITARY SURVEY REPORT

Holy Island

October 2014
Cover photo: St Cuthbert’s Isle. © Crown copyright 2014 Current Cefas sanitary survey reports and reviews are available on our website at: http://www.cefas.defra.gov.uk/our-science/animal-health-and-food-safety/food- safety/sanitary-surveys/england-and-wales.aspx Contacts For enquires relating to this report or For enquires relating to policy matters on further information on the implementation the implementation of sanitary surveys in of sanitary surveys in England and England: Wales: Simon Kershaw Karen Pratt Food Safety Group Hygiene Delivery Branch Cefas Weymouth Laboratory Local Delivery Division Barrack Road Food Standards Agency The Nothe Aviation House Weymouth 125 Kingsway Dorset London DT4 8UB WC2B 6NH +44 (0) 1305 206600 +44 (0) 207 276 8970 fsq@cefas.co.uk shellfishharvesting@foodstandards.gsi.gov.uk
Statement of use
This report provides a sanitary survey relevant to bivalve mollusc fisheries at Holy Island,
as required under EC Regulation 854/2004 which lays down specific rules for official
controls on products of animal origin intended for human consumption. It provides an
appropriate hygiene classification zoning and monitoring plan based on the best available
information with detailed supporting evidence. The Centre for Environment, Fisheries &
Aquaculture Science (Cefas) undertook this work on behalf of the Food Standards Agency
(FSA).

Report prepared by
Alastair Cook, David Walker, Rachel Parks, Owen Morgan, Fiona Vogt.

Revision history
Version    Details                                      Approved by           Approval date
1          Draft for internal consultation               Fiona Vogt            17/10/2014
2          Draft for client/consultee comment          Simon Kershaw           22/10/2014
3          Final                                       Andrew Younger          29/01/2015

Consultation
Consultee                                              Date of consultation   Date of response
Northumberland County Council                          29/10/2014             -
Northumberland IFCA                                    29/10/2014             26/11/2014
Natural England                                        29/10/2014             26/11/2014
Environment Agency                                     29/10/2014             13/11/2014
Shellfish Association of Great Britain                 29/10/2014             -
Northumbrian Water                                     29/10/2014             14/11/2014
Defra                                                  29/10/2014             -

Dissemination
Food Standards Agency, Northumberland County Council. The report is available publicly
via the Cefas website.

Recommended Bibliographic Reference
Cefas, 2014. Sanitary survey of Holy Island. Cefas report on behalf of the Food Standards
Agency, to demonstrate compliance with the requirements for classification of bivalve
mollusc production areas in England and Wales under EC regulation No. 854/2004.
Contents
1. Introduction ...................................................................................................................... 5

2. Recommendations ........................................................................................................... 9

3. Sampling Plan ................................................................................................................ 11

4. Shellfisheries ................................................................................................................. 15

5. Overall Assessment ....................................................................................................... 18

Appendices ........................................................................................................................ 30

Appendix I. Human Population .......................................................................................... 31

Appendix II. Sources and Variation of Microbiological Pollution: Sewage Discharges ....... 32

Appendix III. Sources and Variation of Microbiological Pollution: Agriculture .................... 36

Appendix IV. Sources and variation of microbiological pollution: Boats ............................. 39

Appendix V. Sources and Variation of Microbiological Pollution: Wildlife .......................... 41

Appendix VI. Meteorological Data: Rainfall ........................................................................ 43

Appendix VII. Meteorological Data: Wind........................................................................... 44

Appendix VIII. Hydrometric Data: Freshwater Inputs ......................................................... 46

Appendix IX. Hydrography ................................................................................................. 49

Appendix X. Microbiological data: Shellfish Waters .......................................................... 53

Appendix XI. Microbiological Data: Shellfish Flesh Hygiene .............................................. 61

Appendix XII. Bacteriological survey .................................................................................. 68

Appendix XIII. Shoreline Survey Report............................................................................. 69

References ........................................................................................................................ 80

List of Abbreviations .......................................................................................................... 83

Glossary............................................................................................................................. 84

Acknowledgements ............................................................................................................ 85
1. Introduction

1.1. Legislative Requirement
Filter feeding, bivalve molluscan shellfish (e.g. mussels, clams, oysters) retain and
accumulate a variety of microorganisms from their natural environments. Since filter
feeding promotes retention and accumulation of these microorganisms, the
microbiological safety of bivalves for human consumption depends heavily on the
quality of the waters from which they are taken.

When consumed raw or lightly cooked, bivalves contaminated with pathogenic
microorganisms may cause infectious diseases (e.g. Norovirus-associated
gastroenteritis, Hepatitis A and Salmonellosis) in humans. In England and Wales,
fish and shellfish constitute the fourth most reported food item causing infectious
disease outbreaks in humans after poultry, red meat and desserts (Hughes et al.,
2007).

The risk of contamination of bivalve molluscs with pathogens is assessed through
the microbiological monitoring of bivalves. This assessment results in the
classification of BMPAs, which determines the level of treatment (e.g. purification,
relaying, cooking) required before human consumption of bivalves (Lee and
Younger, 2002).

Under EC Regulation 854/2004 laying down specific rules for the organisation of
official controls on products of animal origin intended for human consumption,
sanitary surveys of BMPAs and their associated hydrological catchments and coastal
waters are required in order to establish the appropriate representative monitoring
points (RMPs) for the monitoring programme.

The Centre for Environment, Fisheries & Aquaculture Science (Cefas) is performing
sanitary surveys for new BMPAs in England and Wales, on behalf of the Food
Standards Agency (FSA). The purposes of the sanitary surveys are to demonstrate
compliance with the requirements stated in Annex II (Chapter II paragraph 6) of EC
Regulation 854/2004, whereby ‘if the competent authority decides in principle to
classify a production or relay area it must:

      a) make an inventory of the sources of pollution of human or animal origin
         likely to be a source of contamination for the production area;

      b) examine the quantities of organic pollutants which are released during the
         different periods of the year, according to the seasonal variations of both
         human and animal populations in the catchment area, rainfall readings,
         waste-water treatment, etc.;

                                                                                        5
c) determine the characteristics of the circulation of pollutants by virtue of
          current patterns, bathymetry and the tidal cycle in the production area; and

       d) establish a sampling programme of bivalve molluscs in the production area
          which is based on the examination of established data, and with a number
          of samples, a geographical distribution of the sampling points and a
          sampling frequency which must ensure that the results of the analysis are
          as representative as possible for the area considered.’

EC Regulation 854/2004 also specifies the use of Escherichia coli as an indicator of
microbiological contamination in bivalves. This bacterium is present in animal and
human faeces in large numbers and is therefore indicative of contamination of faecal
origin.

In addition to better targeting the location of RMPs and frequency of sampling for
microbiological monitoring, it is believed that the sanitary survey may serve to help to
target future water quality improvements and improve analysis of their effects on
shellfish hygiene. Improved monitoring should lead to improved detection of pollution
events and identification of the likely sources of pollution. Remedial action may then
be possible either through funding of improvements in point sources of
contamination or as a result of changes in land management practices.

This report documents the information relevant to undertake a sanitary survey for
Pacific oysters (Crassostrea gigas) and mussels (Mytilus spp.) at Holy Island. The
area was prioritised for survey in 2014-15 by a risk ranking exercise.

                                                                                           6
1.2. Area description

                         Figure 1.1: Location of the survey area

Holy Island is a small island situated just off the Northumbrian coast that is accessed
via a tidal causeway. The island is a popular tourist attraction and also supports a
small fishing fleet and some limited agriculture. The adjacent mainland is rural in
nature and sparsely populated, and is mainly devoted to agriculture with some
tourism also. There are several watercourses draining from the mainland. Between
the island and the mainland there is a shallow, semi-enclosed embayment which
supports a long established Pacific oyster farm as well as extensive naturally
occurring mussel beds.

1.3. Catchment
The catchment area draining to Holy Island Sands is approximately 132 km². It lies
on the Northumbrian coastal plain, a relatively flat and low lying strip of land
bordering the coast and has a maximum elevation of 202 m in the south of the
catchment at Kyloe Wood. Figure 1.2 shows land cover within this area.

                                                                                          7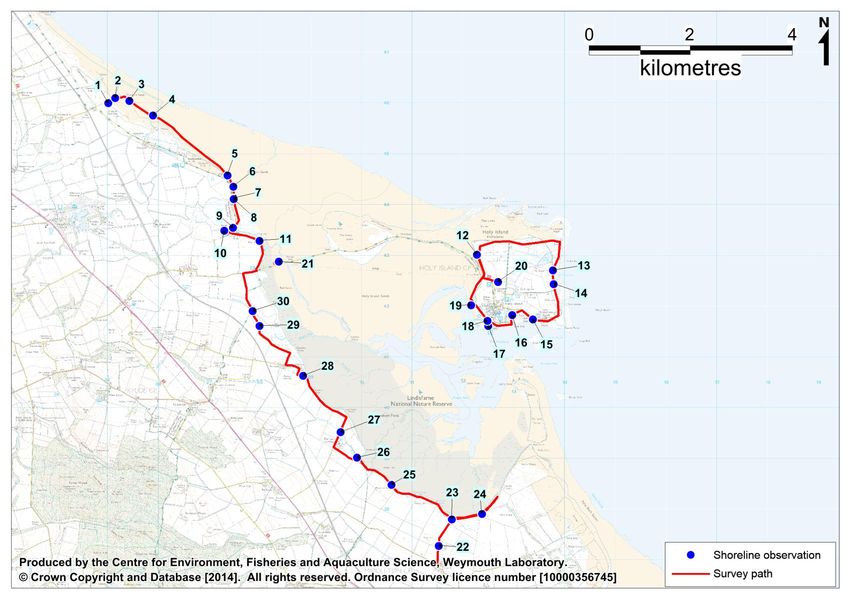
Figure 1.2: Landcover in the Holy Island catchment area

Arable farm land dominates the mainland catchment interspersed with some pockets
of pasture and woodlands. Holy Island comprises largely of grassland and pasture,
with some arable land. Different land cover types will generate differing levels of
contamination in surface runoff. Highest faecal coliform contribution arises from
developed areas, with intermediate contributions from the improved pastures and
lower contributions from the other land types (Kay et al. 2008a). The contributions
from all land cover types would be expected to increase significantly after marked
rainfall events, particularly for improved grassland which may increase up to 100
fold. Hydrogeology maps indicate that the catchment geology is of moderate
permeability throughout (NERC, 2012). River levels are therefore likely to respond
to rainfall but will not be particularly flashy as there will be some discharge from and
recharge to ground waters.

                                                                                           8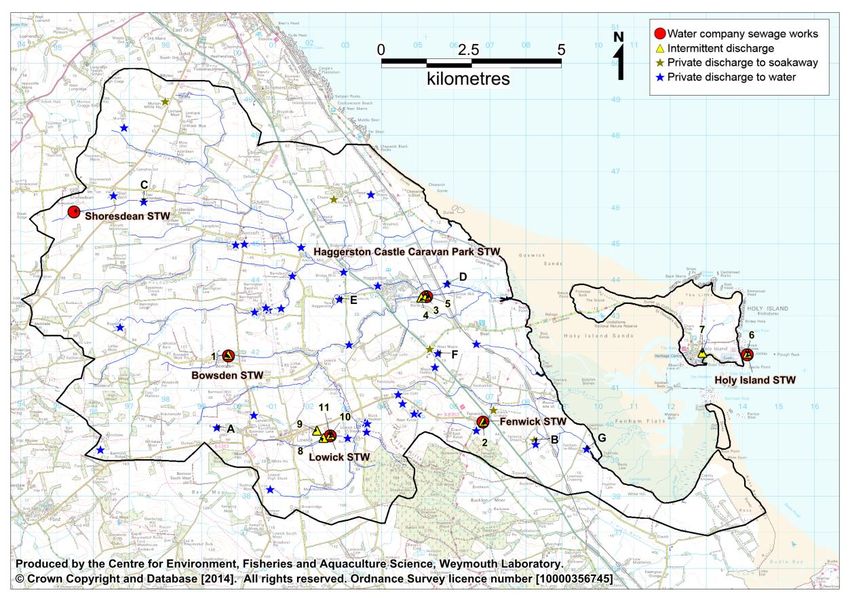
2. Recommendations
Pacific oysters
Within the area requiring continued classification there will be a general tendency for
reduced flushing and dilution potential towards the southern end. There are some
freshwater inputs which may influence the hygiene status of the fishery. The South
Low and Beal Cast watercourses converge and drain to the channel which lies just
north of the fishery, and the Fenham Burn drains to the channel which lies to the
west of the fishery, roughly at the midpoint of the main row of trestles oriented in a
north south direction. Runoff carried by these watercourses will be subject to
significant dilution before arriving in the vicinity of the fishery. Stocks held at lower
elevations immediately adjacent to these channels will be more exposed to
contamination from these watercourses when there is less scope for dilution around
low water. Seals may also be a significant contaminating influence. Their haul out
sites are on sandbanks to the north west of the fishery. Contamination deposited
here will be mobilised as the tide covers the sandbanks, particularly if wave action
from the North Sea penetrates the entrance. This will generally be carried away
from the fishery during the flood, but towards it on the ebb, although the initial
covering on the flood is likely to be the time when mobilisation into the water column
is most rapid. Sources of contamination from the south shore of Holy Island (Holy
Island STW and the intermittent discharge at the harbour) will initially be carried past
the fishery to its north on the flood tide so will probably not impact directly.

On balance, it is recommended that the RMP is located at the northern end of the
fishery to capture potential impacts from the South Low/Beal Cast, as well as the
seal haulout sites. Bacteriological survey results tentatively support this conclusion.
This would also capture to some extent any influence from the Fenham Burn,
although if this was the only consideration an RMP near where its drainage channel
joins the subtidal channel adjacent to the fishery may be slightly more effective. The
RMP should be located on the edge of the trestles at the lowest elevation accessible
to reflect reduced dilution potential towards the end of the ebb tide. Samples should
be collected by hand on a year round monthly basis, and should consist of animals
of a market size. A tolerance of 10 m applies.

Mussels
There is no commercial interest in the mussel stocks at present, but historically there
has been and they are a considerable resource. A sampling plan is therefore
provided, which only requires implementation subject to renewed commercial
interest in the fishery and approval from Natural England and/or the Northumberland
IFCA. As the mussel bed lies in the same geographic area, the rationale for RMP

                                                                                            9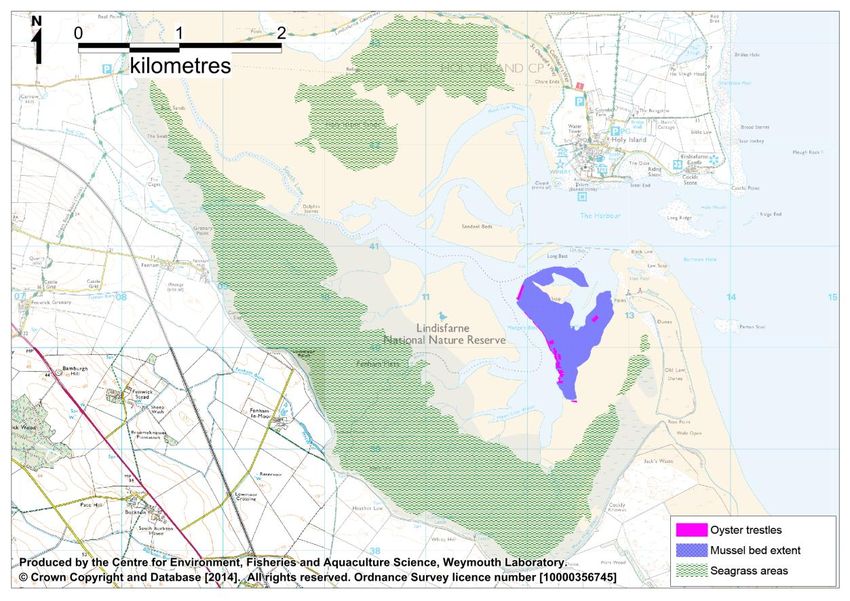
location is the same as that described above for oysters, so it is recommended that
the RMP is positioned at the same point. Samples should be collected by hand on a
year round monthly basis, and should consist of animals above whatever minimum
size is applied if the fishery opens. The sampling frequency may require review if
any formal closed seasons are imposed. Should a more rapid classification be
required, this may be awarded provisionally on submission of 10 samples taken not
less than one week apart. Given the dense covering, a tolerance of 10 m should be
sufficient to allow repeated sampling.

                                                                                      10
3. Sampling Plan
3.1. General Information
Location Reference
Production Area Holy Island
Cefas Main Site Reference M001
Ordnance survey 1:25,000 map Explorer 340
Admiralty Chart 111
Shellfishery
Pacific oysters Trestle farm
Species/culture
Mussels Wild
Seasonality of Year round (although mussels historically harvested September to
harvest April)
Local Enforcement Authority
Commercial Team
Public Protection Service
Northumberland County Council
Name
Loansdean
Morpeth
Northumberland NE61 2AP
Environmental Health Officer Rose Mary Ayre
Telephone number 01670 623830
Fax number 01670 626059
E-mail rosemary.ayre@northumberland.gcsx.gov.uk
3.2. Requirement for Review
The Guide to Good Practice for the Microbiological Monitoring of Bivalve Mollusc
Harvesting Areas (EU Working Group on the Microbiological Monitoring of Bivalve
Mollusc Harvesting Areas, 2014) indicates that sanitary assessments should be fully
reviewed every 6 years, so this assessment is due a formal review in 2020. The
assessment may require review in the interim should any significant changes in
sources of contamination come to light or any changes to the shellfishery occur other
than those currently planned.
11Table 3.1: Location of representative monitoring point (RMP) and frequency of sampling for Holy Island
Latitude &
Classification RMP Growing Harvesting Sampling
RMP* NGR Longitude Species Tolerance Frequency Comments
zone name method technique method
(WGS84)
Fenham NU
55° 39.538’N Pacific Trestle
Fenham Flats B001P Flats 1195 Hand Hand 10 m Monthly
01° 48.698’W oysters culture
North 4062
Only requires
classification
on request.
Sampling
frequency may
require revision
if a closed
season is
Fenham NU imposed in the
55° 39.538’N
Fenham Flats B001Q Flats 1195 Mussels Wild Hand Hand 10 m Monthly future. If a
01° 48.698’W
North 4062 more rapid
classification is
required this
can be
awarded
following 10
samples taken
not less than a
week apart
12Figure 3.1: Recommended zoning and monitoring arrangements (applies to both mussels and
oysters)
13Figure 3.2: Comparison of RMP locations before and after survey (both species)
144. Shellfisheries
4.1. Description of fisheries
The subject of this survey is a Pacific oyster trestle farm, which was established in
1989. There are also extensive naturally occurring mussel beds within the survey
area which have been subject to light commercial exploitation in the past. Figure 4.1
shows the locations of the trestles (provided by Natural England), the extent of the
mussel bed and the distribution of seagrass within which any shellfish gathering is
prohibited.
Figure 4.1: Location of shellfish resources within the survey area
The trestle farm is relatively large. It consists of a series of discrete blocks of trestles
along the lower intertidal area adjacent to a subtidal channel known as Madge’s
Batts. Here, hatchery seed is placed in mesh bags and grown to market size, a
process that takes about 3 years. Harvesting is undertaken by hand, and the annual
production is in the order of 50 tonnes. The harvesters have their own depuration
facilities and supply to a wide range of markets including local outlets and London
restaurants. The oyster farm is not subject to any conservation controls such as
minimum size or closed seasons.
Mussels are widespread throughout the survey area. The main bed, which has been
subject to commercial gathering in the past, is located in the same privately owned
15area as the oyster farm. It is surveyed annually by the Northumberland IFCA. The
2013 survey indicated that this bed covered an area of 41.3 Ha and contained 3,503
tonnes of mussels, of which a relatively high proportion were of a marketable size
(Green and Royle, 2013). Recent recruitment was poor, as evidenced by a lack of
juveniles in 2013, although the as yet unpublished survey in 2014 indicates some
fresh settlement had occurred since (Northumberland IFCA, pers. comm.). It used to
be subject to hand gathering by one operator from Berwick, who was licensed to
take up to 10 tonnes from the fishery each year. These were purified and sold at
farmers markets and to local restaurants. Harvesting was undertaken from
September to April, when the mussels were in best condition. Exploitation of these
mussels stopped in 2010 for a number of reasons, including a fall in their quality and
marketability, the causes of which are unclear. No formal expressions of interest in
reopening the fishery have been lodged with the IFCA.
The only IFCA byelaw applicable to the mussel fishery is Byelaw 17, which prohibits
gathering within areas of seagrass. Responsibility for the management of the
mussel beds largely lies with Natural England, due to their location within the
Lindisfarne National Nature Reserve. In response to applications to harvest here
they decide if the fishery can be permitted, and assign quotas, minimum sizes and
open periods. When the fishery was previously exploited, a precautionary
management approach was adopted due to the sensitive nature of the site, and
allowable catches were small relative to stock size.
Other patches of mussels within the survey area do not hold the quantity and quality
as on the main mussel bed so will not require a sampling plan. Additionally, most
are in close proximity to and in some cases coincide with the seagrass beds.
4.2. Hygiene Classification
Table 4.1 lists all classifications within the survey area since 2005.
Table 4.1: Classification history for Holy Island, 2004 onwards
Area Species 2005 2006 2007 2008 2009 2010 2011 2012 2013 2014
Ross Links R9 P. oyster B-LT B-LT B-LT B-LT B-LT B-LT B-LT B-LT B-LT B-LT
Ross Links A Mussels B B B B B B-LT - - - -
LT denotes long term classification
Mussels have not been classified since 2010. The oyster farm has held a long term
B classification during recent years.
16Table 4.2: Criteria for classification of bivalve mollusc production areas.
1 Post-harvest treatment
Class Microbiological standard
required
Live bivalve molluscs from these areas must not exceed
2 -1
A 230 Most Probable Number (MPN) of E. coli 100g Fluid None
and Intravalvular Liquid (FIL)
Live bivalve molluscs from these areas must not exceed
Purification, relaying or
3 the limits of a five-tube, three dilution MPN test of 4,600 E.
B -1 cooking by an approved
coli 100g FIL in more than 10% of samples. No sample
-1 method
may exceed an upper limit of 46,000 E. coli 100g FIL
Relaying for, at least, two
Live bivalve molluscs from these areas must not exceed
4 months in an approved
C the limits of a five-tube, three dilution Most Probable
-1 relaying area or cooking
Number (MPN) test of 46,000 E. coli 100g FIL
by an approved method
6 -1 5
Prohibited >46,000 E. coli 100g FIL Harvesting not permitted
1
The reference method is given as ISO 16649-3.
2
By cross-reference from EC Regulation 854/2004, via EC Regulation 853/2004, to EC Regulation
2073/2005.
3
From EC Regulation 1021/2008.
4
From EC Regulation 854/2004.
5
This level is not specifically given in the Regulation but does not comply with classes A, B or C. The
competent authority has the power to prohibit any production and harvesting of bivalve molluscs in
areas considered unsuitable for health reasons.
6
Areas which are not classified and therefore commercial harvesting of LBMs cannot take place. This
also includes areas which are unfit for commercial harvesting for health reasons e.g. areas
consistently returning prohibited level results in routine monitoring and these are included in the FSA
list of designated prohibited beds
175. Overall Assessment
5.1. Aim
This section presents an overall assessment of sources of contamination, their likely
impacts, and patterns in levels of contamination observed in water and shellfish
samples taken in the area under various programmes, summarised from supporting
information in the previous sections and the Appendices. Its main purpose is to
inform the sampling plan for the microbiological monitoring and classification of the
bivalve mollusc beds in this geographical area.
5.2. Shellfisheries
There are two shellfish resources in the survey area which require a sampling plan.
The first is a large and long established Pacific oyster trestle farm which requires
continuing year round classification in its entirety. The second is a large, naturally
occurring mussel bed in the same privately owned area where the oyster farm is
located. In 2013, this mussel bed supported an estimated biomass of 3,503 tonnes
of mussels, of which a relatively high proportion were of a marketable size. It has
been exploited in the past, from September to April when meat yields were most
favourable, although there is no formal closed season within the district. It was
declassified in 2010 when the sole harvester ceased activity, largely due to a decline
in the quality/condition of the mussels. There has been no formal interest expressed
in re-opening the fishery. Natural England would decide on quotas, minimum sizes
and other management measures should the fishery re-open. A precautionary
approach is taken to management (e.g. small quotas relative to stock size) due to
the sensitive nature of the area.
There are additional patches of mussels within the survey area, but these are not of
the same quality nor do they hold the quantities found on the main mussel bed.
Also, many are close to seagrass beds where harvesting is prohibited under a
Northumberland IFCA byelaw. As such, a sampling plan is only required for the
main mussel bed. Classification zone boundaries should exclude any seagrass
areas to avoid implying that harvesting would be possible in those sensitive areas.
185.3. Pollution Sources
Freshwater Inputs
The catchment area draining into the shellfishery around Holy Island is
approximately 132 km², the vast majority of which lies on the mainland, with the
remainder on Holy Island itself. Arable land dominates the catchment with smaller
areas of pasture and woodland and very few built up areas. It is low lying, with
elevations mainly below 100 m, so watercourses draining the area are of a relatively
low gradient. The hydrogeology of the catchment is described as of moderate
permeability throughout. The discharge from watercourses will therefore respond to
rainfall events, at which times there will be a greater amount of faecal indicator
bacteria washed off the land and into watercourses. However, their responses will
be damped to some extent by the discharge and recharge of groundwaters.
Watercourse discharge rates are likely to be higher on average in winter due to
reduced evaporation and transpiration and a higher water table, although this will not
necessarily result in higher average fluxes of faecal indicator bacteria. There are no
gauging stations within the survey area so the day-to-day and seasonal variability in
discharge rates could not be examined in detail.
The mainland is drained by a series of streams and minor rivers, and there is only
one small freshwater outfall from Holy Island. Most land runoff entering the survey
area will therefore originate from mainland watercourses. The North Low and the
South Low are the two largest watercourses draining the mainland, and whilst they
have separate outfalls they are connected via a channel which conveys some of the
flow from the North Low to the South Low. This artificial channel is no longer
maintained so most of the water in the North Low drains from its outfall at Goswick.
This outfall drains to the beach some distance north of the causeway so is unlikely to
impact on the survey area. The South Low outfall drains to a channel which passes
under the causeway and into the northern end of the survey area. Shoreline survey
observations indicate that the majority of runoff from these watercourses drains to
the shore via the South Low. Its bacterial loading, measured under the causeway
bridge, was 2.1x10¹¹ E. coli cfu/day. The two other main streams in the area are the
Beal Cast and the Fenham Burn. The former could not be accessed during the
shoreline survey so no estimate of its discharge or bacterial loading could be made.
Beal Cast meets with the South Low on the intertidal area to the north-west of the
fishery area. The bacterial loading carried by the Fenham Burn was 1.0x10¹¹ E. coli
cfu/day at the time of shoreline survey. It follows a drainage channel across the
Fenham Flats and towards the fishery. The two other flowing freshwater inputs
encountered were both minor in terms of discharge volume and bacterial loading so
are considered to be of negligible impact on the fishery. One was just to the south of
the Fenham Burn (7.3x10⁶ E. coli cfu/day) and the other was at Holy Island harbour
(2.9x10⁸ E. coli cfu/day).
19It is therefore concluded that the main freshwater inputs originate from the mainland,
and they are relatively minor. Those likely to impact on the fishery (South Low, Beal
Cast and Fenham Burn) follow drainage channels across the Fenham Flats and into
the subtidal channel which lies to the west of the fishery.
Human Population
Total resident population within census areas contained within or partially within the
catchment area is just under 2,300. The largest settlement in the area is the village
of Scremerston in the north of the catchment, but there are a few other scattered
villages and small settlements including one by the south shore of Holy island. The
area is a popular tourist attraction, and it has been estimated that there are about
500,000 visits to Holy Island and the surrounding coastal region per year. There is
also a large holiday park at Haggerston. During holiday periods the sewage output
of tourist destinations such as Holy Island Village and the caravan park will therefore
increase significantly.
Sewage Discharges
Details of all permitted sewage discharges within the survey catchment were taken
from the March 2014 update of the Environment Agency national permit database.
There are six continuous water company sewage works within the survey area. Four
of these discharge to the Lows, one to the Fenham Burn, and one to the North Sea.
The four draining to the Lows (Bowsden, Lowick, Shoresdean and Haggerston
Castle Caravan Park STWs) generate an estimated combined bacterial loading of
around 6x10¹² faecal coliforms/day. They are therefore likely to make a significant
contribution to the bacterial loading delivered by these watercourses. The population
served by the caravan park sewage works will be highly seasonal, peaking during
the summer months. The works discharging to the Fenham Burn (Fenwick STW) is
small and generates an estimated loading of about 9x10 10 faecal coliforms/day, but
will nevertheless make a consistent contribution to faecal indicator organisms
delivered by this watercourse. The Holy Island STW generates an estimated
bacterial loading of 3x10¹¹ faecal coliforms/day, and discharges to the North Sea off
the east coast of Holy Island, around the low water mark. While this is not a
particularly large works it may have some impact on the fishery, although the extent
of this will depend on tidal circulation patterns.
There are nine water company owned intermittent overflow discharges within the
survey area. Six of these discharge to the Lows, one discharges to Fenham Burn,
one discharges via the main Holy Island sewage outfall, and one discharges to the
shore at Holy Island Harbour. No spill records were available for any of these so it is
difficult to assess their significance, apart from noting their location and potential to
spill untreated sewage. As none of the sewage catchments within which they are
located are particularly extensive their potential spill volumes are limited.
20Although a high proportion of properties within the survey area are served by water
company sewerage infrastructure, there are also 47 permitted private discharges, of
which seven discharge to soakaway and 40 discharge to watercourses. Where
specified, these are generally treated by small treatment works such as package
plants, and the majority of these are small, serving one or two properties. All are
located on the mainland. Those discharging to soakaway should be of no impact
assuming they are functioning correctly. Most discharging to watercourses are to the
Lows, but the Fenham Burn and Beal Cast also receive effluent from private
discharges. The largest of these by a considerable margin is the Haggerston Castle
Caravan Parks second works, where the effluent is treated via reedbed then
discharged to the Lows. It is uncertain how effective this is at bacterial removal, but
it will contribute to the bacterial loadings delivered via the South Low outfall. The
population it serves will vary significantly with season, peaking in the summer. It is
possible that there are further private discharges in the area which do not hold
permits, and so do not feature on the database from which this information was
derived.
Agriculture
Land cover within the survey catchment is a mosaic of arable and pasture land, with
the former predominating. Holy Island itself is largely pasture, with a few arable
fields and a grassy dune system along its north shore. At the time of the last
detailed census (2010) there were 13,726 sheep, 3,664 cattle, but only small
numbers of pigs and poultry recorded within the catchment. There are therefore
significant numbers of grazing animals within the catchment so some impacts from
agriculture are anticipated.
During the shoreline survey, grazing livestock were commonly encountered all
around the perimeter of the embayment. These were generally in fenced fields with
no access to the shore. However, on the mainland shore to the north of the
causeway sheep had access to the beach, and a patch of heavily grazed saltmarsh
was observed by the South Low outfall. Also, there were significant amounts of
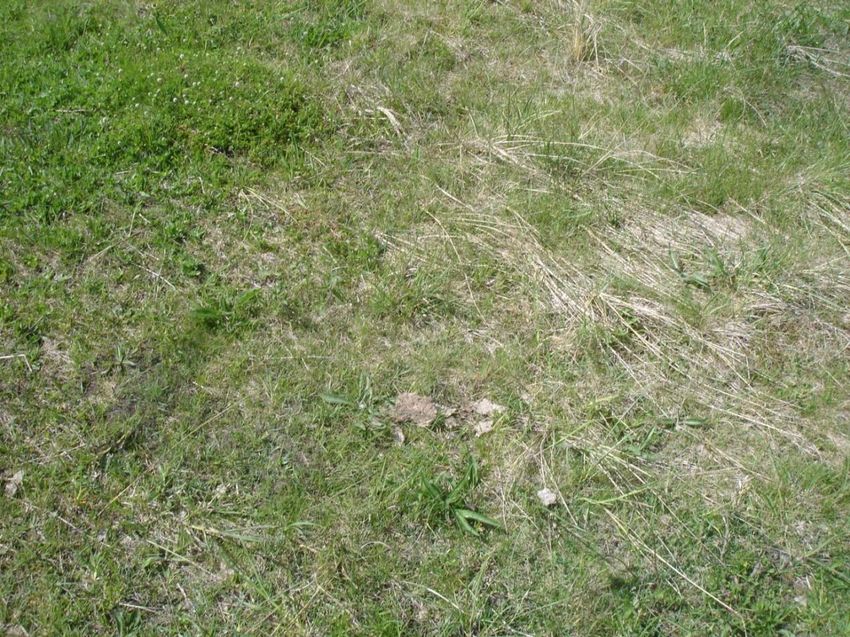
dried cattle droppings on the grassy dune system that extends from the north west
tip of Holy Island, although no cattle were observed there during the survey. Small
numbers of cattle are grazed here in early spring and autumn. They have access to
the shore in places but whether they regularly access intertidal areas is uncertain.
Livestock manures will either be deposited directly on pastures by grazing animals,
or collected from operations such as cattle sheds and spread on either arable land or
pasture. This in turn may be washed into watercourses which will carry it to coastal
waters. Watercourses which animals can access will be more vulnerable than those
that are fenced off. Given the ubiquity of farmland throughout the survey area, all
watercourses may potentially be affected at times. Where animals have access to
the shore they may deposit faeces directly on intertidal areas, which will
21subsequently be washed into coastal waters via tidal inundation on larger tides. The
saltmarsh by the South Low is likely to represent the principal area where this
occurs. It is also possible that the cattle on the Holy Island dunes deposit directly on
the intertidal in places.
The geographical pattern of agricultural impacts is likely to closely mirror that of land
runoff, with additional contributions from direct deposition on the intertidal areas on
the mainland to the north of the causeway, and possibly around the north west tip of
Holy Island. As the primary mechanism for mobilisation of faecal matter deposited
on pastures into watercourses is via land runoff, fluxes of agricultural contamination
into coastal waters will be highly rainfall dependent. Peak concentrations of faecal
indicator bacteria in watercourses are likely to arise when heavy rain follows a
significant dry period (the ‘first flush’). In contrast, impacts from animals on the
intertidal will be greatest as tide size increases towards, and during, spring tides.
There is likely to be seasonality in levels of contamination originating from livestock.
Numbers of sheep and cattle will increase significantly in the spring, with the birth of
lambs and calves, and decrease in the autumn when animals are sent to market.
Livestock are likely to access unfenced watercourses to drink and cool off more
frequently during the warmer months. In winter cattle may be transferred from
pastures to indoor sheds, and at these times slurry will be collected and stored for
later application to fields. Other manures may also be spread on pastures and
arable lands at various time of the year. The southern part of the mainland
catchment and the island itself are within a nitrate vulnerable zone so spreading is
subject to a closed period from September/October to the end of December or
January, depending on soil and biosolid types. The area drained by the North and
South Lows however largely falls outside this zone so organic fertilizers may be
applied here at any time of the year.
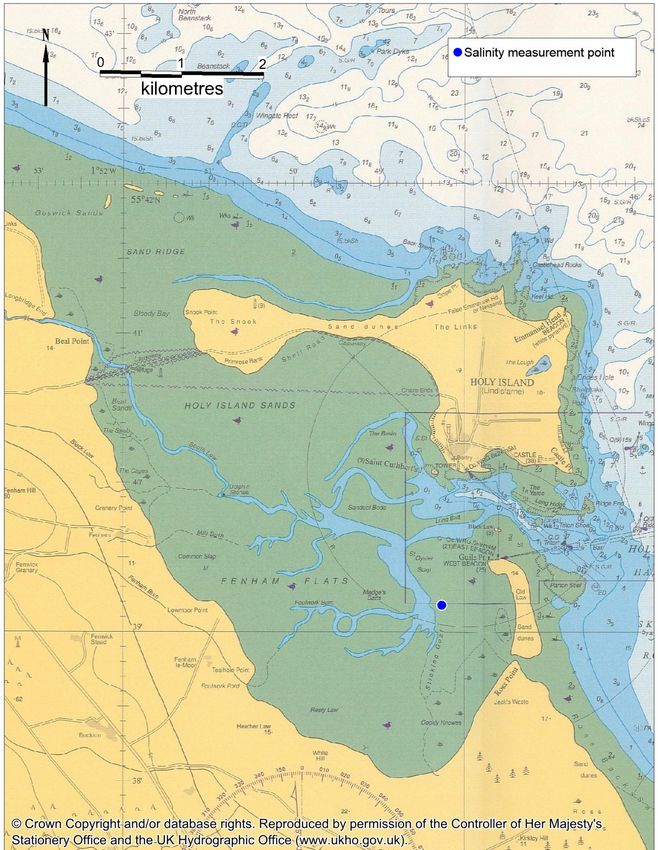
Boats
The discharge of sewage from boats is a potential source of bacterial contamination
to the survey area. Boat traffic in the area is centred around Holy Island Harbour,
and is limited to a fleet of six under 10 m fishing boats and small numbers of
recreational craft such as yachts, sailing dinghies and kayaks. The latter, smaller,
vessels are unlikely to make overboard discharges so will not be considered further.
Given the shallow and largely intertidal nature of the survey area, the larger vessels
(yachts and fishing vessels) will be limited to the Holy Island Harbour area, and the
navigation route out into the North Sea. Vessels within the harbour area are
prohibited from making overboard discharges, although it is uncertain how strictly
this is adhered to. It is therefore concluded that the risk of significant impacts from
boat discharges is low, and limited to the navigation route out into the North Sea,
and possibly around the harbour area. It is difficult to be more specific about the
potential impacts from boats and how they may affect the sampling plan without any
22firm information about the locations, timings and volumes of such discharges. Peak
pleasure craft activity is anticipated during the summer, so any associated impacts
are likely to follow this seasonal pattern.
Wildlife
The survey area encompasses a variety of habitats including mud and sand flats,
sand dunes, salt marsh and eel grass beds. These and other coastal features
support significant populations of birds and other wildlife. Large numbers of
waterbirds (wildfowl and waders) use the area for overwintering, with average peak
counts over the five winters up until 2012/2013 of 45,843 birds. Some are grazers
(e.g. ducks and geese) and these will forage on saltmarsh, coastal pastures, and eel
grass beds. Their faeces may therefore be directly deposited on the lower or upper
intertidal areas, or be carried into coastal waters via runoff from grasslands. RMPs
within or near to the drainage channels from freshwater inputs and saltmarsh areas
will be best located to capture contamination from this source. Wading species feed
upon invertebrates and so will forage (and defecate) directly on any shellfish beds on
the intertidal. As such, they are a direct input in the immediate vicinity of the mussel
beds and oyster trestle sites and are likely to contribute to E. coli counts found in
shellfish. However, as a diffuse input no particular RMP location can be identified to
best capture their impacts. The benthic mussel beds may be at more risk from direct
deposition upon them than the oysters, which are held on raised trestles.
In addition to overwintering and wildfowl flocks, seabirds such as gulls and terns are
present within the area all year round. There is a small gull/tern colony on Holy
Island where 472 pairs were recorded during a survey in 2000. There is a much
larger seabird breeding colony on the Farne Islands, about 10 km to the south east
where 166,510 (individual) birds were recorded during the survey in 2000. Seabirds
are likely to forage widely throughout the area so inputs could be considered as
diffuse, but are likely to be most concentrated in the immediate vicinity of the nest
sites. Their faeces will be carried into coastal waters via runoff from their nesting
sites or via direct deposition to the adjacent intertidal. Some of these species (e.g.
terns) migrate away from the area outside of the breeding season, and it is likely that
resident species disperse somewhat at these times. As the nesting colonies are not
in the immediate vicinity of the fishery, their presence will have no influence on the
sampling plan.
Up to 3,000 grey seals were counted hauled out in the vicinity of Holy Island
between April and September 2008. This is not a breeding site, so it is likely that
use of the area decreases during the breeding season (August to December)
although they will still frequent the vicinity given that there is a large breeding colony
at the Farne Islands. There is also a much smaller colony of common seals (around
12 individuals) that frequent the Holy Island area. The oyster harvester indicated
that several hundred seals are often observed hauled out on sandbanks just to the
23north of the trestle site. They may be a significant source of contamination to the
fishery, and a monitoring point at its northern end would best capture their impacts.
Domestic animals
Dog walking takes place on paths adjacent to the shoreline of the survey area and
could represent a potential source of diffuse contamination to the near shore zone.
The intensity of dog walking is likely to be higher closer to the more heavily used
paths, such as those around Holy Island. As a diffuse source, this will have little
influence on the location of RMPs.
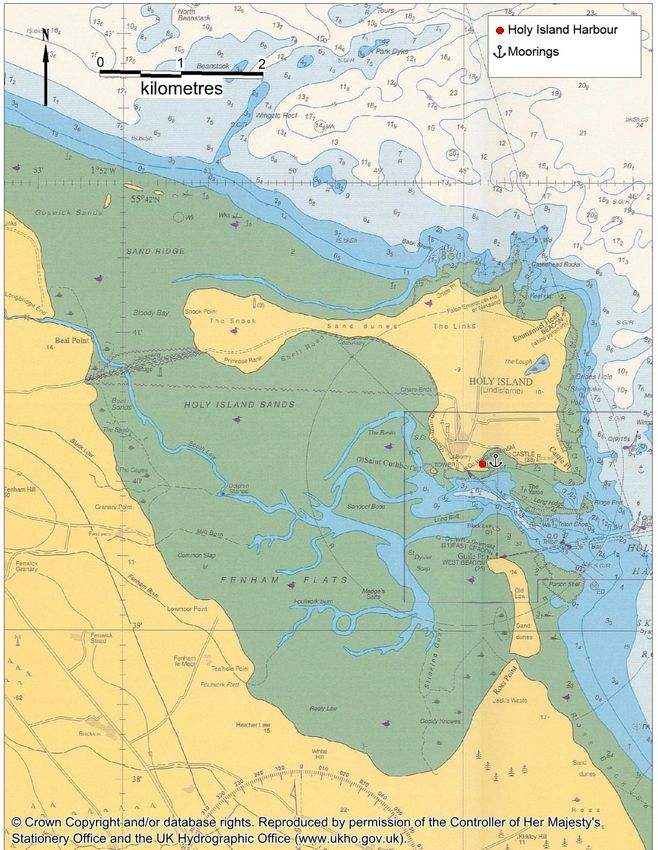
Summary of Pollution Sources
An overview of sources of pollution likely to affect the levels of microbiological
contamination to the shellfish beds is shown in Table 5.1 and Figure 5.1.
Table 5.1: Qualitative assessment of seasonality of important sources of contamination.
Pollution source Jan Feb Mar Apr May Jun Jul Aug Sep Oct Nov Dec
Agricultural runoff
Urban runoff
Continuous sewage discharges
Intermittent sewage discharges ? ? ? ? ? ? ? ? ? ? ? ?
Birds
Seals
Boats
Red - high risk; orange - moderate risk; yellow - lower risk; white – little or no risk
24Figure 5.1: Summary of main contaminating influences
255.4. Hydrography
The survey area is a large, semi-enclosed shallow embayment of the North Sea that
lies between Holy Island and the mainland. It is largely intertidal, with some subtidal
channels. The substrate is generally sandy, with muddier areas on the upper parts
of the Fenham Flats and some rocky and shingly areas around Holy Island. There
are areas of saltmarsh inside of Ross Point and around the mainland end of the
causeway. Its shallow nature will result in a high proportion of water being
exchanged each tide, but the dilution potential will be limited.
The embayment connects to the North Sea in two places. The main connection is
the subtidal channel between the southern tip of Holy Island and the Old Law dunes.
This is where the deepest point is located. The second connection is over the
causeway between the island and the mainland, which is intertidal. The elevation
increases slightly to the north of the causeway peaking about 500 m further north at
around 3-4 m above chart datum. Incoming tides are likely to meet here, and a
connection will only be formed around high water. It is therefore concluded that the
vast majority of tidal exchange is via the main connection.
Within the embayment there is a network of channels that drain to the main
connection to the North Sea. Those draining the southern part of the Fenham Flats
feed into the southern end of the subtidal channel that lies just to the west of the
trestles (Madge’s Batts). The drainage channels carrying the Beal Cast and the
South Low split around a sandbank. The southern channel converges with Madge’s
Batts at the northern end of the oyster farm, whereas the northern channel passes to
the north of the sandbank then converges with the main entrance channel. At lower
states of the tide there may be elevated levels of faecal indicator organisms within
these drainage channels, deriving from land runoff and saltmarsh washings. The
dilution potential will increase within these channels as they widen and deepen
towards the main North Sea connection.
Water circulation patterns within the area are primarily driven by tides. The tidal
range at Holy Island is 4.2 m on spring tides, and 2.2 m on neap tides. Tidal streams
off the Northumberland coast flood in a southerly direction and ebb in a northerly
direction. This indicates that effluent from the Holy Island sewage works may be
carried in through the main entrance on the flood tide, although the plume will
probably tend to remain to the north of the fishery, initially at least.
There are no tidal diamonds within the survey area, nor were any observational or
modelling studies describing tidal circulation patterns found during the literature
search. As such, the patterns described below are solely based on an appraisal of
the bathymetry of the area. The tide will flood in through the main entrance and
progress up the channels. As these channels fill, the rising water levels will fill the
26creeks and spread over the extensive intertidal areas. Current velocities are likely to
be fastest in the subtidal channels, and decrease over the intertidal areas. Water
arriving from the main entrance will cross the causeway then meet water arriving
from the north, somewhere north of the causeway, an hour or two before high water.
As such there will be very little exchange of water through the northern entrance.
Contamination delivered via the South Low and Beal Cast may have some impacts
at the northern end of the fishery but may largely pass them by to the north.
Contamination delivered by the Fenham Burn will arrive in the channel to the west of
the fishery then travel northwards alongside the fishery towards the end of the ebb
tide.
Circulation in coastal waters may be modified by density effects arising from
freshwater inputs. The freshwater inputs to the survey area are minor, so such
effects are likely to be negligible. The low freshwater influence in the area is
confirmed by a series of salinity measurements made at the fishery, where the
average was 33.8 ppt and no salinities of less than 31 ppt were recorded. Slight
decreases in salinity may however be associated with increased levels of faecal
indicator bacteria in the water column, deriving from land runoff.
Strong winds can modify circulation by driving surface currents, which will in turn
create return currents which may travel lower in the water column or along sheltered
margins. South westerly winds will tend to push surface water from the Fenham Flats
towards the fishery for example. Exact effects are dependent on the wind speed and
direction as well as state of the tide and other environmental variables so a great
number of scenarios may arise. Where strong winds blow across a sufficient
distance of water they may create wave action. Where these waves break,
contamination held in intertidal sediments may be re-suspended. Although the
surrounding land offers protection, some wave action is likely to occur during strong
winds from any direction as the embayment is large. Onshore swells from the north
sea may penetrate the main entrance to the embayment and break over the
sandbanks just to the north of the fishery area.
5.5. Summary of Existing Microbiological Data
The survey area has a limited microbiological monitoring history, deriving from the
shellfish waters monitoring programme, and hygiene classification monitoring.
Figure 5.2 shows the locations of the monitoring points referred to in this
assessment. Results of samples taken from 2004 onwards are considered in these
analyses.
27Figure 5.2: Microbiological sampling locations
Shellfish Waters monitoring
There is one shellfish water monitoring point, where water samples have been taken
on a quarterly basis and enumerated for faecal coliforms. Faecal coliform
concentrations here were low, with a geometric mean of 2.9 cfu/100 ml and only one
result exceeding 50 cfu/100 ml. The one result which did exceed 50 cfu/100 ml was
1,182 cfu/100 ml, so was excluded from the statistical analyses to avoid biasing
them. The circumstances under which this sample was collected were examined
individually instead.
There do not appear to have been any overall increases or decreases in results
since 2004. A statistically significant seasonal pattern was apparent, with higher
results on average during the winter compared to other seasons. A statistically
significant influence of the high/low tidal cycle was found, with the higher results
occurring around low water when dilution potential was lowest. A significant
influence of the spring/neap tidal cycle was also found, but no strong patterns were
apparent when the data was plotted. No relationship was found between faecal
coliform levels and rainfall or salinity.
The high result arose in a sample taken in July 2012, towards the end of a prolonged
period of wet weather. The salinity at the time was the lowest recorded (31 ppt). It
was taken about half way through the ebb tide, rather than around low water when
28other elevated results were recorded. It is therefore concluded that the high result is likely to be a consequence of summer storms resulting in increased fluxes of contamination from agricultural land, possibly augmented by spills from overloaded sewer networks. Shellfish Hygiene classification monitoring There are three RMPs in the Holy Island production area that have been sampled between 2004 and 2014. Two of these RMPs are for mussels and one for Pacific oysters. One of the mussel RMPs (Ross Links) was only sampled on one occasion and so will not be considered further. The remaining mussel and Pacific oyster RMPs are both in the same location. The Pacific oyster RMP (Ross & Outchester) was sampled on a more or less monthly basis from 2004 to present. The geometric mean result was 139 E. coli MPN/100 g, the maximum was 7,000 E. coli MPN/100 g and only 1.6% of results exceeded 4,600 E. coli MPN/100 g. The mussel RMP (Beal) was sampled monthly from 2004 until August 2010. The geometric mean result was 64.7 E. coli MPN/100 g, with a maximum result of 4,600 E. coli MPN/100 g. Throughout the period considered, Pacific oyster results appear to have declined slightly on average between 2004 and 2008, whereas mussel results were stable. Seasonal variation was statistically significant for Pacific oysters, with significantly higher E. coli results in summer and autumn than spring and winter. At the mussel RMP, results were lower on average during the spring, and similar throughout the other three seasons. However, seasonal variation was much less marked than observed for Pacific oysters, and was not statistically significant. As these RMPs are in the same location, this is presumably down to differences in the level to which the two species accumulate E. coli under different conditions (e.g. in relation to temperature). No influence of the spring/neap of high/low tidal cycles was found for either of the RMPs. Whilst some statistically significant associations were found between E. coli levels and antecedent rainfall at both RMPs, its influence was minor and delayed. Bacteriological survey An additional eight samples (four of each species) were collected by Northumberland County Council on the 20th January 2015. Little spatial variation was apparent, with results ranging from
Appendices

             30
Appendix I. Human Population
Figure I.1 shows population densities in census output areas within or partially within
the Holy Island catchment area, derived from data collected from the 2011 census.
Figure I.1: Human population density in census areas in the Holy Island catchment.
Source: Office for National Statistics
Total resident population within census areas contained within or partially within the
catchment area was approximately 6,300 at the time of the last census. However,
these census areas do not align with the catchment boundary and in some cases
extend into more populated areas such as the outskirts of Berwick. The
Environment Agency (pers comm.) estimates the population to be 2,295.
There are an estimated 500,000 visitors to Holy Island and the surrounding coastal
region per year (Hamilton-Baillie Associates Ltd 2012). There is also a large caravan
park at Haggerston. During the peak summer holiday season, the sewage output of
tourist destinations such as Holy Island Village and the caravan park will increase
significantly.
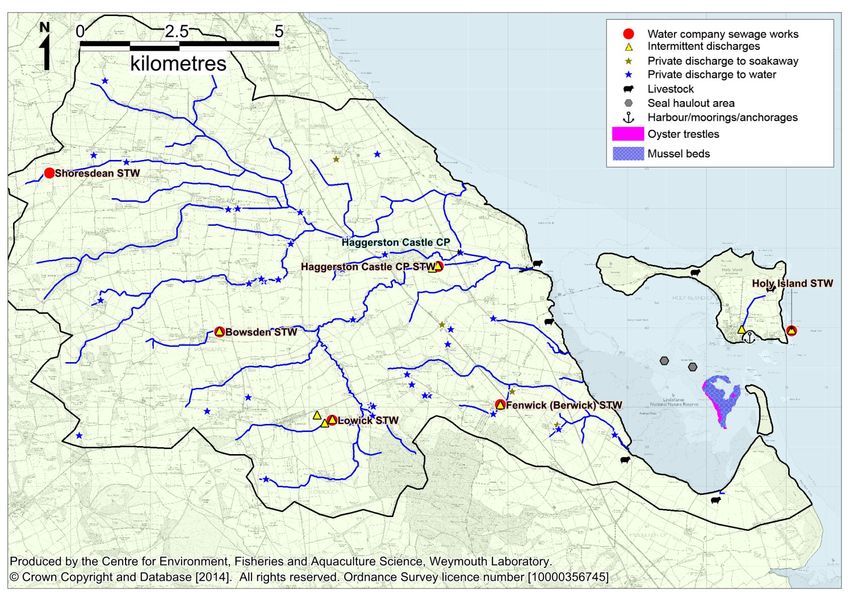
31Appendix II. Sources and Variation of
Microbiological Pollution: Sewage
Discharges
Details of all consented sewage discharges within the survey catchment were taken
from the Environment Agency national permit database (March 2014). These are
mapped in Figure II.1.
Figure II.1: Permitted sewage discharges to the Holy Island catchment
Contains Environment Agency information © Environment Agency and database right
There are six continuous water company sewage works discharging within the
survey area, details of which are presented in Table II.1.
Table II.1: Details of continuous water company sewage works within the survey area
Estimated
DWF bacterial Receiving
Name NGR Treatment 3
(m /day) loading environment
(cfu/day)*
Activated
10
Bowsden STW NT9974041910 Sludge 20.8** 6.9x10 Bowsden
Biological
10
Fenwick (Berwick) STW NU0680040080 Filtration 27 8.9x10 Fenham Burn
11
Haggerston Castle NU0524043560 Biological 250 8.3x10 South Low
32Estimated
DWF bacterial Receiving
Name NGR Treatment 3
(m /day) loading environment
(cfu/day)*
Caravan Park STW Filtration
Biological
11
Holy Island STW NU1413041940 Filtration 102 3.3x10 North Sea
Biological
11
Lowick STW NU0257239688 Filtration 149 4.9x10 Low trib.
12
4.2x10 Allerdean Mill
Shoresdean STW NT9546045910 Septic Tank 42 (max) (max) Burn trib.
Contains Environment Agency information © Environment Agency and database right
*Faecal coliforms (cfu/day) based on geometric base flow averages from a range of UK STWs
providing secondary treatment (Table II.2)
**Estimated from population served
Table II.2: Summary of reference faecal coliform levels (cfu/100 ml) for different sewage
treatment levels under different flow conditions.
Flow
Treatment Level Base-flow High-flow
n Geometric mean n Geometric mean
6
Storm overflow (53) - - 200 7.2x10
7 6
Primary (12) 127 1.0x10 14 4.6x10
5 5
Secondary (67) 864 3.3x10 184 5.0x10
2 2
Tertiary (UV) (8) 108 2.8x10 6 3.6x10
Data from Kay et al. (2008b).
n - number of samples.
Figures in brackets indicate the number of STWs sampled.
The only water company sewage works discharging directly to coastal waters is the
Holy Island STW. This is a relatively small secondary works which discharges to the
east shore of the island around the low water mark. Its’ spatial pattern of impacts will
depend on water circulation patterns in the area. Fenham Burn receives the effluent
from one small treatment works (Fenwick STW). There are four sewage works
(Lowick, Bowsden, Shoresdean and Haggerston Castle Caravan Park STWs)
discharging to the complex of streams and drains that discharge to the shore via the
North Low and South Low outfalls, just to the north of the causeway. These will
contribute to the faecal indicator loading delivered to coastal waters via these two
outfalls. The population served by the caravan park sewage works will be highly
seasonal, peaking during the summer holidays.
In addition to the continuous sewage discharges, there are several intermittent water
company discharges associated with the sewerage networks also shown on Figure
II.1. Details of these are shown in Table II.3.
33Table II.3: Intermittent discharges to the survey area
No. Name Grid reference Receiving water
1 Bowsden STW CSO NT9973041910 Bowsden Burn
2 Fenwick STW CSO NU0680040060 Fenham Burn
3 Haggerston Castle Caravan Park STW NU0524043560 South Low
4 Haggerston Castle Caravan Park STW NU0509043500 South Low
5 Haggerston Castle CSO NU0523043560 South Low
6 Holy Island STW PS & CSO NU1413041940 North Sea
7 Inlet & Outlet SPS NU1288041960 North Sea
8 Kyloe View SSO NU0238039600 Low trib.
9 Lowick STW NU0219039800 Low trib.
10 Lowick STW CSO no. 1 NU0257239688 Low trib.
11 Lowick STW CSO no. 2 NU0257239688 Low trib.
Contains Environment Agency information © Environment Agency and database right
The geographical distribution of these intermittent outfalls is almost identical to that
of the water company sewage works discharges discussed above. Additionally, and
of possible significance, there is an intermittent outfall to the south shore of Holy
Island (Inlet and Outlet SPS). Spill records were not available for any of these
discharges at the time of writing. It is therefore difficult to assess their significance
apart from noting their locations and their potential to spill storm sewage.
Although a high proportion of properties within the survey area are served by water
company sewerage infrastructure, there are also a number of private discharges.
Where specified, these are generally treated by small treatment works such as
package plants, and the majority of these are small, serving one or two properties.
All permitted private sewage discharges are mapped in Figure II.1, and Table II.4
presents details of those consented to discharge more than 5 m 3/day.
343
Table II.4: Details of private sewage discharges to the catchment >5m /day
Max. daily
Treatment Receiving
Ref. Property served Location flow
type 3 environment
(m /day)
A Barmoor Castle Country Park NT9942139911 Package Plant 61 Dry Burn trib.
B Cottages (7) NU0822939562 Package Plant 5 Soakaway
C East Allerdean Farm Steading NT9739046180 Package Plant 10 Allerdeanmill Burn
D Haggerston Castle Caravan Park NU0580043900 Reedbed 500 North Low
E New Haggerston NU0282043480 Septic Tank 5 Engine Low
F Plough Hotel NU0555041970 Package Plant 14.5 Beal Cast
Steading Development Fenham Le
G
Moor NU0968039320 Package plant 5 Foulwork Burn
Contains Environment Agency information © Environment Agency and database right
The largest of these by a considerable margin is the Haggerston Castle Caravan
Parks second (private) works, where the effluent is treated via reedbed. It is
uncertain how effective this is at bacterial removal, but it will make some contribution
to the bacterial loadings delivered by the North and/or South Lows. The population
served by this treatment works will be highly seasonal, peaking during the summer
holidays. Most other private discharges are also to this drainage network, but there
are also a number to the Fenham Burn and tributaries. There is also one small
private discharge to the Beal Cast, but none on Holy Island. Those discharging to
soakaway should be of no influence to coastal waters, assuming they are functioning
correctly. It is possible that there are further private discharges in the area which do
not hold permits, and so do not feature on the database from which this information
was derived.
35You can also read