Anthropogenic and catchment characteristic signatures in the water quality of Swiss rivers: a quantitative assessment
←
→
Page content transcription
If your browser does not render page correctly, please read the page content below
Hydrol. Earth Syst. Sci., 23, 1885–1904, 2019
https://doi.org/10.5194/hess-23-1885-2019
© Author(s) 2019. This work is distributed under
the Creative Commons Attribution 4.0 License.

Anthropogenic and catchment characteristic signatures in the
water quality of Swiss rivers: a quantitative assessment
Martina Botter, Paolo Burlando, and Simone Fatichi
Institute of Environmental Engineering, ETH Zurich, Switzerland,
Stefano Franscini-Platz 5, 8093 Zurich, Switzerland

Correspondence: Martina Botter (botter@ifu.baug.ethz.ch)

Received: 3 May 2018 – Discussion started: 17 May 2018
Revised: 1 March 2019 – Accepted: 18 March 2019 – Published: 8 April 2019

Abstract. The hydrological and biogeochemical response of          1   Introduction
rivers carries information about solute sources, pathways,
and transformations in the catchment. We investigate long-         Hydrological and biogeochemical responses of catchments
term water quality data of 11 Swiss catchments with the ob-        are essential for understanding the dynamics and fate of so-
jective to discern the influence of major catchment character-     lutes within the catchment, as material transported with wa-
istics and anthropic activities on delivery of solutes in stream   ter carries information about water sources, residence time,
water. Magnitude, trends, and seasonality of water quality         and biogeochemical transformations (Abbott et al., 2016). A
samplings of different solutes are evaluated and compared          quantitative description of water quality trends can also shed
across catchments. Subsequently, the empirical dependence          light on the consequences of anthropogenic changes in the
between concentration and discharge is used to classify the        catchment as well as on the possibilities for preventive or
solute behaviors.                                                  remedial actions (Turner and Rabalais, 1991). Concerning
   While the anthropogenic impacts are clearly detectable in       changes in watershed land use or management practices, for
the concentration of certain solutes (i.e., Na+ , Cl− , NO3 ,      example, the United States Geological Survey (USGS) estab-
DRP), the influence of single catchment characteristics such       lished the Hydrologic Benchmark Network (HBN) (Leopold,
as geology (e.g., on Ca2+ and H4 SiO4 ), topography (e.g., on      1962), a long-term monitoring system of dissolved concen-
DOC, TOC, and TP), and size (e.g., on DOC and TOC) is              trations in 59 differently impacted sites across the United
only sometimes visible, which is also because of the limited       States with the goal of quantifying the human influence on
sample size and the spatial heterogeneity within catchments.       the ecosystems (Beisecker and Leifeste, 1975). Water qual-
Solute variability in time is generally smaller than discharge     ity monitoring and assessment are also crucial for stream and
variability and the most significant trends in time are due        catchment restoration, which has been widely practiced in
to temporal variations of anthropogenic rather than natural        the USA and Europe for several decades and still represents
forcing. The majority of solutes show dilution with increas-       an important challenge of river basin management. However,
ing discharge, especially geogenic species, while sediment-        the system responses to restoration often contradict a priori
bonded solutes (e.g., total phosphorous and organic carbon         expectations, and the lack of adequate monitoring and assess-
species) show higher concentrations with increasing dis-           ment of basin functioning before the application of restora-
charge. Both natural and anthropogenic factors affect the bio-     tion measures is considered to be one of the main reasons for
geochemical response of streams, and, while the majority of        this discrepancy (Hamilton, 2011).
solutes show identifiable behaviors in individual catchments,         The relationship between observed in-stream solute con-
only a minority of behaviors can be generalized across the         centrations and discharge has been explored in various
11 catchments that exhibit different natural, climatic, and an-    catchments and with different methods in the last decades
thropogenic features.                                              (Langbein and Dawdy, 1964; Johnson et al., 1969; Hall,
                                                                   1970, 1971; White and Blum, 1995; Evans and Davies,
                                                                   1998; Calmels et al., 2011). One emerging postulate is that

Published by Copernicus Publications on behalf of the European Geosciences Union.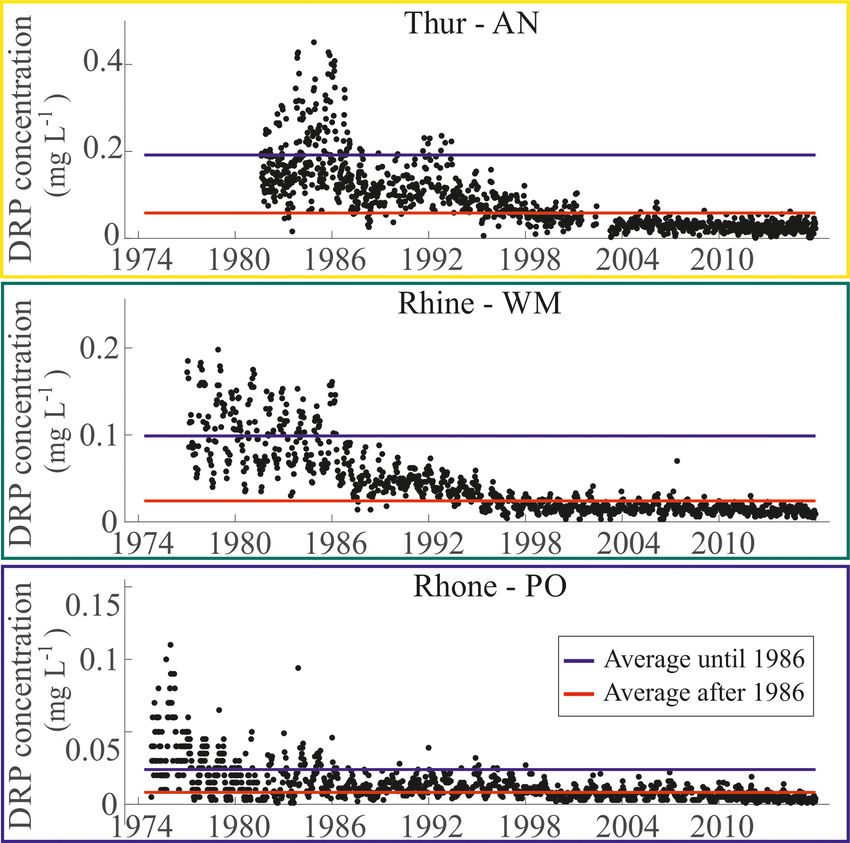
1886        M. Botter et al.: Anthropogenic and catchment characteristic signatures in the water quality of Swiss rivers

concentration–discharge (C–Q) relations represent the quan-         centrations in streams, leading to the emergence of biogeo-
titative expression of the interaction between catchment geo-       chemical stationarity (Basu et al., 2011). However, biogeo-
morphology, land use, hydrological processes, and the solute        chemical stationarity has been questioned outside of agricul-
releases, thus reflecting in lumped form the complex mix-           turally impacted catchments (Thompson et al., 2011), and a
ing process taking place along flow paths of variable lengths       unifying theory explaining catchment-specific C–Q behavior
and residence time (Chorover et al., 2017). Therefore, C–           is not available yet, considering that solutes can show differ-
Q relations have been studied with reference to hydrological        ent behaviors in relation to landscape heterogeneity (Hern-
variables, e.g., hydrologic connectivity and residence time         don et al., 2015) and to the spatial and temporal scales of
(Herndon et al., 2015; Baronas et al., 2017; Duncan et al.,         measurement (Gwenzi et al., 2017). Therefore, approaching
2017a; Gwenzi et al., 2017; Torres et al., 2017); biologi-          the study of solute export and C–Q relations requires the
cal processes (Duncan et al., 2017a); catchment character-          separate analysis of several solutes in as many catchments as
istics, e.g., catchment topography, land use, catchment size,       possible with the aim of finding, at least, some general behav-
and lithological properties (Musolff et al., 2015; Baronas et       ior that can be characteristic of a given region or solute. The
al., 2017; Diamond and Cohen, 2017; Hunsaker and John-              recent literature is moving toward this direction (Herndon et
son, 2017; Moatar et al., 2017; Wymore et al., 2017); and an-       al., 2015; Wymore et al., 2017) with the aim of sorting out
thropic activities (Basu et al., 2010; Thompson et al., 2011;       the relative influence of climatic forcing, solute properties,
Musolff et al., 2015; Baronas et al., 2017).                        and catchment characteristics on solute behavior in search
   In a log(C)–log(Q) space, C–Q relations have been ob-            for generalizations across different catchments.
served to be usually linear (Godsey et al., 2009), so that the         This study contributes to this line of research investigating
empirical relations can be well approximated by a power law,        a unique dataset of long-term water quality data in 11 catch-
C = a · Qb , where a and b are fitting parameters (Godsey           ments in Switzerland, where multiple solutes were observed
et al., 2009; Basu et al., 2010; Thompson et al., 2011; Mo-         at the biweekly (every 2 weeks) scale for multiple decades
quet et al., 2015; Moatar et al., 2017; Musolff et al., 2017).      with limited gaps. We perform the analysis focusing mainly
A very common metric, relevant also for this study, is based        on the temporal domain and by quantifying magnitude, tem-
on the value of the b exponent, the slope of the regression         poral trends, and seasonality of the in-stream concentrations
in the log(C)–log(Q) plot, because it is related to the con-        with the goal of highlighting the long-term behavior differ-
cept of “chemostasis” (Godsey et al., 2009) or “biogeochem-         ences across the 11 catchments and investigating the drivers
ical stationarity” (Basu et al., 2010). A catchment shows           of such differences. Specifically, we focus on the follow-
“chemostatic” behavior when, despite a sensible variation           ing research objectives: (i) investigating to which extent the
in discharge, solute concentrations show a negligible vari-         solute concentrations are influenced by anthropic activities;
ability, i.e., b ∼
                 = 0. Conversely, positive slopes (i.e., increas-   (ii) exploring the dependence of solute concentrations on
ing concentrations with increasing discharge) would support         catchment characteristics; and (iii) generalizing, if possible,
an enrichment behavior when the solute amount grows with            the behaviors of selected solutes across different catchments
discharge, and negative slopes (i.e., decreasing concentra-         by means of the slope in the C–Q relations.
tions with increasing discharge) support a dilution behav-
ior with solute mass that does not increase proportionally
to the growing discharge. A solute is typically defined as          2   Study sites
transport-limited if it is characterized by enrichment, while
it is called source-limited in cases where it dilutes (Duncan       Observations used in this study are obtained from the Swiss
et al., 2017a).                                                     National River Monitoring and Survey Program (NADUF,
   The exact mechanisms leading to C–Q relations are, to a          2019), which represents the Swiss long-term surface water
large extent, an open question, but these relations are provid-     quality monitoring program. This database includes in to-
ing insights on solute and/or catchment behavior (Godsey et         tal 26 monitoring stations located in different catchments. To
al., 2009; Moatar et al., 2017). The concept of chemostasis         ensure representativity and robustness of the analysis we fo-
emerged in studies that explored the C–Q power law with             cus only on those stations with at least 10 consecutive years
the aim of demonstrating the similarities in the export be-         of water quality measurements. This restricts the database
havior of nutrients (Basu et al., 2010, 2011) and geogenic          to 11 catchments, the corresponding locations of which are
solutes (Godsey et al., 2009) across a range of catchments          shown in Fig. 1. The resulting case studies include five main
(Musolff et al., 2015). These studies were mostly carried           catchments (Thur, AN; Aare, BR; Rhine, WM; Rhone, PO;
out in agricultural catchments, where a “legacy storage” was        and Inn, SA), three sub-catchments (Rhone, PO; Rhine, RE;
supposed to exist due to antecedent intensive fertilization         and Rhine, DI), and two small headwater catchments (Erlen-
practices (Basu et al., 2010, 2011; Hamilton, 2011; Sharp-          bach, ER; and Lümpenenbach, LU).
ley et al., 2013; Van Meter and Basu, 2015; Van Meter et al.,          Measurements have a temporal resolution of 14 days,
2016a, b). This storage of nutrients might have long-memory         which is similar to the resolution of other studies that ana-
effects, and it was considered to buffer the variability in con-    lyzed long-term water quality data. In the literature, the tem-

Hydrol. Earth Syst. Sci., 23, 1885–1904, 2019                                     www.hydrol-earth-syst-sci.net/23/1885/2019/
M. Botter et al.: Anthropogenic and catchment characteristic signatures in the water quality of Swiss rivers                        1887

Figure 1. Map of NADUF monitoring stations and description of the study area. The upper panel represents the studied catchments. (a) Swiss
Plateau (blue) and the Alpine catchments (yellow); (b) the catchments spanning both regions, hybrid catchments (light blue). The bottom
panel describes the study sites in terms of (c) macro-geological classes, (d) land cover, and (e) anthropic pressure.

poral resolution of water quality observations ranges namely           erage concentrations collected in a 2-week interval. Con-
from weekly (Duncan et al., 2017a, b; Gwenzi et al., 2017;             versely, the dataset is especially suitable for the investiga-
Moatar et al., 2017; Wymore et al., 2017) to 14-day (Hun-              tion of long-term trends, due to the length of the time series,
saker and Johnson, 2017) to monthly (Basu et al., 2010;                which spans from 11 to 42 years (Table 1). Data are collected
Thompson et al., 2011; Musolff et al., 2015; Mora et al.,              following ISO/EN conform methods for water analysis and
2016; Moatar et al., 2017) or even coarser resolution (God-            are subsequently validated by means of an extensive qual-
sey et al., 2009). In fact, only very rarely higher-frequency          ity control as described in Zobrist et al. (2018). In addition,
databases are collected and thus analyzed (e.g., Neal et al.,          we inspected the data to take into account possible errors de-
2012, 2013; von Freyberg et al., 2017).                                riving from fixed detection limits, e.g., deleting the values
   Stream water is analyzed only twice per month but is col-           below the detection thresholds (see Sect. S1 in the Supple-
lected continuously, thus providing samples that represent a           ment).
flow-proportional integral of the preceding 14 days. River                The concentrations reported in the database concern the
water is lifted continuously by a submersible pump into a              following solute types: (i) geogenic solutes, originating
closed overflow container (25 L) in the station, at a flow rate        mainly form rock weathering, such as calcium (Ca2+ ), mag-
of 25–75 L min−1 . From the container, samples are trans-              nesium (Mg2+ ), sodium (Na+ ), silicic acid (H4 SiO4 ), and
ferred in 1 mL portions to sampling bottles. The frequency             potassium (K+ ); (ii) deposition-derived solutes, such as chlo-
for the transfer of 1 mL samples is proportional to the dis-           ride (Cl− ); (iii) nitrogen species (nitrate, NO3 ; and total
charge monitored continuously by the gauging device in the             nitrogen, TN); (iv) phosphorus species (dissolved reactive
same station. The discharge-proportional sampling device is            phosphorus, DRP; and total phosphorus, TP); and (v) organic
designed to collect 1–3 L of sample per bottle in each period.         carbon species (dissolved organic carbon, DOC; and total or-
The sampling mechanism also allows the simultaneous col-               ganic carbon, TOC). The time series of these concentrations
lection of up to four integrated samples.                              are used in the analyses carried out in this study. Further-
   A 14-day sampling frequency is not sufficient for an evalu-         more, the dataset includes also the average discharge, com-
ation of short-term biogeochemical and transport processes,            puted as the mean value over the period between two wa-
which might involve solute transformation (e.g., biological            ter quality analyses, as well as other parameters such as wa-
processes, in-stream chemical reactions). These are simply             ter temperature, hardness (Ca2+ + Mg2+ ), alkalinity (H+ ),
accounted for in a lumped form in the flow-proportional av-            and pH.

www.hydrol-earth-syst-sci.net/23/1885/2019/                                          Hydrol. Earth Syst. Sci., 23, 1885–1904, 2019
M. Botter et al.: Anthropogenic and catchment characteristic signatures in the water quality of Swiss rivers
www.hydrol-earth-syst-sci.net/23/1885/2019/
Table 1. Description of the catchments. The selected catchments are characterized by different size, elevation, and average yearly precipitation. Four catchments are entirely Alpine
(ER, PO, DI, SA), while the others encompass different morphologies (Swiss Plateau and pre-Alpine areas). The data are sourced by the catchment descriptions included in the NADUF
database.
Catchment Catchment Area Average Mean Mean Lake Morphology Agriculture Inhabitants Period of Number of
ID (km2 ) elevation annual annual area Swiss Alps Other Int. Ext. density available consecutive
(m a.s.l.) precipitation discharge (%) Plateau (%) (%) (%) (%) (inhab km−2 ) data years
(mm yr−1 ) (mm yr−1 ) (%)
Thur – Andelfingen AN 1696 770 1429 880 0.1 50 23 20 51.9 10.6 222.9 1981–2015 35
Aare – Brugg BR 11 726 1010 1352 847 3.6 38 23 30 35.8 17.7 181.1 1974–2015 42
Rhine – Village-Neuf/Weil WM 36 472 1100 1353 914 3.6 30 43 11 31.5 20.6 207.5 1977–2015 39
Rhine – Rekingen RE 14 718 1260 1262 947 3.9 27 60 – 30.1 24.9 188.1 1975–2015 41
Aare – Hagneck HA 5104 1370 1506 1106 2.1 25 52 23 23.9 29.2 147.3 1977–1982 13
1988–1990
1994–1996
2003–2015
Rhone – Chancy CH 10 323 1580 1335 1042 5.8 – 77 10 14.4 23.9 167.9 1977–1982 30
Hydrol. Earth Syst. Sci., 23, 1885–1904, 2019
1986–2015
Lümpenenbach LU 0.94 1300 2127 1879 0 – 100 – 21.3 55.8 0 2005–2015 11
Rhine – Diepoldsau DI 6119 1800 1319 1196 0.4 – 100 – 8 46.9 54.9 1976–2015 40
Rhone – Porte du Scex PO 5244 2130 1372 1101 0.4 – 100 – 6.1 31.7 58.5 1974–2015 42
Inn – S-chanf SA 618 2466 1063 1036 1.6 – 100 – 3.3 43 27.5 1998–2015 18
Erlenbach ER 0.76 1300 2182 1660 0 – 100 – 2.9 52.5 0 2005–2015 11
1888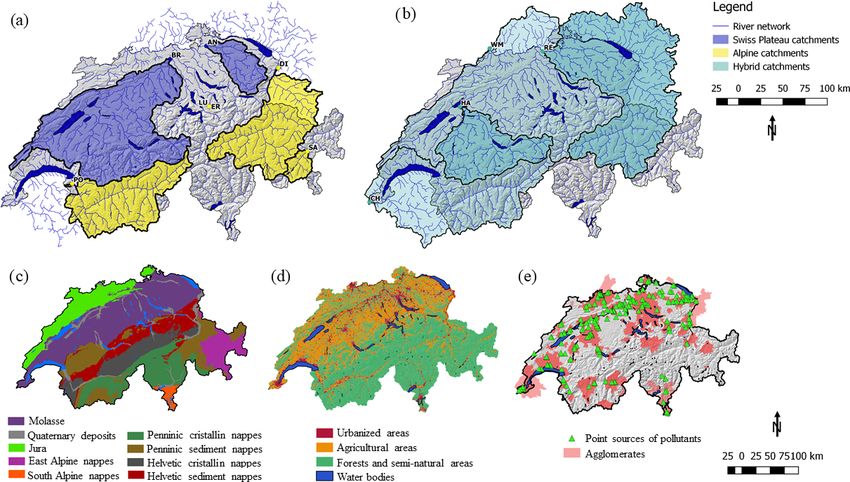
M. Botter et al.: Anthropogenic and catchment characteristic signatures in the water quality of Swiss rivers 1889
The selected catchments cover most of the Swiss territory. maximum values). These are computed for each solute in
This is characterized by dissimilarities in terms of morphol- each catchment, with the goal of highlighting differences
ogy, land use, and anthropic pressure, with the latter being across catchments, which are the result of catchment hetero-
intended as activities (e.g., fertilization of agricultural lands, geneities and natural and anthropogenic factors affecting the
domestic and industrial waste water treatments, industrial quantity of a given solute.
sewage disposal into water), which are expected to have an The seasonality of discharge and of solute concentra-
impact on the river biogeochemistry and to alter the natu- tions is analyzed and cross-compared to highlight differ-
ral background concentrations and their seasonality. Figure 1 ences and similarities of controls that are related to the cli-
shows the catchments analyzed in this study as identified by matic seasonality and seasonality of man-induced impacts.
the ID reported in Table 1. Catchments are divided into three For this analysis, catchments are subdivided into the three
categories depending on the morphological zone where they above-mentioned categories: Swiss Plateau, Alpine, and hy-
are mainly located: the Swiss Plateau, a lowland region in the brid catchments (Fig. 1). The Swiss Plateau and Alpine
north, the mountainous Alpine area in the center and south, catchments have substantially different hydrological regimes
and a third category that includes catchments spanning both (Fig. S1 in the Supplement, upper and bottom panels) and
morphologic zones. The choice of this classification crite- represent the main classes of the clusterization proposed by
rion is discussed in the Sect. 3.1. Geology also differs from Weingartner and Aschwanden (1992). Some of the selected
one region to another (Fig. 1c). The bedrock of northern catchments with large draining area include both typologies
Switzerland, the Jura region, is mainly composed of calcare- and are therefore defined as “hybrid catchments”. They are
ous rocks, while in the Alpine area crystalline silicic rocks characterized by a seasonality, which is intermediate between
are dominant (Fig. 1c). The Swiss Plateau region is instead the two end-members (Fig. S1, central panel) because the
characterized by the “molasse” sedimentary rocks (Fig. 1c), timing of the peak is similar to the one of Alpine catch-
consisting in conglomerates and sandstones of variable com- ments, but the magnitude is less pronounced as in the Swiss
position (e.g., detrital quartz, feldspars, calcite, dolomite, Plateau catchments. For this reason, they have to be treated
and gypsum) (Kilchmann et al., 2004). The relative chemi- separately from the other two classes. The hybrid catchments
cal weathering of carbonate rock and of gypsum are respec- have the highest percentage of lake surface area in their do-
tively 12 and 40 times higher than the weathering rate of mains (Table 1), although non-negligible lake fractions are
granite or gneiss (Meybeck, 1987), thus suggesting that it is also found in the two other categories. Large lakes repre-
a good proxy to consider the Swiss Plateau area as charac- sent a discontinuity in the river network, reducing the frac-
terized mainly by a calcareous bedrock (e.g., Zobrist et al., tion of catchment area directly (without major water mixing
2018). As the maps in Fig. 1d and 1e show, the prevalent effects) contributing to the observed discharge and solute dy-
land use in the Swiss Plateau area is agriculture, while the namics. The presence of large lakes contributes to the damp-
Alpine area is mainly covered by forests and grasslands. Ta- ening of the hydro-chemical signal, but its exact quantifica-
ble 1 specifies if the share of agricultural land is cultivated tion is not straightforward. Aware of the confounding role
either intensively, i.e., with significant fertilizer applications, of large lakes, we apply this classification in order to test if
or extensively, e.g., Alpine grasslands, bush land, and parks, the seasonality of solutes is related to the seasonality of dis-
which are mostly unfertilized (Zobrist et al., 2018). The main charge. With such an analysis we aim at isolating the effect
urban centers are concentrated in northern Switzerland, to- of the discharge seasonality versus the seasonality of solute
gether with most of the industrial activities, which represent concentrations. More specifically, whenever a solute shows
potential point sources of pollution. The agricultural activi- a seasonality different from the one imposed by climate, we
ties, especially intensive agriculture, residential, and indus- investigate the potential reasons for such a difference, with
trial areas are referred to in this study as “anthropic pres- it being either related to specific catchment characteristics or
sure”, indicating that the sources of solutes originated from to anthropic activities.
these activities are other than natural. Given the much higher The comparison between the seasonality of solute and dis-
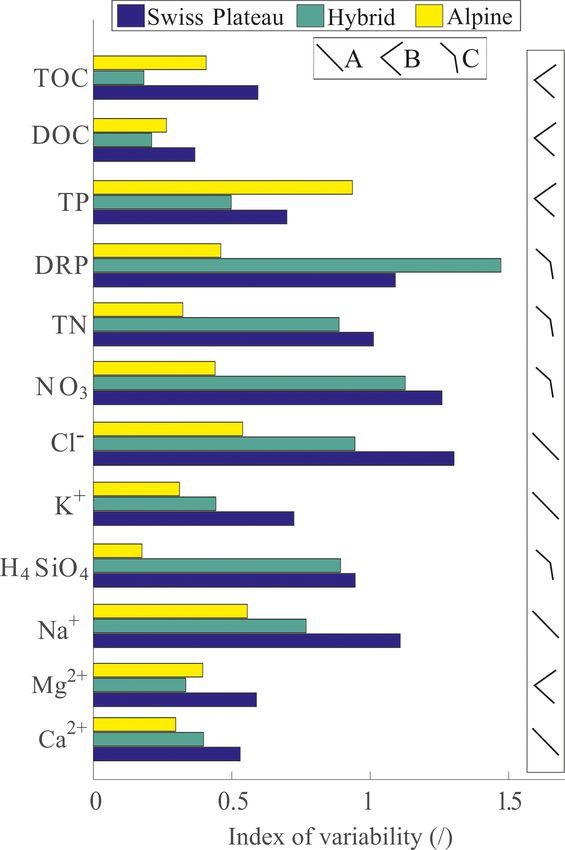
presence of these anthropogenic factors in northern Switzer- charge is made through an index of variability defined as the
land, the anthropic pressure follows a south–north gradient, ratio between the mean monthly deviations from the mean
although patches of anthropic pressure are found also within of solute concentration and discharge respectively, where the
the Alpine valleys. deviation is determined as the average difference between the
monthly means and the annual average value, resulting in the
following equation:
3 Methods
3.1 Magnitude, seasonality, and trends
The magnitude of a solute is evaluated through basic statis-
tics (i.e., median, 25th and 75th percentiles, minimum and
www.hydrol-earth-syst-sci.net/23/1885/2019/ Hydrol. Earth Syst. Sci., 23, 1885–1904, 2019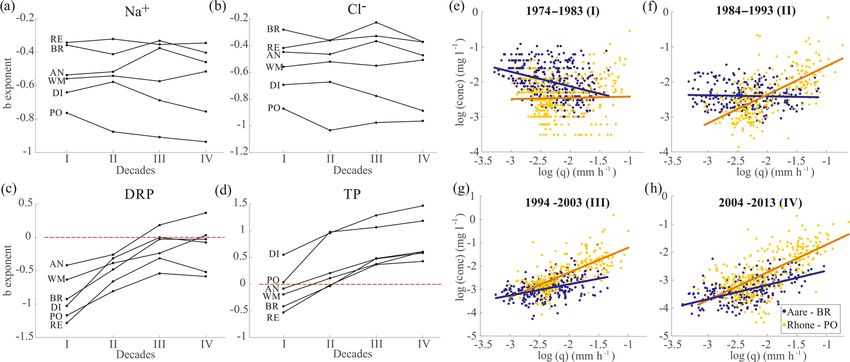
1890              M. Botter et al.: Anthropogenic and catchment characteristic signatures in the water quality of Swiss rivers

                                                                                               zero, thus suggesting no evidence of a dependence of con-
Index of variability =                                                                         centration on discharge.
                                                                        12
                                                                        P
                                                                                                  In each catchment, the time series of discharge were di-
                                                                           Ci
                                                                       i=1
                                                                                −1
                                                                                               vided into two subsets using the median daily discharge q50
                                                                          C
                                                                   P                           to separate flow below the median (low flows) and flows
                                                                   n
                                                                        12
                                                                        P
                                                                           Qi                  above the median (high flows). Hourly discharge time series
                                                                       i=1
P     Normalized mean of monthly deviations of concentration              Q
                                                                                −1             were available from the Swiss Federal Office for the Envi-
       Normalized mean of monthly deviations of discharge
n                                                                                              ronment (FOEN) at the same river sections and for the same
                                                               =                     ,   (1)
                              n                                          n
                                                                                               period of the time series of water quality provided by the
where i represents the month of the year, from 1 to 12, and                                    NADUF monitoring program. The median daily discharge
n is the number of the catchments belonging to the specific                                    was computed from the hourly series, which were aggregated
catchment class for which the index of variability is com-                                     to obtain daily resolution.
puted. In other words, an index of variability larger than 1                                      Determining the C–Q relations separately for high and
suggests that the seasonality of the solute is more pronounced                                 low flows allows a finer classification of the solute behavior
than that of discharge, and vice versa for an index of variabil-                               into different categories (Moatar et al., 2017) than consider-
ity smaller than 1.                                                                            ing only the dependence on the entire range of discharge. The
   Finally, we evaluated the occurrence of trends in the long-                                 three main behaviors – enrichment or removal (i.e., positive
term concentration time series at monthly and annual scale                                     slope), chemostatic (i.e., near-zero slope), and dilution (i.e.,
using the monthly average concentration of each solute in                                      negative slope) – can indeed be the result of mechanisms con-
each catchment and each year for the entire period. The                                        trolling the runoff formation and the transport mechanism.
statistical significance of trends was tested with the Mann–                                   Accordingly, we have in total nine different combinations
Kendall test modified to account for the effect of autocorre-                                  characterizing the C–Q relation across high- and low-flow
lation (Hamed and Rao, 1998; Kendall, 1975; Mann, 1945),                                       regimes, which allow assigning distinct behaviors to a given
fixing a significance level of 0.05. Trends are investigated                                   solute.
and compared across catchments in order to understand if                                          For solutes that showed long-term trends over the moni-
they are consistent across Switzerland, thus suggesting the                                    toring period, we also investigated the evolution of the b ex-
presence of clear drivers underlying the trend, or if they are                                 ponent in time. In this case, the concentration and discharge
just occurring in a subset of catchments. The time series span                                 time series were divided into decades and the C–Q relations
different periods of time, so the results might be impacted by                                 over all discharge values were computed separately for each
the natural variability in discharge over the different years.                                 decade. The behavioral classification is performed on a sin-
This might be a potential issue, but we observed that in cases                                 gle b (i.e., not divided into low- and high-flow b), since, dif-
with a trend in discharge present (e.g., in the CH catchment,                                  ferently from the previous analysis of C–Q relations, the fo-
not shown) the patterns of concentrations do not show any                                      cus is on the detection of long-term trends in solute behavior
different behavior compared to those observed in other catch-                                  rather than on the understanding of the processes leading to
ments, which our analysis attributes to external forcing (e.g.,                                differences between high and low flows.
anthropic activities).

3.2      Concentration–discharge relations                                                     4     Results

The empirical relation between solute concentration and dis-                                   4.1    Magnitude
charge C = a · Qb was explored separately for each solute
and for each catchment with the objective of investigating so-                                 Among the geogenic solutes, Ca2+ is the most abundant,
lute behaviors across catchments and whether this behavior                                     most likely due to the composition of the bedrock present
can be generalized. The two variables are expected to exhibit                                  in most of the catchments (calcite, dolomite, and anhy-
a linear relation in a log–log scale, expressed by means of                                    drite/gypsum; Rodríguez-Murillo et al., 2014). In absolute
the two regression parameters a, the intercept with the same                                   terms, geogenic solutes and Cl− have the highest concentra-
dimensions of the concentration, and b, the dimensionless                                      tions (≈ 10–50 mg L−1 ), while phosphorus species concen-
exponent representing the slope of the interpolating line. We                                  trations (≈ 0.01–0.1 mg L−1 ) are on average 1 to 2 orders
focus our attention on the latter, which determines the behav-                                 of magnitude less abundant than nitrogen species (≈ 0.5–
ior of the solute. The Student’s t test was applied to verify the                              1.5 mg L−1 ) and organic carbon (≈ 1.5–5 mg L−1 ).
statistical significance of having a b exponent different from                                    Some solutes are constituents of other species, like in the
zero. The level of significance α was set at 0.05. When the                                    case of nutrients NO3 of TN and DRP of TP. NO3 is often
p value was lower than α, the slope identifying the log-linear                                 introduced in catchments as an inorganic fertilizer, such as
C–Q relation was considered significant and quantified by b,                                   DRP, which represents a readily available nutrient for crops.
otherwise the slope was considered indistinguishable from                                      We computed the ratio between the solute and its component

Hydrol. Earth Syst. Sci., 23, 1885–1904, 2019                                                                  www.hydrol-earth-syst-sci.net/23/1885/2019/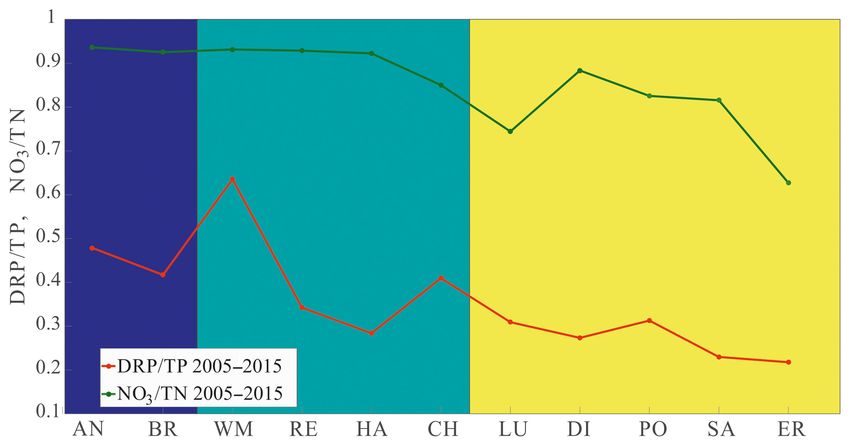
M. Botter et al.: Anthropogenic and catchment characteristic signatures in the water quality of Swiss rivers                       1891

                                                                         We consider the spreading of deicing salt an anthropic ac-
                                                                         tivity related to the presence of inhabitants in a catchment.
                                                                         DOC and TOC concentrations are very high in the Lüm-
                                                                         penenbach (LU) and Erlenbach (ER) catchments (Fig. 3c),
                                                                         which are the smallest catchments with the highest average
                                                                         yearly precipitation rate and very low anthropic presence.
                                                                         The Thur (AN) and Aare (BR) catchments also show DOC
                                                                         and TOC concentrations higher than the average, but in these
                                                                         catchments the presence of wastewater treatment plants can
                                                                         influence TOC concentrations. Finally, nutrients, such as ni-
                                                                         trogen species and phosphorus species, which are connected
Figure 2. Ratios of DRP/TP (red) and NO3 /TN (green) across              with anthropic activities (fertilization, wastewater treatment
catchments computed on the period 2005–2015. Both patterns show          plants), show a relatively clear decreasing median concentra-
a decreasing trend from more to less anthropogenically affected          tions from the most to the least impacted catchment (Fig. 3d).
catchments (left to right of x axes). This pattern is more evident for   Indeed, regressing median solute concentration with the per-
phosphorus. Background colors refer to the catchment classification      centage of intensive agricultural land and the inhabitant den-
explained in Sect. 3.1.                                                  sity (Table S1a in the Supplement) gives a statistically signif-
                                                                         icant dependence for some nutrients (i.e., NO3 , TN, DRP).
                                                                         Because the catchments that are mostly impacted by agri-
for the two couples (NO3 /TN, DRP/TP) and observed their                 cultural activities are mainly located in the Swiss Plateau,
pattern across the catchments (Fig. 2). We take as reference             a significant positive correlation between nutrients and the
values the ratios in the ER catchment, since, due to limited             percentage of the Swiss Plateau area of the catchment exists;
anthropogenic pressure, it represents the background concen-             conversely, we observe a significant negative correlation with
trations of nutrients (Zobrist, 2010). Variations compared to            the percentage of the Alpine area. One should note, however,
ER values might provide an indication of the ratio of nutri-             that the correlation is performed on 11 catchments only, so
ents coming from anthropic activities. NO3 is the major con-             that a lack of significance should be interpreted with care. In-
stituent of TN, since it is about 85 % of TN, while DRP con-             deed, if we extend the correlation analysis to the b exponent
tributes much less to TP, being only 35 % of TP. Both have a             derived from the C–Q relations analysis – thus implicitly
decreasing pattern with decreasing catchment anthropogenic               accounting for the complex interactions between catchment
disturbances, although in DRP/TP this pattern is more evi-               geomorphology, land use, hydrological processes, and so-
dent. DRP/TP spans from a maximum of 65 % in WM to a                     lute releases – with the same catchment characteristics (e.g.,
minimum of 22 % in ER, while NO3 /TN has a maximum of                    Moatar et al., 2017) the correlation becomes weaker and, ba-
93 % in AN and it is 63 % in ER.                                         sically, not significant for any solute (Table S1b and c).
   Effects of catchment characteristics and human activities
on the observed stream solute concentrations can be seen for             4.2   Seasonality
certain solutes as shown by Fig. 3, where each box shows
the measured concentrations in the 11 catchments and the                 Different climates and catchment topographies determine
last box on the right refers to all the catchments grouped               various hydrological responses, as we can observe in
together. The catchments, expressed by the corresponding                 Fig. S1 from the analysis of discharge seasonality across
acronym (see Table 1), are ordered, from left to right, from             the 11 catchments, expressed through the monthly average
the most impacted by human activity – i.e., higher percentage            streamflow normalized by its long-term average. We present
of catchment area used for intensive agriculture – to the least          the results with the catchments divided into three groups as
impacted, which is almost equivalent to considering a south-             previously explained. The partition into these classes helps
to-north gradient. The most evident effect of catchment char-            in highlighting the effects of topography, climatic gradient,
acteristics refers to the presence of Ca2+ and H4 SiO4 in the            and somehow also the impact of anthropic activities since it
stream water (Fig. 3a). Despite the lower solubility of sili-            follows a similar south to north gradient. The seasonality of
cic rocks compared to the calcareous rocks, H4 SiO4 con-                 streamflow in Swiss Plateau catchments is determined by a
centrations in the southern Alpine catchments of Inn (SA),               combination of precipitation and snowmelt. The peak flow
Rhine (DI), and Rhone (PO) are significantly higher than                 is typically observed in spring and is not much higher than
the median value across catchments. The impact of human                  the average in the other months. Alpine catchments, instead,
activities, instead, is more evident in Na+ and Cl− con-                 show stronger seasonality induced by snowmelt and ice melt
centrations. These are showing, basically, the same pattern              in spring and summer, which generates higher streamflows
across catchments (Fig. 3b), indicating that they are most               than in the other months. Hybrid catchments exhibit flow
likely influenced by the same driver, which is the spreading             peaks in June–August similarly to the Alpine ones, but the
of salt on roads during winter months for deicing purposes.              deviation from the average value is less pronounced.

www.hydrol-earth-syst-sci.net/23/1885/2019/                                           Hydrol. Earth Syst. Sci., 23, 1885–1904, 2019
1892 M. Botter et al.: Anthropogenic and catchment characteristic signatures in the water quality of Swiss rivers Figure 3. Box plot of measured concentrations across catchments. The grey box on the right of each subplot refers to the concentrations computed from all the observations of all the catchments. The black horizontal dashed line represents the median of all the measurements across all the catchments. (a) shows the effect of bedrock geological composition on Ca2+ and H4 SiO4 concentrations. (b) shows the pattern of Na+ and Cl− concentrations across catchments. (c) shows the DOC and TOC concentrations. (d) shows the decreasing trend of the nutrients’ median concentrations. The catchments are ordered by increasing percentage of land used for intensive agriculture, as shown in the bottom table, and the background colors refer to the catchment classes: Swiss Plateau (blue), hybrid (light blue), and Alpine (yellow) catchments. The deviations of discharge and concentration are com- Sect. 5.2. The type C pattern, instead, refers to solutes related pared using the index of variability (Sect. 3.1) for each mor- to fertilization (NO3 , TN, and DRP) and to H4 SiO4 , which is phological class of catchments (Fig. 4). Only few solutes a product of weathering and only minimally involved in bio- show a value of the index higher than 1. This indicates that logical processes. These solutes are characterized by a much seasonality of solute concentrations is generally lower or lower variability index in Alpine catchments than in hybrid much lower than the seasonality of streamflow. This is es- and Swiss Plateau catchments. Differences in their regime pecially true for the Alpine catchments, where the marked are further discussed in Sect. 4. seasonality of streamflow seems to dominate the variability The analyzed solutes show different intra-annual dynam- in concentrations. For TP the index of variability is higher ics. For instance, despite the quite pronounced streamflow than 1 in Alpine catchments and also the highest compared seasonality of the Rhine river at Rekingen (hybrid catch- to the other two typologies. In Swiss Plateau and hybrid ment used as a representative example), solute concentra- catchments, instead, only solutes impacted by human activity tion patterns show different seasonal cycles (Fig. S2). Ca2+ , (Na+ , Cl− , nitrogen species, and DRP) show a ratio close or Mg2+ , Na+ , K+ , Cl− , NO3 , and TN concentrations peak in even higher than 1. February–March and have lower values during the spring– DOC and TOC concentrations are characterized by low in- summer period, showing a pattern opposite to that of stream- dexes of variability, especially in the hybrid catchments. The flow. H4 SiO4 , instead, has a shifted seasonality compared to patterns of the index of variability across different morpholo- the other solutes, peaking in December–January. Phosphorus gies can be classified into three categories, represented by the species together with organic carbon species do not show any symbols A–C in Fig. 4. The monotonic line in type A refers consistent seasonality over the year. to those solutes, the variability index of which changes across morphologies solely as a result of the seasonality of stream- 4.3 Trends flow (Ca2+ , Na2+ , K+ , and Cl− ). The type B solute (Mg2+ , TP, DOC, and TOC) response shows a lower variability in- Long-term trends in the concentration time series are inves- dex in hybrid catchments compared to the other catchments tigated with respect to the seasonal cycle for each year sepa- and suggests that, among the factors controlling the seasonal- rately (Fig. S2). One catchment (Rhine – Rekingen) is taken ity of the biogeochemical response, there are factors that are as an example for illustration purposes, but the generality of specific to the Alpine environment, which are discussed in trend results is discussed in the following. Hydrol. Earth Syst. Sci., 23, 1885–1904, 2019 www.hydrol-earth-syst-sci.net/23/1885/2019/
M. Botter et al.: Anthropogenic and catchment characteristic signatures in the water quality of Swiss rivers 1893
Figure 5. Three example long-term patterns of solute concentra-
tions. (a) represents a clear increasing trend, (b) a non-monotonic
trend (firstly increasing and then decreasing), and (c) shows the ab-
Figure 4. Bar plot of the index of variability. Each bar represents the
sence of any trend. The patterns are shown for the station of Aare –
average monthly variability in concentration relative to discharge
Brugg as an example case.
variability per catchment class. The colors of the bars differenti-
ate catchment morphologies: blue for Swiss Plateau, aqua-green for
hybrid, and yellow for Alpine catchments. A–C represent the ob-
servable patterns of the index of variability across the three classes.
Type A is the result of the different seasonality of discharge dom-
inating the response. Type B refers to those solutes with an index
of variability much lower in the hybrid catchments than in the oth-
ers. Type C represents solutes with the index of variability lower in
Alpine catchments than in the other classes.
Focusing on the long-term horizon, different dynamics can
be observed across various solutes. Some of them show vis-
ible trends: for instance Cl− has increased from the 1970s
to 2015, while phosphorus species have decreased consid-
erably. Some solutes have different trends across different
catchments. A generalization of long-term patterns is shown
in Fig. 5 for the three main detected behaviors. The upper
panel represents the occurrence of an evident trend, either in-
creasing (as in the example of Cl− ) or decreasing (e.g., TP).
Na+ , Cl− , DRP, and TP belong to this category. While Na+
and Cl− have increased in time, DRP and TP have decreased
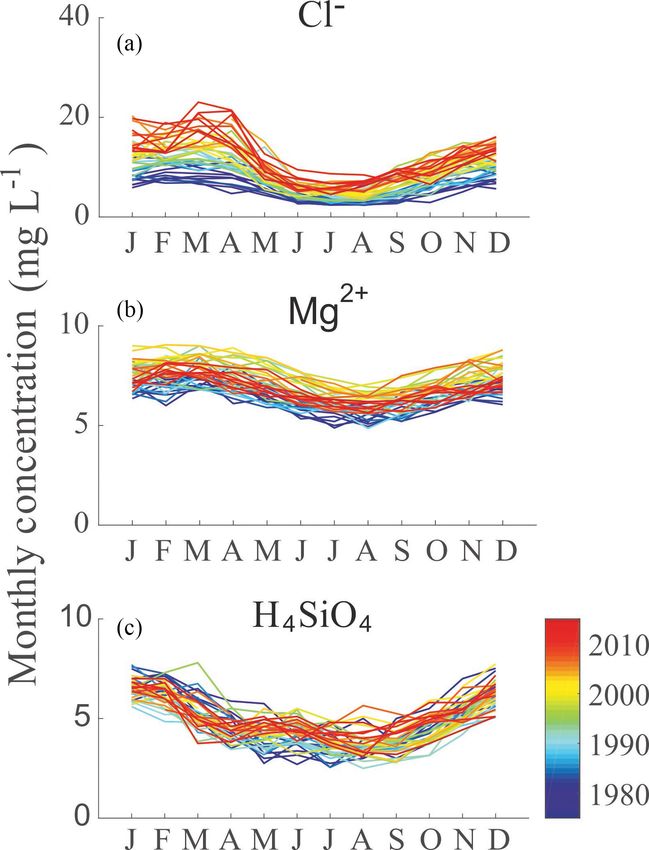
in the monitoring period, as the monthly trends in Table S1a Figure 6. Observed DRP concentrations in three catchments char-
show (see Fig. 6 for DRP only). acterized by different classes (i.e., Thur, AN; Rhine, WM; and
Rhone, PO). The blue line represents the mean until 1986, whereas
The middle panel shows a non-monotonic trend. This
the red line represents the mean after 1986 and until the end of
is typical of Mg2+ , which first increased in most catch-
the monitoring period. After the introduction of the phosphate ban
ments (1970s–1990s) and then decreased (1990s–2015). K+ , in 1986, the DRP concentrations have shown an evident decrease.
TN and TOC also show this type of trend in most catch-
ments. Finally, the lower panel of Fig. 5 shows a number of
solutes (Ca2+ , H4 SiO4 , NO3 and DOC) that do not exhibit
www.hydrol-earth-syst-sci.net/23/1885/2019/ Hydrol. Earth Syst. Sci., 23, 1885–1904, 20191894 M. Botter et al.: Anthropogenic and catchment characteristic signatures in the water quality of Swiss rivers
any long-term trend, although analysis on a monthly base re- Fig. 8a–d, whereas Fig. 8e–h show an example of the varia-
vealed some significant trends (Table S1c). tion of the TP C–Q relations across decades for the human-
impacted catchment of Aare (BR) and the Alpine catchment
4.4 C–Q relations of Rhone (PO). Although the observed concentrations of all
four solutes – Na+ , Cl− , DRP, and TP – are characterized
Concentration–discharge relations were computed for all by the presence of evident trends in time, the behaviors in
the solutes across all the catchments as summarized in Ta- the C–Q relation differ. Na+ and Cl− have a constant b ex-
ble 2. For each solute, we computed the number of catch- ponent across decades, while phosphorous species show in-
ments showing a given specific behavior, which we de- creasing b, which, in some catchments, leads to a switch from
noted with the combination of the symbols “+” (i.e., en- a behavior of dilution to one of enrichment.
richment/removal), “−” (i.e., dilution), and “=” (i.e., chemo-
static behavior) for discharge above and below the median.
Geogenic solutes are mostly characterized by dilution. The 5 Discussion
only exception is H4 SiO4 , which shows six different behav-
5.1 Influences of human activities on solute
iors across the 11 catchments, making it impossible to iden-
concentrations
tify the most representative behavior for this solute. This
is the case also of other species (nitrogen species, TP, and The cause–effect relation between the observed in-stream
organic carbon species), which show at least three differ- concentrations and the anthropic activities is sometimes ev-
ent behaviors across catchments. Silicon is mainly generated ident in the concentration magnitude, seasonality, and long-
through rock weathering, but it is also involved in biological term trends. Phosphorus and nitrogen are the main nutrients
processes, which might influence its behavior across catch- applied for agricultural fertilization, and a decreasing pattern
ments. of their magnitude from mostly intensive agricultural catch-
Overall, dilution is dominant for all solutes in both low- ments to forested catchments is observed (Fig. 3d). Indeed,
and high-flow conditions, as it occurs respectively in 65 % taking the concentrations of NO3 and DRP registered at ER
and 57 % of the catchments. Therefore, even in low-flow as reference background of natural concentrations (Zobrist,
conditions, the solute transport is mainly source-limited 2010), corresponding to 0.20 mg L−1 of NO3 , 0.38 mg L−1
across catchments. Only sediment-related solutes (i.e., TP, of TN, 0.002 mg L−1 of DRP, and 0.02 mg L−1 of TP, the
TOC) show a marked transport-limited behavior. The label concentrations in all the other catchments are significantly
“sediment-related solutes” comes from the fact that phospho- higher. For example, the most impacted AN catchment
rus and organic carbon are bonded to soil particles and, when recorded median concentrations of 2.50 mg L−1 of NO3 ,
soil is eroded, carbon- and phosphorus-rich soil particles are 3.03 mg L−1 of TN, 0.06 mg L−1 of DRP, and 0.15 mg L−1
mobilized by flowing water. In such conditions, soil erosion of TP. Following the stoichiometric composition of plants,
becomes one of the main contributors to the phosphorus and nitrogen species concentrations are 1 order of magnitude
organic carbon load into the rivers. We investigated also C– higher than phosphorus species concentrations (Fig. 3d). Ni-
Q relations for suspended sediment concentrations and they trogen is the main nutrient required for crop growth (Ad-
show increasing slope across all the catchments, indicating, discott, 2005; Bothe, 2007; Galloway et al., 2004; Zhang,
as expected, higher erosion rates in the presence of high-flow 2017), and indeed NO3 is one of the main components of
conditions. Only 29 % of the catchment–solute combinations fertilizers applied in agriculture. NO3 represents a large frac-
have different behaviors between low- and high-flow condi- tion of TN (Fig. 2). The variability in the ratio between av-
tions, and therefore the C–Q relations are represented by erage NO3 and TN concentrations across the different catch-
bent lines, having different slopes between low- and high- ments is comparable with that estimated by Zobrist and Re-
flow conditions. ichert (2006), who observed a variation from 55 % in Alpine
NO3 and DOC represent a conspicuous component of TN rivers to 90 % for rivers in the Swiss Plateau. Both the NO3 -
and TOC respectively, but NO3 shows almost the same be- to-TN ratio and the DRP-to-TP ratio show a decreasing trend
haviors of TN, in spite of a different distribution across catch- from more to less anthropic-impacted catchments, with the
ments, while DOC and TOC behave differently. Phosphorus range of variability being, however, higher for phosphorus
species also show different behaviors, which is consistent species (from about 0.6 in the Thur river to about 0.2 in the
with the fact that DRP represents only a small fraction of TP. Inn river). The DRP/TP ratios across catchments can be ex-
Since in the trend analysis we identified four species (Na+ , plained as the result of the cumulative effect of two main
−
Cl , DRP, and TP) that are characterized by remarkable factors: the lower DRP input due to less intensive agricultural
long-term trends, we investigated if such a significant change activity in the Alpine zone and the higher share of phospho-
in magnitude has an effect on the C–Q relation analyz- rus sourced by suspended sediments contributing to TP in
ing the temporal changes in the b exponent. The changes Alpine catchments due to generally higher erosion rates.
in the value of b across all catchments with record length
longer than 30 years during different decades are shown in
Hydrol. Earth Syst. Sci., 23, 1885–1904, 2019 www.hydrol-earth-syst-sci.net/23/1885/2019/M. Botter et al.: Anthropogenic and catchment characteristic signatures in the water quality of Swiss rivers 1895
Table 2. Results of the C–Q relations analysis. The symbols “+”, “−”, and “=” refer to the possible behavior combinations described in
Fig. 7, while the numbers indicate how many catchments exhibit a specific behavior for each solute. The solutes are classified as reported in
the first column.
Solute class Solute Behavior
+/+ +/ = +/− = /+ =/= = /− −/+ −/ = −/−
Geogenic Ca2+ 0 0 0 0 1 1 0 1 8
solutes Mg2+ 0 0 0 0 0 0 0 0 11
Na2+ 0 0 0 0 0 0 0 0 11
H4 SiO4 1 1 0 1 1 2 0 0 5
K2+ 0 0 0 0 0 0 0 0 11
Deposition derived Cl− 0 0 0 0 0 0 0 1 10
Nitrogen species NO3 0 0 0 0 2 0 0 2 7
TN 0 1 0 0 2 0 0 5 3
Phosphorus species DRP 0 0 0 1 2 1 0 3 4
TP 2 1 0 5 0 0 3 0 0
Organic carbon species DOC 0 3 0 1 5 0 0 0 2
TOC 6 1 0 4 0 0 0 0 0
Total (%) 6.8 5.3 0 9.1 9.8 3.0 2.3 9.1 54.5
Anthropic activities affect also the seasonality of certain Anthropic activities do not only influence the average so-
solutes. In Fig. 4, we assigned the pattern “C” to those so- lute concentrations and the seasonality, but also the long-
lutes (i.e., H4 SiO4 , NO3 , TN and DRP) characterized by a term dynamics. Na+ and Cl− show a clear positive trend in
much lower index of variability in Alpine catchments than time (Table S1a), largely because of the increasing applica-
in hybrid and Swiss Plateau catchments. For those solute tion of deicing salt (NaCl) (Gianini et al., 2012; Novotny et
concentrations, the variability in Swiss Plateau and hybrid al., 2008; Zobrist and Reichert, 2006). A clue of the cause–
catchments is comparable to or higher than streamflow vari- effect relation between deicing salt application and increased
ability, while in Alpine catchments streamflow seasonality Na+ and Cl− concentrations in stream water comes from sto-
is much stronger than solute seasonality. A non-negligible ichiometry. The molar ratio between Na+ and Cl− in salt
fraction of these solutes is introduced through agricultural is 1 : 1; therefore, the closer the ratio computed on observed
practices or by means of other human activities. Their input in-stream concentrations is to 1, the more likely it is that
is characterized by its own seasonality, which influences the the deicing salt may be the driver. Figure S4 shows the box
solute dynamics and makes it comparable to or larger than plot of the Na : Cl molar ratio across catchments, and it is
the discharge seasonality – a behavior that is not observable clear that catchments with higher population density show
for most geogenic solutes (Fig. 4). Additional evidence sup- values closer to 1. However, the Erlenbach (ER) and Lümpe-
porting this result is represented by the patterns of the av- nenbach (LU) catchments, which do not show any increas-
erage monthly discharge and solute load (computed as the ing long-term trend neither in Na+ nor in Cl− concentra-
product between concentration and discharge) normalized by tions, show Na : Cl values higher than 1, which is consis-
the respective average value. This representation is made for tent with the catchments with a low population density (i.e.,
Ca2+ , originating from rock weathering, and NO3 , mainly of Rhone, PO; Rhine, DI; and Inn, SA). In this respect, Müller
anthropic origin (Fig. S3a and b). The plot, inspired by the and Gächter (2011) analyzed the phenomenon of increasing
analysis of Hari and Zobrist (2003), shows how the seasonal- Cl− concentrations in Lake Geneva basing their analysis on
ity of Ca2+ load follows the seasonality of discharge across the NADUF data at the Rhine – Diepoldsau (DI) station.
all catchments well, while NO3 load has its own seasonality The concentrations detected by the water quality monitor-
in the catchments with the largest agriculture extent, espe- ing station are much lower than the amount of the input of
cially in the first part of the year. Indeed, in the case of NO3 , salt declared by the cantonal authorities, and the increasing
there is no correspondence between the seasonality of dis- trend characterizes the whole year and not only the winter
charge and load (e.g., the time of maximum discharge does months. These two factors suggest that an accumulation ef-
not coincide with the time of maximum or minimum load), fect with a long memory in the system might exist. The salt
thus suggesting that the input is characterized by an indepen- could be stored somewhere in the soil or in the groundwa-
dent seasonality. ter and could be progressively delivered to the streams over
www.hydrol-earth-syst-sci.net/23/1885/2019/ Hydrol. Earth Syst. Sci., 23, 1885–1904, 20191896 M. Botter et al.: Anthropogenic and catchment characteristic signatures in the water quality of Swiss rivers years. However, this is difficult to assert conclusively since tion density, especially in the magnitude of concentrations the salt input is uncertain. Indeed, estimating the input of of nutrients (i.e., nitrogen and phosphorous species); in the salt used for deicing purposes is not trivial, due to the lack increasing long-term trends of Na+ and Cl− ; and, a posi- of reliable data (Müller and Gächter, 2011). Official sources tive outcome of environmental regulations, in the decreasing (EAWAG, 2011) state that improved technologies have en- long-term trends of phosphorous species. Moreover, the sea- abled a sensible decrease in the specific amount of spread sonality of nutrients differs considerably from the seasonality salt (from 40 g m−2 in the 1960s to 10–15 g m−2 today), but of naturally originated solutes (e.g., geogenic solutes). the total amount of salt still shows an increasing trend, likely because it is spread more often and on wider surfaces. The 5.2 Influence of catchment characteristics on recent study of Zobrist et al. (2018) uses as a proxy for magnitude and trends of solute concentrations salt consumption the salt production by Swiss salt refineries and claims an increase from 360 Gg NaCl yr−1 in the 1980s A statistically robust link between catchment characteristics to 560 Gg NaCl yr−1 in the present, thus supporting the ob- and river biogeochemical signatures is not straightforward, served positive trend. because the spatial heterogeneity in river catchments and the A positive cause–effect relation between anthropic activ- limited sample size make the search for cause–effect rela- ity and solute concentration in terms of trend is also shown tions between catchment characteristics and in-stream con- for phosphorus species, which have decreased consistently centrations challenging. However, catchment characteristics since 1986 (Fig. 6), when the phosphate ban in laundry de- play a role for certain solutes, and we found evidence of tergents was introduced in Switzerland (Jakob et al., 2002; their impact especially in the magnitude and seasonality of Rodríguez-Murillo et al., 2014; Prasuhn and Sieber, 2005; solute concentrations. First, the geological composition of Zobrist and Reichert, 2006; Zobrist, 2010). the bedrock influences the weathering products, increasing A non-monotonic trend emerged from the analysis of long- Ca2+ concentrations in mostly calcareous catchments (north- term data for Mg2+ , K+ , TN, and TOC (Fig. 5). Considering ern Switzerland) and of H4 SiO4 in silicic catchments (Alpine for example Mg2+ , Zobrist (2010) focuses the trend analysis catchments in central and southern Switzerland). The catch- over the period 1975–1996 on Alpine catchments and ob- ments DI, PO, and SA, which are entirely located in the serves a similar non-monotonic increasing–decreasing pat- Alpine area (Table 1) and mainly lie on crystalline bedrock tern. Zobrist (2010) attributes this pattern to an increase in (Fig. 1c), have a higher concentration of silicic acid (Fig. 3a) water temperature, which is evident for the Rhine and Rhone along with a lower concentration of Ca2+ in comparison to rivers. For the Rhine and Rhone rivers, our results support the the other catchments, with the AN in the Swiss Plateau area conclusion of Zobrist (2010) because a reverse increasing– (Table 1) being an exception, which is characterized by a decreasing trend in Ca2+ corresponds to the decreasing– concentration of silicic acid that is comparable to that of increasing trend of Mg2+ . This is consistent with the temper- Alpine catchments. The influence of lithology was identified ature dependence in calcite solubility. However, in the Thur before in the literature, with, for instance, high Ca2+ con- catchment (AN and HA catchments) which is mainly agricul- centrations in one of the tributaries of the Amazon River at- tural, the non-monotonic trend of Mg2+ does not correspond tributed to the presence of a more-carbonate-rich lithology to a trend in Ca2+ . Since Mg2+ can cumulate through fertil- in the corresponding catchment (Baronas et al., 2017; Rue et izer applications and carbonate weathering (i.e., Mg2+ pro- al., 2017; Torres et al., 2017). duction) can be affected by N fertilizers and manure applica- In the seasonality analysis, the classification of catchments tion (Hamilton et al., 2007; Brunet et al., 2011), we hypoth- into classes helps in highlighting the impact of the topogra- esize that fertilizers might also have an impact on the Mg2+ phy on the solute variability. In the Alpine catchments, dis- long-term dynamic. In this respect, the analysis of monthly charge seasonality generally dominates the seasonality of so- trends of Mg2+ (Table S1b) shows a more evident increasing lute concentrations, except for TP, which is related to the trend for agricultural than for non-agricultural catchments. presence of suspended sediments in the streamflow caused For K+ the difference across the gradient of agricultural pres- by higher erosion rates (Haggard and Sharpley, 2007). In- sure is not as remarkable as for Mg2+ . Monthly trends of TN deed, suspended sediment concentrations, coming from ero- and DOC revealed an increasing tendency in the first months sion, are much higher in Alpine catchments, excluding the of the year (January–April) and decreasing ones in the last two small headwater catchments LU and ER, than in the part of the year (August–December), thus suggesting that others (Fig. S5). Furthermore, erosion represents a source they are induced either by streamflow trends (Birsan et al., also for DOC and TOC (Schlesinger and Melack, 1981). TP, 2005) or by biogeochemical processes, which have a pro- DOC, and TOC together with Mg2+ have been classified as nounced seasonality related to temperature and moisture con- solutes belonging to the “B” class (Fig. 4); i.e., their con- trols rather than to human activities. centration patterns show lower variability in hybrid catch- In summary, the anthropogenic signature is clearly de- ments than across other classes. The driver of Mg2+ vari- tectable in the water quality of catchments with an important ability is, however, less clear than for the others. The higher fraction of intensive agriculture and relatively high popula- variability in its concentrations in Alpine catchments in com- Hydrol. Earth Syst. Sci., 23, 1885–1904, 2019 www.hydrol-earth-syst-sci.net/23/1885/2019/
You can also read