GLOBAL ATTRACTIONS ATTENDANCE REPORT - Themed Entertainment ...
←
→
Page content transcription
If your browser does not render page correctly, please read the page content below

GLOBAL ATTRACTIONS ATTENDANCE REPORT
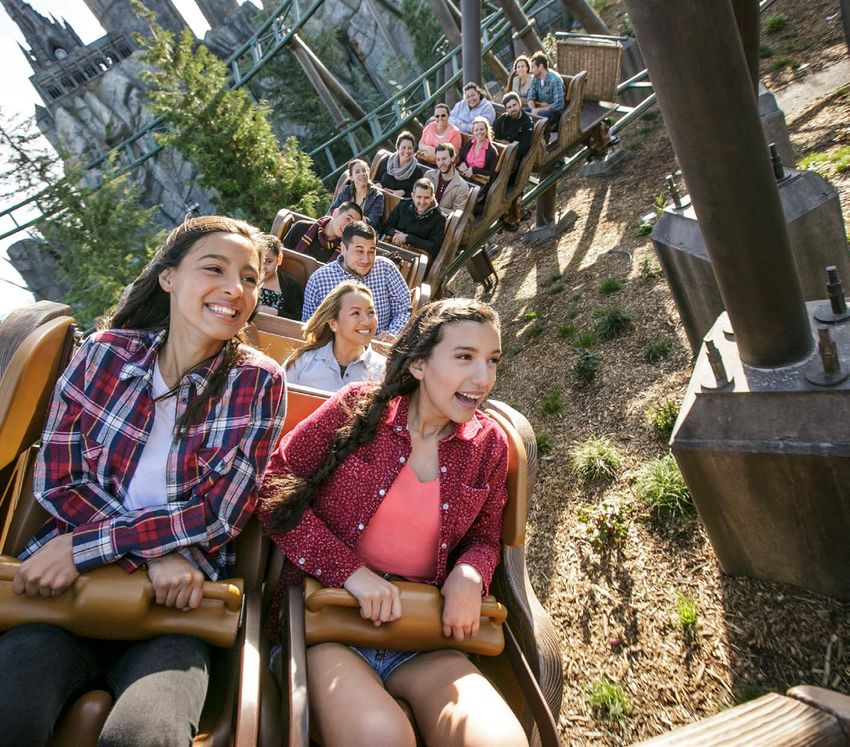
Pandora — The World of Avatar, Disney’s
Animal Kingdom at Walt Disney World Resort,
Lake Buena Vista, FL, U.S.
© Disney

CREDITS
TEA/AECOM 2017 Theme Index and Museum Index: The Global Attractions Attendance Report
Publisher: Themed Entertainment Association (TEA)
Research: Economics practice at AECOM
Editor: Judith Rubin
Publication team: Tsz Yin (Gigi) Au, Chloe Bian, Matthew Budd, Beth Chang, Linda Cheu,
Lucia Fischer, Leonardo Giovanini, Gwyneth Gu, Marina Hoffman, Olga Kondaurova,
Kathleen LaClair, Coralie Landry, Jason Marshall, Shaojin Li, Sarah Linford, Erik Miller,
Jennie Nevin, Margreet Papamichael, John Robinett, Judith Rubin, Brian Sands,
Matt Timmins, Feliz Ventura, Chris Yoshii
©2018 TEA/AECOM. All rights reserved.

CONTACTS
For further information about the contents of this report and about
the Economics practice at AECOM, contact the following:

John Robinett                                      Chris Yoshii
Senior Vice President, Americas                    Vice President, Asia-Pacific
john.robinett@aecom.com                            chris.yoshii@aecom.com
T +1 213 593 8785                                  T +852 3922 9000                         GLOBAL ATTRACTIONS
Brian Sands, AICP                                  Margreet Papamichael
                                                                                            ATTENDANCE REPORT
Vice President, Americas                           Director, EMIA                           The definitive annual
brian.sands@aecom.com                              margreet.papamichael@aecom.com
T +1 202 821 7281                                  T +44 7973 347843                        attendance study for the
Linda Cheu                                         aecom.com/economics
                                                                                            themed entertainment and
Vice President, Americas                                                                    museum industries.
linda.cheu@aecom.com
T +1 415 955 2928                                                                           Published by the Themed
For information about TEA (Themed Entertainment Association):                               Entertainment Association
                                                                                            (TEA) and the Economics
Judith Rubin                                       Jennie Nevin
TEA Publications, PR & Social Media                TEA Chief Operating Officer
                                                                                            practice at AECOM.
judy@teaconnect.org                                jennie@teaconnect.org
T +1 314 853 5210                                  T +1 818 843 8497

TEAconnect.org
CONTENTS
    THE BIG PICTURE                   6
    THE AMERICAS                     22
    ASIA-PACIFIC                     38
    EMEA                             48
    MUSEUMS                          58
    ABOUT THE STUDY                  74
    FREQUENTLY ASKED QUESTIONS       75

                                                        8.1%
                                          Parc Astérix, Plailly,
    Parc Astérix, Plailly, France         France, attendance
    © Parc Astérix / (C) S. Cambon           growth 2016–17

4                                                                  5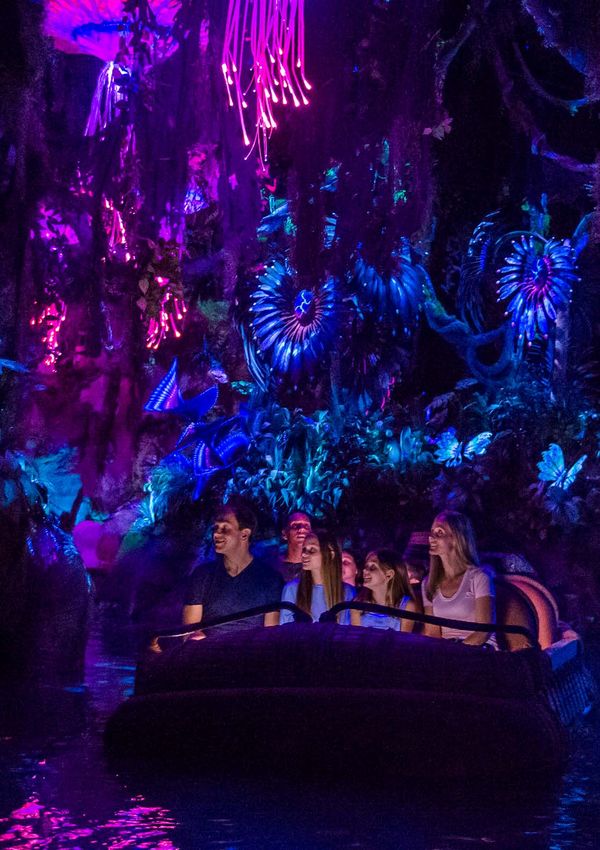
THE BIG PICTURE   8.6%
                  Top 10 theme park
                                                               Chongqing Happy Valley
                                                                              © OCT

                  groups worldwide
                  attendance
                  growth 2016–17

                  475.8m
                  Top 10 theme park
                  groups worldwide
                  attendance 2017

                  438.3m
                  Top 10 theme park
                  groups worldwide
                  attendance 2016

                                      After a fairly flat 2016, the
                                      industry resumed its historic pace
                                      of growth in 2017 fueled by Disney,
                                      China, and Indoor Entertainment
                                      Centers. The top 25 theme parks
                                      expanded volume by 4.7%.
                                       —
                                      The major theme park operators had an
                                      outstanding year with 8.6% overall growth
                                      led largely by properties in China, where
                                      attendance swelled by nearly 20%. China
                                      now generates about a quarter of the
                                      major operators’ overall attendance. Global
                                      attraction attendance at the major operators
                                      is now almost half a billion visits a year, and is
                                      more than double the attendance of all the
                                      major sport leagues around the world.

                                      Looking at our major geographies this
                                      year, Asia’s attendance expanded by 5.5%
                                      driven by Mainland China with Shanghai
    JOHN ROBINETT                     Disneyland’s first full year responsible for
    Senior Vice President,            much of the gain. North America had steady
    Economics, Americas               results of 2.3% exceeding 150 million visits
    —                                 for the first time.

6                                                                                          7
The mega-destination that is Orlando
    saw major attractions open at both
                                                    strong performance in some of the
                                                    European parks. While the Top 20 museums
                                                                                                        TOP 10
    Disney (Pandora — The World of Avatar)          were relatively flat, regional museums had          THEME PARK GROUPS
    and Universal (Volcano Bay) in 2017.
    Representing a third of North American
                                                    a strong year with 5% growth fed by some
                                                    new entries and strong performance in               WORLDWIDE
    attendance, Orlando should continue to          Asia. Several museums had remarkable

                                                                                                       GROUP NAME
    develop with $10 billion of investment in       years such as the Victoria & Albert (up

                                                                                                                                                                                        ATTENDANCE

                                                                                                                                                                                                     ATTENDANCE
                                                                                                                                                                             % CHANGE
    future attractions, RDE (retail, dining and     25%), the National Gallery of Art (up 23%),

                                                                                                       RANK
    entertainment zones), and hotels slated for     the Louvre (up 10%) and the opening of

                                                                                                                                                                                        2017

                                                                                                                                                                                                     2016
    the next five years. Volume rose in EMEA        the National Museum of African American
    at levels similar to last year’s at 3.8% with   History and Culture in Washington, D.C.             1 WALT DISNEY ATTRACTIONS                                            6.8% 150,014,000 140,403,000
    most parks having modest performance            which drew 2.4 million visitors.
    and Disney Paris driving the numbers. The
                                                                                                        2 MERLIN ENTERTAINMENTS GROUP                                        7.8% 66,000,000 61,200,000
    Indoor Entertainment Center (IEC) sector        On the whole, 2017 reflected a return to            3 UNIVERSAL PARKS AND RESORTS                                        4.4% 49,458,000 47,356,000
    was also very active in EMEA this year (as      healthy growth with significant capital
    well as in other regions). Latin American       expenditures in the industry, both in
                                                                                                        4 OCT PARKS CHINA                                                   32.9% 42,880,000 32,270,000
    theme park attendance fell off a bit due to     traditional attractions, attraction‑adjacent        5 FANTAWILD                                                         21.7% 38,495,000 31,639,000
    troubles at one park, with the overall top      hotels, and new, IP-branded indoor
                                                                                                        6 CHIMELONG GROUP                                                   13.4% 31,031,000 27,362,000
    10 parks sliding 2%. However, interest and      attractions. With stabilized global
    investment continue in this market.             economies, and significant planning                 7 SIX FLAGS INC.                                                     2.3% 30,789,000 30,108,000
                                                    occurring now for future investment,
                                                                                                        8 CEDAR FAIR ENTERTAINMENT COMPANY                                   2.4% 25,700,000 25,104,000
    Turning to water parks and museums,             prospects look good for the industry
    overall global water park attendance at the     in the short- to mid-term.                          9 SEAWORLD PARKS & ENTERTAINMENT                                    -5.5% 20,800,000 22,000,000
    top parks was up 1.6% with particularly
                                                                                                        10 PARQUES REUNIDOS                                                 -1.1% 20,600,000 20,825,000
                                                                                                         TOP 10 ATTENDANCE GROWTH 2016–17                                    8.6% 475,767,000 438,267,000

    Race Through New York Starring
                                                                                                        8.6%                                475.8m                      438.3m
    Jimmy Fallon™, Universal                                                                            Top 10 theme park groups            Top 10 theme park groups    Top 10 theme park groups
    Orlando Resort, FL, U.S.                                                                            worldwide attendance growth         worldwide attendance 2017   worldwide attendance 2016
    ©2018 Universal Orlando.                                                                            2016–17
    All Rights Reserved.

8                                                                                                  © 2018 TEA / AECOM                                                                                             9
TOP 25
     AMUSEMENT/THEME PARKS
     WORLDWIDE

                                                                                                 ATTENDANCE

                                                                                                                  ATTENDANCE

                                                                                                                                                                                                                                     ATTENDANCE

                                                                                                                                                                                                                                                    ATTENDANCE
                                                                                    % CHANGE

                                                                                                                                                                                                                      % CHANGE
     LOCATION

                                                                                                                                       LOCATION
     RANK

                                                                                                                                       RANK
     PARK

                                                                                                                                       PARK
                                                                                                 2017

                                                                                                                  2016

                                                                                                                                                                                                                                     2017

                                                                                                                                                                                                                                                    2016
     1 MAGIC KINGDOM AT WALT DISNEY WORLD, LAKE BUENA VISTA, FL, U.S.              0.3% 20,450,000 20,395,000                           14 ISLANDS OF ADVENTURE AT UNIVERSAL ORLANDO, FL, U.S.                      2.0%           9,549,000      9,362,000
     2 DISNEYLAND, ANAHEIM, CA, U.S.                                               2.0% 18,300,000 17,943,000                           15 UNIVERSAL STUDIOS HOLLYWOOD, UNIVERSAL CITY, CA, U.S.                   12.0%           9,056,000      8,086,000
     3 TOKYO DISNEYLAND, TOKYO, JAPAN                                              0.4% 16,600,000 16,540,000                           16 LOTTE WORLD, SEOUL, SOUTH KOREA                                         -17.6%          6,714,000      8,150,000
     4 UNIVERSAL STUDIOS JAPAN, OSAKA, JAPAN                                       3.0% 14,935,000 14,500,000                           17 EVERLAND, GYEONGGI-DO, SOUTH KOREA                                       -9.5%          6,310,000 6,970,000*
     5 TOKYO DISNEYSEA, TOKYO, JAPAN                                               0.3% 13,500,000 13,460,000                           18 HONG KONG DISNEYLAND, HONG KONG SAR                                       1.6%          6,200,000      6,100,000
     6 DISNEY'S ANIMAL KINGDOM AT WALT DISNEY WORLD, LAKE BUENA VISTA, FL, U.S.   15.3% 12,500,000 10,844,000                           19 NAGASHIMA SPA LAND, KUWANA, JAPAN                                         1.4%          5,930,000      5,850,000
     7 EPCOT AT WALT DISNEY WORLD, LAKE BUENA VISTA, FL                            4.2% 12,200,000 11,712,000                           20 OCEAN PARK, HONG KONG SAR                                                -3.3%          5,800,000      5,996,000
     8 SHANGHAI DISNEYLAND, SHANGHAI, CHINA                                       96.4% 11,000,000              5,600,000               21 EUROPA-PARK, RUST, GERMANY                                                1.8%          5,700,000      5,600,000
     9 DISNEY'S HOLLYWOOD STUDIOS AT WALT DISNEY WORLD, LAKE BUENA VISTA, FL, U.S. -0.5% 10,722,000 10,776,000                          22 WALT DISNEY STUDIOS PARK AT DISNEYLAND PARIS, MARNE-LA-VALLEE, FRANCE    4.6%           5,200,000      4,970,000
     10 UNIVERSAL STUDIOS AT UNIVERSAL ORLANDO, FL, U.S.                           2.0% 10,198,000              9,998,000               23 DE EFTELING, KAATSHEUVEL, NETHERLANDS                                     8.7%          5,180,000      4,764,000
     11 CHIMELONG OCEAN KINGDOM, HENGQIN, CHINA                                   15.5%        9,788,000        8,474,000               24 TIVOLI GARDENS, COPENHAGEN, DENMARK                                       0.0%          4,640,000      4,640,000
     12 DISNEYLAND PARK AT DISNEYLAND PARIS, MARNE-LA-VALLEE, FRANCE              15.0%        9,660,000        8,400,000               25 UNIVERSAL STUDIOS SINGAPORE, SINGAPORE                                    2.9%          4,220,000      4,100,000
     13 DISNEY CALIFORNIA ADVENTURE, ANAHEIM, CA, U.S.                             3.0%        9,574,000        9,295,000                TOP 25 TOTAL ATTENDANCE 2017                                                            243,926,000 232,525,000
                                                                                                                                         TOP 25 ATTENDANCE GROWTH 2016–17                                            4.7% 243,926,000 233,057,000

     * Adjustment versus the figure we published in last year’s report

                                                                                                                                        4.7%                                 244.0m                          233.1m
                                                                                                                                        Top 25 amusement/theme parks         Top 25 amusement/theme parks    Top 25 amusement/theme parks
                                                                                                                                        worldwide attendance growth          worldwide attendance 2017       worldwide attendance 2016
                                                                                                                                        2016–17

10                                                                                                            © 2018 TEA / AECOM   © 2018 TEA / AECOM                                                                                                            11
TOP 25
AMUSEMENT/THEME PARKS
WORLDWIDE
DENMARK
NETHERLANDS
5.2m 23
24 4.6m SOUTH KOREA
1 PARK
1 PARK 13m 17 16
2 PARKS
GERMANY
15
FRANCE
14.9m 22 12
21 5.7m CHINA
19
3 JAPAN
1 PARK
CALIFORNIA, U.S. 2 PARKS 20.8m 11 8 5 51.0m
36.9m 2
10
14 1 2 PARKS 4 PARKS
3 PARKS 4
13
9 6
HONG KONG
7 SINGAPORE 20 18 12m
4.2m 25 2 PARKS
1 PARK
FLORIDA, U.S.
75.6m
6 PARKS
MAP KEY GROWTH Top 25 theme/amusement parks worldwide
Top 20 water parks worldwide
10
Circles represent size of attendance at
4.7% 244.0m 233.1m
0%–4.9%
5%–9.9%
ranked parks at the geography indicated.
Slices within circles represent proportion 5
10%+
< 0%
of attendance at the geography from the
ranked park indicated by number. Shading 0
indicates attendance growth at the ranked
Top 25 amusement/theme parks Top 25 amusement/theme parks Top 25 amusement/theme parks
park versus all other ranked parks. -5 worldwide attendance growth worldwide attendance 2017 worldwide attendance 2016
2010–11 2011–12 2012–13 2013–14 2014–15 2015–16 2016–17 2016–17
3.8% 5.2% 4.3% 4.1% 5.4% -1.1% 4.7%
12 © 2018 TEA / AECOM © 2018 TEA / AECOM 13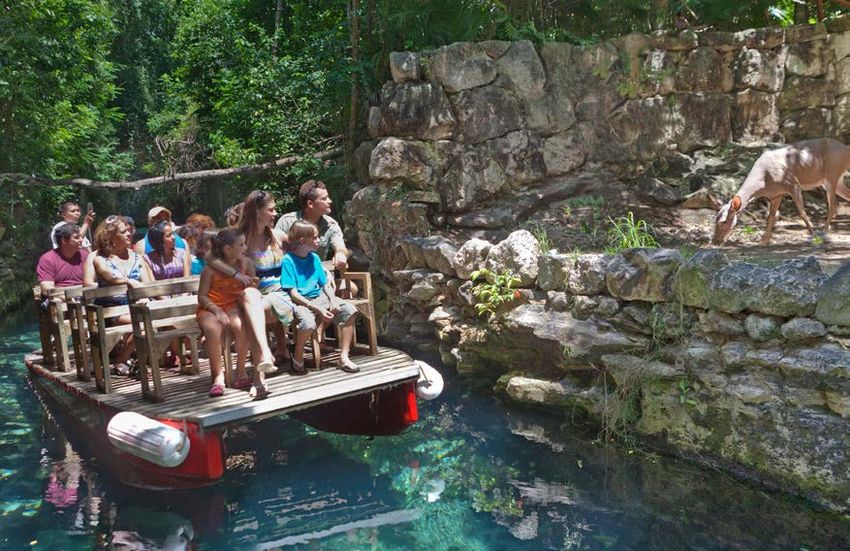
TOP 20
WATER PARKS
WORLDWIDE
ATTENDANCE
ATTENDANCE
ATTENDANCE
ATTENDANCE
% CHANGE
% CHANGE
LOCATION
LOCATION
RANK
RANK
PARK
PARK
2017
2016
2017
2016
1 CHIMELONG WATER PARK, GUANGZHOU, CHINA 6.0% 2,690,000 2,538,000 11 OCEAN WORLD, GANGWON-DO, SOUTH KOREA -9.7% 1,330,000 1,473,000
2 TYPHOON LAGOON AT DISNEY WORLD, ORLANDO, FL, U.S. -5.0% 2,163,000 2,277,000 12 THERME ERDING, ERDING, GERMANY 6.0% 1,320,000 1,245,000
3 THERMAS DOS LARANJAIS, OLIMPIA, BRAZIL 2.5% 2,007,000 1,959,000 13 SUNWAY LAGOON, KUALA LUMPUR, MALAYSIA 2.4% 1,300,000 1,270,000
4 BLIZZARD BEACH AT DISNEY WORLD, ORLANDO, FL, U.S. -7.0% 1,945,000 2,091,000 KAIFENG YINJI WATER PARK, KAIFENG, CHINA 46.1% 1,300,000 890,000
5 BAHAMAS AQUAVENTURE WATER PARK, BAHAMAS -2.0% 1,831,000 1,868,000 15 AQUAPALACE, PRAGUE, CZECH REPUBLIC 18.8% 1,215,000 1,023,000
6 UNIVERSAL’S VOLCANO BAY, ORLANDO, FL, U.S. NEW 1,500,000 NA 16 SIAM PARK, SANTA CRUZ DE TENERIFE, SPAIN 20.9% 1,209,000 1,000,000
7 HOT PARK RIO QUENTE, CALDAS NOVAS, BRAZIL 7.2% 1,481,000 1,381,000 17 WUHU FANTAWILD WATER PARK, WUHU, CHINA 17.6% 1,204,000 1,024,000
8 AQUATICA, ORLANDO, FL, U.S. -10.0% 1,382,000 1,536,000 18 SHENYANG ROYAL OCEAN PARK — WATER WORLD, FUSHUN, CHINA 2.6% 1,200,000 1,170,000
9 CARIBBEAN BAY, GYEONGGI-DO, SOUTH KOREA -3.5% 1,380,000 1,430,000* 19 WET 'N' WILD GOLD COAST, GOLD COAST, AUSTRALIA -5.0% 1,180,000 1,242,000
10 AQUAVENTURE WATER PARK, DUBAI, U.A.E. -5.6% 1,350,000 1,430,000 20 TROPICAL ISLANDS, KRAUSNICK, GERMANY 3.1% 1,168,000 1,133,000
TOP 20 TOTAL ATTENDANCE 2017 30,155,000 27,980,000
TOP 20 ATTENDANCE GROWTH 2016–17 1.6% 30,155,000 29,688,000
* Adjustment versus the figure we published in last year’s report
1.6% 30.2m 29.7m
Top 20 water parks worldwide Top 20 water parks worldwide Top 20 water parks worldwide
attendance growth 2016–17 attendance 2017 attendance 2016
14 © 2018 TEA / AECOM © 2018 TEA / AECOM 15
TOP 20
WATER PARKS
WORLDWIDE
SOUTH KOREA
GERMANY CZECH REPUBLIC
11 9 2.7m
2 PARKS
8
2.5m 20 12 15 1.2m
2 U.S. 2 PARKS 1 PARK
18
7.0m CHINA
6 4 PARKS CANARY ISLANDS, SPAIN 6.4m 1
4
BAHAMAS
1.2m 16 4 PARKS
17
13
1 PARK
5
1.8m 10
1 PARK
U.A.E.
1.4m MALAYSIA
1 PARK 1.3m 13
1 PARK
BRAZIL
7 3 3.5m
2 PARKS
AUSTRALIA
19 1.2m
1 PARK
MAP KEY GROWTH Top 20 water parks worldwide
Top 25 theme/amusement parks worldwide
10
Circles represent size of attendance at
1.6% 30.2m 29.7m
0%–4.9%
5%–9.9%
ranked parks at the geography indicated.
Slices within circles represent proportion 5
10%+
< 0%
of attendance at the geography from the
ranked park indicated by number. Shading 0
indicates attendance growth at the ranked Top 20 water parks worldwide Top 20 water parks worldwide Top 20 water parks worldwide
park versus all other ranked parks. -5 attendance growth 2016–17 attendance 2017 attendance 2016
2010–11 2011–12 2012–13 2013–14 2014–15 2015–16 2016–17
8.2% 5.4% 7.1% 2.8% 3.7% 3.6% 1.6%
16 © 2018 TEA / AECOM © 2018 TEA / AECOM 17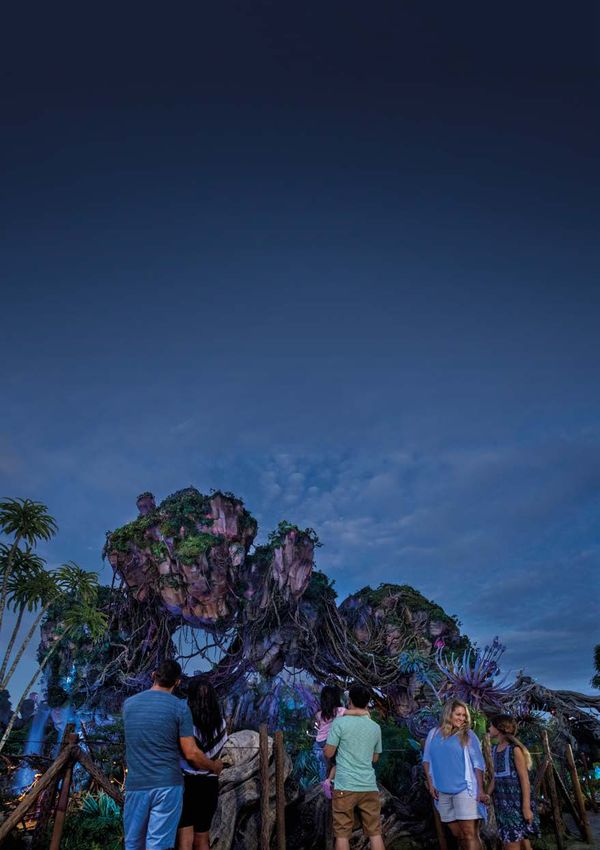
TOP 20
     MUSEUMS
     WORLDWIDE

                                                                                  ATTENDANCE

                                                                                                 ATTENDANCE

                                                                                                                                                                                                            ATTENDANCE

                                                                                                                                                                                                                            ATTENDANCE
                                                                                                 FREE/PAID

                                                                                                                                                                                                                            FREE/PAID
                                                                    % CHANGE

                                                                                                                                                                                             % CHANGE
     LOCATION

                                                                                                                          LOCATION
     MUSEUM

                                                                                                                          MUSEUM
     RANK

                                                                                                                          RANK
                                                                                  2017

                                                                                                 2016

                                                                                                                                                                                                            2017

                                                                                                                                                                                                                            2016
     1 LOUVRE, PARIS, FRANCE                                       9.5%        8,100,000       7,400,000                   11 NATIONAL GALLERY, LONDON, U.K.                              -16.5%         5,229,000       6,263,000
     2 NATIONAL MUSEUM OF CHINA, BEIJING, CHINA                    6.8%        8,063,000       7,550,000                   12 AMERICAN MUSEUM OF NATURAL HISTORY, NEW YORK, NY, U.S.        0.0%         5,000,000       5,000,000
     3 NATIONAL AIR AND SPACE MUSEUM , WASHINGTON, DC, U.S.       -6.7%        7,000,000       7,500,000                   13 NATIONAL PALACE MUSEUM (TAIWAN), TAIPEI, TAIWAN              -4.9%         4,436,000       4,666,000
        THE METROPOLITAN MUSEUM OF ART, NEW YORK, NY, U.S.         4.5%        7,000,000       6,700,000                   14 NATURAL HISTORY MUSEUM, LONDON, U.K.                         -4.1%         4,435,000       4,624,000
     5 VATICAN MUSEUMS, VATICAN, VATICAN CITY                      5.9%        6,427,000       6,067,000                   15 STATE HERMITAGE, ST PETERSBURG, RUSSIA                        2.5%         4,220,000       4,119,000
     6 SHANGHAI SCIENCE & TECHNOLOGY MUSEUM, SHANGHAI, CHINA       1.7%        6,421,000       6,316,000                   16 CHINA SCIENCE TECHNOLOGY MUSEUM, BEIJING, CHINA               4.0%         3,983,000       3,830,000
     7 NATIONAL MUSEUM OF NATURAL HISTORY, WASHINGTON, DC U.S.   -15.5%        6,000,000       7,100,000                   17 REINA SOFIA, MADRID, SPAIN                                    6.9%         3,897,000       3,647,000
     8 BRITISH MUSEUM, LONDON, U.K.                               -8.0%        5,907,000       6,420,000                   18 NATIONAL MUSEUM OF AMERICAN HISTORY, WASHINGTON, DC, U.S.     0.0%         3,800,000       3,800,000
     9 TATE MODERN, LONDON, U.K.                                  -3.1%        5,656,000       5,839,000                   19 VICTORIA & ALBERT MUSEUM, LONDON, U.K.                       25.4%         3,790,000       3,022,000
     10 NATIONAL GALLERY OF ART, WASHINGTON, DC, U.S.            22.8%         5,232,000       4,261,000                   20 CENTRE POMPIDOU, PARIS, FRANCE                                2.2%         3,371,000       3,300,000
                                                                                                                            TOP 20 TOTAL ATTENDANCE 2017                                                107,967,000 107,424,000
                                                                                                                            TOP 20 ATTENDANCE GROWTH 2016–17                               0.2% 107,967,000 107,798,000

                                                                                                                           0.2%                                108.0m                     107.8m
                                                                                                                           Top 20 museums worldwide            Top 20 museums worldwide   Top 20 museums worldwide
                                                                                                                           attendance growth 2016–17           attendance 2017            attendance 2016

18                                                                                               © 2018 TEA / AECOM   © 2018 TEA / AECOM                                                                                                 19
TOP 20
MUSEUMS
WORLDWIDE
19 8
U.K.
25m 14
5 MUSEUMS 11 9
RUSSIA
15 4.2m
1 MUSEUM
FRANCE 20
18 3 11.5m 1 VATICAN CITY
12 U.S. 2 MUSEUMS 5
6.4m 16 CHINA
34m 17 1 MUSEUM
6
2
18.5m
3 6 MUSEUMS 3 MUSEUMS
10 7 SPAIN
TAIWAN
3.9m 13
4.4m
1 MUSEUM
1 MUSEUM
MAP KEY GROWTH Top 20 museums worldwide
10
Circles represent size of attendance at ranked
0.2% 108m 107.8m
0%–4.9%
5%–9.9%
parks at the geography indicated. Slices within
circles represent proportion of attendance 5
10%+
< 0%
at the geography from the ranked museum
indicated by number. Shading indicates 0
attendance growth at the ranked museum Top 20 museums worldwide Top 20 museums worldwide Top 20 museums worldwide
versus all other ranked museums. -5 attendance growth 2016–17 attendance 2017 attendance 2016
2012–13 2013–14 2014–15 2015–16 2016–17
7.2% 1.6% -0.7% 1.2% 0.2%
20 © 2018 TEA / AECOM © 2018 TEA / AECOM 21THE AMERICAS 2.3%
Top 20 amusement/
Flight of the Hippogriff, Wizarding World of Harry
Potter at Univeral Studios Hollywood, California, U.S.
© Universal Studios Hollywood
theme parks North
America attendance
growth 2016–17
151.4m
Top 20 amusement/
theme parks North
America attendance
2017
148.0m
Top 20 amusement/
theme parks North
America attendance
2016
Theme parks
NORTH AMERICA’S
GOOD YEAR
North American theme parks had
a good year in 2017, with the Top
BRIAN SANDS 20 parks up 2.3%, exceeding 150
Vice President, million in attendance.
Economics, The Americas —
— The 2017 numbers for North America, a
mature themed entertainment market,
demonstrate a classic wisdom: the need
for continual reinvestment as the basis
of growth and success, year after year
and decade after decade. This is clearly
shown in the performance of the two top
KATHLEEN LACLAIR 12% U.S. operators, Disney and Universal. It’s
reflected not only by their good numbers for
Universal Studios
Senior Associate Hollywood, California,
2017, and what earned those numbers, but
Economics, The Americas U.S. attendance growth also by what will support continued future
— 2016–17 growth, i.e. new projects in the pipeline.
22 23Both Disney and Universal did very well These operators have significant libraries Universal theme parks in North America Based on reports from Cedar Fair, this
in 2017. Disney parks grew 3.0%, driven of IP to work with and continue to acquire had another good year, with an impressive operator enjoyed moderate, aggregate
largely by Pandora — the World of Avatar. more. In addition to Pandora in 2017, 4.9% estimated growth in visitation. attendance growth of 2.4% (theme
This new land at Disney‘s Animal Kingdom Disney developed new attractions based Attendance at the Universal parks in recent and water parks). Two properties were
was recognized with two Thea Awards in on FROZEN and on Marvel’s Guardians of years has been primarily driven by the recognized in 2017 with TEA Thea Awards:
2017, one for the land as a whole and one the Galaxy; and both were also celebrated unfolding series of Harry Potter themed 150-year-old flagship property Cedar Point
for the new 3D flying simulator, Avatar with Thea Awards. lands and attractions, the most recent was honored as a Thea Classic, and Knott’s
Flight of Passage. of which completed its first full year at Berry Farm was celebrated for Ghost Town
Digital technology has facilitated the Universal Studios Hollywood, sparking an Alive! The strongest Cedar Fair performer in
The revitalization of the resort’s retail, ability to leverage IPs more fully in the attendance increase of nearly 1.0 million. In 2017 was Kings Island, with a 2.5% increase
dining and entertainment (RDE) zone Disney leisure space. There is a lot of opportunity Orlando, Universal Studios Florida also had driven largely by the new Mystic Timbers
Springs is also being very well received and on the table and we are seeing more IP an attendance bump due to the addition roller coaster experience.
adds to the general appeal of the complex. holders recognize their power and reach of Race Through New York Starring Jimmy
for those opportunities. We look forward Fallon™ in spring 2017, and the opening While 2017 was another challenging year for
Disney remains king of the industry with the to seeing how these branded experiences of Volcano Bay covered in the water parks SeaWorld, there have been some signs in
top five parks in North America. As shown perform over the next few years as section on page 28–29. early 2018 that things may be more positive
in our charts, there are six Disney parks studios roll out new, complementary in the coming year, with first quarter revenue
among the Top 20 theme parks in North content on multiple platforms including Regional chains and attendance up significantly versus
America and those six parks account for movies and video games as well as Six Flags parks (theme and water) in the same period the year before. Beyond
55% of total attendance. theme park attractions. North America earned an overall, modest increased marketing efforts this year, which
increase of 1.0%, having opened several should help attendance generally, several
Disney is leveraging the power of new attractions leveraging Batman/DC IP of SeaWorld’s parks have major new rides
compelling intellectual property (IP) with including new Justice League attractions opening, and SeaWorld is also expanding its
Pandora — and new Star Wars-themed at two parks, and the Joker Coaster at two use of the Sesame IP at a number of parks,
lands on the horizon — as did Universal others. Six Flags also did well with new with additional activities understood to be
with the Harry Potter attractions, and both DIGITAL TECHNOLOGY HAS FACILITATED roller coasters opened at its Mexico City in the works. In addition, Miral and SeaWorld
set a leading example for the industry. THE ABILITY TO LEVERAGE IPS MORE property, as well as some new water park have partnered to develop SeaWorld Abu
openings also covered on page 28–29. Dhabi which is scheduled to open in 2022,
FULLY IN THE LEISURE SPACE. and reports of potential expansions into
Asia continue to circulate.
Justice League: Battle for Metropolis
3.4m © Six Flags
Six Flags Magic
Mountain, Valencia, CA,
U.S., attendance 2017
15.3%
Disney’s Animal Kingdom
at Walt Disney World,
Lake Buena Vista, FL,
U.S. attendance growth
2016–17
Pandora — The World of Avatar, Disney’s Animal Kingdom
at Walt Disney World Resort, Lake Buena Vista, FL, U.S.
© Disney
24 254.0m LATIN AMERICA AND Six Flags México garnered 5.0% in
attendance growth, reaching 2.6 million.
Knott’s Berry Farm, CA,
U.S. attendance 2017
MEXICO: MIXED RESULTS The park has invested in new rides and a
new Wonder Woman Coaster will open
Attendance declined more than 2.0% at in 2018. This park was fortunate to come
the Top 10 theme parks in Latin America in through the Central Mexico earthquake of
2017. The primary factor was an estimated September 2017 pretty much unaffected.
dip of nearly 30.0% at Hopi Hari where
attendance declined by almost 500,000
visits. Financial upheaval led to the park
being closed for three months in 2017.
On a much more positive note, attendance THE SUCCESS OF XCARET
at Parque Xcaret was up 7.4%, benefiting DEMONSTRATES THE COMBINED
from the park’s unique offerings as well
Ghost Town Alive! at Knott’s Berry
as the continued growth in tourism to
BENEFITS OF GOOD LOCATION,
Farm, Buena Park, CA, U.S.
© Knott’s Berry Farm Cancun, much of it from North America. CREATIVE THINKING AND DESIGN,
Grupo Xcaret continues to invest in AND SUCCESSFUL IMPLEMENTATION,
this market, opening in 2017 Xenses, ALL OF WHICH REQUIRE HEALTHY,
another unique visitor attraction as well
Multifaceted reinvestment Whether or not role playing is involved, as Xcaret Hotel. The success of Xcaret
ONGOING RE-INVESTMENT.
Direct, person-to-person interaction and well-executed hospitality development and demonstrates the combined benefits of
immersive role playing are being employed the integrated resort model have proven to good location, creative thinking and design,
by operators to keep guests engaged, be well worth the investment, and adopted and successful implementation, all of which
whether in an open-ended attraction by operators worldwide to extend the require healthy, ongoing re-investment.
such as Ghost Town Alive! at Knott’s, or guest experience and the guest stay. In the
in a premium hospitality situation such as state of Florida, and in Orlando, overnight
Disney’s upcoming Star Wars-themed hotel. tourism and international arrivals have once
The challenge is to make the experience again increased. There, Universal has done
feel natural and do so in a manner that is well with Sapphire Falls, Cabana Bay and 7.4%
both effective and affordable. other hotels and has purchased another Parque Xcaret, Cancun,
sizeable piece of property near its complex. Mexico, attendance
In Ohio, Cedar Point was an early adopter growth 2016–17
with its Breakers Hotel; in North Carolina,
3.5m Carowinds recently broke ground on a new
Kings Island, Ohio, U.S. hotel; in California, LEGOLAND opened its
attendance 2017 second lodging property in April 2018, the
Castle Hotel.
Retail is moving further into the leisure
space, and vice versa. Indoor entertainment
centers and experiences, some of
them IP-branded, are being courted
by entertainment districts and mall
operators. An example of this kind of
Mystic Timbers, Kings Island,
convergence is the Lionsgate experience
Ohio, U.S. being developed by Palace Entertainment
© Cedar Fair (a Parques Reunidos subsidiary) near Parque Xcaret, Cancun, Mexico
Times Square in New York City. © Parque Xcaret
26 271.5m LATIN AMERICA AND Thermas Water Park, San Pedro, Brazil
© Thermas Water Park
Universal’s Volcano
Bay, Orlando, FL, U.S.
MEXICO: TOP WATER
attendance
PARKS APPROACH
10 MILLION MARK
Overall, the Top 10 water parks in Latin
America were up 1.5%, reaching a
tantalizing total of 9.9 million in visitation for
2017, raising the expectation that they will
cross over the 10 million line in 2018.
Three properties in Brazil did
particularly well. Hot Park Rio Quente
was up 7.2 percent, with growth to the
Universal’s Volcano Bay, Orlando, FL, U.S.
© Universal Volcano Bay tune of 100,000 visits, attributed to a 2m
combination of strong tourism, new Thermas Dos Laranjais,
attractions, and good marketing in Olímpia, Brazil,
the 2017 season. attendance 2017
Water parks Other water parks that showed attendance
increases following the addition of new Thermas Water Park was up 18.8 percent,
NORTH AMERICA: rides and attractions included Cedar Point
Shores, Knott’s Soak City and Dollywood’s
drawing an additional 62,000 visits. Its
overall annual attendance of just under
INNOVATIONS TO WATCH Splash Country. 400,0000, up from 330,000 the previous
year, is an impressive jump, and the
The Top 20 water parks in North America had The decline in the numbers overall was trend should continue with renovations
poor performance in 2017, with attendance driven by the usual suspects: lack of scheduled for 2018.
of 15.3 million in 2017, a decline of nearly re‑investment to drive new traffic at some
0.5 million or 2.9% versus the previous year. parks, and bad weather plaguing others. Attendance increased 2.5% at Themas
Countering the overall trend, Universal’s new Several parks were obliged to close for dos Laranjais, representing an additional
“water theme park” Volcano Bay is a major extended periods due to severe storms 48,000 visits, and keeping it securely Thermas dos Laranjais,
new addition to the Universal Orlando Resort such as Hurricane Harvey. in first place among Latin America’s Olímpia, Brazil
and the Orlando leisure landscape, with the water parks. The park added a new © Thermas Dos Laranjais
associated investment paying off by drawing There is growing recognition within the water coaster in 2017.
an estimated 1.5 million in attendance in its industry that water parks can be a valuable
opening year, significantly outpacing the investment, due to the combination of On the down side, the Central Mexico Politically and economically there have
now closed Wet ‘N Wild. relatively low capital cost and higher earthquake in September 2017 came at a been some ups and downs in the region,
operations margins. Larger operators can particularly bad time for Six Flags Hurricane but things are generally stable at present,
Volcano Bay will be one to watch in terms benefit from co-located or same-market Harbor Oaxtetec, a newly acquired and and that stability will help markets continue
of its own performance and that of its located water parks that complement renovated Six Flags water park in its to build. Overall attendance at the top water
competitors such as Typhoon Lagoon existing parks, with opportunities to cross- inaugural season. Due to the earthquake, parks in this region trending continues a
and Blizzard Beach. Volcano Bay also has market and cross-ticket. We look forward it had to close for several weeks for slow trend we’ve charted since 2014, when
stimulated some new thinking within the to seeing what might show up on our infrastructure repairs. Small attendance it was just under 8.0 million, growing to 9.5
industry about the definition of a water Theme Index charts next year as operators declines at several other water parks in million in 2015, then 9.8 million in 2016, and
park, strategies for combining wet and dry continue to acquire, build and improve Latin America and Mexico were mostly now nearly 10 million. The market is adding
rides within a property, and innovations in water parks. attributable to weather conditions. about 100,000 visits a year.
virtual queuing.
28 29TOP 20
AMUSEMENT/THEME PARKS
NORTH AMERICA
ATTENDANCE
ATTENDANCE
% CHANGE
LOCATION
RANK
PARK
2017
2016
1 MAGIC KINGDOM AT WALT DISNEY WORLD, LAKE BUENA VISTA, FL, U.S. 0.3% 20,450,000 20,395,000
2 DISNEYLAND, ANAHEIM, CA, U.S. 2.0% 18,300,000 17,943,000
3 DISNEY'S ANIMAL KINGDOM AT WALT DISNEY WORLD, LAKE BUENA VISTA, FL, U.S. 15.3% 12,500,000 10,844,000
4 EPCOT AT WALT DISNEY WORLD, LAKE BUENA VISTA, FL, U.S. 4.2% 12,200,000 11,712,000
5 DISNEY'S HOLLYWOOD STUDIOS AT WALT DISNEY WORLD, LAKE BUENA VISTA, FL, U.S. -0.5% 10,722,000 10,776,000
6 UNIVERSAL STUDIOS AT UNIVERSAL ORLANDO, FL, U.S. 2.0% 10,198,000 9,998,000
7 DISNEY CALIFORNIA ADVENTURE, ANAHEIM, CA, U.S. 3.0% 9,574,000 9,295,000
ONTARIO, CANADA 8 ISLANDS OF ADVENTURE AT UNIVERSAL ORLANDO, FL, U.S. 2.0% 9,549,000 9,362,000
3.8m 13
9 UNIVERSAL STUDIOS HOLLYWOOD, UNIVERSAL CITY, CA, U.S. 12.0% 9,056,000 8,086,000
1 PARK
10 KNOTT'S BERRY FARM, BUENA PARK, CA, U.S. 0.5% 4,034,000 4,014,000
MIDWEST U.S. 20 11 SEAWORLD FLORIDA, ORLANDO, FL, U.S. -10.0% 3,962,000 4,402,000
10.1m 15
14
NORTHEAST U.S. 12 BUSCH GARDENS TAMPA BAY, TAMPA, FL, U.S. -5.0% 3,961,000 4,169,000
3 PARKS 18 17 6.5m 13 CANADA'S WONDERLAND, MAPLE, ONTARIO, CANADA 1.0% 3,760,000 3,723,000
2 PARKS
14 CEDAR POINT, SANDUSKY, OH, U.S. 0.0% 3,604,000 3,604,000
15 KINGS ISLAND, KINGS ISLAND, OH, U.S. 2.5% 3,469,000 3,384,000
16 SIX FLAGS MAGIC MOUNTAIN, VALENCIA, CA, U.S. 1.0% 3,365,000 3,332,000
16 19 17 HERSHEY PARK, HERSHEY, PA, U.S. 0.8% 3,301,000 3,276,000
CALIFORNIA, U.S. 10
2 11 12 1 18 SIX FLAGS GREAT ADVENTURE, JACKSON, NJ, U.S. 0.5% 3,236,000 3,220,000
47.4m 8
FLORIDA, U.S. 19 SEAWORLD CALIFORNIA, SAN DIEGO, CA, U.S. -13.9% 3,100,000 3,600,000*
6 PARKS 9
7 6 83.5m 20 SIX FLAGS GREAT AMERICA, GURNEE, IL, U.S. 3.0% 3,039,000 2,950,000
8 PARKS TOP 20 TOTAL ATTENDANCE 2017 151,380,000 148,085,000
3
5 4 TOP 20 ATTENDANCE GROWTH 2016–17 2.3% 151,380,000 148,013,000
* Adjustment versus the figure we published in last year’s report
KEY GROWTH Top 20 parks North America
Top 25 parks worldwide
10
Circles represent size of attendance at
2.3% 151.4m 148.0m
0%–4.9%
5%–9.9%
ranked parks at the geography indicated.
Slices within circles represent proportion 5
10%+
< 0%
of attendance at the geography from the
ranked park indicated by number. Shading 0
indicates attendance growth at the ranked Top 20 amusement/theme Top 20 amusement/theme Top 20 amusement/theme
park versus all other ranked parks. -5 parks North America parks North America parks North America
2010–11 2011–12 2012–13 2013–14 2014–15 2015–16 2016–17 attendance growth 2016–17 attendance 2017 attendance 2016
2.9% 3.6% 2.7% 2.2% 5.9% 1.2% 2.3%
30 © 2018 TEA / AECOM © 2018 TEA / AECOM 31TOP 10
AMUSEMENT/THEME PARKS
LATIN AMERICA
ATTENDANCE
ATTENDANCE
% CHANGE
LOCATION
RANK
PARK
2017
2016
MONTERREY, MEXICO
6 1.2m 1 SIX FLAGS MEXICO, MEXICO CITY, MEXICO 5.0% 2,610,000 2,486,000
1 PARK
2 BETO CARRERO WORLD, SANTA CATARINA, BRAZIL 2.0% 2,122,000 2,080,000
CANCÚN, MEXICO 3 LA FERIA DE CHAPULTEPEC, MEXICO CITY, MEXICO 0.0% 1,591,000 1,591,000
MEXICO CITY, MEXICO
4.2m 3 1
4
1.5m 4 PARQUE XCARET, CANCUN, MEXICO 7.4% 1,505,000 1,401,000
1 PARK
2 PARKS 5 MUNDO PETAPA, GUATEMALA CITY, GUATEMALA 1.6% 1,239,000 1,220,000
GUATEMALA 6 PLAZA DE SESAMO, MONTERREY, MEXICO -2.0% 1,197,000 1,221,000
1.2m 5 COLOMBIA 7 PARQUE MUNDO AVENTURA, BOGOTA, COLOMBIA -2.3% 1,153,000 1,180,000
1 PARK 10 7
2.1m 8 FANTASIALANDIA, SANTIAGO, CHILE -3.2% 1,050,000 1,085,000
2 PARKS 9 HOPI HARI, SAO PAULO, BRAZIL -30.0% 1,028,000 1,468,000
10 THEME PARQUE NACIONAL DEL CAFE, QUINDIO, COLOMBIA -8.0% 966,000 1,050,000
TOP 10 TOTAL ATTENDANCE 2017 14,461,000 14,782,000
TOP 10 ATTENDANCE GROWTH 2016–17 -2.2% 14,461,000 14,782,000
BRAZIL
9 2
3.2m
2 PARKS
CHILE
1.1m 8
1 PARK
KEY GROWTH Top 10 parks Latin America
Top 25 parks worldwide
10
Circles represent size of attendance at
-2.2% 14.5m 14.8m
0%–4.9%
5%–9.9%
ranked parks at the geography indicated.
Slices within circles represent proportion 5
10%+
< 0%
of attendance at the geography from the
ranked park indicated by number. Shading 0
indicates attendance growth at the ranked
Top 10 amusement/theme Top 10 amusement/theme parks Top 10 amusement/theme parks
park versus all other ranked parks. -5 parks Latin America attendance Latin America attendance 2017 Latin America attendance 2016
2010–11 2011–12 2012–13 2013–14 2014–15 2015–16 2016–17 growth 2016–17
0.7% 2.6% 3.8% 6.0% 1.0% 0.7% -2.2%
32 © 2018 TEA / AECOM © 2018 TEA / AECOM 33TOP 20
WATER PARKS
NORTH AMERICA
ATTENDANCE
ATTENDANCE
% CHANGE
LOCATION
RANK
PARK
2017
2016
1 TYPHOON LAGOON AT DISNEY WORLD, ORLANDO, FL, U.S. -5.0% 2,163,000 2,277,000
2 BLIZZARD BEACH AT DISNEY WORLD, ORLANDO, FL, U.S. -7.0% 1,945,000 2,091,000
3 UNIVERSAL’S VOLCANO BAY, ORLANDO, FL, U.S. NEW 1,500,000 NA
4 AQUATICA, ORLANDO, FL, U.S. -10.0% 1,382,000 1,536,000
5 SCHLITTERBAHN, NEW BRAUNFELS, TX, U.S. -3.0% 1,006,000 1,037,000
6 WATER COUNTRY USA, WILLIAMSBURG, VA, U.S. -3.0% 711,000 733,000
7 ADVENTURE ISLAND, TAMPA, FL, U.S. -2.9% 631,000 650,000
8 SIX FLAGS WHITE WATER, MARIETTA, GA, U.S. -1.6% 559,000 568,000
NORTHEAST U.S. 9 SCHLITTERBAHN, GALVESTON, TX, U.S. -3.0% 545,000 562,000
MIDWEST U.S.
15
14
11
1.4m 10 SIX FLAGS HURRICANE HARBOR, ARLINGTON, TX, U.S. -2.9% 533,000 549,000
3 PARKS
0.4m 18
11 SPLISH SPLASH, CALVERTON, NY, U.S. 0.0% 513,000 513,000
WESTERN U.S. 1 PARK
20 SOUTHERN U.S.
12 WET'N'WILD SPLASHTOWN, HOUSTON, TX, U.S. -5.0% 476,000 501,000
0.9m 19 13
15
8
6
2.1m 13 WET N' WILD, PHOENIX, AZ, U.S. -2.9% 467,000 481,000
2 PARKS 4 PARKS
TEXAS, U.S. 17 14 SIX FLAGS HURRICANE HARBOR, JACKSON, NJ, U.S. -2.0% 440,000 449,000
12 5
3.0m 10 9
15 CAMELBEACH, TANNERSVILLE, PA, U.S. -3.0% 424,000 437,000
5 PARKS DOLLYWOOD'S SPLASH COUNTRY, PIGEON FORGE, TN, U.S. 1.9% 424,000 416,000
7 1
4 FLORIDA, U.S. 17 TYPHOON TEXAS, KATY, TX, U.S. -5.0% 418,000 440,000
7.6m 18 CEDAR POINT SHORES, SANDUSKY, OH, U.S. 5.1% 412,000 392,000
5 PARKS
3 2
19 KNOTT'S SOAK CITY USA, BUENA PARK, CA, U.S. 2.0% 399,000 391,000
20 WET 'N WILD EMERALD POINTE, GREENSBORO, NC, U.S. 0.0% 398,000 398,000
TOP 20 TOTAL ATTENDANCE 2017 15,346,000 14,421,000
TOP 20 ATTENDANCE GROWTH 2016–17 -2.9% 15,346,000 15,810,000
KEY GROWTH Top 20 water parks North America
Top 20 water parks worldwide
10
Circles represent size of attendance at
-2.9% 15.3m 15.8m
0%–4.9%
5%–9.9%
ranked parks at the geography indicated.
Slices within circles represent proportion 5
10%+
< 0%
of attendance at the geography from the
ranked park indicated by number. Shading 0
indicates attendance growth at the ranked Top 20 water parks North Top 20 water parks North Top 20 water parks North
park versus all other ranked parks. -5 America attendance growth America attendance 2017 America attendance 2016
2010–11 2011–12 2012–13 2013–14 2014–15 2015–16 2016–17 2016–17
0.1% 2.2% -2.3% 1.6% 4.3% -0.7% -2.9%
34 © 2018 TEA / AECOM © 2018 TEA / AECOM 35TOP 10
WATER PARKS
LATIN AMERICA
ATTENDANCE
ATTENDANCE
% CHANGE
LOCATION
RANK
PARK
2017
2016
BAHAMAS 1 THERMAS DOS LARANJAIS, OLIMPIA, BRAZIL 2.5% 2,007,000 1,959,000
MEXICO
2 1.8m 2 BAHAMAS AQUAVENTURE WATER PARK, PARADISE ISLAND, BAHAMAS -2.0% 1,831,000 1,868,000
1 PARK
0.5m 7 3 HOT PARK RIO QUENTE, CALDAS NOVAS, BRAZIL 7.2% 1,481,000 1,381,000
1 PARK 4 BEACH PARK, AQUIRAZ, BRAZIL -1.5% 1,028,000 1,044,000
GUATEMALA 5 PISCILAGO, GIRARDOT (BOGOTA), COLOMBIA 2.0% 989,000 970,000
0.8m 6
6 PARQUE ACUATICO XOCOMIL, SAN MARTIN ZAPOTITLAN, RETALHULEU, GUATEMALA -1.3% 827,000 838,000
1 PARK
COLOMBIA 7 PARQUE ACUATICO EL ROLLO, MORELOS, MEXICO 1.9% 530,000 520,000
1.0m 5
8 WET 'N WILD SAO PAULO, SAO PAULO, BRAZIL -2.1% 476,000 486,000
1 PARK
9 THERMAS WATER PARK, SAO PEDRO, BRAZIL 18.8% 392,000 330,000
10 RIO WATER PLANET, RIO DE JANEIRO, BRAZIL -5.1% 372,000 392,000
8 9 10 BRAZIL
1 TOP 10 TOTAL ATTENDANCE 2017 9,933,000 9,788,000
4
5.8m TOP 10 ATTENDANCE GROWTH 2016–17 1.5% 9,933,000 9,788,000
3 6 PARKS
KEY GROWTH Top 10 water parks Latin America
Top 20 water parks worldwide
10
Circles represent size of attendance at
1.5% 9.9m 9.8m
0%–4.9%
5%–9.9%
ranked parks at the geography indicated.
Slices within circles represent proportion 5
10%+
< 0%
of attendance at the geography from the
ranked park indicated by number. Shading 0
indicates attendance growth at the ranked Top 10 water parks Latin Top 10 water parks Latin Top 10 water parks Latin
park versus all other ranked parks. -5 America attendance growth America attendance 2017 America attendance 2016
2013–14 2014–15 2015–16 2016–17 2016–17
5.7% 0.3% 3.4% 1.5%
36 © 2018 TEA / AECOM © 2018 TEA / AECOM 37ASIA-PACIFIC 5.5% Theme parks Parks in Korea such as Lotte World, Everland
and others saw a falloff in attendance, which
Top 20
amusement/theme
RISING GROWTH, we attribute to geopolitical events that
discouraged tourism from Mainland Chinese,
parks Asia‑Pacific
attendance growth
INCREASING QUALITY, a key tourist demographic. Lotte World and
2016–17
RESPONSIVE MARKETS Samsung Everland were particularly hard hit.
In Japan, theme park visitation grew
134.2m The Asia-Pacific region
experienced a strong year in 2017
slightly. Looking at individual parks, the
big story there is Universal Studios Japan.
Top 20
amusement/theme overall, in terms of attendance This property continues to do very well
parks Asia-Pacific growth at the top theme parks, and posted another record year with 3%
attendance 2017
averaging 5.5%. This growth growth, reaping the benefits of a significant
was primarily driven by Mainland re-investment: the new Minion Park and
Minion ride that opened in spring 2017.
127.3m China where some parks did
especially well, with double‑digit,
Top 20
amusement/theme
year‑over‑year increases.
parks Asia-Pacific —
attendance 2016
CHRIS YOSHII
Vice President, Asia-Pacific
—
BETH CHANG
11.2%
Fantawild Oriental
Executive Director, Heritage, Ningbo, China,
Economics, Asia‑Pacific attendance growth Fantawild Oriental Heritage, Ningbo, China
— 2016–17 © Fantawild
38 39Journey of Lights Parade,
parks and attractions that have adjoining
15.5% Chimelong Ocean Kingdom,
Hengqin, China land for further development. OCT put
Chimelong Ocean
© Miziker Entertainment resources into its parks in Chengdu and
Kingdom, Hengqin, WE HAVE FORECAST FOR SEVERAL Shanghai, developing new areas and
China, attendance
growth 2016–17
YEARS THAT CHINA WOULD BECOME attractions. Fantawild’s approach is to
develop new parks that feature their own
THE LARGEST THEME PARK MARKET IP and characters from movies, television
IN THE WORLD BY 2020. THAT and cartoons produced by the Fantawild
FORECAST IS STILL ON TRACK. Animation company and well known in the
domestic Chinese markets — the best-
known being the Boonie Bears. Fantawild
Chimelong conducts excellent national and other Asian operators are adopting
marketing and advertising campaigns to a cross-platforming model for IP as is
help keep traffic flowing to its resorts. And practiced by many Western IP owners.
as the high-speed rail network continues This feeds a trend we have been observing
to expand in China, it is increasingly in China, a desire for more localized, Chinese
convenient and affordable to travel content that applies not only to characters
around the country. and IP but also to food, events, and
design features.
OCT Parks and Fantawild are two chains
that posted strong growth for 2017 as We have forecast for several years that
well. This is largely attributable to capital China would become the largest theme park
investment. These two groups have market in the world by 2020. That forecast
contrasting paths to success. Growth at is still on track, especially with Universal
OCT, a state-owned enterprise, is mostly Studios Beijing due to open around that time,
Attendance at the Osaka park has steadily On the Mainland, the biggest success based on acquiring and improving existing and many other projects still in the pipeline.
grown from 8 million in 2009 to nearly 15 story is Shanghai Disney Resort, which
million in 2017. Since early 2017, USJ has drew 11 million attendance in 2017 — its
been wholly owned by NBCUniversal. first full year of operation — coming in
Ocean Park, Hong Kong SAR
ahead of expectations, with continued
In 2016, the 15th anniversary of Tokyo good performance so far for 2018. The
DisneySea Resort brought a healthy markets have responded strongly in
increase to that park, and it was able to add terms of general popularity, length of stay
to that in 2017 due to a popular new ride, and repeat visitation. Shanghai Disney
Nemo and Friends SeaRider. was honored with a number of TEA Thea
Awards in 2017, celebrating the park
The story is somewhat mixed in Hong Kong. as a whole and distinguishing several
Hong Kong Disneyland saw attendance individual attractions.
stabilizing at 6.2 million in 2017, where
previously it had been declining for two Chimelong Ocean Kingdom in Zhuhai
years, likely due to minimal reinvestment. continues to show healthy, year-over-year
The new Iron Man Experience that opened attendance increases, with growth of
in early 2017 helped drive new traffic and 15% in 2017 — a remarkable achievement
stabilize the situation. Ocean Park Hong especially in view of the wet summer
Kong saw an attendance decline again weather. This park received a Thea Award
in 2017, of about 3%, and a rainy summer in 2017 for its new Journey of Lights
didn’t help things, but the extent of the nighttime parade. The generally strong 5.8m
decrease was likely offset by the new performance includes good levels of hotel Ocean Park, Hong Kong Chongqing Happy Valley
Metro stop right outside the park gates. occupancy and off-season visitation. SAR attendance 2017 © OCT
40 41The success of Shanghai Disney has been the number of megaparks, by requiring Water parks
very encouraging, showing developers a national approval process for anything
that they should invest in world-class and
best-in-class projects, and the market will
over 5 billion RMB (about $770 million USD),
which leaves anything below that threshold
GROWTH, INNOVATION AS MARKETS EXPAND AND IMPROVE,
respond. Having a theme park is still seen
as an important asset to a modern city in
to provincial jurisdiction. AND EVOLUTION GUESTS HAVE MORE OPTIONS. ASIAN
China, and we are going to continue to see Southeast Asia remains a promising market Year 2017 was challenging for water
WATER PARK PATRONS ARE LEARNING
new projects and new announcements. with a lot of interest in entertainment parks in Asia, with some ups and downs for TO APPRECIATE BETTER QUALITY
The factors that fuel this development are projects. The challenges to faster growth specific parks, but the general outlook is EXPERIENCES AND THEY WILL TRAVEL
all still there: economic growth, a rising are the relative difficulty of acquiring large very good. FARTHER TO HAVE THEM.
middle class, rising disposable income, the areas of land, and less robust transportation
inclination to travel, better transportation infrastructure. With a booming middle Overall, we’re seeing very strong, sustained
infrastructure, and automobile purchases. class, large young populations and rising interest in building water parks in Asia, An example is Kaifeng Yinji Waterpark,
These are all positive factors driving disposable income, Southeast Asia is with the number of properties expanding where attendance rose enough to jump
increased consumer demand for poised to become a strong theme park rapidly, and multiple parks in some cities, onto the chart for the first time, landing in
entertainment experiences. market in the near future. We can expect even to near-saturation in some. Being the #4 spot. Its attendance booster was
new theme park projects around major relatively inexpensive and quick to develop a new indoor area, and this is part of a
The Chinese government has put some cities of Jakarta, Kuala Lumpur, Singapore, in comparison to theme parks, and tending general trend of water parks adding indoor
regulations in place that may affect how Bangkok, Manila, and Ho Chi Minh. to have a smaller footprint, water parks venues, which extend the season, and
parks are developed in the future. One are popular with developers and local add attendance.
measure is aimed at de-linking theme park Similarly, India remains a promising market governments as a public recreation option.
development from large-scale, mixed-use for the mid- to long-term. The economy We’ll see more and more of them, and Indoor venues can help parks be less
projects. This will probably be a healthy continues to grow with a rapidly developing they’ll continue to innovate and improve vulnerable to the effects of rainy summer
thing in the long run, as some parks are middle class. However, high regulation, quality. New water parks opening for the weather such as that of the summer of 2017
being built for the wrong reasons and high tax rates, and lack of large land areas 2018 season that will be worth watching in Asia, which resulted in lower attendance
in the wrong locations in order to move for development are hindering growth. include a new Wet’n’Wild in Haikou, and numbers at numerous properties, such as
real estate. A second measure has to do Nonetheless, India remains a promising the Atlantis Water World Park in Sanya, the two Wet’n’Wild water parks in Australia.
with imposing a size threshold to limit future market. Hainan Province.
Of course, it’s not always the weather.
As these markets expand and evolve, Attendance declined at two water parks in
Shanghai Disneyland,
new players will enter the field. This will be Korea, Caribbean Bay and Ocean World,
11.0m Shanghai, China
© Disney reflected on the Theme Index charts with due to the falloff of Chinese tourists to
Shanghai Disneyland, some parks rapidly appearing, dropping off the region.
Shanghai, China and shifting position.
attendance 2017 Visitor preferences are also evolving.
As markets expand and improve, guests
have more options. Asian water park
patrons are learning to appreciate better
quality experiences and they will travel
farther to have them.
AS THESE MARKETS EXPAND
AND EVOLVE, NEW PLAYERS WILL Chimelong Water Park (Guangzhou,
ENTER THE FIELD. THIS WILL BE China) has created a lucrative, new
category of water park attendance with
REFLECTED ON THE THEME INDEX very strong nighttime business drawing
CHARTS WITH SOME PARKS RAPIDLY the 20-something crowd. The night ticket
APPEARING, DROPPING OFF AND guest experience is differentiated with
theatrical lighting and live concerts held
SHIFTING POSITION. in the wave pool.
42 43TOP 20
AMUSEMENT/THEME PARKS
ASIA-PACIFIC
ATTENDANCE
ATTENDANCE
% CHANGE
LOCATION
RANK
PARK
2017
2016
1 TOKYO DISNEYLAND, TOKYO, JAPAN 0.4% 16,600,000 16,540,000
SOUTH KOREA
2 UNIVERSAL STUDIOS JAPAN, OSAKA, JAPAN 3.0% 14,935,000 14,500,000
NORTHERN CHINA 7 6
13m
CENTRAL CHINA 4m 2 PARKS 3 TOKYO DISNEYSEA, TOKYO, JAPAN 0.3% 13,500,000 13,460,000
1 PARK
3.8m JAPAN
4 SHANGHAI DISNEYLAND, SHANGHAI, CHINA 96.4% 11,000,000 5,600,000
WESTERN CHINA
1 PARK 15 51.0m 5 CHIMELONG OCEAN KINGDOM, HENGQIN, CHINA 15.5% 9,788,000 8,474,000
4 PARKS 6 LOTTE WORLD, SEOUL, SOUTH KOREA -17.6% 6,714,000 8,150,000
3m 18
7 EVERLAND, GYEONGGI-DO, SOUTH KOREA -9.5% 6,310,000 6,970,000*
1 PARK
9 8 HONG KONG DISNEYLAND, HONG KONG SAR 1.6% 6,200,000 6,100,000
19 1
3
9 NAGASHIMA SPA LAND, KUWANA, JAPAN 1.4% 5,930,000 5,850,000
16
SOUTHERN CHINA 10 OCEAN PARK, HONG KONG SAR -3.3% 5,800,000 5,996,000
14 5
25.8m 2
11 UNIVERSAL STUDIOS SINGAPORE, SINGAPORE 2.9% 4,220,000 4,100,000
5 PARKS 13 12
12 CHIMELONG PARADISE, GUANGZHOU, CHINA 9.0% 4,181,000 3,836,000
13 OCT WINDOW OF THE WORLD, SHENZHEN, CHINA 1.8% 3,980,000 3,910,000
HONG KONG 20 EASTERN CHINA 14 OCT EAST, SHENZHEN, CHINA 0.0% 3,960,000 3,960,000
12.0m
2 PARKS
10 8 17 4
17.5m 15 OCT HAPPY VALLEY, BEIJING, CHINA 3.1% 3,950,000 3,830,000
3 PARKS
16 OCT HAPPY VALLEY, SHENZHEN, CHINA 1.0% 3,900,000 3,860,000
SINGAPORE 17 FANTAWILD ORIENTAL HERITAGE, NINGBO, CHINA 11.2% 3,827,000 3,441,000
11
4.2m 18 FANTAWILD ADVENTURE, ZHENGZHOU, CHINA 8.8% 3,819,000 3,509,000
1 PARK
19 OCT HAPPY VALLEY, CHENGDU, CHINA 16.5% 2,970,000 2,550,000
20 OCT HAPPY VALLEY, SHANGHAI, CHINA 10.5% 2,640,000 2,390,000
TOP 20 TOTAL ATTENDANCE 2017 134,224,000 127,026,000
TOP 20 ATTENDANCE GROWTH 2016–17 5.5% 134,224,000 127,256,000*
* Adjustment versus the figure we published in last year’s report
KEY GROWTH Top 20 parks Asia-Pacific
Top 25 parks worldwide
10
Circles represent size of attendance at
5.5% 134.2m 127.3m
0%–4.9%
5%–9.9%
ranked parks at the geography indicated.
Slices within circles represent proportion 5
10%+
< 0%
of attendance at the geography from the
ranked park indicated by number. Shading 0
indicates attendance growth at the ranked Top 20 amusement/theme parks Top 20 amusement/theme parks Top 20 amusement/theme parks
park versus all other ranked parks. -5 attendance growth Asia-Pacific Asia-Pacific attendance 2017 Asia-Pacific attendance 2016
2010–11 2011–12 2012–13 2013–14 2014–15 2015–16 2016–17 2016–17
7.5% 5.8% 7.5% 4.9% 6.8% -2.8% 5.5%
44 © 2018 TEA / AECOM © 2018 TEA / AECOM 45TOP 20
WATER PARKS
ASIA-PACIFIC
ATTENDANCE
ATTENDANCE
% CHANGE
LOCATION
RANK
PARK
2017
2016
1 CHIMELONG WATER PARK, GUANGZHOU, CHINA 6.0% 2,690,000 2,538,000
2 CARIBBEAN BAY, GYEONGGI-DO, SOUTH KOREA -3.5% 1,380,000 1,430,000*
3 OCEAN WORLD, GANGWON-DO, SOUTH KOREA -9.7% 1,330,000 1,473,000
4 SUNWAY LAGOON, KUALA LUMPUR, MALAYSIA 2.4% 1,300,000 1,270,000
16 SOUTH KOREA
2 KAIFENG YINJI WATER PARK, KAIFENG, CHINA 46.1% 1,300,000 890,000
14 5.8m 6 WUHU FANTAWILD WATER PARK, WUHU, CHINA 17.6% 1,204,000 1,024,000
3 4 PARKS
7 SHENYANG ROYAL OCEAN PARK — WATER WORLD, FUSHUN, CHINA 2.6% 1,200,000 1,170,000
12 18 8 WET 'N' WILD GOLD COAST, GOLD COAST, AUSTRALIA -5.0% 1,180,000 1,242,000
CHINA 1 JAPAN
8.9m 11
15
0.8m 9 SUNWAY LOST WORLD OF TAMBUN, PERAK, MALAYSIA 0.0% 1,000,000 1,000,000
7 PARKS 1 PARK
7 6 4 10 THE JUNGLE WATER ADVENTURE, BOGOR, WEST JAVA, INDONESIA 11.7% 910,000 815,000
SINGAPORE 11 ZHENGZHOU FANTAWILD WATER PARK, ZHENGZHOU, CHINA 12.0% 898,000 802,000
20 0.7m 12 PLAYAMAYA WATER PARK, SHANGHAI, CHINA 2.3% 890,000 870,000
1 PARK
13 ATLANTIS WATER ADVENTURE, JAKARTA, INDONESIA -20.3% 885,000 1,110,000
MALAYSIA 18
3.0m 13
4
17
9
INDONESIA
2.5m
14 WOONGJIN PLAYDOCI WATERDOCI, GYEONGGI-DO, SOUTH KOREA -2.1% 881,000 900,000
3 PARKS 15 SUMMERLAND, TOKYO, JAPAN -5.8% 812,000 862,000
10 3 PARKS
16 LOTTE WATER PARK, GIMHAE, SOUTH KOREA 2.4% 798,000 779,000
AUSTRALIA 17 OCEAN PARK WATER ADVENTURE, JAKARTA, INDONESIA 3.1% 722,000 700,000*
8
1.2m 18 LEGOLAND WATER PARK, JOHOR, MALAYSIA 0.0% 700,000 700,000
1 PARK
PLAYAMAYA WATER PARK, WUHAN, CHINA 1.4% 700,000 690,000
20 ADVENTURE COVE WATER PARK, SINGAPORE 3.0% 680,000 660,000
TOP 20 TOTAL ATTENDANCE 2017 21,460,000 20,925,000
TOP 20 ATTENDANCE GROWTH 2016–17 2.7% 21,460,000 20,895,000*
* Adjustment versus the figure we published in last year’s report
KEY GROWTH Top 20 water parks Asia-Pacific
Top 20 water parks worldwide
10
Circles represent size of attendance at
2.7% 21.5m 20.9m
0%–4.9%
5%–9.9%
ranked parks at the geography indicated.
Slices within circles represent proportion 5
10%+
< 0%
of attendance at the geography from the
ranked park indicated by number. Shading 0
indicates attendance growth at the ranked Top 20 water parks Asia‑Pacific Top 20 water parks Top 20 water parks
park versus all other ranked parks. -5 attendance growth 2016–17 Asia‑Pacific attendance 2017 Asia‑Pacific attendance 2016
2010–11 2011–12 2012–13 2013–14 2014–15 2015–16 2016–17
10.3% 7.4% 6.0% 1.2% 1.0% 5.4% 2.7%
46 © 2018 TEA / AECOM © 2018 TEA / AECOM 47EMEA 3.4%
Top 20 amusement/
5.2m
De Efteling, Kaatsheuvel,
theme parks EMEA Netherlands attendance
attendance growth 2017
2016–17
62.6m
Top 20 amusement/
theme parks EMEA
attendance 2017
60.5m
Top 20 amusement/
theme parks EMEA
attendance 2016
Theme parks
At first view the EMEA results
for the top-attended theme parks
in 2017 may seem undramatic.
However, a closer look at some
of the numbers, combined with
a review of the performance of
smaller parks in the region, reveal
some interesting variations across
the EMEA geography.
—
In the UK, it seems that parks have not
significantly increased their attendance
numbers. The usual suspects for flat
numbers are bad weather, economic
decline and political instability, the situation
in the UK in 2017 was unique. A comparison
MARGREET PAPAMICHAEL Symbolica, De Efteling,
of consumer confidence levels throughout
Director, EMEA Kaatsheuvel, Netherlands Europe, which many link to consumer
— © de Efteling spending, turned out to be illuminating.
48 49The chart reveals that consumer confidence Despite rising consumer confidence in
in Great Britain took a hit prior to the Brexit Germany, performance there was mediocre 11.9%
vote. Following that vote, British consumer if not poor for many parks. In this case, Gröna Lund, Stockholm,
confidence seems to have remained at a bad weather — especially poor during Sweden, attendance
depressed level for the duration of 2017, peak season — was the likely culprit and growth 2016–17
whereas consumer confidence in some given the blame by many operators. We
of the other large European economies understand however that many parks
trended upward over the course of the year. achieved record attendance levels over
All countries recorded a net increase in GDP Halloween, the importance and popularity
for 2017. The loss in consumer confidence of which is still increasing.
may well be behind the lackluster results in
the U.K. theme park industry. Italy has been experiencing a bad run
economically, and some extremely bad
The competition may be heating up weather combined with some natural
in France. Most French theme parks disasters during peak season weekends
performed well for 2017, with significant impacted performance in this country,
growth of above 8% at Parc Astérix and Gardaland specifically. We wish them
following their continued investment, a new a year of perfect weather and a lack of
ride and additional hotel rooms. Disney too political storms.
did very well, recuperating from its slide Ikaros, Gröna Lund,
of the prior year. Puy du Fou showed good In Scandinavia, as in France, we observed Stockholm, Sweden
attendance growth for 2017 at around 2% that some of the most significant increases © Gröna Lund
but this was the first time in three years that in attendance happened in the smaller parks
the park did not post an increase of more that don’t quite make it into our Top 20.
than 5%, likely simply because there was
no significant new addition to the property. Perhaps this recurring theme of various industries and skill sets with an
Such high growth rates as they have posted smaller parks seeing bigger increases interesting accompanying vocabulary,
over the past couple of years are nigh in percentage terms is not simply due to including words such as “confertainment”
impossible to sustain in the longer term. THE LOSS IN CONSUMER the fact that a small absolute increase and “architainment.” Special events
Interestingly, a number of smaller parks that translates to a large percentage increase, are becoming more themed and are
don’t quite make it onto our charts grew
CONFIDENCE MAY WELL BE BEHIND but possibly also indicates a general now crossing over with the themed
attendance at higher percentages than THE LACKLUSTER RESULTS IN THE increase in competition for leisure time and entertainment industry. The word
the largest parks. U.K. THEME PARK INDUSTRY. spend across the European continent. It “immersive” is developing further
may well be that families are limiting their encompassing new types of experiences
big visits to big parks and increasing their such as Secret Cinema in London (UK) and
visits to smaller parks, which may help their sound-and-light shows using projection
CONSUMER CONFIDENCE 2014–17 budgets go further. mapping on historic buildings such as the
BREXIT VOTE cathedral in Strasbourg (France).
Throughout Europe, we get the impression
102 GERMANY
of an active and growing industry with
SPAIN ongoing investment and merger and
101 FRANCE acquisition activity. As mentioned in
UK previous editions, the addition of leisure
100 and themed entertainment units into THROUGHOUT EUROPE, WE GET THE
retail destinations is adding to the activity IMPRESSION OF AN ACTIVE AND
levels and innovation in our sector and
99 continues at a strong pace throughout
GROWING INDUSTRY WITH ONGOING
2014 2015 2016 2017 Europe and the Middle East. We have INVESTMENT AND MERGER AND
seen further such “merging” between ACQUISITION ACTIVITY.
50 51You can also read