Working Paper Can the magic of Abenomics succeed? - CEPII
←
→
Page content transcription
If your browser does not render page correctly, please read the page content below
No 2015-24 – December
                                               Working Paper

                                      Can the magic of Abenomics succeed?

                                                                                             Evelyne Dourille-Feer

Highlights
          Abenomics is a unique policy combining short and mid to long term policies and supply and demand
          programmes.

          Exiting deflation has been prioritized. Domestic and external factors have impacted CPI negatively from FY
          2014, but moderate inflationary pressure is building up in the Japanese economy.

          Abenomics has not yet achieved its stable 2% real growth target, but nominal and real growth rate since the
          FY 2013 exceeds those of the FY 2002-2012 period.

          As Shinzo Abe’s growth policy will take 5 to 10 years to be fully implemented, Abenomics should succeed
          provided Abe’s successors have the political will to continue pursuing it.
CEPII Working Paper Can the magic of Abenomics succeed?
Abstract
Prime Minister Shinzo Abe’s pro-growth economic policy, dubbed Abenomics, combines monetary policy and fiscal
policy as well as growth reforms. It has attracted much attention worldwide because it combines short and mid to
long term policies, and supply and demand programmes. The quest for growth is explained by its ballooning public
debt and the increasing social cost of its fast population aging. Exiting deflation has been prioritized by Shinzo Abe
to energize growth.
Abenomics raises the central question of why the quest for growth in a context of shrinking population and a quite
high standard of living? However, this eagerness for growth, which translates into higher fiscal revenues, is explained
by its ballooning public debt, and the increasing social cost of its fast population aging. The Abe government has set
the ambitious goal of an annual 2% real GDP growth rate.
The first two arrows (expansionary monetary and fiscal policies) were successful in 2013. But, in the 2014 fiscal
year, the coincidence of a VAT increase, a steep fall in energy prices and a smaller supplementary budget generally
drove down the CPI index (excluding consumption tax) and led to zero growth of real GDP and, in the 2015 fiscal
year, the developments of CPI and growth were disappointing. In order not to fall back into deflation, demand must
be boosted. Shinzo Abe is betting on institutional and technological innovations to foster economic growth in the long
run. Abenomics will work its magic if Shinzo Abe has sufficient time and sufficient political strength to fully implement
his third policy arrow.
Keywords
Growth, Macroeconomic policy, Deflation, Innovation.
JEL
O40, E61, E31, O38.
Working Paper
CEPII (Centre d’Etudes Prospectives et CEPII Working Paper Editorial Director: CEPII
d’Informations Internationales) is a French institute Contributing to research in international Sébastien Jean 113, rue de Grenelle
dedicated to producing independent, policy- economics 75007 Paris
Production: +33 1 53 68 55 00
oriented economic research helpful to understand
© CEPII, PARIS, 2015 Laure Boivin
the international economic environment
www.cepii.fr
and challenges in the areas of trade policy, All rights reserved. Opinions expressed No ISSN: 1293-2574 Press contact: presse@cepii.fr
competitiveness, macroeconomics, international in this publication are those of the
finance and growth. author(s) alone.CEPII Working Paper Can the magic of Abenomics succeed?
Can the magic of Abenomics succeed?
Evelyne Dourille-Feer*
1. Introduction
Prime Minister Shinzo Abe’s pro-growth economic policy, which has come to be called
Abenomics, has attracted much attention worldwide. The image of shooting three arrows
simultaneously aimed at a bold monetary policy, an expansive and flexible fiscal policy, and
a growth reform policy is a very appealing one which it combines short and mid to long term
policies and supply and demand programmes. After being reappointed as the leader of
Japan’s ruling party in September 2015, Shinzo Abe unveiled the three new arrows of
Abenomics 2.0: “hope” (promotion of economic growth), “dreams” (better child rearing
assistance to boost demography), “peace of mind” (increase of nursing care facilities to help
people combine work and care for the elderly). The new arrows are more future-oriented
than the former ones, but their content still lacks consistency.
The Abenomics raises the central question of why the quest for growth in a context of
shrinking population and a quite high standard of living? Japan could become the leader in
experiencing very low growth combined with maintenance of living standards. However, this
eagerness for growth, which translates into higher fiscal revenues, is explained by its
ballooning public debt, and the increasing social cost of its fast population aging. From the
very beginning, the Abe government had set the ambitious goal of an annual 2% real GDP
growth rate (3% nominal growth rate) in the next ten years. Last September, Shinzo Abe has
confirmed this target, but is it achievable?
Exiting deflation has been prioritized by Shinzo Abe to energize growth. The first two arrows
(expansionary monetary and fiscal policies) were successful in 2013; core CPI turned
positive, and real GDP growth doubled between the 2012 and 2013 fiscal years. But the
coincidence of a VAT increase, a steep fall in energy prices and a smaller supplementary
budget in fiscal year 2014 generally drove down the core CPI index (excluding consumption
tax) and led to 0% real GDP growth. In fiscal year 20151, low energy prices and a slowdown
of the Chinese economy have kept on depressing the core CPI index; but the uptrend
observed for the core core CPI index and the dynamism of the Tokyo stock exchange lead to
a more optimistic assessment of the effect of the Central bank’s monetary policy. In order not
to fall back into deflation, demand must be boosted, which, in the long run, means enhancing
the growth potential based on the third arrow’s set of policies and the Abenomics 2.0.
*
Conseiller au CEPII sur l’économie japonaise.
1
Up to October 2015, latest available data.
3CEPII Working Paper Can the magic of Abenomics succeed?
Those reform driven policies are designed to boost the competitiveness of Japanese
enterprises by lowering corporate taxes and facilitating their restructuring, improving
governance, and stimulating capital market and trade partnerships. It also addresses the
problem of scarce human resources, the need for good training and the industry sector
development. Since these measures will require new legislation and/or deregulation and a
change of mindset, enhancement of economic potential can be expected only in five to ten
years. Is Abe strong enough politically to fully implement his structural reforms policies? That
is the key question.
2. Searching for new growth
When Shinzo Abe became Prime Minister in December 2012, real economic growth had
been receding for three quarters, deflation was rampant and the economy's “animal spirit”
had gone into hibernation. The former administration of the opposition party (Democratic
Party of Japan (DPJ), centre-left, from 2009 to 2012) (Dourille-Feer, 2010) had planned to
implement a new economic strategy relying on demand via massive social transfers following
years of the Liberal Democratic Party's (LDPs) dominant supply policy. Due to budget
constraints (subprime crisis, 2011 Tohoku pacific coast earthquake crisis) and the pressures
of domestic big business, alongside the International Monetary Fund's (IMF) to curb the huge
public debt, the DPJ government was obliged to downsize its social spending plan and,
therefore, was unable to implement its redistributive policy. Shinzo Abe has been resolute in
prioritizing growth, postponing the issue of progressive taxation advocated by Thomas
Picketty to curb inequalities (Takita, 2015).
2.1. Why such a pro-growth policy?
Since the bursting of the financial and real estate bubbles, at the beginning of the 1990s up
to 2012, Japan's real GDP has grown at a sluggish annual rate of 0.9%. This long period of
erratic and low growth compared to the previous decades, resulted in a deep loss of
confidence among firm managers and households. Shinzo Abe decided to launch its “Japan
revitalization strategy” consisting of “mobilizing idle talents, goods and funds to achieve 3%
nominal GDP growth rate and 2% real growth rate on average over the next 10 years (Kantei
1, 2014). This goal looks quite ambitious since the OECD estimated a potential growth rate
of about 0.5% in 2012 (OECD, 2015). The real growth rate averaged 1.1% in the 1990s and
0.7% in the period 2000 to 2009.2 Since Japan's average standard of living is quite high,3 and
its population has been declining since 20114, it might seem puzzling that Shinzo Abe is so
insistent about boosting economic growth. Of course, as a conservative, his inclination is not
to initiate important fiscal policy favouring the redistribution of income since he has to tackle
2
The corresponding figures for the US and the Euro zone are respectively 1.8% and 0.7% in 2012; 3.1% and 2.1% in
the 1990s; 2.6% and 1.8% from 2000 to 2009.
3
IMF: The Japanese GDP in PPP per capita was $36,654 in 2013, and world ranking was 27th.
4
NIPSSR population estimation.
4CEPII Working Paper Can the magic of Abenomics succeed?
the thorny and urgent issues of the huge public debt and the increased social expenditures
linked to the ageing population (Figure 1).
Figure 1 – Evolution of general government gross debt
and social expenditures to GDP
Sources: OECD, Economic Outlook n°97, November 2014; IMF, World Economic Outlook, October
2014.
In either case, controlling Japan's fiscal imbalances is an urgent requirement and boosting
growth is a way to obtain higher revenues from taxes.
2.1.1. Ballooning public debt
Despite the level of gross public debt to GDP being more than twice that of the euro area and
the OECD countries on average, Japan does not have a debt crisis. It has kept control of
debt financing because Japanese residents still hold more than 90% of Japan Government
Bonds (JGB). Although in 2012 Japan had accumulated an amount of outstanding JGB
equivalent to 17 years of the general account budget total tax revenues, its debt servicing
was far lower than in other OECD countries. For example, in 2012, net debt interest payment
to GDP was 0.9% for Japan, 2.6% for the euro zone and 3.1% for the US.
The massive buying of JGB by the Bank of Japan (BoJ) since 2013 has worked to keep long
term interest rates low and prevent a snowballing effect on the debt. Owing to a quantitative
and qualitative easing policy, the share of outstanding JGB held by the BoJ increased from
12% to 23.4% between December 2012 and December 2014. The BOJ's monthly purchases
reached 70% of all new government issuance of sovereign debt in 2014. Were the second
quantitative easing introduced in October 2014 to continue, this could lead to a situation
where the BOJ buys up nearly all new issuances of government debt. This would be
counterproductive and result in a drying up of liquidity, a rise in the volatility of Japan's
5CEPII Working Paper Can the magic of Abenomics succeed?
sovereign debt market, and loss of credibility in the financial soundness of the BOJ’s balance
sheet because of JGB overload. The limits to this policy of quantitative easing would result in
loss of control of the debt financing when the current account balance turns negative; in 2014
the current account surplus was just 0.5% of GDP. Time is ticking away... Due to the ageing
in Japan's population, savings rate will decline in the future. However, in 2012, Japan had
accumulated a huge amount of external assets making it the top creditor nation with $3.4
trillion ahead of China with $1.7 trillion, and a stock of household net financial wealth which
reached 419% of GDP (OECD, 2015).
Japan's gross public debt should be stabilized as a matter of urgency since its increasing
size is making it more and more difficult to manage. The 1990’s crisis triggered a steep
increase to 144 % of GDP in 20005 which was exacerbated by the subprime crisis and the
Tohoku earthquake, resulting in a level of 237% of GDP in 2012.6 This huge level of public
debt stems from a fall in budget revenues rather than an increase in fiscal expenditure.
Between 1991 and 2001, Japanese central budget expenditures grew annually at an average
of +1.9% while fiscal revenues tumbled by -2.2% a year due to economic sluggishness and
cuts in direct tax rates since the 1980s. Despite an expansionary budget policy during the
crisis period, Japan's public expenditure to GDP ratio was much lower in 2012 (43.2%) than
in the euro zone (50%) and close to the level in the US (40.3%) (Dourille, 2014/2).
A major crash of Japanese debt is unlikely, but deflating its stock will not only take a long
time but also the help of inflation. A study by Fujitsu (Schultz, 2015) underlines that
Japanese public debt “reflects a shift of spending power from private sector to public sector”
as “if taxes have been raised”. For decades, governments have avoided imposing painful
adjustments on households and private firms by allowing debt to continue to grow. However,
this trend must be halted; in 2015, debt servicing is accounting for more than 24% of general
account expenditure despite very low interest rates. The first step to solving this problem is to
bridge budget deficits. This could be achieved by raising tax revenues through growth and
reform of the tax system, and cutting public expenses through social security reforms.
Boosting tax revenues through growth (rather than cutting expenses) is the solution favoured
by the Japan's Cabinet. However, in its most optimistic economic revitalization scenario of
real economic growth and inflation both reaching 2% in the medium to long term, the ratio of
debt to nominal GDP diminishes from 197% to approximately 187% between 2014 and 2020
and remains around that level up to 2023 (Cabinet office, 2015). It is clear that more efforts
will be needed to reduce the debt to GDP ratio.
2.1.2. Rising social protection costs
Japan has the oldest population in the world (Figure 2). Japan's populating ageing has been
particularly fast since in the early 1990s, when Japan had the youngest population among
the developed countries. There are various factors that have contributed to this rapid ageing
5
The ratio of Gross public debt to GDP was 69% in 1990.
6 Source: IMF.
6CEPII Working Paper Can the magic of Abenomics succeed?
process including the rapid reduction in fertility rates following the post-war baby boom
(1947-1949- from 4.54 to 4.32 children per woman), the sharp decrease in mortality rates,
and a very high life expectancy. This last has various implications for the economy and,
especially, social security spending since the share of those aged 75 and over is increasing
sharply (Figure 3).
Figure 2: Share of aged 65 Figure 3 Share of seniors in total
and over in tota population population of Japan
Source: OECD, population statistics. Source: UN, World population prospects, revised
2012.
Total social security spending has jumped from 17.5% to around 31.8% of central
government expenditure between the 1990 and 2014 Fiscal Years (FYs).7 This is equivalent
to an annual increase of about JY800 billion. In 2014, pensions and health care8 accounted
for 81% of total social security expenditure.
According to Ministry of Health Labour and Welfare projections,9 factoring in a nominal
annual 2% GDP growth for 2012 to 2025, the rate of increase in the pension benefits should
slow to 1% per year, but spending on medical and the long-term care could register annual
growth rates exceeding annual GDP growth, at respectively 3.4% and 7%. For example, in
2011, the proportion of Japanese seniors (75 years and older) in the total population was
12% of the total population, this population accounted for 34% of national medical care
expenditure and 88% of spending on long-term care. Not only will the social security system
have to be redesigned but also more funds will be needed.
7
Fiscal year starts April 1st of the calendar year and ends March 31st the next calendar year.
8
Including Long Term Care Insurance.
9
Ministry of Finance, Fiscal Fact Sheet, 2014.
7CEPII Working Paper Can the magic of Abenomics succeed?
The doubling of the consumption tax rate, from 5% to 10% between 2013 and 2017, will
provide some additional funds. The revenue from consumption tax will go to fund expenditure
on state pensions, medical care, long-term care and child care. Most of this expenditure is
crucial to securing a decent life for the oldest in the population who are the most affected by
income inequality. In 2007, the poverty rate10 among those aged 75 and over was 25.4% in
Japan versus 16.1% on average in the OECD countries and 14.9% for the whole Japanese
population.
2.1.3. Drop in the GDP growth trend
Up to the early 1990s, when Japan was ranked second for economic power based on GDP
size, it experienced astonishingly high economic growth rates compared to other developed
countries. Following the post-war reconstruction period, the Japanese economy entered a
catch up process. By the 1960s, it had become a strong industrial power; by the late 1970s, it
had turned into a major commercial power and by the late 1980s, it had achieved world class
financial power, artificially boosted by speculative bubbles. For more than forty years,
economic growth was able to rely on dynamic investment and strong household consumption
or strong exports depending on the time period. Since the 1990s up to 2012, the average
GDP growth rate has decelerated, decade by decade, and become somewhat erratic. This
raises two central questions: What are the missing engines of growth? Are GDP growth rates
a relevant measure to evaluate the performance of the Japanese economy in the last few
decades?
2.1.4. GDP growth rate dynamic broken since the 1990s
In the period 1990 to 2012, Japan suffered several huge shocks such as the collapse in
asset prices at the beginning of the 1990s, the collapse in world trade linked to the subprime
crisis in 2008-2009 and the Tohoku earthquake in 2011. Compared to the 1980s, growth in
private demand fell, public demand have weakened from the end of the 1990’s and exports
dynamic was rather flat except during the economic upturn of 2003 to 2007 (Figure 4).
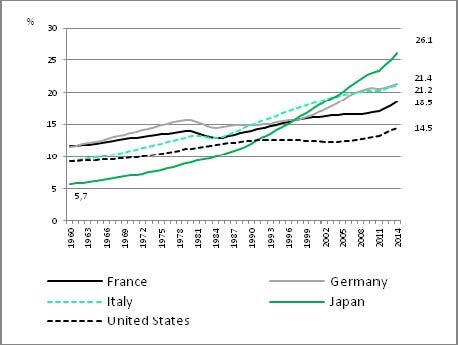
All of these factors combined explain why the annual real GDP growth rate has fallen from
4.6% in the 1980s, to 1.1% in the 1990s and 0.7% from 2000 to 2012. Nevertheless, from
2002 to 2007, the annual growth rate of real GDP has reached 1.8%. It shows how negative
have been the subprime and Tohoku earthquake crisis, but also that the Japanese economy
can also deliver higher growth rates than those of the past decade average.
10
Share of people living on less than half of the median income.
8CEPII Working Paper Can the magic of Abenomics succeed?
Figure 4: Real GDP growth rate, contribution to growth of domestic demand,
public demand and exports from 1981 to 2014
% 10 6,3 7,1
5,4 5,6 4,7
4,2 3,4 4,5 4,1
3,1 2,8 3,3
5 1,9 2,6 1,6 2,3 1,7 2,4 1,3 1,7 2,2 1,7 1,4
0,8 0,20,9 0,4 0,3
‐0,5
0
‐0,2 0,0
‐1,0
‐2,0
‐5
‐5,5
‐10
1981
1982
1983
1984
1985
1986
1987
1988
1989
1990
1991
1992
1993
1994
1995
1996
1997
1998
1999
2000
2001
2002
2003
2004
2005
2006
2007
2008
2009
2010
2011
2012
2013
2014
Private demand Public demand Exports PIB réel
Source: ESRI SNA: from 1981 to 1994, 93 SNA, benchmark year = 1995; from1995 to 2015: 93 SNA,
benchmark year = 2005, 2013-2014: SNA December 2015.
Note: calendar year.
2.1.5. A stable 2% real GDP growth, difficult to achieve
Data for the calendar year 2013 show that government's target of real GDP growth of 1.6%
was almost achieved, but it shows also that this indicator is still below the 1.7% registered in
2012. The FY data,11 on which all Japanese official projections are based, show that real
GDP growth outstrips the government target and reaches more than twice the level in FY
2012. This underlines the real success of Abenomics. Strong household consumption and
private non-residential investment, boosted by the prospect of an increase in the VAT rate,
combined with stronger public demand, contributed to the good economic outcome in 2013
(Table 1).
Table 1: Japan's real and nominal GDP growth rate for calendar and fiscal years
2012 2013 2014 2015 2016 2016-20 2021-25
Calendar
Real GDP 1.7 1.4 -0.0 0,6 1.0 ND ND
year
growth rate
Fiscal year 0.9 2.0 -1.0 0.9 1.0 1.8 1.4
Calendar
Nominal GDP 0.8 0.8 1.6 2.9 1.9 ND ND
year
growth rate
Fiscal year 0.0 1.7 1.5 2.2 1.5 1.9 1.4
Sources: ESRI December 2015 (2012-14: calendar, 2012-14: FY); JRI November 2015 (in Japanese)
(2015-2016: FY); JCER March 2015 (2016-20, 2021-25: calendar and fiscal, reform scenario,); OECD,
EO 98 November 2015 (2015, 2016: calendar year, real and nominal).
Note: estimates starts in calendar year 2015 and FY 2015.
11
Fiscal year 2013: April 1st 2013 to end March 2014.
9CEPII Working Paper Can the magic of Abenomics succeed?
However, the April 2014 VAT increase has had devastating effects on domestic demand
because the rise in real wages was not strong enough to alleviate the VAT shock. Business
investors remained cautious because external demand was also uncertain. Furthermore, the
increase in public investment was weak, and the contribution of net exports to growth was
negative. During the calendar year 2014, despite three quarters of growth contraction, real
GDP stayed almost flat owing to the dynamic pre-VAT first quarter. FY 2014 data show a
contraction in the real GDP growth since the positive effect of the pre-VAT period was
included in the previous FY (Table 1). After, the 2014 “annus horribilis”, a weak economic
recovery is expected in 2015 and 2016. This forecast upturn is based mostly on private
demand since public investment could decelerate and the contribution to growth of net
exports will be weak or slightly negative.
Compared to the 1980s, the economic growth rate has slowed sharply in succeeding
decades. However, it is not relevant to measure Japan's economic performance based only
on its GDP size since its demographic profile is very specific.
2.1.6. Performance depends on gauge
The evolution in the real GDP per capita indexes for Japan and the US between 1980 and
2013 shows that Japan outperformed the US from the late 1980s to the late 1990s. After that
time, the trend in these indexes was mostly in line except in 2009, and was the same in both
countries in 2013 (Figure 5).
Figure 5: Evolution of real and nominal GDP per capita index in Japan
and in the United States from 1980 to 2013
Source: IMF, WEO, October 2014.
Note: Local currency. Estimates starts after 2012 for the United-States and after 2013 for Japan.
10CEPII Working Paper Can the magic of Abenomics succeed?
One explanation for this is the very different demographic profiles of these countries. While in
2000 to 2013, the working age population shrank by 8.5% in Japan, it increased by 12.6% in
the US. The deflationary trend in the Japanese economy since 1998 was also important as
can be noticed in the right hand-side of Figure 5 based on the nominal GDP per capita index.
From a starting index in 1980 twice as high as that in the US, Japan's index was well below
its 2007 benchmark level in 2013.
Other economic indicators, such as income equality, life expectancy, unemployment,
children’s education attainment and health investments show that Japan has fared much
better than the US as Joseph Stiglitz (2013) and Paul Krugman (2014) have underlined.
Nevertheless, in order to boost growth and growth potential for mitigating demographic
issues and the debt problem, structural weaknesses need to be addressed. Since structural
problems require a long term perspective, returning the Japanese economy to a stronger
growth path as soon as possible, requires short term, effective monetary and fiscal policies.
3. Curbing deflation and boosting demand
Curbing deflation is Prime Minister Abe’s first priority based on his conviction that deflation is
accountable for the loss of confidence among households and enterprises. Although the
Japanese economy has registered only mild deflation of -0.3% per year on average from
1998 to 2012, this has impeded consumption and investment, and increased the private debt
burden. This explains the ultra-loose monetary policy design to target 2% inflation in around
2 years, complemented by an expansive fiscal policy.
3.1. Origin and cause of deflation
Japanese deflation was triggered by a sharp monetary policy tightening, starting from spring
1989,12 which led to the bursting of the speculative bubbles. From 1991 to 1994, JY800
trillion of assets (1.7 times 1991 nominal GDP) were destroyed (Ozeki, 2008). This
overwhelming assets shock impacted on the real economy on both demand and offer sides,
and generated a banking crisis.
3.1.1. Weakening of private demand
With asset prices tumbling, the private sector - especially private firms – started to
deleverage from the first half of the 1990s. The contraction in private demand led to
disinflation up to 1994. This, in turn, has led to a vicious circle of deflation. From 1999 to
2012, deflation was firmly entrenched with core core Consumer Price Index (CPI) never
positive, even during the 2003-2007 economic upturn (Figure 6).
12
The discount rate increased from 2.75% in May 1989 to 6% in August 1990. Also, credit was tightened.
11CEPII Working Paper Can the magic of Abenomics succeed?
Figure 6: Private demand, output gap, core and core core CPI from 1989 to 2014
Sources : MIC, Statistics Bureau (CPI), SNA ESRI (private demand), IMF (Output gap)
Note: “Core core CPI” is the CPI index less food and energy
Sluggish domestic demand led to an increase in the output gap which depressed price
levels. Although the output gap reduced and turned positive in 2007 thanks to the 2003-2007
economic upturn, it increased again as a result of the subprime crisis and the Tohoku
earthquake crisis, and was still negative at the end of the period, which had a negative
impact on prices.
3.1.2. Structural factors impeding supply
Structural factors also weakened the supply side. They curbed investment plans and wage
increases. First, the sharp increase in the yen versus the dollar during September 1985 to
August 1986 triggered a wave of relocation abroad of manufacturing plants in strong export
sectors such as automobile and electronics. Second, the tough competition from the Asian
and emerging countries since the 1990s, forced Japanese manufacturers to reduce their
profit margins.
The1990s banking crisis penalized economic activity while weighting on deflationary trends.
The doubling of bank credit volumes from 1985 to 1995, alongside poor assessment of risks,
increased the banks' balance sheet bad debts after the bursting of the speculative bubbles,
and resulted in a credit crunch in the late 1990s to the beginning of 2000s.13 The small and
medium sized enterprises (SME) sector was strongly impacted. During this period, many
enterprises tried to deleverage in order to avoid bankruptcy, and private business debt
decreased from 148.3% to 104.5% of GDP between 1993 and 200314.
13
Economy was mostly impacted in 1997 and 1998.
14
Private business debt, except financial institutions. Source: BoJ, Flow of funds.
12CEPII Working Paper Can the magic of Abenomics succeed?
3.1.3. Lessons from the past
During the 1990s and the 2008-2009 crises, fiscal policies, but not monetary policies, were
implemented quickly. The Japanese CPI index was already negative when the zero interest
rate policy was introduced in March 1999. The BoJ was a pioneer in the adoption of
unconventional policies at the beginning of the 2000s,15 but their volume was low, and the
inflation target was a mere 1% (Szcerbowicz, 2013) The BoJ measures were too late and too
small and had no effect on inflation expectations, especially since business confidence and
consumer’s sentiments had been eroded by the banking crisis and deflation.
Therefore, Shinzo Abe decided to implement strong measures as soon as possible.
Convinced by his special economic adviser, Koichi Hamada, that monetary policies could be
efficient under certain conditions, such as appropriate timing, large scale and additional back
up from fiscal policies; Shinzo Abe put monetary policy at the top of his agenda.
3.2. The ultra expansive monetary policy and its outcomes
Shinzo Abe put strong pressure on the BoJ to increase its inflation target and introduce more
monetary policy easing, which Governor Masaaki Shirakawa was resisting because he was
not convinced that this would overcome deflation16. In January 2013, the BoJ Governor
raised the price stability target from 1% to 2% and announced the start in 2014 of an open-
ended asset buying policy. The uncollateralized overnight call rate was maintained at 0% to
0.1%. However, these measures did not satisfy the government and Masaaki Shirakawa
resigned.
3.2.1. The new monetary policy
Unlike his predecessor, the new governor, Harukiko Kuroda, believed in the efficiency of a
strong expansive monetary policy to fend off deflation17. In early April 2013, the BoJ policy
board launched a massive quantitative and qualitative easing programme (QQE) to achieve
a price stability target of 2% annually within about two years. This would allow a doubling of
the monetary base and the amounts outstanding of JGBs and Exchange-Traded Funds
(ETFs) within 2 years. That is, the monetary base should increase yearly by 60 to 70 trillion
yen and the JGB purchases should reach the massive amount of about 50 trillion yen a year.
The average remaining maturity of JGB purchases had also to climb from 3 years to about 7
years. The uncollateralized overnight call rate was maintained at 0 to 0.1 percent.
15
The unconventional policy measures (monetary base increase, buying of risky assets) were applied between 2001
and 2006 and between 2007 and 2013.
16
Shinzo Abe has even threatened to revise the BOJ law in order to suspend its independence temporarily.
17
The new Governor, Haruhiko Kuroda, was nominated by Prime Minister in late February 2013.
13CEPII Working Paper Can the magic of Abenomics succeed?
As inflation trend had weakened since August 2014, a new QQE was decided by the BoJ on
October 31st 2014. The BoJ would purchase JGBs at an annual rate of about JY80 trillion
with remaining maturity extended to 10 years on average. The amount of the BOJ purchases
of exchange-traded funds (ETFs) and Japan real estate investment trusts (J-REITs) would
triple compared the previous QQE.
3.2.2. QQE policy outcomes
The three main expected effects from such an ultra expansionary monetary policy were a
decrease in real long term interest rates, an upsurge in stock exchange values based on the
rebalancing of domestic investors’ portfolios, and an increase in inflation expectations. The
side effect of this policy was a yen exchange rate depreciation. Taken together, these effects
should lead to an increase in the CPI. So far, the expectations about long term interest rates
and yen depreciation have been fulfilled but the anchor of inflation expectations still needs to
be improved (Kamada, Nakajima, Nishiguchi, 2015). Rebalancing of the domestic investors’
portfolio is still outstanding.
Figure 7: Real and nominal 10 Y interest rates Figure 8: Japan stock market (Nikkei 225)
Source: Thomson Datastream. Source: Nikkei Industry Research Institute.
Note: Nikkei 225 weekly index; April 6 2012 to November 20 2015
14CEPII Working Paper Can the magic of Abenomics succeed?
Real long term interest rates (Figure 7) and the stock market index (Figure 8) reacted quickly
to the new monetary policy. The stock market improvement came mostly from foreign
investors.18 After a temporary retreat linked to the increased VAT, the stock market resumed
its rising trend until summer 2015, when the weakness of Chinese economy and uncertain
US interest rate made it retreat again until early October 2015. But foreign investors were still
the most active in late 2015.
According to the Economists' Consensus Forecast for the six to ten years ahead, inflation
expectations have improved since the launch of the first QQE, rising from about 0.8% in
October 2012 to above 1.5% in July 2015. But, some indicators have shown relatively
weaker developments since summer 201519 and the long term inflation expectations do not
match the 2% inflation targeted by the Bank of Japan.
One of the expected positive fallouts from QQE was the easier access to credit for
companies. The BoJ Tankan surveys show that the attitude of financial institutions towards
lending has become progressively more favourable. This easier access to credit was
expected to increase private investments sharply. The FY 2012 to 2014 surveys as well as
the forecast surveys for FY 2015 underline a gradual increase in software and fixed
investments (excluding land purchases), but the amount of investment is generally far below
government's expectations because of uncertainties and sluggish demand.
The BoJ chose “core CPI” as the benchmark for measuring inflation until summer 2015.
Since July 2015, BoJ is also using a new index: the CPI less fresh food and energy (Bruten,
2015). In FY 2013 (April 2013 to end March 2014), core CPI increased by 0.8%. This was
better than the 0.7% forecast by the BOJ in May 2013. The less volatile core CPI less energy
turned positive in October 2013 and continued to rise until February 2014 (Figure 9).
According to BoJ economists, one of the reasons why price trends showed such good and
rapid results, was that the relationship between the economy and prices driven by a tighter
labour market, changed between the period 1997-2012 (deflation period) and 201320
(Matsuo, 2014). During the first period, the slope of the Philips curve21 is moderate, which
means that the decrease in the unemployment rate had a very weak effect on prices. In the
second period, the slope of the curve is steeper; Abenomics raised people's expectations of
future inflation and changed the relationship between prices and the unemployment rate.
However, other factors – domestic or external - have changed things again.
18
Tokyo Stock Exchange, Trading by Type of Investors, http://www.jpx.co.jp/english/markets/statistics-
equities/monthly/b5b4pj000000t1f1-att/09_t-kabu1510.
19
Bank of Japan, Monthly Report of Recent Economic and Financial Developments, November 24, 2015.
20
1997-2012 and 2013: fiscal years.
21
The Philips curve indicates the relationship between prices and the unemployment rate.
15CEPII Working Paper Can the magic of Abenomics succeed?
Figure 9: Core CPI index, core CPI index less VAT effect ,CPI less fresh food
& energy index less VAT effect (year on year)
Source: MIC, Statistics Bureau.
Note: “Core CPI”: CPI excluding fresh food.
The VAT increase has already provoked some turbulence in prices. Although both CPI
indexes (core CPI and core CPI less energy) jumped to above the 2% inflation target
following the introduction of an 8% VAT rate, core CPI began to lose momentum after August
2014. However, in April to July 2014, the core CPI less VAT effect was almost stable but
started to decline thereafter. The core CPI less energy index less VAT effect remained quite
flat after the VAT increase and has started to increase since March 2015. The decrease in oil
prices since June 2014 explains most of the divergent evolutions of the two CPI indexes. The
prospect of long lasting low oil prices motivated the BoJ to launch a second QQE policy in
late October 2014. If its 2% inflation target is to be met in early 201722, additional easing
cannot be ruled out, especially if weakness of overseas demand persists long enough to
undermine business confidence.
The expansionary monetary policy has not only weakened the yen, decreased long-term
interest rates, boosted the stock prices; it has also raised inflation expectations and lifted the
core CPI less energy index. In the long run, domestic demand will be too weak to sustain
prices without strong wage increases and dynamic private investments. External demand
can also sustain the domestic one.
22
In October 30 2015, The Bank of Japan postponed its forecast for reaching its 2 percent inflation target from the six
months through September 2016 to the six months through March 2017.
16CEPII Working Paper Can the magic of Abenomics succeed?
3.2.3. Weak exports
A strong upsurge in exports was expected after the sharp yen depreciation to the dollar, the
euro and the won (-30% on average from December 2012 to December 2014), but this has
been disappointing. The value of exports has increased +9.5% in 2013 and +4.8% in 2014,23
but their volume decreased by 1.9% in 2013 and increased by only 1.6% in 2014,24 lower
than the level in 2010. In 2015, the year on year value of monthly exports has kept on
increasing until September, although it has been losing momentum since July. In October,
the value of monthly exports declined by more than 2% year on year because of falling
exports to China and the United-States.
Nevertheless, the monthly real export index compiled by the Bank of Japan shows that
exports may be starting to recover as this index has steadily increased from June to October
2015. But this recovery is still not strong enough to compensate for the decline registered
between January and May.
Although there has been some sluggish global trading activity, Japanese trade has been
hampered by the relocation abroad of its automotive and electronics sectors. Also, Japanese
enterprises have lost competitiveness in information technology (IT) to Asian counterparts
(too many domestic companies, not enough innovation). Global fixed investment has also
been weak. Factors such as local currency pricing with sticky prices in that currency allowing
for better profit margins and weak price elasticity of high-end products are additional
explanations for the low pass-through from exchange rates into export prices. In addition, a
Federal Reserve Bank of New-York study (Matsuo, 2014) shows that large exporters are
also large importers, so they face offsetting effects of the exchange rate on their marginal
cost.
The strong deterioration in the 2013 trade balance comes from the import side, and the
combination of a weak yen and high energy raw materials prices (Figure 10). The sharp drop
in oil prices since June 2014 has cut the import bill, but it has not prevented the trade deficit
value to keep on growing in 2014. During the first half of FY 2015, the trade deficit has
shrunk compared to the first half of 2014; the decrease of the value of imports (-5.5%) being
slightly bigger than the increase of the value of exports (+5%).
According to the IMF25, the average crude oil spot price could stay below $66 up to 2018
compared to $104 in 2013; this should help reducing the trade deficit. But, on the export side,
the positive effect of a weak yen has been largely offset by the lack of dynamism in global
trade (Nakajima, 2014), which is likely to persist in 2016...
23
Exports in yen, calendar year. Source: Ministry of Finance, March 2015.
24
BoJ; real exports statistics, April 2015.
25
Source: IMF Commodity Price Forecasts, June 2015.
17CEPII Working Paper Can the magic of Abenomics succeed?
Figure 10: Japanese trade balance FY 2010-2015 (first half = H1)
Source: Ministry of Finance, trade statistics, fiscal year, Japan.
3.3. Fiscal boost
Although during the 1990s and the 2008-2009 crisis, many economic packages were
implemented to fuel growth, their boosting effect has not been as strong as expected
because the additional new spending and tax cuts (or “real water”) have been small and
irregular. Shinzo Abe's keenness to energize economic growth quickly was behind his
decision to introduce a strong fiscal policy in 2013, followed by less stringent policies since
fiscal rehabilitation was also part of his agenda.
3.3.1. Downsizing of fiscal policy in 2013 to autumn 2015
In order to invigorate economic growth, the Abe government designed a fiscal policy that
would be in place for 15 months and would include a supplementary budget and the central
government budget (January 2013 to 1 April 2014, January 2014 to 1 April 2015, January
2015 to 1 April 2016).
During the first two years of the Abe administration, large supplementary budgets and
important new budgets were introduced. In 2013, the economic package assumed particular
importance since, implementation of the reform policy relied on the LDP winning the summer
upper house election and voting in many new laws. The economic package was the most
massive since 2009, and its quick effect on the economy relied upon public works (Table 2).
The evolution of the supplementary budgets shows that their amount and share of GDP have
been decreasing between 2013 and 2014. But, in 2015, the new extra budget announced in
October 30 is reversing this trend. The decision to launch a second extra budget in 2015
results from the weakening of core CPI and the lack of dynamism of economic activity, the
negative impact of China’s slowdown on production and exports, the eventuality of a
negative impact on agriculture as the country prepares to join the trans-Pacific trade pact and
18CEPII Working Paper Can the magic of Abenomics succeed?
the necessity to pave the way for future by increasing nursing facilities. The value of central
government budget expenses has been rising year by year, although its increasing rate
tumbled in 2015.
Table 2: Evolution of central government budget expenses and debt from 2013 to 2015
Central government Total central government
Supplementary budget expenses
Trillion
budget (%, FY, YoY increase) (initial budget + supplementary
yen
A B (1) (4) budget)
A + B (2)
2013 10.3 (2% of GDP) (3) 92.6 (+ 2.5%) 102.9
2014 5.5 (1% of GDP) (4) 95.9 (+3.5%) 101.4 (-1.5)
2015 3.5 (0.7% of GDP) (5) 96.3 (+0.5%) 99.8 (-1.5)
(over 3.0)(6) (over 102,8)(over +1,4)
(Total : over 6.5,
> 1.3% GDP)(7)
Source: Ministry of Finance, budget statistics.
Note: (1) FYs, (2) 15 month period: January to end March (year after). (3) Imputed to FY 2012, (4)
Imputed to FY 2013, (5) Imputed to FY 2014, (6) Extra budget announced by the government on
October 30th 2015, (7) Total of the 2 supplementary budgets.
An analysis of the contribution of public investment and public consumption to economic
growth hints at the effects of fiscal policy on growth. Of course, there are also many indirect
spinoffs from expansionary fiscal policies such as job creation, innovation increment, and
enhancement of private enterprise productivity through new public infrastructures. The
national account quarterly statistics for the individual contributions to growth in 2013 to 2015,
show differences in the rates of the contribution from public investment and government
consumption, depending on the quarter (Figure 11)
As the public work component was an important part of the supplementary budget and the
central government budget in 2013, public investment had the effect of boosting growth up to
the third quarter when household consumption was weakening. In contrast, the positive
effect of the supplementary budget and the large central budget completely disappeared
from Q4 2013 to Q2 2014 while private investment expenses, anticipating the VAT increase,
had a pulling effect on the economy from Q4 2013 to Q1 2014. In Q3 and Q4 2014, the
pulling effect of fiscal policy was insufficient to compensate for the weak household
consumption and the contraction or the freeze of private investment expenses. During the
first and third quarter of 2015, public demand was also weak.
19CEPII Working Paper Can the magic of Abenomics succeed?
Figure 11 Contribution of public and private demand to quarterly real GDP growth
in Japan from Q1 2013 to Q3 2015
%, points of GDP
3 1,2
2 0,8 1,1
1 0.5
0.3
1
0
‐0.2 ‐0,7 0,3
‐1 ‐0,1
‐2 ‐1,9
‐3
‐4
2013 QI 2013 Q2 2013 Q3 2013 Q4 2014 Q1 2014 Q2 2014 Q3 2014 Q4 2015 Q1 2015 Q2 2015 Q3
Public investment Government consumption Household consumption
Non residentiel investment GDP
Source: ESRI, SNA, December 2015
Overall, the expansionary fiscal policy was quite effective during 2013 and worked to add 0.7
points to GDP growth, an impetus not seen since 2009. Its weaker effect in 2014 (adding 0.1
points to GDP growth), especially in the public investment sector, underlines the smaller size
of the economic package and bottlenecks in the supply of manpower and materials which
impeded public works projects. The government was expecting an upturn in private demand
in 2015 that would compensate for a weaker fiscal policy. But, despite their high level of
profits and cash reserves26, firms have been cautious about investing and raising base wage
because of the unclear prospects of external demand (slowdown of the Chinese economy)
and of domestic demand. As the weakness of the Japanese economy has been mirrored by
a technical recession in 2015 (contraction of the GDP in Q2 and Q3), the Japanese
government has decided in late October to compile a supplementary budget of more than 3
trillion yen (23 billion euro), reversing the downward trend of total central government
outlays.
3.3.2. Fiscal rehabilitation policy
Shinzo Abe's fiscal policy is also aimed at rehabilitating public finance in the long run. The
first task was to put an end to the situation that had existed since 2010, where the amount of
government bond issuances was greater than the tax revenues. The first round of VAT
increases in April 2014 was a step towards fiscal rehabilitation. It was implemented as
scheduled, but the second increase from 8% to 10% was postponed to April 201727. The
26
Roughly 350 trillion yen were held by companies at the end of 2014, “Abe to call for supplementary budget topping
3 tn yen”, Nikkei Asian review, November 17, 2015
27
It was initially planned for October 2015.
20CEPII Working Paper Can the magic of Abenomics succeed?
heavy blow inflicted on the economy from the first VAT increase meant that a second shock
following so soon, risked a contraction of the economy.
Table 3: Fiscal indicators in Japan from FY 2012 to FY 2015
National debt
Primary Tax Government Primary Bond service
Trillion expenditure revenues bond issues balance dependency ratio (% of major
yen (1) (1) (1) (1) (%) (1, 2) expenditures)
(1)
2012 68.4 42.3 44,2 -24,9 47,6% 21.9
2013 70.4 43.1 42,9 -23,2 46.3% 22.2
2014 72.6 50.0 41,3 -18 43% 23.3
2015 72.9 54.5 36,9 -13,4 38.3% 23.5
Source: Ministry of Finance, budget statistics.
Note: (1) FY 2012 to FY2014: initial budget figures, FY 2015: estimates; (2) % Government bond
issues/ total general expenditures.
Although the amount of primary expenditure has increased since the Abe administration
came into power, and has resulted in growth in the stock of public debt, tax revenues have
also increased and have exceeded government bond issuances since FY 2013. Thus, the
bond dependency ratio and primary balance deficit have diminished (Table 3). These figures
are from initial budgets which do not include supplementary budgets or other administrations
budget; however, they show that the Abe government has performed quite well in relation to
the objectives of ending overreliance on government bond issuances to balance the central
budget, and shrinking the primary deficit.
The fiscal consolidation plan Shinzo Abe inherited from the former government, involved two
steps. The first step is aimed at halving the primary budget deficit28 to GDP from -6.6% to -
3.3% between 2010 and 2015. The second is to turn this primary deficit into a surplus by
2020. The first objective is barely achievable in 2015, but Shinzo Abe has reaffirmed his
commitment to achieving the second objective on time. However, some very efficient
solutions will be needed to achieve this.
The efficiency of economic growth for boosting fiscal revenues is clear in the Cabinet Office
projections published in February 2015. According to these forecasts, the primary budget
deficit will reach JY9.4 trillion in 2020 with a 2% real economic growth rate, but would balloon
28
The primary budget deficit is the budget deficit less interest charges.
21CEPII Working Paper Can the magic of Abenomics succeed?
to JY16.4 trillion were the GDP growth rate to fall to less than 1% in real terms.29 This is why
growth is so important for reducing the budget deficit.
To achieve a primary budget surplus in 2020 will require either accelerated growth and/or
additional measures such as budget spending cuts and tax increases, both of which could
harm the economy. For example, the Japanese government increased VAT from 3% to 5%
in April 1997 and cancelled some tax credits. These policies, along with the banking system
crisis and the Asian financial crisis, resulted in a steep fall in the GDP real growth rate from
+1.6% in 1997 to -2% in 199830. As the economy has been negatively impacted by the first
sales tax hike in April 2014, the government will decide whether to introduce or postpone the
second tax hike (from 7% to 10%) in April 2017, according to the economic situation. Thus a
self sustained, strong private demand is needed, which should be helped by an efficient
reform policy.
4. The importance of the third arrow
The third arrow, the “growth arrow”, should address the weaknesses in the industrial
production system, at the company, country and international levels in order to create the
conditions for enterprises to invest, innovate and raise wages, and to increase growth
potential. Government's first task was to identify the economic weaknesses and the key
strategic sectors, and elaborate and implement reforms
4.1. Targeting the weak points in the economy
Economic growth is based on labour input, capital investment, productivity and innovation. In
Japan, these economic indicators began to deteriorate in the 1990s. First, Japan's labour
force decreased by 2.16 million workers between 1998 and 2013. Second, private capital
investment shrank 30% between 1991 and 2011. Third, private Research and Development
(R&D) expenditure stagnated between 2000 and 2012, in contrast to the rapid progress in
South Korea. In relation to productivity per capita, the gap with the US, which was 19% in
1991, rose to 30% in 2011.
The world share of Japanese merchandise exports slipped from 9.8% to 4.5% between 1993
and 2012 while China's increased from 2.8% to 11.3%. The decline in Japan's export share
was due to two main factors. First, the share of Japanese manufacturing production abroad
jumped from 6.4% to 20.3% between 1990 and 2013. At the end of the period, this share had
reached very high levels in the transportation equipment (40.2%) and information and
communication electronics equipment (28.3%) sectors, traditionally, Japan's major export
sectors (METI, 1990-2013). Second, many Japanese enterprises lost competitiveness during
the 1990s because of the high number of enterprises in the same sector, the lack of
innovation, the strength of the yen, etc.
29
“Japan must maintain $21 B pace to hit surplus target: advisers”, Nikkei Asian Review, February 12th, 2015.
30
Calendar year
22CEPII Working Paper Can the magic of Abenomics succeed?
Reversing this declining economic trend requires that public policies reforms address
economic agents (enterprises, financial firms, public administrations and households),
industrial structures (restructuration of ailing sectors, development of cutting edge technology
sectors), and other areas (labour market, research, education and training, trade diplomacy).
First and foremost, corporate profitability needs to be enhanced. Stimulating financial and
capital markets is important to improve the environment for large enterprises. Second,
human capital is one of the keys to future economic success. The labour supply must be
increased, and must be highly educated and well trained. Third, the industry structure must
be modernized by upgrading traditional sectors and boosting innovative sectors. This should
increase per capita added value, and spur domestic as well as foreign demand. Fourth,
increased foreign demand would be encouraged through implementation of the free trade
agreements under negotiation, and introduction of the new economic diplomacy. This will
involve the testing of deregulation within National Strategic Specific Zones. These measures
constitute the core of the third arrow policy included in the first stage of Abenomics (Kantei,
2014/1).
Since its re-election as head of the ruling party in late September 2015, Shinzo Abe has
promulgated the economic policies of the “new three arrows” that strengthen the former third
arrow policy (Kantei, 2015/3).
4.2. Modernizing corporations
Although the profitability and return on equity of Japanese companies have been low for
many years, Japanese shareholders are keen to see a stable long-term return from their
investments. After the Japanese stock market crash in the 1990s, and the huge fall in most
world stock markets due to the subprime crisis, Japanese investors have been wary of
investing in high risk high return foreign equities, and foreign investors have been scarce on
the Japanese stock market. The current profit to sales ratios of large manufacturing
enterprises, after peaking at 5.75% in FY 1989 at the height of the speculative bubbles, fell to
a low of 2.41% in 1993, then surged to 6.76% in 2006, and recorded a level below 5% in
2012 (Bank of Japan, 2015). According to the “Financial Statements Statistics of
Corporations by Industry Quarterly” of the Ministry of Finance, the return on equity (ROE) on
an all-industry basis, was about 8% in FY 1989, but had fallen to 2% by FY 2002 and it was
below 6% in 2012. Although, the ROE of American listed companies was far higher than the
ROE of Japanese firms in 2014 at respectively, 14.81% and 8.9% in the fourth quarter of
2014 (Ministry of Finance, 2015). This result shows that Japanese firms are progressing.
As long as Japan's savings stocks were high, there was no urgent need to attract foreign
capital. However, things changed. Worldwide competition is stronger, the Japanese domestic
market is more open and its financial system is deregulated. The low profitability of firms is
affecting wages and impeding consumption. The rise in poorly-paid irregular workers31 and
the rapidly ageing population, are also curbing the household savings rate. The trade
31
Irregular workers were accounting for 38% of the workforce in 2014.
23CEPII Working Paper Can the magic of Abenomics succeed?
balance deficit has caused the current account balance surplus to diminish. So, Japan will be
progressively more in need of foreign capital. This is one of the main reasons why the Abe
government wants to reform taxation, governance, forms of business and the innovation
system.
4.2.1. Lowering corporate tax
The Abe government plans gradually to reduce the effective corporate tax rate to increase
companies’ profits. The corporate tax rate was reduced to 32.11% in 2015, after the abolition
of the special corporation tax for reconstruction following the Great East Japan earthquake
(-2.4% since April 2014) and the lowering of the corporate tax (-2.51% from April 2015). A
further reduction of -3.29% from April 2016 is planned. In the next several years, the effective
corporate tax rate will go down to 20% range, roughly the level of China (25%) and South
Korea (24%) (Kantei, 2015). However, the most profitable firms in the US were subject to a
corporate tax rate of approximately 40% in 2014. This suggests that a decrease in the
corporate tax rate, on its own, will not solve Japanese firms’ profitability problems. The
special tax system to promote investment dedicated to a productivity increase, launched in
January 2014, might help, but, since the declining effective corporate tax rate will shorten
budget resources, a tax reform including a broadening of the tax base is being discussed.
4.2.2. New governance
Reform to the governance of Japanese companies and institutions and management
practices could contribute to increasing productivity and corporate value in the long run. A
government initiative has introduced two new codes of governance: the Japanese
Stewardship Code (JSC) and the Corporate Governance Code (CGC).
The JSC, published in February 2014, should enable institutional investors (asset managers,
trust banks, insurers and pension funds) to deliver higher mid to long term returns for their
investors and to engage more actively with company management. In addition, the
Companies Act was revised in June 2014 to promote the appointment of external directors.
According to the CGC, which came into effect in June 2015, listed companies are required to
comply with the Code or to explain publicly why are not doing so (explanation of objective
and rationale related to stock cross-holdings, information on nomination and remuneration of
board members, nomination of no less than two independent outside directors). Adoption of
the CGC might make Japanese listed companies more attractive to domestic and foreign
investors. Concretely speaking, 197 institutional investors accepted the JSC from February
2014 to October 2015 and more than 2000 companies are applying the CGS (Kantei 2015/1,
November).
Although good news for shareholders, it might be bad news for workers who may face payroll
cuts and increased pressure to slow wage increases. It also does not guarantee more
efficient long-term management since financial constraints are often short-term oriented.
24You can also read