Unconventional Monetary Policy Normalization in High-Income Countries
←
→
Page content transcription
If your browser does not render page correctly, please read the page content below
Public Disclosure Authorized
                                                                                 WPS6830

                               Policy Research Working Paper                    6830
Public Disclosure Authorized

                                     Unconventional Monetary Policy
                                  Normalization in High-Income Countries
                                      Implications for Emerging Market Capital Flows
                                                       and Crisis Risks
Public Disclosure Authorized

                                                               Andrew Burns
                                                               Mizuho Kida
                                                             Jamus Jerome Lim
                                                             Sanket Mohapatra
                                                               Marc Stocker
Public Disclosure Authorized

                               The World Bank
                               Development Prospects Group
                               Global Macroeconomics Unit
                               April 2014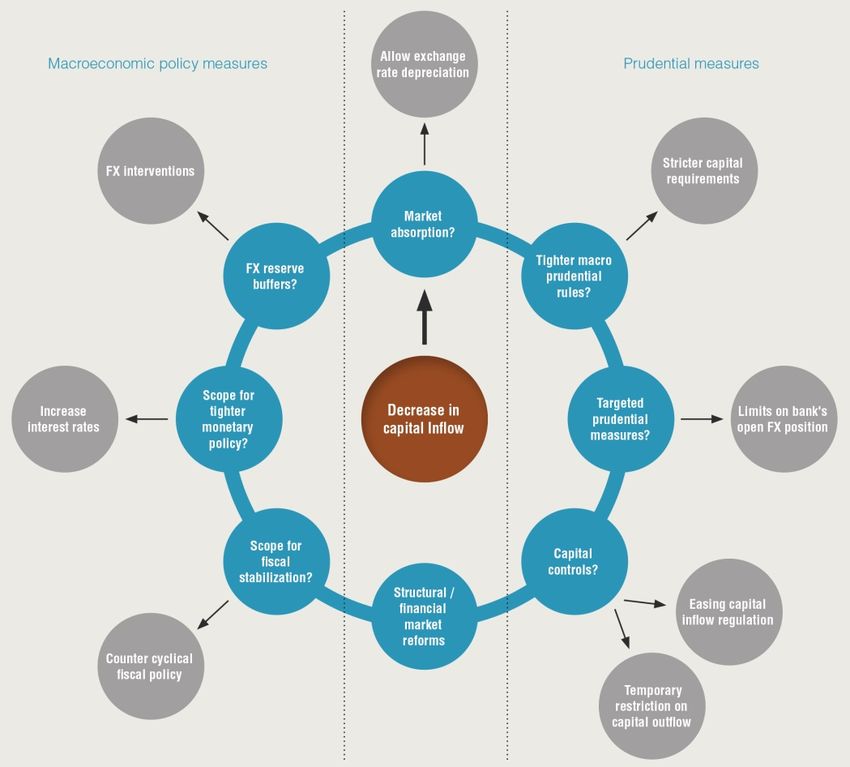
Policy Research Working Paper 6830

  Abstract
  As the recovery in high-income countries firms amid a                              resulting in global bond yields increasing by 100 to 200
  gradual withdrawal of extraordinary monetary stimulus,                             basis points within a couple of quarters, could lead to a
  developing countries can expect stronger demand for                                sharp reduction in capital inflows to developing countries
  their exports as global trade regains momentum, but also                           by between 50 and 80 percent for several months.
  rising interest rates and potentially weaker capital inflows.                      Evidence from past banking crises suggests that countries
  This paper assesses the implications of a normalization                            having seen a substantial expansion of domestic credit
  of policy and activity in high-income countries for                                over the past five years, deteriorating current account
  financial flows and crisis risks in developing countries.                          balances, high levels of foreign and short-term debt,
  In the most likely scenario, a relatively orderly process                          and over-valued exchange rates could be more at risk in
  of normalization would imply a slowdown in capital                                 current circumstances. Countries with adequate policy
  inflows amounting to 0.6 percent of developing-country                             buffers and investor confidence may be able to rely on
  GDP between 2013 and 2016, driven in particular by                                 market mechanisms and countercyclical macroeconomic
  weaker portfolio investments. However, the risk of more                            and prudential policies to deal with a retrenchment
  abrupt adjustments remains significant, especially if                              of foreign capital. In other cases, where the scope for
  increased market volatility accompanies the unwinding                              maneuver is more limited, countries may be forced to
  of unprecedented central bank interventions. According                             tighten fiscal and monetary policy to reduce financing
  to simulations, abrupt changes in market expectations,                             needs and attract additional inflows.

  This paper is a product of the Global Macroeconomics Unit, Development Prospects Group. It is part of a larger effort by
  the World Bank to provide open access to its research and make a contribution to development policy discussions around
  the world. Policy Research Working Papers are also posted on the Web at http://econ.worldbank.org. The authors may be
  contacted at aburns@worldbank.org, mkida@worldbank.org, jlim@worldbank.org, smohapatra2@worldbank.org, and
  mstocker1@worldbank.org.

          The Policy Research Working Paper Series disseminates the findings of work in progress to encourage the exchange of ideas about development
          issues. An objective of the series is to get the findings out quickly, even if the presentations are less than fully polished. The papers carry the
          names of the authors and should be cited accordingly. The findings, interpretations, and conclusions expressed in this paper are entirely those
          of the authors. They do not necessarily represent the views of the International Bank for Reconstruction and Development/World Bank and
          its affiliated organizations, or those of the Executive Directors of the World Bank or the governments they represent.

                                                        Produced by the Research Support Team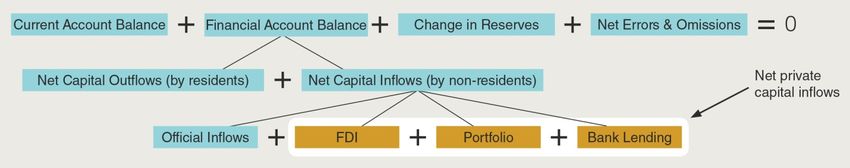
Unconventional Monetary Policy Normalization in High-Income
   Countries: Implications for Emerging Market Capital Flows and
                             Crisis Risks
            Andrew Burns, Mizuho Kida, Jamus Jerome Lim, Sanket Mohapatra,
                                 and Marc Stocker*

JEL classification codes: E44, F30, F37, G01, G15
Keywords: Financial globalization, international capital flows, unconventional monetary policies,
          tapering of quantitative easing, emerging markets, banking crisis
_________________________________
* The authors work at the World Bank in the Global Macroeconomics team of the Development Prospects Group. An
earlier version of this paper served as a chapter titled "Capital Flows and Risks in Developing Countries" of the World
Bank's corporate flagship Global Economic Prospects: Coping With Policy Normalization in High-Income Countries, released in
January 2014 and led by Andrew Burns under the guidance of Kaushik Basu. This research benefited from advice and
useful comments from Dilek Aykut, Tito Cordella, Tatiana Didier, Thomas Helbling, Martin Groth Hjelmsoe, David
Gould, Aart Kraay, Jean-Pierre Lacombe, Luis Serven, Sergio Schmukler, Nikola Spatafora, and Hans Timmer, and
participants at the Bankwide review held on December 10, 2013. We also thank Kevin Barnes, Uri Dadush, Robin
Koepke, Ernesto May, Poonam Gupta, Felix Huefner, and other participants in a seminar on "Emerging markets, capital
flows and QE tapering in the U.S.: outlook and risks?" held at the World Bank on March 6, 2014. We also benefited
from advice from Kristin Forbes and Philip Turner. The views expressed here do not necessarily represent those of the
World      Bank.     Email     addresses:    aburns@worldbank.org,       mkida@worldbank.org,        jlim@worldbank.org,
smohapatra2@worldbank.org, mstocker1@worldbank.org
1. Introduction
The past two decades have seen dramatic changes in private capital inflows to developing countries.
These flows have increased substantially both in absolute terms and as a share of developing-country
GDP, and have been characterized by large fluctuations in response to changing global financial and
economic conditions.

In the post-crisis period, financial inflows have averaged around 6 percent of GDP in developing
countries, supported by historically low interest rates in high-income countries and stronger growth
prospects across emerging and developing regions.

As the recovery in high-income countries firms amid a gradual withdrawal of extraordinary
monetary stimulus, the global conditions prevailing in previous years will evolve in significant ways.
Developing countries can expect in this context stronger demand for their exports as global trade
regains momentum, but also rising interest rates and potentially weaker capital inflows.

In the most likely scenario, this process of normalization of activity and policy in high-income
countries should follow a relatively orderly trajectory, with global interest rates rising only slowly to
reach 3.6 percent by mid-2016. The analysis presented in this paper show that such gradual
tightening would imply limited disruption to developing countries, with a slowdown in capital
inflows amounting to 0.6 percent of developing-country GDP between 2013 and 2016, driven in
particular by weaker portfolio investments.

However, the risk of more abrupt adjustments remains significant, especially if increased market
volatility accompanies the actual unwinding of unprecedented central bank interventions. According
to simulations, abrupt changes in market expectations, resulting in global bond yields increasing by
100 to 200 basis points within a couple of quarters, could lead to a sharp reduction in capital inflows
to developing countries by between 50 and 80 percent for several months.

Some developing countries could face crisis risks should such scenario unfold. Focusing on an
assessment of prevalent factors in past banking crises, evidence suggests that countries having seen a
substantial expansion of domestic credit over the last five years, deteriorating current account
balances, high levels of foreign and short-term debt and over-valued exchange rates could be more
at risk in current circumstances.

In any event, policy makers need to consider how they would respond to a tightening of global
financing conditions, and assess their specific vulnerabilities. Countries with adequate policy buffers
and investor confidence may be able to rely on market mechanisms, countercyclical macroeconomic
and prudential policies to deal with a retrenchment of foreign capital. In other cases, where the
scope for maneuver is more limited, countries may be forced to tighten fiscal and monetary policy to
reduce financing needs and attract additional inflows. Where adequate foreign reserves exist, these
can be used to moderate the pace of exchange rate depreciation, while a loosening of capital inflow
regulation and incentives for foreign direct investment might help smooth adjustments. Eventually,
reforming domestic economies by improving the efficiency of labor markets, fiscal management, the
breadth and depth of institutions, governance and infrastructure will be the most effective way to
restore confidence and spur stability.
                                                   2
This paper examines the pattern of private capital inflows to developing countries with a view to
better understanding their main determinants and outlook in current circumstances. It is organized
into three sections.
The first section describes the evolution of inflows in recent years and presents econometric
evidence out-lining the relative importance of changing global and country-specific conditions in
that evolution. It finds that global factors accounted for about 60 percent of the increase in overall
capital inflows to developing countries between 2009 and 2013, with the remainder explained by
country-specific developments. Envisaging different scenarios, simulations of the likely path of
capital inflows to developing countries in coming years are presented.
A second section concentrates on crisis risks and domestic vulnerabilities in the event of a disorderly
adjustment, focusing on an evaluation of banking crisis probabilities at the individual country level.
A final section discusses policy options in the face of capital retrenchment risks, including
macroeconomic and prudential policies as well as structural reform priorities.
2. Capital inflows: Past and expected trends
Since the 1990s, when they represented an average of 4 percent of developing-country GDP, private
capital inflows to developing countries increased markedly during the 2000s (see box 1 for a
definition of capital inflows and their link with broader balance of payment developments). During
the pre-crisis boom years 2003-07, inflows surged, peaking at more than 12 percent of developing-
country GDP in 2007Q3, before crashing to negative territory in 2008 with the global financial
crisis. They partly recovered in the post-crisis period - averaging 6 percent between 2010 and 2013
(Figure 1). 1
For the most part, strong capital inflows to developing countries contributed to higher investment
rates and facilitated capital deepening and technological transfer, which had positive effects on
growth potential and levels of development (World Bank, 2010). In most cases, the rise in private
capital inflows during the pre-crisis years did not cause excessively large current account imbalances
in developing countries.
Developments in central Europe were a notable exception. Massive cross-border bank lending flows
(representing alone 6 percent of regional GDP in the 2003-07 period; see Figure 2), fueled credit and
asset price bubbles in the pre-crisis period, contributing to a boom in private consumption,
mounting current account deficits and indebtedness problems similar to those observed in high-
income countries during the same period. As a result, unlike other regions developing Europe has
gone through an extended period of restructuring and deleveraging similar to that of high-income
countries.
While the remarkable increase in financial inflows to developing countries implied investment and
growth opportunities in “normal” times, it also amplified the transmission of global financial shocks,
1 Here and in the remainder of this paper, the post-crisis period is referred to as the period after 2009 and the boom
period as 2003-07.
3as starkly illustrated during the 2008-09 financial crisis, when financial inflows to developing
countries fell abruptly to about -1 percent.
Most developing regions exited from the crisis relatively quickly, thanks to counter-cyclical stimulus
policies, better growth prospects (reflected in their relative credit ratings; see Figure 3, and a gradual
thawing of global financial conditions. As demonstrated throughout this paper, exceptionally loose
monetary policy in high-income countries contributed significantly to the vigorous resurgence of
financial inflows to developing countries in the post crisis period (peaking at 8.5 percent of their
combined GDP by mid-2011).
This post-crisis upsurge was initially driven by a recovery in cross-border lending and later by a
persistent rebalancing of portfolio investments, both largely influenced by exceptionally low interest
rates and risk aversion. As a result, before the summer 2013, the weight of developing country
bonds in global fixed income portfolios increased to levels last seen in the late-1990s (World Bank,
2014).
Portfolio investments (bond and equity inflows) have been robust in most regions since 2009
(Figure 2). In contrast, bank lending has moderated particularly in emerging Europe because of
continued deleveraging and balance sheet adjustments by banks in high-income countries.
Foreign direct investment (FDI) has been most stable component of capital inflows, although the
picture is more mixed at the regional level. In Sub-Saharan Africa, FDI inflows have increased
steadily in the post-crisis period, reaching 6.5 percent of the region’s GDP most recently. That
contrasts with South Asia and the Middle-East and North Africa where FDI flows have been
declining (to 1.3 and 0.8 percent of regional GDP respectively) during the 2011-13 period.
Over the past two years, capital inflows have stabilized at around 4.5 percent of developing-country
GDP. The slowdown was also associated with stagnant international reserves, rising capital
outflows, and a deterioration of current account balances in a number of countries and regions,
hence increasing their exposure to changes in external conditions.
As discussed in World Bank (2014), since May 2013, expectations of a gradual unwinding of
quantitative easing (QE) by the U.S. Federal Reserve led to a significant portfolio adjustment on the
part of global investors away from developing countries. Issuances of developing-country bond,
equity, and syndicated bank loans dropped initially by around 50 percent, imposing significant
adjustment pressures on currencies, asset prices, and foreign exchange reserves of several middle-
income countries.
4Box 1 Private capital inflows: definition, link with balance of payment and financial exposure
The analysis presented in this paper is specifically focused on the behavior of net private capital inflows by foreign
investors into developing countries. This box clarifies the concept, its link to current account imbalances and external
vulnerabilities.
Capital flows are recorded when there is transfer of ownership of financial assets from one country to another. When
non-residents are purchasing assets in a country, the transaction is designated as a capital inflow for that country, and
recorded as a change in foreign liabilities on its financial account balance. When domestic investors are purchasing
assets abroad, the transaction is recorded as a capital outflow.
Private capital inflows are of particular interest, being most responsive to changes in global market conditions. They
are labelled as “net inflows” in the balance of payment statistics as they include repayment of debt and equity
disinvestment by non-residents, in contrast to gross inflow data, which refer only to the acquisition value of the
assets.
Official inflows provided by international financial institutions and bilateral creditors are excluded from this analysis,
as they follow entirely different patterns and determinants.
Data used in this paper is mostly coming from the IMF balance of payment statistics (IFS database), complemented
by the BIS Locational Banking data for cross-border lending, and national balance of payment data where
appropriate.
Capital inflows, current account imbalances and vulnerability to external conditions
Capital inflows are tightly connected to broader balance of payment developments, as the financial account of a
country matches by definition the sum of its current account position, changes in foreign currency reserves and
statistical errors and omissions (Figure 1. 1).
Thus large capital inflows, if leading to an improved financial account balance, can potentially be associated with a
deterioration of the current account of the recipient country and a growing disconnection between domestic
investment and saving. This could happen for instance if inflows put significant upward pressure on the real effective
exchange rate or imply excessively loose domestic financing conditions. But these relationships are far from linear.
3. Modeling capital flows to developing countries
This section evaluates the main determinants of capital inflows to developing countries. It explores
the likely impact of the recovery in growth and normalization of policies in high-income countries,
examining a scenario where financial markets react in an orderly fashion as well as two scenarios
where the adjustment is less orderly.
This analysis followed a two pronged approach. In a first step, a panel regression was used to assess
the relative importance of global and domestic factors in determining the equilibrium level of capital
inflows.
This is useful for understanding the long-term reaction (after all adjustment has occurred) to a
change in global (or domestic) conditions. However, this approach is less suited for evaluating the
short-term interaction and interplay between global factors and capital inflows.
To capture such short-term dynamics and assess over-shooting risks in relation to changes in
external financing conditions, a vector autoregression model was estimated in a second step, and
used for further simulations.
5Accounting for global “push” and domestic “pull” factors
The economic literature suggests that capital inflows to individual developing countries are
determined by both global external conditions (“push” factors) and domestic factors (“pull”
factors). 2
The model outlined in box 2 was designed to control for the impacts on capital inflows of changes
in observable global conditions, including real incentives (growth and growth expectations), financial
incentives (interest rates and interest rate differentials), access to liquidity (global money supply), and
global risk aversion. It also accounts for domestic pull factors (credit ratings, local interest rates,
GDP levels) that can influence the volumes of capital inflows to developing economies.
Importantly, the model does not attempt to tease out the full influence that extraordinary monetary
policy measures undertaken in high-income countries had on capital inflows. To do so would require
determining the extent to which quantitative easing itself influenced the various drivers of capital
inflows (interest rates, liquidity, risk, and growth) - a question that is under active discussion in the
literature, but over which there is little consensus as yet. 3 Instead, the model simply uses a series of
dummy variables to test whether extraordinary monetary measures may have had an effect on capital
flows over and above those coming through the modeled channels.
The results obtained from the model are broadly consistent with the existing literature on observable
factors associated with financial inflows (Alfaro, Kalemli-Oz-can and Volosovych 2008; Bruno and
Shin 2013; Gelos, Sahay and Sandleris 2011; Forbes and Warnock 2012; Fratzscher, 2012).
Capital inflows to individual developing countries correlate in particular with country ratings and a
number of global financial conditions, captured in the model by short-term U.S. interest rates, the
yield curve, and the VIX index of implied stock market volatility (a measure of market uncertainty
and risk aversion). The evidence for the effect of several other country-specific and global factors—
such as growth differentials relative to the US, and aggregate developing-world growth—is
somewhat weaker, and a number of factors, such as real interest rate differentials, are statistically
indistinguishable from zero.
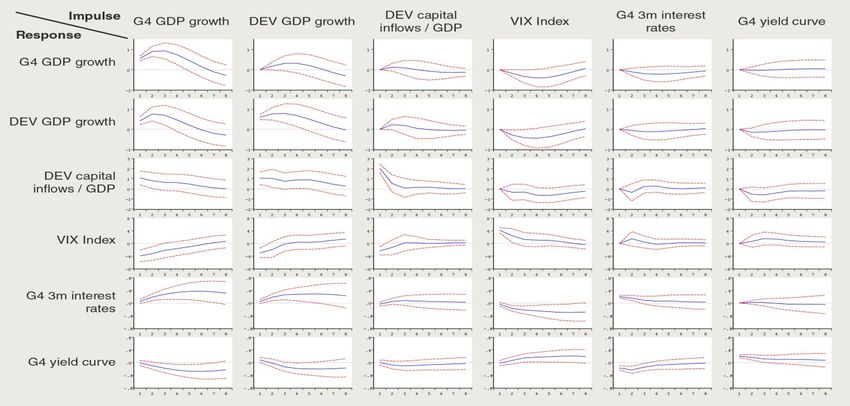
The various effects are summarized in Figure 4, which shows the response of capital inflows to a
change of one standard deviation in each of the explanatory variables. The response to market
uncertainty/risk aversion appears to be relatively small over the full sample. However, because of its
very large changes during the crisis and post-crisis periods, its variation between the first half of
2 Recent work includes Fratzscher (2012), which finds that push factors were dominant during the crisis but pull factors
were more important in the immediate recovery phase after the global crisis, while Forbes and Warnock (2012) identify
global factors, especially global risk (VIX index) as a determinant of surges. Bruno and Shin (2013) identify global factors
are dominant determinants of cross-border bank flows, particularly bank leverage and VIX. This last result may be
explained by the close relationship between banks' value-at-risk and the VIX (Adrian and Shin, 2010).
3 Most of the research that has been conducted on the impact of quantitative easing has looked at its impact on
economic activity in the United States, and there is very little consensus on those impacts. IMF (2013a) provides a useful
review of this literature, which suggests that impacts on GDP could range between 0.13 percent growth to 8 percentage
points and long-term interest rate effects that range from 75 to 200 basis points in the USA, and less than 50 to 160
basis points in the United Kingdom.
62009 and the first half of 2013 is estimated to have had the largest impact on capital inflows during
this period (Figure 5). 4
Both domestic and global factors appear to be important determinants of capital inflows to
developing countries, with global factors (U.S. interest rates, risk and the additional unmodeled
influence of quantitative easing) together accounting for about 60 percent of the increase in capital
inflows between 2009 and 2013, with the remaining 40 percent explained by domestic factors such
as countries’ institutional investor rating, and developing-country growth and growth differentials.
About 13 percent of the total variation in capital flows during this period is picked up by the
quantitative easing dummy, suggesting that capital flows were larger in the post-crisis period than
would have been expected given the levels of other variables. These effects appear concentrated on
earlier rounds of quantitative easing. When the quantitative easing indicator is split into separate
episodes corresponding to QE1, 2, and 3, the impact on inflows diminishes between successive
episodes. Indeed, when broken out, the QE3 variable is statistically insignificant— implying that by
then all of the impact of quantitative easing on capital flows has been accounted for through its
effect (if any) on the traditional drivers of capital flows.
Implications for capital flows as global conditions normalize
The preceding analysis confirms previous research suggesting that global economic conditions play a
major role in determining capital flows to developing countries.
As conditions in high-income countries improve (that is, as output gaps are closed and growth
realigns with underlying potential output), monetary policy can be expected to normalize, and the
extraordinary monetary policy measures that have been undertaken will be withdrawn. In this
context, capital flows to developing countries should adjust to a new equilibrium. Simulations based
on the panel regression results are shown in Table 1.
These simulations are conditioned on the following underlying assumptions:
• Developing and high-income country GDP growth gradually strengthens in line with the
projections presented in World Bank (2014).
• QE tapering by the U.S. Federal Reserve spans from January to December 2014, and has a
very gradual effect on market conditions. It adds 50 basis points (bp) to U.S. long-term
interest rates by the end of 2015 and a cumulative 100bp by the end of 2016. Policy rates in
the United States start to increase in 2015Q3, from 0.25 to 2 percent by the end 2016.
• The European Central Bank (ECB), Bank of Japan and Bank of England, start to unwind their
own quantitative/qualitative policies in the course of 2015-16, adding 50bp to their long term
yields by the end of the forecast horizon, and tighten policy rates later than the U.S. Fed does.
4Estimates of the relative contribution of different factors in Figure 5 were calculated by multiplying the observed
changes in short-term policy rates, yield curve, the QE episode dummy, and the risk index between the first half of 2009
and the first half of 2013 by the coefficient estimates obtained from the benchmark model.
7Box 2 Modeling the influence of high-income policy (including quantitative easing) and domestic factors
on capital inflows to developing countries
The results reported in the main text of World Bank (2014) are based on a panel econometric analysis designed to
illuminate how global and domestic economic conditions influence the volume of capital inflows to individual developing
countries. The study uses an unbalanced panel of available quarterly private capital inflows data for 60 developing
countries for the 2000Q1- 2013Q2 period, thus spanning eight years of non-crisis year capital flows, and five years of
post-crisis flows. These financial inflows comprise bond and equity portfolio flows, foreign direct investment, and cross-
border bank lending, and were derived from the IMF Balance of Payments statistics and the Bank for International
Settlements’ Locational Banking Statistics, supplemented by national sources drawn from the Datastream and Haver
Analytics databases.
The model allows for the influence on individual-country capital inflows of global economic variables (“push factors”)
that have been identified in the literature as affecting the propensity to invest, as well as country-specific “pull factors”
that capture time-varying characteristics of individual countries that may affect the allocation of funds across countries.
The observable pull and push factors include measures used to capture:
• Global financial conditions, such as the US Federal Funds rate, the US money supply (M2), and the yield curve (the
difference between the US long-term interest rate and short-term policy rates). The role of global uncertainty and
risk aversion was proxied by the VIX index.
• Real-side global conditions, such as high-income and developing world GDP growth, and the global composite
purchasing managers index (PMI), which proxies for growth expectations.
• Domestic pull factors, including country GDP levels and institutional investor ratings, a country-specific (lagged)
GDP growth differential (relative to the United States), and the interest rate differential between the developing
country vis-à-vis the United States.
The extraordinary measures taken by central banks, in the United States, Europe, and Japan are likely to have influenced
several of the global variables: short-term interest rates would have been affected by conventional monetary policy; the
structure of the yield curve would have been affected by the Federal Reserve’s purchase of mortgage-backed securities
and long-term debt on secondary markets; and market uncertainty along with U.S. and global growth may have benefited
from stimulatory monetary and fiscal policies. To the extent that such measures may have influenced these drivers, their
influence on capital flows will have been captured in the regression.
To account for the possibility that extraordinary monetary measures have operated through other unobservable channels
(or through conventional channels over and above these observable measures), a series of dummy variables covering the
different episodes of quantitative easing were also included. Several alternative specifications were experimented with,
including: a single QE dummy variable for all episodes of quantitative easing; separate indicator variables for each of the
three episodes; and a continuous measure of QE interventions based on QE-related assets on central bank balance
sheets. A non-zero coefficient on these dummies can be interpreted as indicating that there were additional influences on
capital flows to developing economies from quantitative easing that are not directly attributable to observable measures.
The baseline estimation employs econometric techniques that address the influence of time-invariant unobserved country
effects, a time trend, and the possibility of bias due to the inclusion of a lagged dependent variable. In addition to the
baseline, several additional variations were explored.
To ascertain whether quantitative easing may have altered the magnitude of the influence of the conventional
transmission channels (say by making flows more sensitive to interest rate developments), a specification that allowed for
interactions between the indicator and the observable global variables was considered. However, this specification was
not retained as there was little evidence in favor such interaction effects. Furthermore, specifications that included market
expectations of future interest rate changes were considered, but not retained because these expectations variables were
not statistically significant.
The model is robust to several different specifications of the explanatory variables, as well as the inclusion of other
variables that may plausibly explain capital flows. Lagged ratios of private credit as a share of GDP (financial depth),
trade/GDP (trade openness), external debt/GDP, and real exchange rate appreciation were included in alternative
specifications but did not prove to be statistically significant.
More details including benchmark regression results and the regression results for the constituent components of capital
inflows, are provided in annex 2 (see also Lim, Mohapatra and Stocker 2014).
8The VAR model described in box 3, which maps out the inter-temporal relationships between GDP
growth in high-income and developing regions, global interest rates, and uncertainty/risk taking,
suggests that the VIX index will gradually rise back toward its long-term average of close to 20 by
2016, some 25 percent above current low levels.
Feeding these global “push factors” into the earlier panel regression results points to a baseline
decline of capital inflows (relative to a “no change” scenario) of about 10 percent by 2016, or 0.6
percent of developing-country GDP by 2016 (see Table 1).
These results confirm that a gradual normalization of global conditions would be accompanied by a
modest retrenchment of capital inflows as a percentage of developing-country GDP, although
remaining broadly in line with average levels between 1990 and 2003.
Looking a bit deeper
The above results refer to the sum of all capital inflows (portfolio flows, international bank lending,
and foreign direct investment). When inflows are decomposed into their constituent components,
portfolio flows are both the most volatile and the most sensitive to the external drivers associated
Box 3 Modeling the inter-temporal adjustment of capital inflows
Dynamic interactions between global “push” factors, capital inflows and GDP growth in developing countries are
captured using a six-dimensional vector autoregression model (VAR), estimated over the period 2000Q1 to 2013Q2
(see annex 3 for a detailed description). The VAR jointly models aggregate private capital inflows to developing
countries as a share of their combined GDP; real GDP growth in both developing and G-4 countries (the United
States, Euro Area, Japan and the United Kingdom); G-4 short-term interest rates; the G-4 yield curve (ten-year
government bond yields minus 3-month interest rates), and the VIX index of implied stock market volatility, a
popular measure of the pricing of financial market risks.
The impulse response of aggregate capital inflows in developing countries to a one standard deviation shock in the
other five variables is presented in Figure 3. 1. At first sight, changes in growth patterns between developing and G4
countries seem to be dominant drivers, with the effect of shocks persisting for about a year and a half. Rising risk
aversion (increase in the VIX) and a steepening of the G-4 yield curve are both associated with lower capital inflows
(as a share of GDP), with peak effects after about four quarters. The direct impact of changes in short-term interest
rates in the G-4 region is small.
Further investigation shows more complex interactions between global factors and highlights the central role of
market uncertainty and changes in risk assessments in the transmission of monetary shocks. In particular, an
increase in the VIX index leads within four quarters to lower short-term interest rates, a steepening of the yield
curve, and weaker growth in the G4 and developing countries. In other words, the impact of market distress on
global growth and the slope of the yield curve serve to amplify the initial effect of increased uncertainty on capital
inflows.
For the sample period, the model suggests that changes in risk aversion explain around 10 percent of the variance of
GDP growth in both G-4 and developing regions, 20 percent of changes in the yield curve and 25 percent of
changes in short term rates (Figure 3. 2).
In addition, the VIX index is itself the variable in the model most sensitive to changes in monetary conditions, with
lower interest rates reflected within two to three quarters in lower risk aversion. About 8 percent of the variance of
VIX is explained in the model by such change in monetary conditions.
These results are consistent with recent studies, which tend to assign a similar or even bigger role of interest shocks
in determining the price of risk, and in explaining the international transmission of monetary policy through
financial flows and asset prices (Bruno and Shin 2013; Bekaert, Hoerova and Lo Luca 2012; Rey 2013).
9with global financial conditions.
Estimates of the capital flow model performed on each individual component suggest that
equilibrium portfolio flows are sensitive to changes in short-term interest rates, the yield curve, and
global risk aversion, as well as to the QE indicator. Equilibrium foreign direct investment, in
contrast, tends to be relatively insensitive to the effects of global push factors, although such flows
are much more responsive to country-specific credit ratings, a result consistent with the literature
(Alfaro, Kalemli-Ozcan and Volosovych 2008; Dailami, Kurlat, and Lim 2012).
Cross-border bank lending falls into an intermediate category. In particular, the coefficient on the
QE dummies was the largest for bank lending—suggesting that more so than for the other flows
QE operated through channels other than those modeled to boost bank lending. At the same time,
bank lending was also much less sensitive to the observable fundamental factors. This suggests that
the response of overall inflows to global risk conditions and QE-specific effects are driven to a 3.6).
When flows into developing-country bond and equity mutual funds (a subset of portfolio flows) are
considered, the sensitivity of these flows to changes in both the short-term interest rate and yield
curve is much higher than for overall portfolio flows, and for other types of capital flows.
To the extent that this historical pattern persists over future tapering scenarios, portfolio flows are
estimated to decline in the first year by 33 percent, while bank lending falls to a much smaller extent,
and FDI hardly move at all (under the gradual tightening scenario). Partly as a result, the impact on
regional capital flows may turn out to be very different.
For regions such as East Asia and the Pacific (excluding China) and Europe and Central Asia—
where portfolio flows represent 53 and 45 percent of total flows respectively—enduring declines in
inflows may be significantly larger than the declines in regions like Latin America, the Middle-East
and North Africa, or South Asia where portfolio flows are a much smaller proportion of total flows
(Figure 7).
Sub-Saharan Africa sustains the third largest impact among the six regions, as capital flows are a
particularly large share of Sub-Saharan Africa’s GDP (see Figure 2), even though portfolio flows are
a relatively small share of overall flows (outside of South Africa, FDI is the dominant type of capital
inflows—72 percent of the total).
Tracking the dynamic behavior of capital inflows and overshooting risks
The foregoing results assume that monetary authorities in high-income countries are able to
engineer a gradual increase in long-term interest rates as quantitative easing is withdrawn in line with
improved growth conditions.
However, the experience of the summer of 2013—when the yield on 10-year U.S. Treasury bills
jumped by some 100 basis points in a just a few months—suggests that a smooth market reaction to
the actual tapering of quantitative easing is not assured. The next set of results considers the impacts
on capital inflows of two alternative scenarios:
• “Fast normalization”: long-term interest rates snap up by 100 basis points in the first half of
2014, before gradually converging back to baseline levels over the subsequent two years;
10• “Overshooting”: market reactions are assumed to be more abrupt, resulting in a sharp (200
bp) increase in long-term interest rates in first half of 2014, followed by a more protracted
adjustment back to the baseline;
Box 4 A live experiment: tapering expectations and capital inflows during the summer of 2013
The simulations derived from the vector autoregression (VAR) model can be compared with actual developments
following the Fed tapering announcement in May 2013. After the conditions for the unwinding of quantitative easing
were outlined by the Fed chairman in a congressional testimony on May 22 2013, the U.S. long term interest rates
suddenly shot up by 100bp and the VIX index initially rose from 15 to 20. Emerging market bond spreads increased
significantly, and issuances of developing-country bond, equity, and syndicated bank loans dropped by around 50
percent during the summer (Figure 4. 1).
Although bond, equity issuances and syndicated bank flows are conceptually different from the private capital inflow
data reported in the balance of payment statistics and used in our modeling strategy, the observed deceleration of
flows during the summer of 2013 appear largely consistent with the elasticities estimated in the VAR model.
Counterfactual simulations show that the decline predicted by the VAR model would have been of similar magnitude
albeit more gradual than actually observed (Figure 4. 1). As presented in the “fast adjustment” scenario , a 100bp
shock to the yield curve generally translates within two quarters into a drop in inflows of around 50 percent, with the
VIX index predicted to increase by six points.
The observed impact of financial market tensions during the summer was also reflected in a deteriorated outlook for
many developing economies, particular among those considered most vulnerable (Figure 4. 2).
The vector autoregression (VAR) model described in Box 3 was used to explore inter-temporal
adjustments between capital inflows, growth and global financing conditions, in order to assess the
risk of a disorderly transition and sudden stops in financial inflows.
Figure 8 illustrates the adjustment path for three of the co-determined variables (capital inflows to
developing economies; long-term interest rates and the VIX index of stock market volatility) under
different scenarios.
In the baseline, the capital flow projections resulting from the VAR simulations are very similar to
those drawn from the panel regression, with the share of capital inflows to GDP in developing
countries declining by 0.5 percent over the projection horizon.
In the two more extreme scenarios, deviations from the baseline are pronounced.
In the “fast normalization” scenario, the resulting increase in market volatility and rising risk
aversion leads to a sharper but partially temporary correction in flows. In this context, private capital
inflows drop by an average 30 percent in 2014, with a peak impact of 50 percent toward the end of
the year.
As discussed in Box 4, the magnitude of these simulated effects is broadly consistent with the
adjustments observed during May-September 2013, a period that lies mainly outside of the
estimation period of the model.
In the “overshooting” scenario, where long-term interest rates spike initially by 200 bp, flows would
then drop by 45 percent in 2014 as whole and up to 80 percent at the peak impact.
11Such a correction, albeit temporary, would have an important bearing on the probability of isolated
or more diffused crises under different macroeconomic scenarios. This issue is addressed in the last
section of this paper.
Box 5 Surges, stops and aggregate capital inflows
As discussed, in the main text, capital inflow surges tend to precede financial crises, and crises tend to occur at the
same time as sudden stops. The surge in capital inflows in the pre-crisis period was typical (Figure 5. 1), as some 80
percent of developing countries in the sample suffered a sudden stop in its aftermath. The post-crisis rebound, which
also classifies as a surge, was again followed by an increased incidence in stops, with 15 percent enduring such
episode during 2012-13. The methodology used here to identify surge and stop episodes at the individual country
level is based on Forbes and Warnock (2012), with the threshold being defined as changes in flows larger than one
standard deviation around a five-year rolling mean.
The link between aggregate capital inflows to developing countries and the proportion of these countries going
through either surge or stop episodes can be approximated empirically using a simple vector autoregression model
approach. Over the period 2000Q1 to 2013Q2, the relationship can be summarized with the accumulated impulse
response presented in Figure 5. 2.
Overall, a decline of one standard deviation in the ratio of aggregate capital inflows to GDP (corresponding to a
decline of about 2.7 percent of GDP), tends to increase the proportion of countries experiencing sudden stops to 22
percent after four quarters. In the “overshooting” scenario presented in the text, capital inflows are predicted to
decline by 3.5 percent of GDP, implying that more than a quarter of developing countries could experience sudden
stops in such scenario.
4. Disequilibrium risks
The preceding analysis suggests that in the long run, the withdrawal of quantitative easing and a
return to a tighter monetary policy in high-income countries will have a relatively small impact on
capital inflows, reducing them from 4.6 percent of developing-country GDP in 2013Q3 to 4.0 by
the end of 2016. However, the path to this new normal level of flows will matter.
If market reactions to tapering decisions are precipitous, developing countries could see flows
decline by as much as 80 percent for several months. That would raise the likelihood of abrupt stops
at the country level, with more than 25 percent of individual economies experiencing such an
episode in these circumstances (box 5).
While this adjustment period might be short-lived, it is likely to inflict serious stresses on the
financial and economic conditions in certain countries–potentially heightening crisis risks.
A brief history of crises in developing countries
According to data compiled by the International Monetary Fund (Laeven and Valencia 2012), there
were some 147 financial crises globally between 1970 and 2011 (Figure 9). Of these, 123 occurred in
what are now classified as developing countries, and 95 developing countries had at least one crisis.
12These crises have tended to occur in clusters, with currency crises and banking crises much more
common occurrences than sovereign debt crises. The clustering suggests that crises are either being
caused by common factors or that there are important contagion effects.
Crises in developing countries generally follow a period of surging capital inflows, and occur on the
same year as a sudden retrenchment (Figure 10). This is particularly clear for banking crises, as 34
percent of them occurred within two years after a period of strong capital inflows to the country,
versus only 20 percent for currency crises and 17 percent for sovereign debt crises. Banking crises
also tend to be more strongly correlated with sudden stops in capital inflows on the year of the
crisis, although the direction of causality is unclear. Moreover, the evidence suggests that having had
a banking crisis in the preceding two years increases the likelihood of a sovereign debt or currency
crises, whiles these other kinds of crises do not increase the likelihood of later banking crises to the
same extent. 5
A more formal look at banking crises
An econometric analysis of the factors associated with an increased probability of crises in
developing countries tends to confirm the links between the incidence of these crises, global factors,
and individual country characteristics and vulnerabilities (box 6).
The empirical literature on banking crises is quite large. 6 While early work typically focused on
domestic causes of banking crises, especially in a developing-country context, more recent work has
focused on the effects of outside 3.9 forces, such as global monetary and financial developments and
contagion, on the likelihood of a crisis in a given country. 7
Relative importance of global, contagion, and domestic factors
The regression results generally confirm the influence of both global and domestic factors in
determining the onset of banking crisis (annex 4 table A4.3). The modeling strongly suggests that the
risk of a banking crisis rises with an increase in global risk aversion, rising global interest rates and
tightening of global liquidity—especially after a period of loose global monetary conditions.
Among the contagion variables examined, only the trade linkages variable (the share of trade with
other countries in crisis) was consistently statistically significant.
5 In the two years following a banking crisis, a country has a 28 percent chance of having a currency or sovereign debt
crisis. In contrast, the likelihood of a banking or sovereign debt crisis following a currency crisis is broadly the same (c.
20 percent) as is the likelihood of one occurring before the crisis or after the currency crisis. Taken together, this data
suggests that banking crises tend to cause currency and sovereign debt crises in a way that those kinds of crises do not
cause bank crises – an intuition that formal tests of granger causality confirm.
6 Eichengreen and Rose (1998) and Eichengreen and Arteta (2000) provide extensive review of the cross-country
empirical literature on banking crises with a focus on developing countries. See also Reinhart and Rogoff (2009) for
more recent discussion of the developments in the literature.
7 Earlier literature that emphasized the importance of global factors in explaining financial crises are, among others,
Frankel and Rose (1996), Eichengreen, Rose, and Wyplosz (1996), Eichengreen and Rose (1998), Frankel and Roubini
(2001), and Reinhart and Rogoff (2009). Forbes and Warnock (2012) examines the importance of global, contagion, as
well as domestic factors in explaining extreme episodes of capital flows, although it tends to focus on high income and
emerging economies. For a recent treatment of global and contagion factors in the literature of financial stress
transmission, see for example IMF (2013b).
13As expected, domestic factors play a critical role in determining whether an individual country enters
into crisis. High levels of foreign and short-term debt, an earlier period of rapid domestic credit
growth (measured as the change in domestic credit to GDP ratios over the previous five years), low
levels of international reserves, and an overvaluation of the real exchange rate all increase the of risk
of banking crises.
Figure 11 reports the estimated sensitivity of banking crises to the different variables identified in
the econometric work. It shows the absolute value of the relative importance of each identified
factor in contributing to an increase or decrease in the likelihood of a crisis. 8
Box 6 The banking-crisis regression model
The probability that a country will suffer a banking crisis is modeled as a function of global factors, contagion factors,
and domestic factors. To assess the role of all three sets of factors on the likelihood of a crisis in a given developing
country, a pooled probit model is estimated (see annex 4 for a detailed description).
The modeling work focuses on banking crises in developing countries using crisis data developed by Laeven and
Valencia (2012) because the determinants of banking causes in developing countries may be distinct from those of
high-income countries (Eichengreen, Rose, and Wyplosz 1996, Eichengreen and Rose 1998, Eichengreen and Arteta
2000). To avoid sample selection problems, explanatory data for the 67 developing countries that did not have a
banking crisis are added to the 95 developing countries in the Laeven and Valencia data set, all of which had a banking
crisis during the sample period. Observations for the three years following a crisis are dropped from the panel, so that
the explanatory power of domestic factors that may have triggered a crisis are not diminished by inclusion of their
post-crisis period when the binary crisis variable would be zero. All explanatory variables except global factors are
entered with a one period lag in order to minimize endogeneity problems.
Global factors
Seven measures of global effects were tested for the model: global risk appetite, global interest rates, global growth,
global liquidity, global bank leverage, and global commodity prices. Global risk appetite was measured by the Chicago
Board of Trade Volatility Index (VXO), a measure commonly used to capture risk appetite in the global financial
markets. Global growth is measured by the first principal component of real GDP growth in the Euro Area, Japan,
United Kingdom, and the United States. Global liquidity is proxied by M2 as a share of GDP in the United States.
Global interest rates are measured by the first principal components of rates on long-term government bonds in
Germany, Japan, United Kingdom, and the United States. Global commodity prices are measured by the agricultural
commodity index and energy commodity index.
Contagion factors
Following Forbes and Warnock (2012) and IMF (2013a), but giving precedence to variables that allowed for a wider
country coverage, four variables were included to capture contagion effects: trade openness, trade linkage, financial
linkage, and regional contagion. Trade openness is measured by a country’s trade with the rest of the world scaled by
its GDP. Trade linkage is defined as the bilateral trade volume between two countries (scaled by each country’s total
trade with the rest of the world) and multiplied by an indicator variable defined as equal to 1 if the trading partner is
experiencing a banking crisis, and to 0 otherwise. Financial linkage is defined as the total bank claims between a
country and BIS reporting banks scaled by GDP to capture the country’s degree of integration with the global
financial markets and hence exposure to financial contagion. Regional contagion is defined as the number of countries
in the same region experiencing a banking crisis.
Domestic factors
Ten separate variables were considered to capture country-specific factors: current account and fiscal balance, total
8 external debt and a the
More specifically, share of short
figure term
shows thedebt, domestic
estimated creditofgrowth,
impact inflation, per capitashock
one standard-deviation GDPtogrowth, ratio of
each variable M2
on to
the
reserves, risk
predicted ratioofofbanking
reserves to imports,
crisis. Using theand a measure
absolute value of
of real exchange
coefficient rate overvaluation.
facilitates The
comparison of definition
relative of eachof
importance
variable in
variables is shown in Table
influencing the A4.2 in therisk.
predicted annex
See4.Chuhan, Classens, and Mamingi (1998) and IMF (2013a) for applications
of similar approaches.
14Empirically, between 1970 and 2011 the global variables have played the largest role, explaining
about 58 percent of the changes in the risk of banking crisis at the country level. Domestic factors—
particularly credit growth over the previous five years, short-term debt, and the level of international
reserves—are also important contributors to risk. Changes in domestic variables explain 29 percent
of all the variation in risk over the sample period.
Box 7 Monetary policy, domestic credit growth and country-specific vulnerabilities
The “imported” easing of monetary conditions through large capital inflows in recent years has contributed to rapid
credit expansion, widening current account deficits, and increasing banking sector vulnerabilities in some cases.
The surge of capital flows in the post-crisis period has contributed to lenient domestic credit conditions, directly
through cross-border intermediation channels and indirectly through exchange rate and monetary policy spillovers.
Regarding the latter, a simple Taylor Rule predicting the monetary policy stance of central banks in developing
countries on the basis of domestic conditions (deviation of consumer price inflation from the policy target and the
level of slack in the economy) suggests that policy rates were kept lower than normally suggested during periods of
large capital inflows (Figure 7. 1 and He & McCauley (2013)).
In this context, domestic credit has grown very rapidly in several developing countries in recent years, increasing the
vulnerability of some economies to a rapid tightening of financing conditions. Outstanding credit exceeds 100
percent of GDP in 15 developing economies, and rose as a share of GDP by 15 or more percentage points in about
40 developing economies between 2007 and 2012. The sharpest upsurges were recorded in Thailand, Armenia,
China, Malaysia, Morocco and Turkey (Figure 7. 2). Robust real credit growth continued during 2012 and 2013 in
Cambodia, Argentina, Armenia, Indonesia, and Paraguay. Monetary, fiscal, and regulatory tightening in several
countries, including China, Brazil, India, and Indonesia, has helped contain a further buildup of credit risks, but
banks’ exposure to rising interest rates has become an increasing source of concern since the start of QE tapering
expectations.
That said, it should be recognized that domestic variables are not entirely independent of external
variables. In particular, as discussed in box 7, loose financial market conditions at the global level
can feed through to rapid credit growth, exchange rate changes, and fluctuations in reserves at the
domestic level.
The main difference between countries is that, while developing economies do not have the policy
levers with which to affect global financial conditions, they can influence the extent and manner in
which these bleed through into the domestic economy (see following discussion on policy).
Model prediction
Probability models like the one used here to estimate the sensitivity of banking crises to external,
domestic, and contagion factors tend to have low predictive power because the events they model
are low-probability events.
One measure of the adequacy of predictive power of the model is the proportion of threshold
events it correctly predicts (and the proportion of non-events that it correctly predicts). By these
measures, the model outlined in column 5 of annex table A4.3 does a reasonable job in predicting
banking crises in developing countries—a conclusion supported by the AUROC statistic of more
than 80 percent in the preferred model specification (see annex 4 for a discussion of alternative
measures of predictive accuracy of the model).
15Another measure is to compare the prediction of the model with actual events (within-sample
prediction). Figure 12 plots the estimated probability of a crisis for six of the eight countries that had
banking crises in 2008–09 compared with the average predicted risk for all countries during the same
period. 9 In all cases, the model suggests an above-average risk of crisis for those countries that did
have a crisis. Moreover, for all countries, the predicted risk of crisis increased rapidly before and
including the year of crisis. However, in the cases of Mongolia and Nigeria, the predicted likelihood
of banking crisis was only marginally higher than the average for all countries.
Assessing current risks
Given current conditions, empirical analysis of banking crisis risks suggests that several countries
might be subject to heightened vulnerabilities.
Figure 13 presents key domestic risk factors in these countries. The shaded area in the center
indicates average values of risk indicators in each region. The thick line represents the average values
of risk indicators for countries whose predicted crisis risk are particularly elevated (one standard
deviation above the average predicted risk of the entire sample).
Although conditions on the ground will vary and these kinds of gross indicators need to be
interpreted with a great deal of caution, the results are instructive and point to areas of vulnerability
that individual countries may need to address if they are to reduce risks of a crisis as external
conditions tighten.
• In the East Asia and Pacific region, rapid credit expansions over the past five years and a rising
ratio of short-term debt in total debt are common areas of concern.
• A high external debt to GDP ratio, which exposes countries to exchange rate and rollover risk,
is an issue in several Central and Eastern European economies, with a heightened share of
short-term debt in that total being a further concern in several others. A high short-term debt
ratio makes a given level of debt much more sensitive to the short-term swings in investor
sentiment or capital flows that might occur in the fast tightening and overshooting scenarios
discussed earlier. Rapid credit growth is a further issue of common concern in the region, with
credit to GDP ratios have risen sharply over the past five years in several economies—
increasing the sensitivity of loan quality (and bank solvency) to the kind of sharp rise in
interest rates discussed above.
• In Latin America and the Caribbean, fewer countries appear to be at immediate risk, with rapid
credit growth combining with significant short-term debt ratios as the main sources of risk.
• In the Middle East and North Africa, political turmoil has cut deeply into economic growth in
recent years (World Bank, 2014). Banking-sector risks stem mainly from its exposure to
domestic credit quality and government financing needs, against the background of a
deterioration in current account positions.
9In the Laeven and Valencia (2012) data, eight developing countries had banking crisis in 2008–09 (compared with 15 in
high-income countries): Hungary, Kazakhstan, Latvia, Mongolia, Nigeria, Russian Federation, Slovenia, and Ukraine.
Hungary and Slovenia were not included in the prediction sample because of missing data in external debt (Slovenia) and
short-term debt (Hungary and Slovenia).
16You can also read