Progress on Level of Water Stress - Global baseline for SDG indicator 6.4.2 2018 - UN-Water
←
→
Page content transcription
If your browser does not render page correctly, please read the page content below
Progress on
Level of Water Stress
Global baseline for SDG indicator 6.4.2

               2018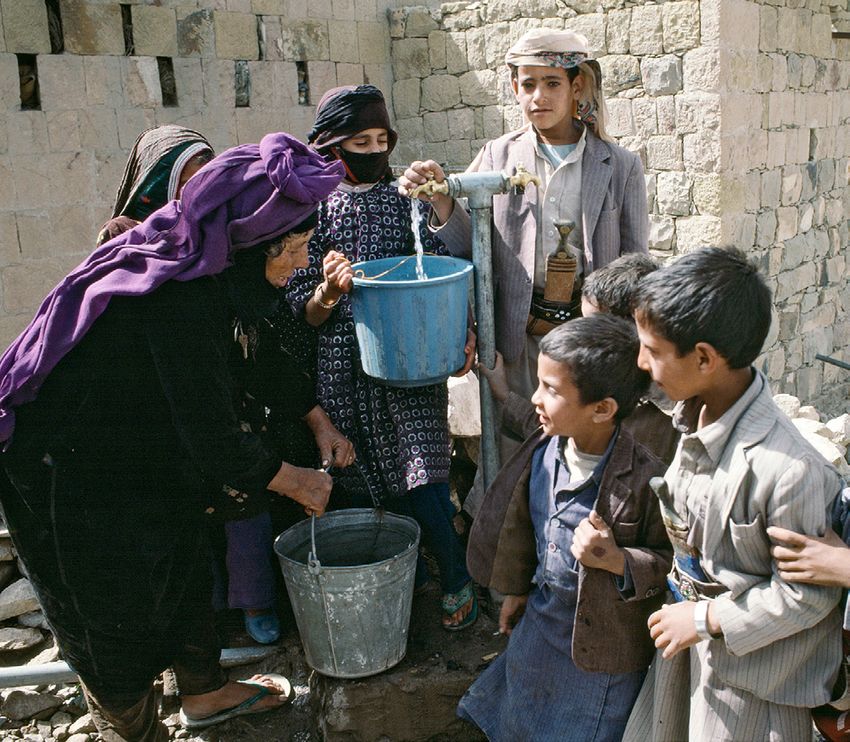
Progress on
 Level of Water Stress
Global baseline for SDG indicator 6.4.2

               2018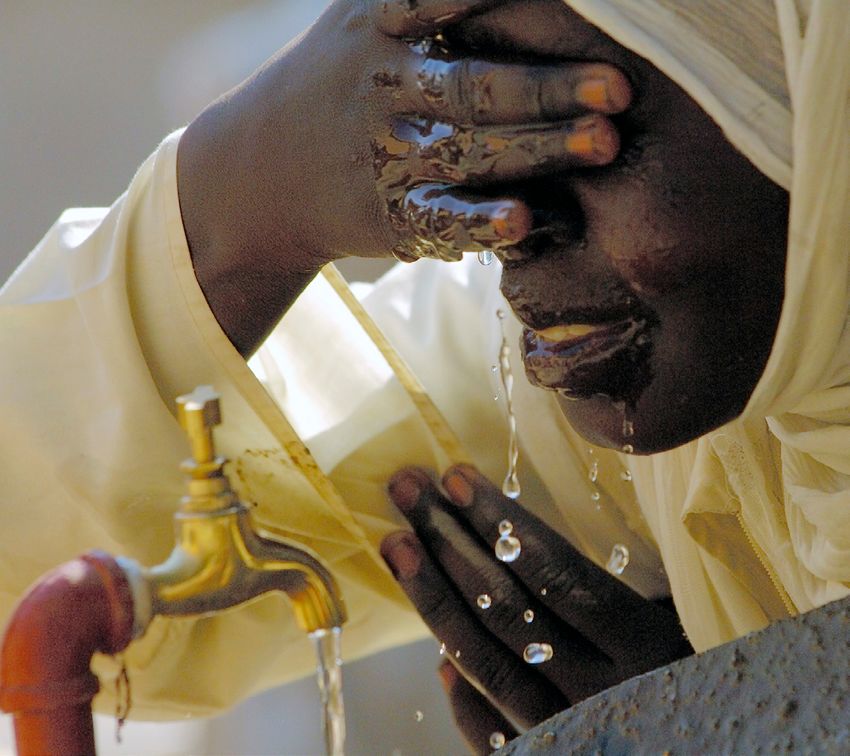
Cover: IWRM AIO SIDS/Creative Commons
Presenting the UN-Water
Integrated Monitoring Initiative for SDG 6
Through the UN-Water Integrated Monitoring Initiative for Sustainable Development Goal (SDG) 6, the United Nations
seeks to support countries in monitoring water- and sanitation-related issues within the framework of the 2030
Agenda for Sustainable Development, and in compiling country data to report on global progress towards SDG 6.

The Initiative brings together the United Nations organizations     The objectives of the Integrated Monitoring Initiative are to:
that are formally mandated to compile country data on the
SDG 6 global indicators, who organize their work within three       •   Develop methodologies and tools to monitor SDG 6 global
complementary initiatives:                                              indicators

•   WHO/UNICEF Joint Monitoring Programme for Water                 •   Raise awareness at the national and global levels about SDG 6
    Supply, Sanitation and Hygiene (JMP)1                               monitoring
    Building on its 15 years of experience from Millennium
                                                                    •   Enhance technical and institutional country capacity for
    Development Goals (MDG) monitoring, the JMP looks after
                                                                        monitoring
    the drinking water, sanitation and hygiene aspects of SDG 6
    (targets 6.1 and 6.2).                                          •   Compile country data and report on global progress towards
                                                                        SDG 6
•   Integrated Monitoring of Water and Sanitation-Related SDG
    Targets (GEMI)2                                                 The joint effort around SDG 6 is especially important in terms of
    GEMI was established in 2014 to harmonize and expand            the institutional aspects of monitoring, including the integration
    existing monitoring efforts focused on water, wastewater and    of data collection and analysis across sectors, regions and
    ecosystem resources (targets 6.3 to 6.6).                       administrative levels.

•   UN-Water Global Analysis and Assessment of Sanitation           To learn more about water and sanitation in the 2030 Agenda for
    and Drinking-Water (GLAAS)3                                     Sustainable Development, and the Integrated Monitoring Initiative
    The means of implementing SDG 6 (targets 6.a and 6.b) fall      for SDG 6, visit our website: www.sdg6monitoring.org
    under the remit of GLAAS, which monitors the inputs and the
    enabling environment required to sustain and develop water
    and sanitation systems and services.

1
  http://www.sdg6monitoring.org/about/components/jmp/
2
  http://www.sdg6monitoring.org/about/components/presenting-gemi/
3
  http://www.sdg6monitoring.org/about/components/glaas/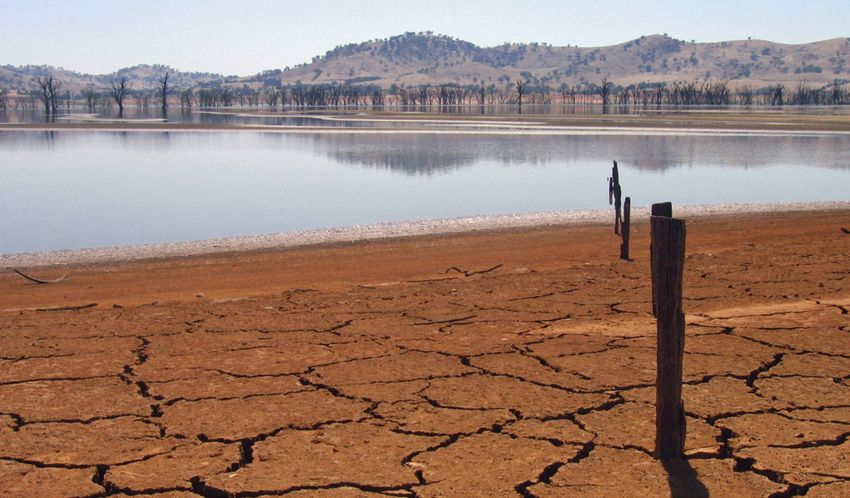
CONTENTS
Foreword                                                                                                      6
by Gilbert F. Houngbo, UN-Water Chair and President of the International Fund for Agricultural Development

Foreword                                                                                                      7
by René Castro-Salazar, Assistant Director-General Climate, Biodiversity, Land and Water Department
and Food and Agriculture Organization of the United Nations (FAO)

Acknowledgements                                                                                              9

Executive summary                                                                                            10

Key messages and recommendations                                                                             13

1. Introduction and background                                                                               14

2. Method and process                                                                                        18
     2.1. Methodology                                                                                        19
          2.1.1. About the methodology developed by GEMI                                                     19
          2.1.2. Applying and testing the methodology in the five pilot countries                            23
          2.1.3. The monitoring ladder                                                                       24
     2.2. Stakeholders and sources of data                                                                   25
          2.2.1. Stakeholders involved                                                                       25
          2.2.2. Sources of data by variable type                                                            26
     2.3. Data-collection process                                                                            30
          2.3.1. Approach                                                                                    30
          2.3.2. Use of international data sources                                                           30
          2.3.3. Challenges and opportunities                                                                31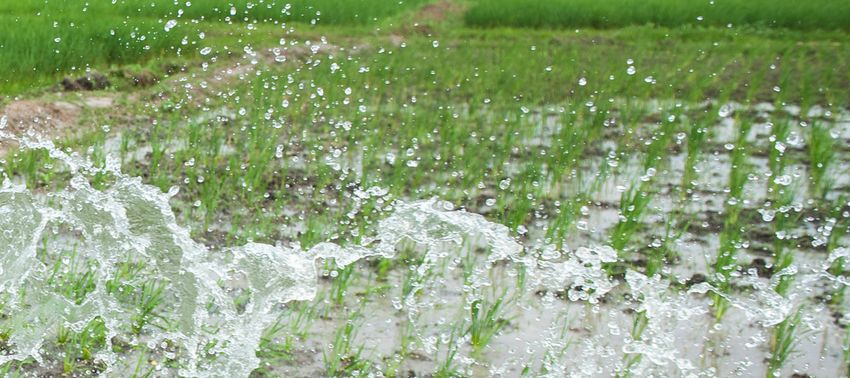
Elijah Yoursee, a farmer in Paynesville, Liberia, waters a rice field. Photo: Albert Gonzalez Farran/UNMIL

3. Results and analysis                                                                                                             33
      3.1. Global and regional estimates for indicator 6.4.2                                                                        34
      3.2. Considerations about data availability at the global level                                                               38

4. Conclusions                                                                                                                      40

References                                                                                                                          44

Annex 1. Country data for the water stress indicator                                                                                45
Annex 2. Countries in regions                                                                                                       51
Annex 3. International Standard Industrial Classification of All Economic Activities (ISIC), Rev.4                                  54

Learn more about progress towards SDG 6                                                                                             55
6

                      FOREWORD
    Water is the lifeblood of ecosystems, vital to human health and well-being and a precondition
    for economic prosperity. That is why it is at the very core of the 2030 Agenda for Sustainable
    Development. Sustainable Development Goal 6 (SDG 6), the availability and sustainable
    management of water and sanitation for all, has strong links to all of the other SDGs.

    In this series of progress reports under the UN-Water Integrated Monitoring Initiative for SDG 6,
    we evaluate progress towards this vital goal. The United Nations organizations are working
    together to help countries monitor water and sanitation across sectors and compile data so
    that we can report on global progress.

    SDG 6 expands the Millennium Development Goal focus on drinking water and basic sanitation
    to include the management of water and wastewater and ecosystems, across boundaries of all
    kinds. Bringing these aspects together is an essential first step towards breaking down sector
    fragmentation and enabling coherent and sustainable management, and hence towards a
    future where water use is sustainable.

    This report is part of a series that track progress towards the various targets set out in SDG 6
    using the SDG global indicators. The reports are based on country data, compiled and verified
    by the responsible United Nations organizations, and sometimes complemented by data from
    other sources. The main beneficiaries of better data are countries. The 2030 Agenda specifies
    that global follow-up and review “will be primarily based on national official data sources”, so
    we sorely need stronger national statistical systems. This will involve developing technical and
    institutional capacity and infrastructure for more effective monitoring.

    To review overall progress towards SDG 6 and identify interlinkages and ways to accelerate
    progress, UN-Water produced the SDG 6 Synthesis Report 2018 on Water and Sanitation. It
    concluded that the world is not on track to achieve SDG 6 by 2030. This finding was discussed
    by Member States during the High-level Political Forum on Sustainable Development (HLPF) in
    July 2018. Delegates sounded the alarm about declining official development aid to the water
    sector and stressed the need for finance, high-level political support, leadership and enhanced
    collaboration within and across countries if SDG 6 and its targets are to be met.

    To achieve SDG 6, we need to monitor and report progress. This will help decision makers identify
    and prioritize what, when and where interventions are needed to improve implementation.
    Information on progress is also essential to ensure accountability and generate political, public
    and private sector support for investment. The UN-Water Integrated Monitoring Initiative for
    SDG 6 is an essential element of the United Nations’ determination to ensure the availability and
    sustainable management of water and sanitation for all by 2030.

                                  Gilbert F. Houngbo
    UN-Water Chair and President of the International
                 Fund for Agricultural Development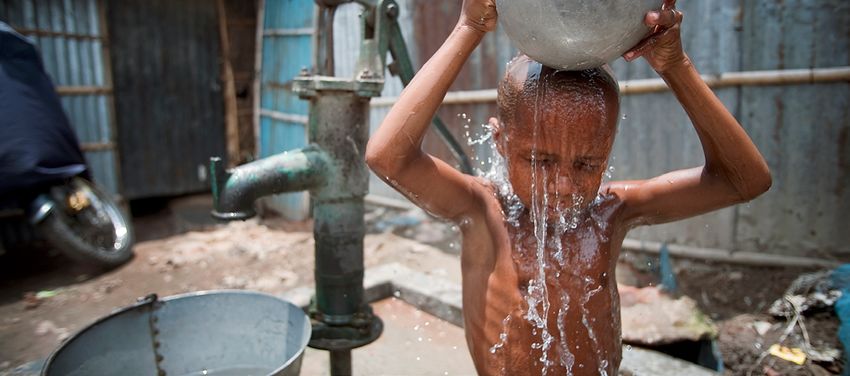
7

                  FOREWORD
It is my pleasure to present this report, which sets the baseline for monitoring indicator 6.4.2
– Level of water stress – in the context of the Sustainable Development Goals (SDGs) global
report.

Since few countries have the natural and financial resources to continue increasing
water supplies as demand increases, better, more efficient and more productive use of water
resources is essential for our future and the future of the planet. This report addresses the
importance of reducing water stress, which is a measure of the pressure that human activities
exert on natural freshwater resources, providing an indication of the environmental sustainability
of the use of water resources.

Water stress is defined as the proportion of water withdrawal by all sectors in relation to the
available water resources. The global average for this proportion is 13 per cent. Water stress
affects every continent, hinders sustainability and limits social and economic development. More
than 2 billion people live in countries experiencing high water stress. Although the global
average water stress is only 13 per cent, 32 countries experience water stress between
25 per cent (when stress begins) and 70 per cent, and 22 countries are above 70 per cent
and considered seriously stressed.

While agriculture remains by far the largest water user, accounting for nearly 70 per cent of
all water withdrawals globally, its share in the overall sectoral distribution is decreasing. This
indicates that other uses are growing and that sustainability in the use and management of
water resources requires a collective and coordinated effort among all the actors involved.
Alternative water sources such as wastewater, storm run-off and desalination, as well as
measures such as water harvesting, can help relieve water stress. Safe wastewater reuse and
recycling is a significantly untapped resource for industry and agriculture, but its use must
overcome political and cultural barriers.

One of the key premises of the 2030 Agenda for Sustainable Development is “leaving no one
behind”. To achieve this, the interlinkages between its 17 SDGs need to be well understood and
appropriate actions undertaken for the benefit of all, including addressing socioeconomic and
gender inequalities.

Within this framework, SDG target 6.4 is particularly relevant as it focuses on ensuring that water
resources are sufficient for all users, and that such availability is the outcome of a deliberate
management of these resources. The Food and Agriculture Organization (FAO), in coordination
with other United Nations agencies through UN-Water, supports countries in implementing this
target, through direct actions in the agricultural and environmental fields and by supporting the
assessment of progress towards achieving it.

To this end, FAO has joined the Integrated Monitoring Initiative, which has gathered experiences
and resources aimed at ensuring a coherent monitoring framework for water and sanitation by
2030. Such a framework will help countries achieve progress through well-informed decision-
making on water, based on harmonized, comprehensive, timely and accurate information.
More data, enabling a disaggregated analysis of the pattern of water use at the basin level, will
be needed to provide better insights for decision makers, both at the global and the country level.

FAO, predominantly through its AQUASTAT database, remains committed to improving the
quality and quantity of data produced and analysed, in close partnership with the relevant
authorities of our Member States. This report is an important step towards a more widespread
and operational knowledge of the status of water resources and the sustainability of their use.

                                René Castro-Salazar

                         Assistant Director-General
Climate, Biodiversity, Land and Water Department
         Food and Agriculture Organization of the
                              United Nations (FAO)
9 ACKNOWLEDGEMENTS This report was prepared by Alba Martinez Salas, FAO Consultant, with the supervision of Riccardo Biancalani and the collabora- tion of Lucie Chocholata of the FAO Land and Water Division. The authors wish to acknowledge Paul Glennie (UN Environment) and Andrei Jouravlev (ECLAC) for their valuable comments on the draft report. They are also grateful for the valuable oversight, guidance and inputs to this report provided by other FAO staff, including Olcay Unver, Jippe Hoogeveen, Marlos De Souza and Dorian Kalamvrezos Navarro. The authors wish to recognize the work done in the five pilot countries (Jordan, the Netherlands, Peru, Senegal, Uganda) during the development of the technical methodology described in this report. Thanks are also extended to Virginie Gillet, FAO-AQUASTAT Consultant, and Ghaieth Ben Hamouda, FAO Consultant, for their contributions to the data processing. Financial support was provided by the Swiss Agency for Development and Cooperation (SDC), the German Federal Ministry for Economic Cooperation and Development (BMZ), the Dutch Ministry of Infrastructure and Water Management, and the Swedish International Development Cooperation Agency (Sida), through the GEMI programme. This report was produced as part of a series of reports on SDG indicators 6.3.1, 6.3.2, 6.4.1, 6.4.2, 6.5.1, 6.5.2 and 6.6.1, coordi- nated by UN-Water through the GEMI programme. Suggested citation: FAO and UN-Water. 2018. Progress on level of water stress. Global baseline for SDG 6 Indicator 6.4.2: Level of water stress: freshwater withdrawal as a proportion of available freshwater resources.
Progress on Level of Water Stress
10

     EXECUTIVE SUMMARY

                Access to safe water and sanitation and sound mana-        ter taking into account environmental flow requirements
                gement of freshwater ecosystems are at the very core       (EFR). It is calculated using the following formula:
                of sustainable development. This is the objective set
                by Sustainable Development Goal 6 (SDG 6), which fur-
                                                                                                          TFWW
                ther enhances Millennium Development Goal 7 (MDG 7)              Water stress (%) =                   * 100
                                                                                                       TRWR - EFR
                by including water management approaches and ele-
                ments, such as integrated water resources manage-
                ment, wastewater treatment, water-use efficiency, envi-    The MDG framework already had a water stress
                ronmental flows requirement, international cooperation,    indicator related to target 7.A, defined as “propor-
                capacity-building and stakeholder participation.           tion of total water resources used”. Although the
                                                                           MDGs were only defined in 1999, these parameters
                Target 6.4 of SDG 6 addresses water-use efficiency         were being monitored by the Food and Agriculture Or-
                and water stress, pursuing the following: “By 2030,        ganization of the United Nations (FAO) through its glo-
                substantially increase water-use efficiency across all     bal water information system, AQUASTAT, since 1994.
                sectors and ensure sustainable withdrawals and sup-        The definition for SDG indicator 6.4.2 is relatively simi-
                ply of freshwater to address water scarcity and subs-      lar to that of the MDG indicator with the exception that
                tantially reduce the number of people suffering from       it explicitly takes into consideration EFR.
                water scarcity”. The following two indicators were for-
                mulated under this target:                                 As an extension of the MDG indicator, countries were
                                                                           already familiar with the SDG indicator methodology
                6.4.1 Change in water-use efficiency over time             and data were mostly accessible and updated from
                                                                           country institutions. Information was also available
                6.4.2 Level of water stress: freshwater withdrawal as      from AQUASTAT, although not for EFR. The main
                a proportion of available freshwater resources             difficulties when applying this methodology there-
                                                                           fore arose when estimating this last variable. None of
                For each indicator, monitoring methodologies and other     the countries had undertaken specific studies on EFR
                support tools were developed and tested in five pilot      data except for Uganda, which had some figures from
                countries – Jordan, the Netherlands, Peru, Senegal and     the Environmental Flow Manual prepared for the Nile
                Uganda. These were chosen based on the countries’          Basin Initiative project. In the case of Jordan, the es-
                expressions of interest and to ensure a good represen-     timation was made based on the water pumped to
                tation of global regions.                                  preserve the Azraq oasis. Peru and Senegal used the
                                                                           International Water Management Institute’s (IWMI) es-
                This report describes the methodology testing pro-         timations at the national level from its Global Assess-
                cess for indicator 6.4.2 in the five pilot countries       ment of Environmental Flows and Scarcity. The Nether-
                (section 2) and presents the global baseline (2015–2018)   lands considered different international models for the
                for this indicator (section 3).                            estimation of environmental flows.

                                                                           To implement and test the methodology, all pilot coun-
                Methodology testing                                        tries established working groups with relevant stakehol-
                                                                           ders to gather the required expert knowledge. A natio-
                                                                           nal institution was identified to lead the groups in the
                Indicator 6.4.2 has been defined as the ratio between      process of compiling the indicator data. It was tasked
                total freshwater withdrawn (TFWW) by all major sectors     with coordinating the review of all national, subnational
                and total renewable freshwater resources (TRWR), af-       and basin unit sources of relevant data, such as maps,
11
reports, yearbooks and articles. The data-collection always in the format, quality, quantity and fre-
exercise focused on the most recent data, without ex- quency required. In other cases, certain parame-
cluding any potential sources of information. Partial ters were being poorly monitored, or not at all.
data (with respect to time or area), such as data pro-
duced by local projects, were also collected. Meetings • Poor or non-existent coordination at the country
with all the institutions involved took place throughout level. There is a need to strengthen countries’ ca-
2016 to track progress, share findings and validate the pacity and mobilize resources to implement the
results obtained. methodology, and to improve cooperation, coor-
dination and sharing of responsibilities and infor-
For each SDG indicator, a United Nations organiza- mation among the institutions involved in moni-
tion was designated to coordinate activities and act as toring the indicator.
custodian. In the case of indicator 6.4.2, FAO was desi-
gnated to provide technical and/or logistical support to • Reference years/periods. Although data were ge-
the countries that requested it. nerally up to date, reference years or periods
sometimes varied between variables and coun-
Even though the data-collection process was feasible for tries. In this regard, it is essential to always spe-
all pilot countries, certain problems were encountered cify the reference years used.
that should be taken into account for future reference:
• Outdated data. If up-to-date data are not avai-
• Data inconsistency among various sources.The lable (from in-country or international sources),
availability of different information sources for significant efforts should be made to provide the
the same variable was sometimes problematic most accurate estimate possible.
since figures could vary depending on the source
consulted (due to years of reference conside- • Weak reporting from country institutions into
red or other components taken into account). international databases. It was noted that inter-
To address this challenge in future, the factors national databases such as AQUASTAT, which
that caused the differences must be understood serve as repositories for data provided by coun-
and the data harmonized, or the value with the tries, did not always have the latest figures avai-
reference that best matches the definition stated lable. Countries should therefore endeavour to
in the indicator’s methodology must be selec- share their most recent data with these interna-
ted. It is also important to maintain the same data tional sources.
source and estimation methodology over time.
• Double counting. There was a potential risk
• Lack of EFR data. None of the pilot coun- of counting a value more than once when com-
tries had statistical data or had developed an in- puting freshwater withdrawals by the different
country study to be able to draw their own figure sectors.
for this variable. This seems to be the case for
most countries in the world. However, free, on- The pilot exercise was an opportunity to further im-
line data sets are available at the international le- prove data collection and estimations in each of the
vel, such as the IWMI Global Assessment of Envi- countries and furthermore, to improve the way water
ronmental Flows and Scarcity. As such, countries resources are managed. The necessary involvement
can assess their own EFR based on the more de- of different agencies in the process helped strengthen
tailed knowledge they have of their natural and institutional relations, build and consolidate networks
social conditions. of professionals, which will help improve the monito-
ring of the indicator and, most likely, other aspects of
• Weak monitoring by country institutions. While water management in the country as well.
data were generally available, they were not
“Worldwide, 32 countries are experiencing water stress of between 25 and 70 per cent; 22 countries
experience it above 70 per cent and are considered to be seriously stressed; in 15 countries, this figure
rises to above 100 per cent, and of these, four have water stress above 1,000 per cent.”Progress on Level of Water Stress
12
Global data
The world’s average water stress stands at almost 13 per The FAO database, AQUASTAT, was used as the interna-
cent, although evidently, there are significant differences tional source to obtain figures for countries all over the
among world regions, a fact that a global assessment world. It can provide figures for two of the three main
hides. For example, sub-Saharan Africa and South variables in the methodology – TRWR and TFWW – for
America have a low level of water stress (about 3 per 180 countries. However, since AQUASTAT is a repo-
cent), whereas in Northern Africa and Western Asia, sitory for data reported by countries, it does not pro-
water stress is very high (72 per cent). Similarly, regional duce new figures. This means that without individual
averages mask realities at the country level. For instance, country efforts, the data stored here are not updated,
within the Northern Africa and Western Asia region, some and consequently cannot be used for monitoring. To
countries in the Arabian Peninsula can reach water stress monitor the indicator over time, each country needs
indicator values of over 1,000 per cent. to establish a national data-collection mechanism or
strengthen its existing mechanism.
Worldwide, 32 countries are experiencing water stress
of between 25 and 70 per cent; 22 countries experience As for EFR, figures at the country level were taken
it above 70 per cent and are considered to be seriously from the IWMI Water Data Portal. However, countries
stressed; in 15 countries, this figure rises to above can assess their own EFR based on the more de-
100 per cent, and of these, four have water stress tailed knowledge they have of their natural and social
above 1,000 per cent. In the latter four, the demand for conditions, taking into account factors such as the le-
freshwater is largely being met through desalination. vel of development, population density, availability of
non-conventional water sources, specific ecosystem
needs and climatic conditions.
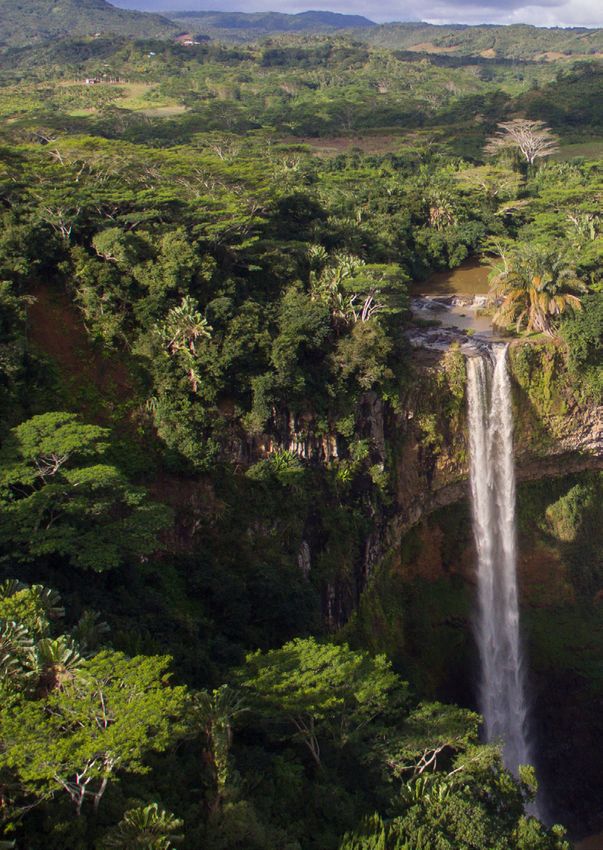
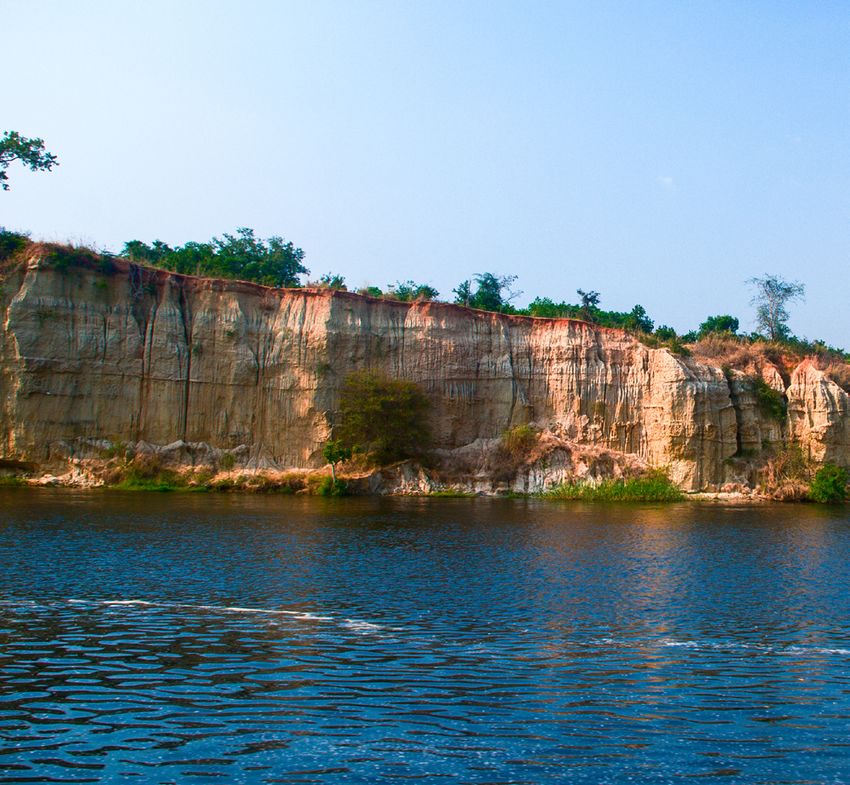
Drought in Lake Hume, Australia. Photo: Tim J Keegan/Creative Commons13
KEY MESSAGES AND
RECOMMENDATIONS
To date, the Inter-agency and Expert Group on Sustai- ment have been used, etc. The AQUASTAT question-
nable Development Goal Indicators (IAEG-SDG) has naire offers guidance on how to prepare this metadata.
not defined a framework for data collection on global Moreover, FAO provides countries with a calculation
indicators to provide guidance to Member States and sheet in order to keep consistency when compiling
custodian agencies alike – the only clear indication the data.
being that countries should retain ownership of their
data and of the monitoring process in general. The The pilot phase has demonstrated that monitoring a
IAEG-SDG is expected to agree on a standardized re- given indicator at the country level calls for the invol-
porting framework during its next meeting, in autumn vement of various stakeholders and institutions. Coun-
2018. The establishment of such a framework will help tries should appoint a lead institution to coordinate
significantly improve and rationalize the data-collec- these stakeholders – ideally, an institution involved in
tion process for the SDG global indicators, clarifying the water sector or statistics at the national level. The
the roles and responsibilities of both national institu- lead agency plays a critical role in the successful and
tions and custodian agencies. timely monitoring of the indicator. It will ensure that all
those involved have a clear understanding of their role
For further implementation of the SDG indicator me- in the process, the actions to be implemented and the
thodologies, specific national data should be col- support they can provide and receive within said role.
lected to compute the indicator. To this end, coun- Custodian United Nations organizations should en-
tries must take ownership of the process and be deavour to develop strong bonds with these lead ins-
mindful of the importance of quality, timely and reliable titutions.
disaggregated data and their accessibility in infor-
ming decision-making. Custodian United Nations orga- There is a strong complementarity between the two
nizations must endeavour to raise awareness of this indicators of target 6.4. While indicator 6.4.1 is an eco-
point, as well as of the interlinkages with other SDG 6 nomic indicator, assessing to what extent economic
indicators, and must support countries during this pro- growth relies on the utilization of water resources, indi-
cess. Countries should have a good understanding of cator 6.4.2 is an environmental indicator, showing the
the methodology and be aware of the issues to take physical availability of freshwater resources. By using
into account when using the indicator’s formula. This these two sets of information together, decision ma-
is also a task for custodian United Nations organiza- kers can gain an understanding of how growing wa-
tions when explaining the methodology. In this regard, ter usage affects the availability of the water resources.
FAO has prepared an online course on indicator 6.4.2
(including quizzes) to make sure the methodology is Data for indicator 6.4.2 should ideally be collected an-
well communicated and can be easily applied by the nually and reported every two years. However, a repor-
country teams. ting period of up to three years is also acceptable.
To enable comparison, it is important that the data
provided by countries be accompanied by the relevant
metadata, to specify how the information has been
obtained, which reference years and units of measure-1
Introduction and
background
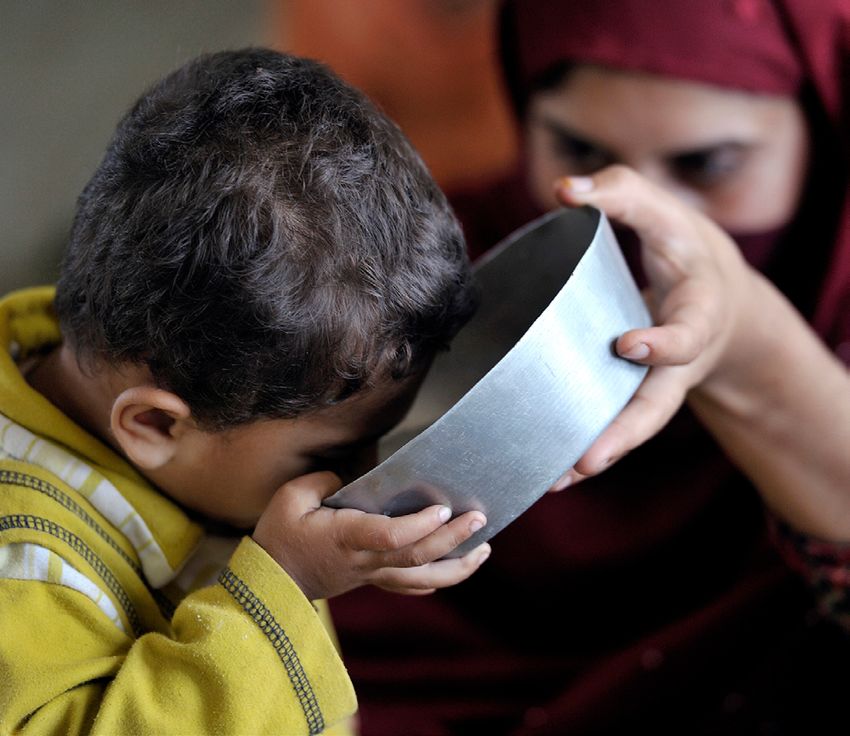
A mother gives her child a bowl of clean water in Charsardda District, in Pakistan. Photo: UN Photo/UNICEF/ZAK15
In September 2015, Heads of State from all around
the world adopted the 2030 Agenda for Sustainable
Development, consisting of 17 Sustainable Develop-
ment Goals (SDGs) with 169 targets. The 2030 Agenda
includes a goal on water and sanitation (SDG 6) that
sets out to “ensure availability and sustainable mana-
gement of water and sanitation for all” (UNGA, 2015).
Access to safe water and sanitation and sound ma-
nagement of freshwater ecosystems are at the
very core of sustainable development. Not only
does SDG 6 have strong linkages with all the other
SDGs, it is essential to achieving them. In other words,
the successful implementation of the 2030 Agenda
will strongly depend on meeting SDG 6 (CBS, 2016).
SDG 6 expands the focus of Millennium Development
Goal 7 (MDG 7) on drinking water and sanitation to the
entire water cycle, including the management of water, KEY FACTS
wastewater and ecosystem resources (UNGA, 2015).
It also addresses other aspects of water management
such as international cooperation, capacity-building
and stakeholder participation. This is reflected by the
higher number of targets set – while MDG 7 had two
water-related targets, SDG 6 includes eight (Box 1).
Target 6.4 deals with water scarcity, aiming to ensure
there is sufficient water for the population, the economy
and the environment by increasing water-use efficiency
across socioeconomic sectors. Two indicators were de- A high level of water stress can result
veloped to track progress for this target: in negative effects on economic
development and food security,
6.4.1 Change in water-use efficiency over time increasing competition and potential
conflict among users.
6.4.2 Level of water stress: freshwater
withdrawal as a proportion of available
freshwater resources
Indicator 6.4.2 was formulated
to ensure continuity with the
For target 6.4, the MDG framework already had a MDG process, and for its intrinsic
water stress indicator related to target 7.A, defined as importance in assessing a country’s
“proportion of total water resources used”. Although freshwater resources.
the MDGs were only defined in 1999, these parameters
were being monitored by the Food and Agriculture
Organization of the United Nations (FAO) through its global
water information system, AQUASTAT, since 1994.Progress on Level of Water Stress
16
BOX 1
Water-related targets for MDG 7 and SDG 6
MDG 7 SDG 6
(2000–2015) (2015–2030)
7.A Integrate the principles 6.1 By 2030, achieve universal and equitable access to safe and
of sustainable development affordable drinking water for all.
into country policies and
programmes and reverse 6.2 By 2030, achieve access to adequate and equitable
the loss of environmental sanitation and hygiene for all and end open defecation, paying
resources. special attention to the needs of women and girls and those in
vulnerable situations.
7.C Halve, by 2015, the
proportion of people without 6.3 By 2030, improve water quality by reducing pollution,
sustainable access to safe eliminating dumping and minimizing release of hazardous
drinking water and basic chemicals and materials, halving the proportion of untreated
sanitation. wastewater and substantially increasing recycling and safe
reuse globally.
6.4 By 2030, substantially increase water-use efficiency
across all sectors and ensure sustainable withdrawals
and supply of freshwater to address water scarcity and
substantially reduce the number of people suffering from
water scarcity.
6.5 By 2030, implement integrated water resources
management at all levels, including through transboundary
cooperation as appropriate.
6.6 By 2020, protect and restore water-related ecosystems,
including mountains, forests, wetlands, rivers, aquifers and
lakes.
6.a By 2030, expand international cooperation and capacity-
building support to developing countries in water- and
sanitation-related activities and programmes, including
water harvesting, desalination, water efficiency, wastewater
treatment, recycling and reuse technologies.
6.b Support and strengthen the participation of local
communities in improving water and sanitation management.17
The definition for SDG indicator 6.4.2 is relatively si- (FAO), UN Environment, the United Nations Human
milar to that of the MDG indicator with the exception Settlements Programme (UN-Habitat), the United Na-
that it takes into consideration environmental flow re- tions Economic Commission for Europe (UNECE), the
quirements (EFR) (see section 2.1.1). Indicator 6.4.2 United Nations Educational, Scientific and Cultural
was formulated to ensure continuity with the MDG Organization (UNESCO), the United Nations Children’s
process, and for its intrinsic importance in assessing a Fund (UNICEF), the World Health Organization (WHO)
country’s freshwater resources. and the World Meteorological Organization (WMO).
A high level of water stress can result in negative ef- The first phase of GEMI implementation (2015–2018)
fects on economic development and food security, has focused on developing monitoring methodologies
increasing competition and potential conflict among and other support tools for the indicators related to
users. This calls for effective supply and demand ma- the above-mentioned targets. This included a country
nagement policies (linked to targets 6.3 and 6.5) and consultation exercise (proof of concept) in 2016 in five
an increase in water-use efficiency. Securing EFR is pilot countries: Jordan, the Netherlands, Peru, Senegal
also essential to maintaining ecosystem health and re- and Uganda. These were chosen based on countries’
silience (related to target 6.6 and SDG 15). expressions of interest and to ensure a good represen-
tation of global regions (sub-Saharan Africa, Europe,
As acknowledged by the United Nations General As- Latin America and the Caribbean and Northern Afri-
sembly (UNGA, 2015), quality, accessible, timely and ca/the Middle East). Asia was originally represented
reliable disaggregated data are needed to help mea- by Bangladesh, but there were significant delays in
sure SDG progress and to ensure that no one is left the process due to the country’s complex institutional
behind in the process. Access to reliable data is also environment.
essential for well-informed decision-making.
In addition, GEMI has also worked on establishing a
To that end, UN-Water launched Integrated Monitoring global baseline for SDG targets 6.3 to 6.6.
of Water and Sanitation Related SDG Targets, an in-
ter-agency initiative known as GEMI. GEMI establishes This report describes the methodology testing pro-
and manages a coherent monitoring framework for the cess for indicator 6.4.2 in the five pilot countries (sec-
implementation of SDG targets 6.3 to 6.6.1 It was es- tion 2) and presents the global baseline (2015–2018)
tablished in 2014 as a partnership between the Food for this indicator (section 3).
and Agriculture Organization of the United Nations
1
Targets 6.1 and 6.2 are covered by the Joint Monitoring Programme for Water Supply, Sanitation and Hygiene (JMP) developed by WHO and UNICEF.Progress on Level of Water Stress
18
2
Method and process
Children helping an old woman fill her containers with water from a community pump in Dobra Khira near Sanaa. Photo: UN Photo/Ian Steele19
2.1. Methodology
2.1.1 About the methodology
developed by GEMI
Indicator 6.4.2 has been defined as the ratio between
total freshwater withdrawn (TFWW) by all major sec-
tors and total renewable freshwater resources (TRWR),
after taking into account EFR. It is calculated using the
following formula:
TFWW
Water stress (%) = * 100
TRWR - EFR
KEY FACTS
Where:
TFWW = Total freshwater withdrawal (km3/year). This
is usually calculated as the sum of withdrawal
from renewable freshwater resources and
from fossil groundwater for agriculture, in-
dustries and services minus the direct use
of non-conventional water as (treated) was-
tewater, the direct use of agricultural drai-
nage water and the use of desalinated wa-
ter. Freshwater withdrawal for each sector is
defined below: Data for indicator 6.4.2 should ideally
be reported at the country level every
Agricultural freshwater withdrawal is the an-
two years.
nual quantity of water withdrawn for irrigation,
livestock (watering, sanitation, cleaning, etc.)2
and aquaculture purposes. It includes water The implementation of the pilot phase
from over-abstraction of renewable ground- has demonstrated the importance
water or withdrawal of fossil groundwa-
of stakeholder engagement in the
ter. This category refers to self-supplied agri-
process. It is crucial that countries
cultural activities not connected to the public
take ownership and involve all the
distribution network. If the water is provided
by a public water supply network, it should be relevant institutions and agencies.
included under the services water withdrawal
category. This category corresponds to the In-
ternational Standard Industrial Classification
(ISIC) Rev. 4 section A (Annex 3).
2 The subcategory of freshwater withdrawal for livestock does not include water withdrawal for irrigated fodder, meadows and pastures, which are included under water
withdrawal for irrigation. It also does not include water withdrawal for the preparation of products derived from animals, which is included under industrial water withdrawal.
If connected to the public water supply network, water withdrawal for livestock is included under services water withdrawal.Progress on Level of Water Stress
20
Industrial freshwater withdrawal is the annual TRWR = Total renewable freshwater resources (km3/
quantity of water withdrawn for industrial uses. year). This is the sum of internal re-
It includes water from over-abstraction of re- newable freshwater resources (those gene-
newable groundwater or withdrawal of fossil rated from endogenous precipitation) and ex-
groundwater. This category refers to self-sup- ternal renewable freshwater resources (flows
plied industries not connected to the public entering the country, taking into consideration
distribution network. If the water is provided the quantity of flows reserved to upstream
by a public water supply network, it should be and downstream countries through agree-
included under the services water withdrawal ments or treaties).
category. This category also includes water
used for cooling in thermo-electric plants; it EFR = Environmental flow requirements (km3/year).
does not include hydropower, however, it is This refers to the quantity and timing of
recommended that losses through evapora- freshwater flows required to sustain freshwa-
tion from artificial lakes used for hydropower ter ecosystems and the human livelihoods and
production be included here. This category well-being that depend on them. As evident
corresponds to the ISIC Rev. 4 sections B, C, D in the description of the pilot countries’ pro-
and F (Annex 3). cesses, methods to compute EFR are extre-
mely varied and range from global estimates to
Services freshwater withdrawal is the annual comprehensive assessments for river reaches.
quantity of water withdrawn primarily for di-
rect use by the population. It includes water Data for indicator 6.4.2 should ideally be reported
from over-abstraction of renewable ground- at the country level every two years. However, a repor-
water or withdrawal of fossil groundwater. It ting period of up to three years is also acceptable.
is usually computed as the total water wit-
hdrawn by the public distribution network. It If data are available at the subnational level, these should
can include the part of the industry and agri- also be provided, especially for larger countries or coun-
cultural sector connected to the municipal tries with marked climatic differences within their terri-
distribution network. This category corres- tory. The most suitable units to be used for this exercise
ponds to the ISIC Rev. 4 section E (Annex 3). are river basins, aggregated according to the circums-
tances of each country.
Table 1 summarizes what should (and should not)
be included when calculating TFWW.21
Table 1. Categories to include in total freshwater withdrawal (TFWW)
surface freshwater renewable groundwater fossil groundwater
direct use of non-conventional water (direct use of treated wastewater, direct use of
agricultural drainage water, desalinated water)
AGRICULTURAL FRESHWATER WITHDRAWAL – ISIC SECTION A
Irrigation purposes
Freshwater
withdrawal Irrigated fodder
for irrigation
Irrigated meadows and pastures
Livestock watering
Sanitation
Agricultural water
Freshwater
withdrawal
withdrawal Cleaning of stables, etc.
for livestock
Irrigated fodder
Irrigated meadows and pastures
Freshwater
withdrawal Aquaculture purposes
for aquaculture
Services water
However, if the water is provided withdrawal
by/connected to the public water (agricultural water
supply network, it should be included withdrawal if data
under the category of services water available)
withdrawal, regardless of its use.
Transformation of agricultural Industrial water
products withdrawalProgress on Level of Water Stress
22
INDUSTRIAL FRESHWATER WITHDRAWAL – ISIC SECTIONS B, C, D AND F
Self-supplied industries not
Industrial water
connected to the public distribution
withdrawal
network
Cooling of thermo-electric, Industrial water
hydroelectric and nuclear power withdrawal
plants
Hydropower Not included
Losses through evaporation from Industrial water
artificial lakes used for hydropower withdrawal
production
However, if the water is provided Services water
by/connected to the public withdrawal
water supply network, it should (industrial water
be included under the category withdrawal if data
of services water withdrawal, available)
regardless of its use.
SERVICES3 FRESHWATER WITHDRAWAL – ISIC SECTIONS E, G–T
Total water withdrawn by the Services water
public distribution network withdrawal
Agriculture and industries
Services water
connected to the municipal
withdrawal
distribution network
3 In AQUASTAT, services water withdrawal is reported as municipal water withdrawal.23
BOX 2
Methodology development for indicator 6.4.2
The development of the methodology for this indicator evolved from the existing MDG indicator 7.5: proportion of total
water resources used. This indicator was defined as “the total volume of groundwater and surface water withdrawn from
their sources for human use (in the agricultural, domestic/municipal and industrial sectors), expressed as a percentage of
the total actual renewable water resources”.
During the development of SDG indicator 6.4.2, the possibility of using water consumption instead of water withdrawal was
considered. However, water withdrawal was ultimately kept as the parameter to use to maintain consistency with the MDG
indicator, and to reduce uncertainty due to the scarcity of data on return flows and on consumption in general.
The formulation of the MDG indicator implied the need to reserve a proportion of water resources for covering EFR, as
stated in the relevant metadata. In discussing the formulation of indicator 6.4.2, it became apparent that keeping EFR
implicit could create a potentially false sense of security in situations where water scarcity is not apparent. At the same
time, the importance of reserving water for the functioning of ecosystems was not highlighted by the previous formulation.
Introducing EFR into the formula implied the need to collect data that are not usually monitored by the hydrological ser-
vices in many countries, nor are they available in international databases such as AQUASTAT. However, EFR was included
in the formula given its paramount importance to the indicator in terms of policy, and considering that while some coun-
tries do not have the relevant data, at the global level, the International Water Management Institute (IWMI) has compiled
a country-based data set that can be used as a default.
As a next step, FAO is working with IWMI, the United Nations University (UNU) and UN Environment to define a user-friendly
approach to estimate EFR, both for computing indicator 6.4.2 and for identifying and assessing disaggregated data for
water stress at the sub-country level.
2.1.2. Applying and testing the As might be expected, the main difficulties when apply-
ing this methodology arose when estimating EFR. None
methodology in the five pilot countries of the pilot countries had studied this variable at the na-
tional level, except for Uganda, which had some figures
from the Environmental Flow Manual prepared for the
As previously mentioned, the MDG monitoring frame- Nile Basin Initiative project. Peru is about to undertake
work already included an indicator on water stress, de- studies of this kind and has a Chief Resolution (#98
fined as “proportion of total water resources used”. 2016-ANA) to regulate their implementation.
The main difference between this and the SDG indi-
cator 6.4.2 is that the latter also takes into considera- Except for EFR and a few other cases, statistical
tion EFR. Thus, during the pilot phase, countries were data were readily available from government sources
already familiar with the SDG indicator methodology for the variables included in the methodology. Possible
and most of the data were accessible and updated data gaps were filled with estimations or data taken
from country institutions. Information was also availa- from international sources such as AQUASTAT. These
ble from international sources, such as AQUASTAT. figures were updated or estimated up to 2016, 2015 or
2014 and were generally reported annually or biennial-
In some cases, the existence of various information ly. For most countries, data are consolidated and pub-
sources was problematic since different figures could lished at the country level, except for Peru, which also
be found for the same variable. For instance, data for disaggregates data for its three major basins (Pacif-
agricultural withdrawals in Uganda were available from ic, Amazon and Titicaca). More information on this is
the Government, AQUASTAT and the Nile Basin Initia- provided in section 2.2.2.
tive, and there were considerable differences among
the numbers provided by each source. In these cases, To implement and test the methodology, all pilot coun-
it is important to understand which factors caused the tries established working groups with relevant stake-
differences, and to either harmonize them or choose holders to share findings and validate the data and
the value whose metadata best matches the definition analysis conducted (see section 2.2.1 and 2.3).
stated in the indicator’s methodology.Progress on Level of Water Stress
24
2.1.3. The monitoring ladder to national estimates, based on a country’s more
detailed knowledge of its natural and social condi-
tions, taking into account factors such as the level
The monitoring ladder for indicator 6.4.2 is defined as of development, population density, availability of
follows: non-conventional water sources, specific ecosys-
tem needs and climatic conditions.
1. At the first level, the indicator can be populated
with estimations based on national data aggre- The pilot countries had statistical data availa-
gated to the country level. If needed, data can be ble at the country level for most of the variables defined
retrieved from international databases on water for indicator 6.4.2. As such, they were all already be-
availability and withdrawals by different sec- yond level 2 of the ladder (Figure 1). The Nether-
tors. Estimates for EFR based on literature values. lands could even be considered level 3 as it is able
to provide more accurate data, fully disaggregated by
2. At the next level, the indicator can be populated source and use. The country can also supplement sta-
with nationally produced data, which can increas- tistical data with remote sensing and model data for a
ingly be disaggregated to the subnational basin better spatial and temporal resolution, to estimate the
unit level. Estimates for EFR based on litera- following:
ture values.
• Precipitation data from measuring stations over
3. For more advanced levels, the nationally produced the country’s surface using radar measurements
data have a high spatial and temporal resolution
(e.g. geo-referenced and based on metered vol- • Evapotranspiration (ET): instead of using potential
umes) and can be fully disaggregated by source ET, actual ET is estimated using remote sensing
(surface water/groundwater) and use (economic
activity). EFR are assessed and refined according
Figure 1. Country situation in the ladder approach
The Netherlands
3
Uganda Senegal Jordan Peru
2 In-country data
In-country data enhanced with
In-country data modelled/satellite
with degree of
with some gaps data
1 disaggregation
Peru would also be considered close to level 3 since had to be obtained from AQUASTAT, there was no of-
it can present data at the basin level for TRWR and ficial government figure on water for livestock (despite
TFWW. Jordan and Senegal would follow as they pro- its importance in the country) and data on TRWR was
duce in-country statistical data, but only at the national not updated (the period available for analysis was 1952
level. Uganda would be considered closer to level 1 be- to 1978).
cause the figures on industrial freshwater withdrawals25
BOX 3
What next for the IAEG-SDG?
The Inter-agency and Expert Group on SDG Indicators (IAEG-SDG) was established by the United Nations Statistical
Commission to develop and implement the SDG global indicator framework and targets of the 2030 Agenda. It com-
prises United Nations Member States, with regional and international agencies participating as observers.
The global indicator framework was agreed upon in March 2017. Following on from this, the IAEG-SDG’s work will now en-
tail finalizing a framework for indicator monitoring and reporting, and reviewing and refining the indicator framework and
its implementation on an ongoing basis. The group is expected to agree on a standardized reporting framework during its
next meeting, in autumn 2018. The establishment of such a framework will help improve and rationalize the data-collec-
tion process for the SDG global indicators, clarifying the roles and responsibilities of national institutions and custodian
agencies alike.
test the methodology and endorse the results ob-
tained. Table 2 provides a comparative summary
of the institutions/organizations involved in each of
2.2. Stakeholders and the countries.
sources of data The main institutions involved were water-related mi-
nistries and agencies and the departments of statistics.
In the case of the Netherlands, research institutions
2.2.1. Stakeholders involved (Deltares) and consultancies (eLEAF) were also invol-
ved in providing and analysing the data.
All the pilot countries engaged relevant institutions
in the SDG 6 process to provide data, implement and
A child washes himself in Kallyanpur, a slum in Bangladesh’s capital, Dhaka. Photo: UN Photo/Kibae ParkProgress on Level of Water Stress
26
Table 2. Stakeholders involved in country testing of the indicator 6.4.2 methodology
General Main data-collecting Other government
coordination agencies bodies/institutions involved
Deltares, eLEAF, Vitens-Evides
International, Association of Dutch
Water Companies (Vewin), water
Ministry of Infrastruc- boards, Netherlands Environmental
The ture and Water Mana- Assessment Agency, Water Footprint
Statistics Netherlands (CBS)
Netherlands gement – Delta Pro- Network, IHE Delft Institute for
gramme Water Education, Netherlands Water
Partnership
National Water Authority (ANA)
National Water Water Resources Management Unit
Peru Ministry of Agriculture and Irrigation
(ANA), Water Resources Planning and
Authority (ANA) National Institute for Statistics Conservation Unit (ANA), FAO
and Informatics (INEI)
Ministry of Water and Irrigation
Ministry of Water and Department of Statistics (DOS) Environment Statistics
Jordan Ministry of Agriculture
Irrigation Division (DOS), FAO
Ministry of Planning and International
Cooperation
Ministry of Water and Environment Ministry of Agriculture, Animal Industry
Ministry of Water and National Water and Sewerage and Fisheries
Environment (MWE) Corporation Ministry of Trade, Industry and
(Water for Production Ministry of Gender, Labour and Social Cooperatives (Department of Industry
Uganda Department and Water Development and Technology)
Resource Planning & Uganda Bureau of Statistics Ministry of Finance, Planning and
Regulation Department) Uganda Prisons Economic Development
FAO and United Nations Forum on
Forests (UNFF)
Buganda Kingdom
Ministry of Water and Ministry of Water and Sanitation
Sanitation Water Utilities Association
Senegal (Water Resources Statistics and Demography Agency
Management and (ANSD)
Planning Unit)
Source: National reports ANA, 2016; Abu Zahra, 2016; DGPRE, 2016; MWE, 2016; CBS, 2016.
2.2.3. Sources of data by variable type The process of data gathering proved that, except for
EFR and a few other cases, statistical data were most-
ly available from government sources for the variables
This section provides an overview of the various sourc- included in the methodology. Whenever data were miss-
es consulted in each of the pilot countries for the main ing, e.g. the groundwater inflow from neighbouring coun-
components of the methodology: (a) TFWW (Table 3); tries in the Netherlands or the withdrawals for industrial
(b) TRWR (Table 3); and (c) EFR (Table 4). use in Uganda, they were either estimated or taken from
international sources such as AQUASTAT or IWMI.27
Data were generally updated or estimated up to 2016, into the Azraq oasis is only sufficient to restore part
2015 or 2014. In the case of the Netherlands, Jordan of the oasis. Historical flow of the springs in Azraq is
and Peru, figures are reported annually or biennially, as about 10 106 m3, which is considered the natural re-
recommended in the GEMI methodology. For Senegal quirement for the basin.
and Uganda, the frequency of data collection and pub-
lication was not specified. The Netherlands used three different approaches for
estimating its EFR:
Countries consolidated and published data at the
country level, except for Peru, which also disaggregat- • Method Q90: the flow that exceeds 90 per cent
ed data by its three major basins (Pacific, Amazon and of the record period is accounted for as the flow
Titicaca) to give a less biased picture of the country’s needed to maintain the ecosystems.
situation. This is highly relevant for an indicator on wa-
ter stress, considering that the Pacific Basin accounts • Method 20–40: this estimates that between 20
for only 3 per cent of the country’s total freshwater re- and 40 per cent of the total renewable freshwater
sources, but 57 per cent of its withdrawals. resources is needed for the ecosystems. For the
Netherlands, this was considered to be 30 per cent.
Even though data were available from most sources,
certain challenges were encountered that should be • Method model input data: EFR is estimated by the
considered by country teams when collecting the data. Netherlands Hydrological Instrument (NHI) model
These are described in section 2.3.3. using input data related to vulnerable aquatic
ecosystems.
A focus on environmental flow requirements Peru and Senegal used the country estimates pro-
vided in IWMI’s Water Data Portal, which are 37.9 and
20 per cent of mean annual flow, respectively. Peru also
This component has proven the most difficult to obtain provided estimates at the basin level using IWMI data
data on. Indeed, none of the pilot countries had statisti- from neighbouring countries that better correspond to
cal data or had developed a specific in-country study to the conditions of each of the main country basins: for
be able to draw their own figure (Table 4). the Pacific Basin, data from Chile were used; for the
Amazon Basin, data from Brazil; and for the Titicaca
Jordan estimated its EFR using its most important Basin, data from Bolivia (Plurinational State of).
natural reserve as the reference: the Azraq oasis (a
Ramsar site since 1977). The Water Authority of Jor- In the case of Uganda, EFR as a percentage of the
dan (WAJ) pumps about 1.5 106 m3 of water per year mean annual river flow was derived based on the Nile
from artesian wells to the wetland reserve to preserve Basin Initiative Environmental Flow Manual. This man-
what remains of the oasis. Based on this figure, EFR ual provides an estimation for the Mara and Malaba
were estimated at about 2 106 m3 for the last four years, river basins, which are representative of other basins in
also taking into consideration the other natural areas in the country. The average value for the two catchments
the country: the Dead Sea, Wadi Mujib and Wadi Wala. was 31.43 per cent.
However, it is important to note that the water pumped
BOX 4
Peru, a case for subnational disaggregation
The case of Peru is very interesting. According to estimates presented in this report, the level of water stress in Peru is very
low, around 1 per cent. However, the situation from the perspective of a decision maker is very different: most population
and economic activity (including irrigation and mineral development) is located in the extremely arid coastal area of the
Pacific Ocean, which has very low run-off, while most run-off occurs in the Amazon Basin, which is separated from the
coastal area by the Andes mountain range. As such, the country needs water (i.e. water stress is high) on one side of the
mountains and has a lot of water and very little use for it on the other side. This makes the average estimate for the entire
country quite irrelevant in terms of policy support information.Progress on Level of Water Stress
28
Table 3. Sources of data for total freshwater withdrawal and total renewable freshwater resources
The
Jordan Netherlands Peru Senegal Uganda
Total freshwater withdrawal
Statistics Ministry of
Agriculture Netherlands Water and
freshwater Ministry of Water (CBS) Environment
withdrawal and Irrigation LEI research (MWE)
(AW) (Water Balance institute (for area *Water for
Reports) under irrigation) livestock
estimated
based on
Department Statistics
livestock
Industry of Statistics Netherlands Organizations population
freshwater (Environment (CBS) (annual in charge of
withdrawal Statistics Reports) environmental water supply
Water
(IW) reports, national AQUASTAT
Resources
groundwater (figure for
Management
register) 2008)
Unit Statistics and
(from local Demography
operators) Agency Urban supply:
Ministry of Water (ANSD) National Water
and Irrigation and
and Sewerage
Department of
Corporation
Services Statistics Association of
MWE (database
freshwater Dutch Water
for Small Towns
withdrawal Companies
Water Supply)
(SW) Data gaps were (Vewin)
Rural supply:
estimated using
Estimated
intermediate
based
consumption
on rural
population
Collected AW: less than
Frequency Collected biennially every 5 years
annually, (by economic Collected IW: Every 5 years
of collection/ Not specified
published every activity), annually (AQUASTAT)
publication
four years annually (total SW: annually
withdrawls)
Country level Country level
Coverage Country level Subnational level Basin level Country level Country level
Basin levelYou can also read