R 322 - Questioni di Economia e Finanza (Occasional Papers) - Banca d'Italia
←
→
Page content transcription
If your browser does not render page correctly, please read the page content below
Questioni di Economia e Finanza
             (Occasional Papers)

             Stitching together the global financial safety net

             by Edd Denbee, Carsten Jung and Francesco Paternò
March 2016

                                                                           322
                                                                  Number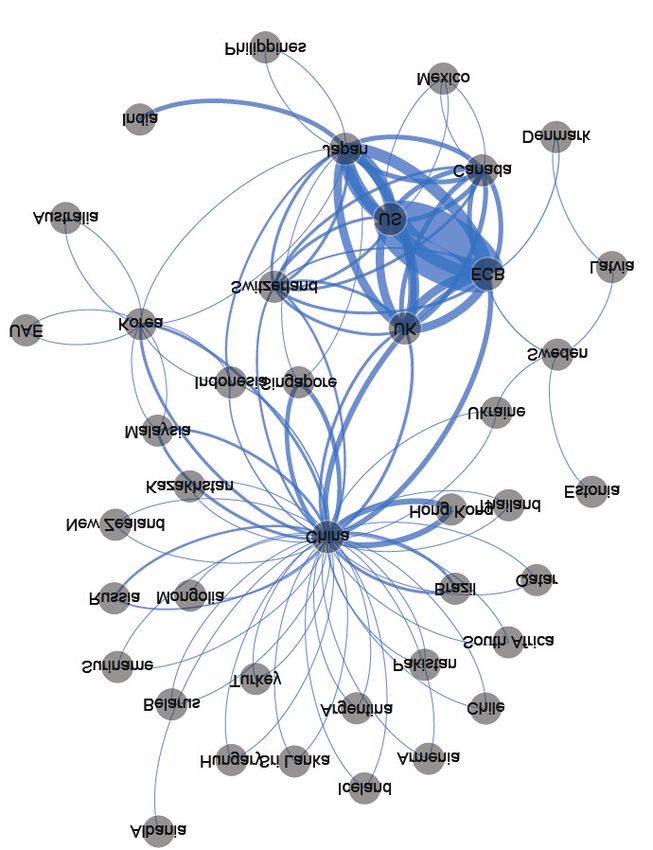
Questioni di Economia e Finanza
(Occasional papers)

Stitching together the global financial safety net

by Edd Denbee, Carsten Jung and Francesco Paternò

Number 322 – March 2016
The series Occasional Papers presents studies and documents on issues pertaining to
the institutional tasks of the Bank of Italy and the Eurosystem. The Occasional Papers appear
alongside the Working Papers series which are specifically aimed at providing original contributions
to economic research.

                 The Occasional Papers include studies conducted within the Bank of Italy, sometimes
in cooperation with the Eurosystem or other institutions. The views expressed in the studies are those of
the authors and do not involve the responsibility of the institutions to which they belong.

                 The series is available online at www.bancaditalia.it .

ISSN 1972-6627 (print)
ISSN 1972-6643 (online)

Printed by the Printing and Publishing Division of the Bank of Italy
STITCHING TOGETHER THE GLOBAL FINANCIAL SAFETY NET

                          by Edd Denbee*, Carsten Jung* and Francesco Paternò **

                                                                Abstract
      Financial globalisation brings a number of benefits but can also increase the risk of
financial crisis. In recent years, to reduce these risks to stability, countries have reformed
financial regulation, enhanced frameworks for central bank liquidity provision and
developed new elements, and increased the resources, of the global financial safety net
(GFSN). The traditional GFSN consisted of countries’ own foreign exchange reserves with
the IMF acting as a backstop. But since the global financial crisis there have been a number
of new arrangements added to the GFSN, in particular the expansion of swap lines between
central banks and regional financing arrangements (RFAs). The new look GFSN is more
fragmented than in the past, with multiple types of liquidity insurance and individual
countries and regions having access to different size and types of financial safety nets. This
paper finds that the components of the GFSN are not fully substitutable. We argue that while
swap lines and RFAs can play an important role in the GFSN they are not a substitute for
having a strong, well resourced, IMF at the centre of it. By running a series of stress
scenarios we find that for all but the most severe crisis scenarios, the current resources of the
GFSN are likely to be sufficient. However, this finding relies upon the IMF’s overall level of
resources (including both permanent and temporary) being maintained at their current level
and masks some vulnerabilities at the country level.

JEL Classification: F33, E58.
Keywords: balance of payments, global financial safety net, IMF, foreign exchange reserves,
Regional Financing Arrangements, swap lines.

                                                                Contents

1. Introduction .......................................................................................................................... 5
2. Elements of the global financial safety net ........................................................................ 11
3. Combining the elements of the global financial safety net ............................................... 26
4. The size of the global financial safety net ........................................................................ 29
5. Conclusions and policy implications ................................................................................. 44
Annex A1 - Size of selected, currently active bilateral swap and repo line ........................... 50
Annex A2 - Robustness assessment of EME balance of payments shock ............................. 51
References............................................................................................................................... 54
Box 1 - Methodology for calculating EME liquidity needs from a balance of payment
   crisis ................................................................................................................................... 32
Box 2 - Methodology for calculating AE liquidity needs from banking sector and
   sovereign debt crises ......................................................................................................... 39

________________________
* Bank of England, International Directorate. ** Bank of Italy, International Relations Directorate.
The authors would like to thank James Benford, Pietro Catte, Jon Cunliffe, Rob Elder, Phil Evans, Steve Field,
Linda Goldberg, Bob Hills, Glenn Hoggarth, Eleonora Mavreoidi, Neil Meads, Giuseppe Parigi, Minouche
Shafik, Nina Songvist and Chris Yeates for their advice and comments.
1       Introduction
1.1 The expansion of global finance
Financial globalisation and the expansion in global capital flows bring a number of benefits –
more efficient allocation of resources, improved risk sharing and more rapid technology
transfer. But they can also increase the risk of financial crises. This was the case both in the
first era of financial globalisation (between 1880 and 1913) and the second one (between 1970
and today) (Obstfeld & Taylor (2004)). In recent years, to reduce these risks to stability,
countries have reformed financial regulation, enhanced frameworks for central bank liquidity
provision and developed new elements, and increased the resources of, the global financial
safety net (GFSN). The GFSN is the focus of this paper.
A comprehensive and effective GFSN can help prevent liquidity crises from escalating into
solvency crises and local balance of payments crises from turning into systemic sudden stop
crises. Since the global financial crisis there have been a number of new arrangements added
to the GFSN. Our first contribution is to take stock of the current arrangements and assess
the characteristics of the current GFSN, such as its size, distribution and range of
instruments, and then consider how the elements of the GFSN fit together. Our second
contribution is to run a series of stress scenarios to quantify potential calls on the safety net
and assess whether existing arrangements are likely to be adequate in size and country
coverage. We highlight policy options to reduce potential calls on the GFSN and to ensure
that all countries have access to sufficient resources in the event of liquidity crises.
The past three decades have witnessed significant growth in cross-border financial flows.
Consequently, external liabilities have grown from 30% to 180% of global GDP between 1980
and 2014, far outpacing the growth in global trade (from 19% to 30% over the same period)
(Chart 1).
         Chart 1 Global export and external liabilities as percentage of global GDP, 1980-2014

                                                                                   Per cent
                                                                                              200

                                                                                              180

                                                                                              160

                                                                                              140

                                                                                              120
                                            External liabilities
                                                                                              100

                                                                                              80

                                                                                              60

                                                                         Exports              40

                                                                                               20

                                                                                               0
                           1980   84   88   92       96      2000   04        08   12

Sources: IMF International Financial Statistics, IMF World Economic Outlook, updated and extended version of
dataset constructed by Lane and Milesi-Ferretti (2007) and our own calculations.

                                                    5
This growth was driven in particular by cross-border banking flows, which made up about
one third of global capital flows in the decade prior to the financial crisis.
On a net basis, more gross capital inflows than outflows have allowed many countries to run
current account deficits. Global current account imbalances (measured as the sum of the
absolute values of all current account surpluses and deficits) tripled from around 2.3% of
global GDP between 1980 and 1997 to 5.5% of global GDP in 2006-08 and were 3.5% in
2014 (see Bush et al (2011)). But net flows concealed even larger increases in gross flows.
On a gross basis, the boom in global capital flows has provided additional sources of finance
for governments, banks, corporates and households. This may have increased the efficiency
of capital allocation, with capital increasingly able to flow to where it is most productive.
Gross capital flows increased to over 20% of global GDP in 2007 up from around 3% in
1980. Cross-border banking was one of the main drivers of this increase in cross-border
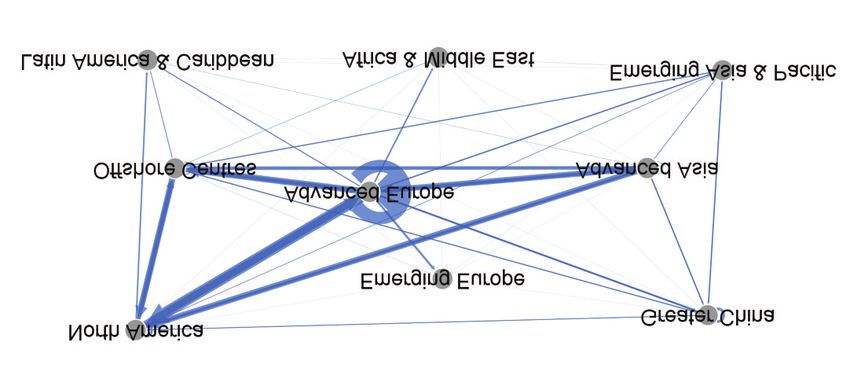
flows. Most of this expansion came from flows between advanced economies (AEs) and, in
particular within advanced Europe (Chart 2). But flows to and from emerging market
economies (EMEs) have also increased significantly. Despite falling sharply post-crisis,
gross flows have settled above the historical average at around 6% of global GDP.
(a)
Chart 2 Evolution of cross border banking
Chart 2a 1990 Q4 Chart 2b 2000 Q4
Chart 2c 2007 Q4 Chart 2d 2015 Q2
Source: BIS international banking statistics (residency basis).
(a) The arrows indicate claims. The thickness of the lines corresponds to the size of claims between banking
sectors. Lines which start and end in the same region represent intra-regional banking claims. For example, the
apparent blue circle for Advanced Europe is in fact a line which starts and ends in Advanced Europe,
representing intra-Advanced Europe banking claims.
There is a flip side to the rapid rise in cross-border capital flows and external assets and
liabilities - countries are more exposed to the willingness of foreign investors to continue
6funding their financing needs. Cross-border capital flows can be fickle, with foreign
investors withdrawing funding in the event of an economic or financial crisis (for example,
Claessens and Kose (2013), Fratzscher (2012) and Caballero and Krishnamurthy (2006)).
And, in recent years, financial conditions in EMEs – especially long-term interest rates –
appear to have become more synchronised with those in AEs (for example, Obstfeld (2015),
IMF (2014a), Cerutti et al (2014) and Fratzscher (2012)). Moreover, the evidence suggests
that gross external balance sheets, particularly high external debt, are important in explaining
the incidence of financial crises across countries (Al-Saffar et al (2013)).
Concerns about an increase in foreign currency borrowing in emerging markets through
international bond markets – mainly by the corporate sector – have recently been centre stage
in debates about global financial stability (IMF (2015)). And it has become increasingly clear
that the structure of a country’s external balance sheet is a key determinant in how
vulnerable it could be to external financing crises, as we discuss in Section 4.
Forbes and Warnock (2012) provide a taxonomy for sharp changes in capital flows: surges,
stops, flights and retrenchments. Such adjustments in capital flows impact on the domestic
economy through the balance of payments identity.1 Cross border financial flows expose
countries to the risk of a balance of payments crisis either from an increase in gross capital
outflows by domestic residents (capital flight), or a reduction in gross capital inflows from
foreigners (sudden stop). That is, if private sector counterparts to the balance of payment
identity cannot make up for these shocks (if a decrease of private gross capital outflows
cannot compensate an unexpected decrease of gross capital inflows), official financing may
be needed to prevent a disorderly adjustment (Table A).
Table A: Taxonomy of capital flows from the home country perspective
Type of shock Change in capital flows Role of GFSN
Surge Sharp increase in gross capital inflows
Stop Sharp reduction in gross capital inflows Provide offsetting financing if FX reserves insufficient
Retrenchment Sharp reduction in gross capital outflows
Flight Sharp increase in gross capital outflows Provide offsetting financing if FX reserves insufficient
Source: Forbes and Warnock (2012).
If a country loses access to financing from abroad it has to (i) sell private foreign assets; (ii)
sell official foreign assets (FX reserves); or (iii) increase net saving and shrink its current
account deficit. These adjustments can be made more or less difficult by the reaction of the
country’s exchange rate.
1
Current account balance = Financial account balance + Capital account balance + Net change of reserve assets. More specifically, financial
account balance = FDI gross inflows + Portfolio investment gross inflows + Other Investment gross inflows – FDI gross outflows – Portfolio
investment gross outflows – Other investment gross outflows + Financial derivatives net inflows. Note that gross inflows are defined as net sales
of domestic financial instruments to foreign residents and gross outflows are defined as net purchases of foreign financial instruments by
domestic residents.
7If private sector sales of external assets are not sufficient, and the official sector safety net is
inadequate, adjustment of the current account is necessary. This can lead to painful economic
conditions as a contraction in domestic demand is required to reduce import demand
(Cardarelli et al (2010)). That can be led by fiscal consolidation or higher private saving and
reductions in consumption and investment (Avdjiev et al (2015)).
Borrowing in foreign currency often complicates adjustment. International banks’ borrowing
in foreign currency (both domestically and cross-border) has doubled since 2002, despite a
20% reduction since the peak in 2008. There are now over US$20 trillion foreign currency
denominated bank liabilities (Chart 3). And since 2008, outstanding US dollar denominated
credit to non-banks outside of the United States has almost doubled to US$9 trillion.
Chart 3 Banking sector foreign currency liabilities, 1980-2015
US$ trillions
30
Swiss franc Euro
25
Japanese yen US dollar
Pound sterling Other
20
15
10
5
0
1980 85 90 95 2000 05 10 15
Source: BIS International banking statistics (residency basis).
This exposes banking sectors to the risk of a foreign currency liquidity crisis, unless they
have natural or financial hedges. A reduction in foreign currency funding can put pressure on
bank balance sheets, potentially causing them to firesale assets and reduce lending. This can
impact financial markets, risking a drying up in liquidity and asset price spirals, and reduce
access to finance for firms and households. For example, in 2008 European banks were
unable to access sufficient short-term US dollar funding in either the wholesale funding or
FX swap markets (McGuire and von Peter (2009)). As central banks only issue domestic
currency, they are less easily able to provide market-wide emergency liquidity in foreign
currency. If the borrowing is also cross-border then this also has balance of payments
implications. Even where a country is not initially faced with balance of payments
difficulties, foreign currency mismatches in some parts of the economy could lead to both a
liquidity shortfall and solvency problems.
Finally, governments are exposed to the risk of a sovereign debt crisis. Where public debts
are high, or fiscal deficits increase to unsustainable levels, investors may be unwilling to
8continue to finance governments. This is particularly true for foreign investors who may be
more likely to withdraw financing if risks are perceived to have increased. With falling
demand, bond spreads can rise to levels which effectively shut governments out of the
private debt markets, unless domestic investors are willing to absorb a substantially larger
share of the country's public debt. In such circumstances, the provision of financing from
external sources can remove governments from these markets and give them time to
undertake adjustments which would allow them to regain market access.
These types of crises are not independent of one another. For example, foreign currency
liquidity crises and sovereign debt crises can be the result of sudden stops in capital flows
and balance of payments crises. And feedback loops between banks and sovereigns can lead
foreign currency liquidity crises to contribute to sovereign debt crises.
1.2 Reducing the costs of crises through the global financial safety net
To prevent liquidity crises from escalating into solvency ones and local balance of payments
crises from turning into a systemic sudden stop crises, financial safety nets have been put in
place (Chart 4) (Shafik (2015)). There are four forms of liquidity insurance:
Self-insurance, via accumulated foreign exchange reserves.
Bilateral insurance, via swap lines between central banks.
Regional insurance, via regional financing arrangements, which either pool reserve
holdings or combine countries’ borrowing capacities.
Multilateral insurance, via the IMF.
Chart 4 Crises and the global financial safety net
FX liquidity
crisis
Balance of
Sovereign
payments
debt crisis
crisis
Emergency
liquidity
Global financial safety net
9Each of these sources of liquidity can provide a country with capital inflows to offset net
private sector outflows. Where the resources are denominated in foreign currency, any
source could also be used to provide temporary market-wide liquidity support where there
are disruptions to foreign currency funding markets.
The existence of a sufficiently resourced GFSN may also have a positive signalling effect
and help to weaken the link between global factors (e.g. global risk aversion and global
interest rates) and extreme capital flow episodes (Forbes and Warnock (2012)). But building
financial safety nets comes with costs as well as benefits, both for individual countries and
more broadly for the international monetary and financial system. The adequacy of the
GFSN will depend upon the size and coverage of resources, and also the features of the
instruments and their reliability.
Compared with historical levels, the external elements of the GFSN, in aggregate, do not
look particularly small relative to global external liabilities (Chart 5). But the GFSN has
become more fragmented, with multiple types of liquidity insurance and individual countries
and regions having access to different size and type of safety nets. The new facilities provide
some benefits, such as increasing the resources available to some countries and providing
additional sources of economic surveillance. However, many facilities have yet to be drawn
upon and variable coverage risks leaving some countries with inadequate access.
Chart 5 Global financial safety net as percentage of external liabilities, 1980-2014(a)
Swap lines (right-hand scale) IMF permanent (right-hand scale)
RFAs (right-hand scale) FX reserves (left-hand scale)
IMF temporary (right-hand scale)
Per cent Per cent
12 4.0
10
3.0
8
6 2.0
4
1.0
2
0 0.0
1980 83 86 89 92 95 98 2001 04 07 10 13
Sources: IMF International Financial Statistics, IMF World Economic Outlook, RFAs, updated and extended
version of dataset constructed by Lane and Milesi-Ferretti (2007) and our own calculations.
th
(a) The recent ratification of the IMF’s 14 General Review of Quotas will see the IMF permanent resources
double and the temporary resources fall by a similar amount.
The private sector can also impact upon potential calls on the global financial safety net. For
example, by: (i) banks holding liquid asset buffers and better matching their longer-term
assets with longer-term funding (i.e. the Basel III Liquidity Coverage Ratio and Net Stable
Funding Ratio instruments); (ii) initiatives such as the Vienna Initiative which helped
10maintain bank lending in central and eastern Europe thus reducing the balance of payments
pressures in these countries; and (iii) well managed sovereign debt restructurings, which can
reduce delays and distribute losses with minimal risk of spillovers.
The aim of this paper is to scratch under the surface of the GFSN to consider the features,
costs and benefits of each of its components and whether the overall size and distribution
across countries and regions is likely to be sufficient for a plausible set of shocks.
2 Elements of the global financial safety net
In this section we discuss the official sector instruments of the global financial safety net in
some detail; including how they have evolved and their key features. We evaluate them
according to four broad criteria: versatility of use (how flexibly can liquidity be deployed);
effectiveness (how powerful are they in addressing liquidity crises), cost and global
considerations. A stylised overview of our judgement is shown in Chart 6.
Chart 6 Stylised summary of the four key features of current GFSN tools(a)
Versatility of use
FX reserves (Higher value = More versatile)
Swap lines
5
RFAs
4
IMF
3
2
Global considerations
(Higher value = 1 Effectiveness
Better systemic 0 (Higher value =
properties) More effective)
Cost
(Higher value = Cheaper)
(a) This provides an indicative illustration of the relative strengths and weaknesses of each of the tools in the
GFSN. The assessment is based upon the current configuration and could change if the tools were used in a
different way.
2.1 Self-insurance: foreign exchange reserves
For many countries, the first line of defence against an external liquidity shock is their FX
reserves. Reserve balances have increased rapidly since the East Asian financial crisis in
1997. The severity of that crisis and the reliance on external official sector financing with its
associated conditionality led many governments to increase their self-insurance. Countries
may also accumulate FX reserves for other reasons, such as to maintain a fixed exchange rate
11or to distribute natural resource wealth across generations (Pineau et al (2006)). There is
evidence that all of these motivations have contributed to FX reserve accumulation.2
Rapid FX reserve accumulation has been particularly pronounced in Asia and the Middle
East, led by China, Japan and Saudi Arabia. This is consistent with fixed exchange rate
regimes, precautionary saving by Asian countries post 1997 and saving of wealth from –
until very recently – high oil prices. The result has been an increasing concentration of FX
reserve holdings, as measured by the Herfindahl index (Chart 7).
Chart 7 Regional distribution of FX reserves, 1980-2014(a)
SSA (right-hand scale) Europe (right-hand scale)
North America (right-hand scale) MENA (right-hand scale)
CEE and Central Asia (right-hand scale) Asia (right-hand scale)
Latin America (right-hand scale) Concentration (left-hand scale)
Herfindahl Index US$ billions
15 14,000
14
13 12,000
12
11 10,000
10
9
8,000
8
7
6,000
6
5
4 4,000
3
2 2,000
1
0 0
1980 82 84 86 88 90 92 94 96 98 2000 02 04 06 08 10 12 14
Sources: IMF International Financial Statistics, IMF World Economic Outlook and our own calculations.
(a): The Herfindahl index is a measure of concentration defined as the sum of the squared shares of global
holdings of FX reserves. A higher number means greater concentration.
The majority of FX reserve assets are highly liquid securities. The IMF Balance of Payments
Manual defines them as “external assets that are readily available to and controlled by
monetary authorities for direct financing of payments imbalances, for indirectly regulating
the magnitude of such imbalances through intervention in exchange markets to affect the
currency exchange rate, and/or for other purposes”. Based on IMF COFER survey data
(which covers about 50% of global FX reserves) the US dollar remains the dominant FX
reserve currency, making up a steady 60% of allocated reserves (Chart 8). There is some
evidence of countries diversifying into other currencies, in particular into Australian and
Canadian dollar assets although this has had a marginal effect on the overall currency
distribution of FX reserves.
2
See, for example, Aizenman and Lee (2005) or Jeanne and Ranciere (2011).
12Chart 8 Currency composition of foreign exchange reserves, 1995-2015(a)(b)
CAD GBP USD
AUD YEN Other
CHF EUR
Per cent
100
90
80
70
60
50
40
30
20
10
0
1995 99 2003 07 11 15
Sources: IMF COFER and our own calculations
(a) COFER only covers between ½ and ¾ of reserves.
(b) Pre-1999 EUR is defined as the sum of French Franc, Deutsche Mark, ECU and Dutch Guilder.
There are many ways to assess the adequacy of a country’s accumulated FX reserves to
cover precautionary demand. Reserves are compared to various metrics including three
months of imports, 100% of short-term external debt plus the current account deficit (the so-
called Greenspan-Guidotti rule) and 20% of broad money. The IMF uses a more
comprehensive FX reserve adequacy metric which combines several flow and external
balance sheet risks: capital outflows from non-residents, capital outflows from residents and
foreign currency shortfalls from reductions in export income.3
Using the IMF metric as a benchmark, Chart 9 shows the distribution of over and under-
insurance across regions, calculated by summing the over or under-insurance of individual
countries. The IMF recommends that countries hold 100%-150% of this metric. So over-
insurance is measured in the chart as any FX reserve balance in excess of 150% of the IMF
metric and under-insurance is any shortage of FX reserves below 100%.
In aggregate, FX reserves appear adequate. However, there is clear heterogeneity across
regions: Asia and MENA appear, in aggregate, significantly over-insured and Central and
Eastern Europe, Sub-Saharan Africa and Latin America appear, in aggregate, relatively
under-insured. Mechanisms to redistribute FX reserves within regions would go some way to
ensure all countries have access to sufficient FX reserves, but some redistribution between
regions would be necessary for all countries to have access to adequate FX reserves on the
IMF metric.
3
This metric takes into account “four components reflecting potential drains on the balance of payments: (i) export income to reflect the potential
loss from a drop in external demand or a terms of trade shock; (ii) broad money to capture potential residents’ capital flight through the liquidation
of their highly liquid domestic assets; (iii) short-term debt to reflect debt rollover risks; and, (iv) other liabilities to reflect other portfolio outflows.”
The weights assigned to each individual component in the case of fixed exchange rate regime (floating exchange rate regime) equal,
respectively, 10 (5)%, 10 (5)%, 30 (30)%, 20 (15) %. The IMF shows this metric to be a better indicator of adequacy than the traditional metrics
(IMF (2013a)).
13Chart 9 EME FX reserves: regional over and under-insurance 2014(a)
US$ billions
1,000
Total under-insurance Total
over-insurance 900
800
700
600
500
400
300
200
100
0
Asia CEE and Latin MENA SSA
Central Asia America
Sources: IMF International Financial Statistics, IMF World Economic Outlook and our own calculations.
(a) Over-insurance (under-insurance): individual EMEs’ reserves above 150% (below 100%) of the IMF reserve
adequacy metric summed by region.
Key features of foreign exchange reserves
Versatility of use: A key feature of FX reserves is that the owner has full independence over
their usage. Reserves can be used to dampen exchange rate volatility, to provide market-wide
foreign currency lender of last resort (LOLR) facilities to domestic banks or corporates and
to provide financing to governments facing short-term liquidity difficulties. Moreover, their
availability is certain, they can be deployed almost immediately and their use is not subject
to conditionality.
Effectiveness: Reserves can support a country’s balance of payments position in two ways:
(i) ex ante they signal that a country has sufficient liquid assets to be able to meet liquidity
shocks reducing the probability of a sudden stop in capital flows (Krugman (1979)). The
IMF shows that countries with sufficient FX reserves according to their reserve adequacy
metric are significantly less likely to suffer a sudden stop (IMF (2013b)); and (ii) ex post, in
the case of a stress event, they provide a first line of defence to cover foreign currency or
balance of payments needs.
The evidence suggests, however, that not all FX reserves may in fact be used in a stress
situation. Countries have been unwilling to allow their FX reserve balances to fall
substantially in the event of a balance of payments need. Aizenman and Sun (2009)
document that during the global financial crisis some countries exhibited a “fear of losing
international reserves”. Between July 2008 and February 2009, twelve of the largest
EMEs experienced small or no reduction in FX reserves. The majority of EMEs were not
willing to deplete their reserves by more than 25%. Assuming that this is the norm and
that countries are also not willing to deplete reserves below the 100% of the
aforementioned IMF metric, we estimate that only US$1.6 trillion of EMEs’ FX reserves
14are actually “usable”, less than one quarter of EMEs’ US$7.2 trillion total FX reserves.
The recent concerns in financial markets about the reduction in China’s FX reserves
during the summer of 2015 (despite a very large stock) is further suggestive of the limits
to using FX reserves.
Cost to the holder: Reserves are a costly source of liquidity insurance. To limit the impact
of FX reserve accumulation on the domestic money supply, most central banks sterilise their
intervention by draining liquidity from domestic financial markets through the issuance of
central bank securities or by selling other liquid assets (e.g. Treasury bonds). The fiscal cost
of FX reserve accumulation can be calculated as the difference between the interest paid on
the sterilisation instrument and the interest received on FX reserve assets, which are typically
low-yielding, low-risk foreign government bonds. The IMF estimated this wedge to be
around 200 basis points on average (IMF (2011)). Reserve accumulation can also leave
countries exposed to the risk of capital losses following exchange rate appreciations. Some
have also argued that official FX reserves holdings take up an increasing amount of global
safe assets which can give rise to distortions to market prices (e.g. Farhi, Gourinchas and
Rey (2011)).
The cost of holding FX reserves can incentivise their usage. Unlike other forms of liquidity
insurance, the use of FX reserves reduces the size of the FX reserve stock and so reduces the
cost of holding them. However, this could be offset by future rebuilding of FX reserve
stocks.
Global considerations: Excess FX reserve accumulation has been identified as one
important factor that has contributed to global current account imbalances.4 In the short
term, when countries are in a liquidity trap, running current account surpluses to build up
FX reserve balances can lead to low aggregate demand and lower output in other
countries.5 As FX reserves are built up, excess demand for US treasuries compresses
yields which may contribute to search for yield behaviour by investors.6 Moreover, there
is some evidence that FX reserve accumulation can crowd out domestic investment as
central bank sterilisation bonds compete for domestic savings.7
2.2 Bilateral insurance: central bank swap lines
Swap lines are contingent arrangements between central banks to enter into foreign exchange
transactions. The liquidity-providing central bank provides its domestic currency for a fixed
term at the market exchange rate, in exchange for the currency of the recipient central bank.
On maturity, the transaction is unwound at the same exchange rate so, provided each party
repays, neither party has direct exposure to exchange rate risk. The liquidity-providing
central bank bears the credit risk of the borrowing central bank. In the event that the
4
Bernanke (2007). http://www.federalreserve.gov/newsevents/speech/bernanke20070911a.htm
5
See, for example, Blanchard and Milesi-Ferretti (2012).
6
ECB (2006) https://www.ecb.europa.eu/pub/pdf/scpops/ecbocp43.pdf
7
Reinhart and Tashiro (2013).
15borrower is unable to repay, the lender is exposed to the exchange-rate risk on the currency
taken.
Swap lines can also involve the liquidity provider lending to the borrowing central bank in a
foreign currency. In this case, the liquidity providing central bank lends its FX reserves in
return for the borrower’s domestic currency, providing wider access to hard currency FX
reserves.
Since the global financial crisis there has been a proliferation of swap lines. By October
2008, in response to the seizing up of global financial markets, the Federal Reserve (Fed)
had extended swap lines to fourteen countries. Many of these have subsequently expired
and not been replaced. The peak aggregate usage across all borrowers was US$586
billion in December 2008.8 The Bank of England drew US$95 billion from the Fed,
which was on-lent to UK resident financial institutions. Other notable facilities were
euro-denominated swaps by Sweden and Denmark to Latvia in December 2008, which
they extended while simultaneously having swap arrangements with the ECB. And a
Swiss franc denominated swap line between the ECB and SNB which was introduced in
October 2008.
In 2011 the Fed, Bank of England, Bank of Canada, Bank of Japan, ECB and the Swiss
National Bank set up a network of US dollar and non-US dollar swap lines with no
formal size limit, which are subject to central bank mandates and were put onto a
standing basis in October 2013.9 The People’s Bank of China (PBOC) currently has 31
active swap lines which have been set up for a range of reasons, including to promote
RMB internationalisation. The RMB swap lines currently total US$500 billion (Volz
(2016)). A summary of the major existing swap lines can be found in Annex A1.
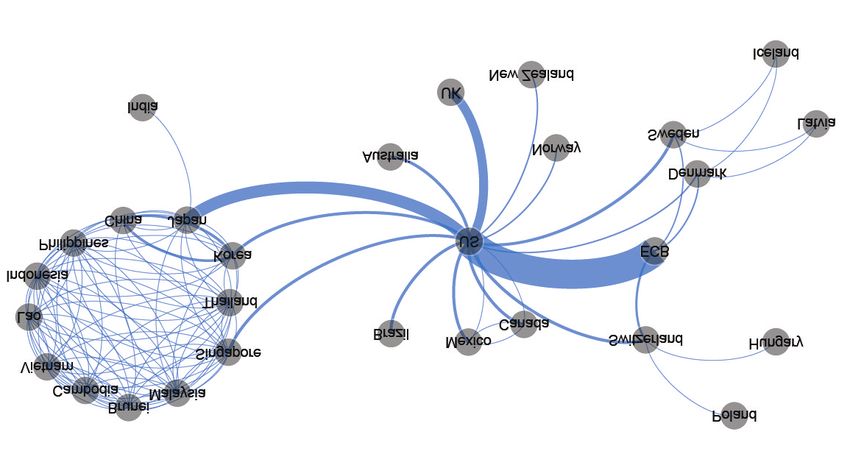
In January 2007, the majority of swap lines were in the Chiang Mai Initiative. These
turned into an RFA once they became multilateral in March 2010. Since 2007 the number
of non-Chiang Mai central bank swap arrangements has increased from 6 to 118 (Charts
10 and 11), and involve 42 central banks. Those with a formal limit total US$1.2
trillion.10
8
The main drawings at the time were from the ECB (US$314 billion), the Bank of Japan (US$128 billion) and Bank of England (US$95 billion).
9
The BoC’s swapline with the FED was capped at US$30 billion until October 2013. While agreement to put the swap lines on a standing basis
was announced in October 2013, the contracts making this happen were typically signed in January 2014.
10
If both central banks have access to liquidity (“reciprocal” agreements) we count the value twice.
16Chart 10 Network of bilateral swap lines
Chart 10a January 2007
(a)
Chart 10b January 2009(b)
Chart 10c October 2015(c)
Sources: Central bank websites and our own calculations.
(a) Includes swap lines under the Chiang Mai Initiative.
(b) Includes swap lines under the Chiang Mai Initiative.
(c) Does not include swap lines under the Chiang Mai Initiative Multilateralization as this network is no longer
based on bilateral swap lines. The value of the links in the uncapped advanced economy network are illustrative.
For central banks which drew from the Federal Reserve in 2008/09 we assume they can draw from each of the
other central banks in the network the smaller of (i) their maximum drawing from the Fed and (ii) the lending
central bank’s maximum drawing. For central banks which didn’t draw we assume that they can draw an amount
equivalent to the average past drawings relative to the GDP of the borrower, multiplied by that country’s current
GDP. The effective lines could be larger or smaller than these illustrative values. It is unlikely that a central bank
would draw on all of these lines simultaneously.
17Chart 11 Estimated value of central bank swap lines(a)(b)
Estimated value of unused AE swap lines (right-hand scale)
Maximum past usage of AE swap lines (right-hand scale)
Swap lines with fixed limit (right-hand scale)
Number of arrangements (left-hand scale)
US$ billions
180 3,000
160
2,500
140
120 2,000
100
1,500
80
60 1,000
40
500
20
0 0
2005 07 0 91 1 1 3 1 5
Sources: Central bank websites and our own calculations.
(a) The value of the swap lines is equal to the sum of all bilateral swap line arrangements. The value of
reciprocal (two-way) arrangements is counted twice (once for each currency provided). Maximum past drawings
are calculated for swap lines in the AE central bank swap network; those which haven’t been drawn have been
estimated based on the average past drawings of those lines which have relative to their GDP.
(b) The sharp fall in the number of swap lines is due to the multilateralisation of the Chiang Mai Initiative.
One way to estimate the potential size of the uncapped AE swap network is to base potential
drawings on the maximum past drawings. The sum of the individual maximum past drawings
from the Fed by central banks currently in the AE swap network is US$567 billion. Using
these drawings and assuming central banks which haven’t drawn would have access equal to
the average of maximum past drawings, relative to GDP, would suggest the potential
capacity of the entire AE network could be of the order US$1.2 trillion. This includes the
ability of the Fed to borrow large amounts of foreign currency from the other AE central
banks. Global swap lines could potentially provide around US$2.4 trillion of temporary
liquidity support, although these estimates are highly uncertain.
The Fed is not the only central bank to provide swap lines denominated in US dollar. For
example, Japan has US dollar swap lines to three EMEs amounting to US$85 billion and Sweden
has a US$500 million swap line with Ukraine. Currently the bulk of resources are among the six
AE central banks (Chart 10c) although the PBOC has the most extensive network.
Key features of swap lines
For a central bank to be able to enter into a swap arrangement with another central bank, that
facility needs to be consistent with the central bank’s mandate. These mandates are typically
focussed on domestic monetary and financial stability.11 Where swap lines are appropriate,
they have been justified by the risk of disruption to financial stability with spillovers to the
11
Swap lines are generally, but not always, between central banks. For example, the Japanese US dollar swap lines use the government’s FX
reserves.
18liquidity-providing central bank’s economy and financial systems, including through
disruption to key funding markets. An additional constraint is that many central banks’
liquidity facilities are aimed at market-wide disruption rather than idiosyncratic problems at
individual institutions. As such the scope of swap line liquidity provision is very narrow, and
typically limited to facilitating market-wide liquidity provision to cross-border banks for the
purposes of domestic financial stability.
Versatility of use: Access to swap line liquidity can never be fully guaranteed and available
on demand since the liquidity-providing central bank needs to ensure consistency with its
mandate and so has veto power over the issuance of its own currency. Swap line transactions
also tend to be very short-term, with maturities up to three months, further limiting their use
to short-term temporary FX liquidity problems.
Effectiveness: During the global financial crisis, swap lines appeared to have a strong
signalling effect to markets. Evidence from the timing of market price movements in late
2008 suggests that the US dollar swap line played a pivotal role in calming market concerns
about a dollar shortage in South Korea (Aizenman (2010), Baba and Shim (2010), and
Goldberg et al (2011)).
Cost to the borrower: Swap lines are the the least expensive form of FX liquidity insurance
for the borrower. The existing lines have no commitment costs. Some past Fed arrangements
have charged a mark-up of 50 basis points over a benchmark interest rate.12 They are
generally priced at a cost which is not attractive during normal periods, but is not
prohibitively expensive during crisis periods. Although the Fed publishes their interest rates,
borrowing costs are often not public.
Global considerations: Swap lines are not a substitute for IMF or RFA lending to fill
balance of payments needs. And there is a risk of moral hazard as no conditionality is
attached to borrowing. Central bank swaps are primarily used to allow central banks to
provide foreign currency liquidity to their domestic banking systems. When the liquidity is
used in this way, close ties with the banking supervisor and the features of normal market-
wide lender of last resort facilities (financial sector regulation, pricing, haircuts and loan
collateral) are used to reduce moral hazard.
2.3 Regional insurance: regional financing arrangements
Triggered by painful financial crises and the stigma associated with IMF lending, regional
financing arrangements (RFAs) have emerged as an important part of the GFSN. They are
arrangements between groups of countries (usually, although not always, in the same region) to
pool resources such that each member has access to more resources than it contributes. Most of
them are set up to address foreign currency liquidity problems or balance of payments problems,
for instance the Chiang Mai Initative Multilateralization (CMIM). But some, notably the
European Stability Mechanism (ESM), are designed for liquidity support in domestic currency.
12
http://www.federalreserve.gov/newsevents/press/monetary/20111130a.htm
19There is no single model for an RFA and the existing RFAs are extremely heterogeneous (IMF,
(2013c)). Some, such as CMIM and the BRICS Contingent Reserve Arrangement (CRA) are
built on a multilateral network of central bank swap lines, typically using members’ FX reserves.
Others, such as the ESM, are underpinned by sovereign balance sheets, with governments
providing the full amount of funds themselves, or providing capital which is levered by the RFA
through private sector borrowing. The ESM was developed as part of completing the euro area
currency union and, as such, has quite different features to other RFAs.
In most RFAs the credit risk is shared across members. The exposure to uncollateralised
credit risk has led many arrangements to require that countries take up an IMF programme
before they can access the full amount promised under the arrangements. For example, under
both the CMIM and the BRICS CRA only 30% of a country’s total access can be disbursed
without an IMF programme and the conditionality that comes with it.
RFAs provide for very heterogeneous coverage across countries. Taken together, the US$1.3
trillion of committed RFA resources are very similar to those of the IMF (Chart 12). Yet,
RFA resources are unequally distributed. While the Eurozone countries have committed
resources of over 6% of GDP, CMIM resources are worth 1.3% of members’ GDP and the
BRICS CRA resources are worth 0.6% of the BRICS’ GDP (Chart 13). However, many
EMEs do not have access to RFAs at all (Chart 14).
Chart 13 RFA resources as percent of members’
Chart 12 IMF and RFA resources, 2014(a)(b)
GDP, 2014(a)
Bilateral loans
NAB
Per cent of GDP
Quota 7
US$ billions
1,400
188 6
1,200
Number of members 5
1,000
19 4
800
3
600
2
400
1
13
200
5 28 9 0
ESM
CMIM
EU BoP
BRICS CRA
EFSM
EFSD
FLAR
AMF
6 8 22
0
IMF
ESM
CMIM
BRICS
CRA
EFSM
EU BoP
EFSD
FLAR
AMF
Sources: IMF World Economic Outlook, RFA Sources: IMF World Economic Outlook, RFA websites
websites and our own calculations. and our own calculations.
(a) Based on total resources. These are not (a) Based on total resources. These are not necessarily
necessarily lendable resources. lendable resources.
th
(b) The recent ratification of the IMF’s 14 General
Review of Quotas will see the IMF permanent
resources double and the temporary resources fall
by a similar amount.
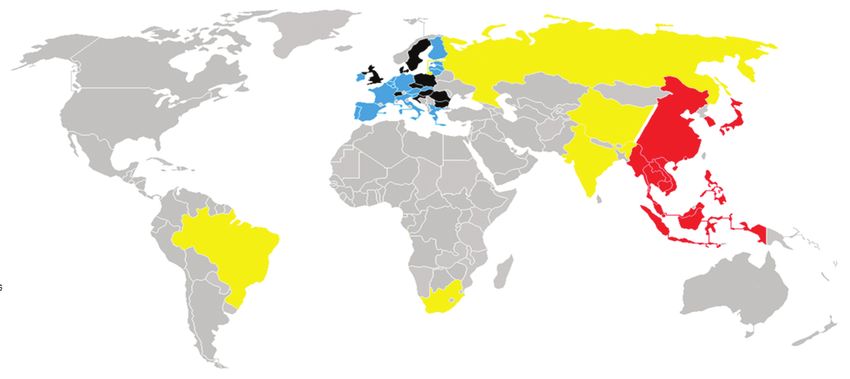
20Chart 14 Map of access to RFAs bigger than 0.5% of members’ GDP, 2014
BRICS CRA ESM
Chiang Mai Initiative Multilateralization EU BoP assistance facility
Sources: IMF World Economic Outlook, IMF (2013b), RFA websites and our own calculations.
Key features of regional financing arrangements
Versatility of use: The versatility of RFAs varies by arrangement (see Table B for details of
RFAs). The CMIM is built on a network of central bank swaps and partial drawing is
permitted without oversight by other members. This suggests that some of the CMIM’s
resources could be extremely versatile and accessible. However, the CMIM has never been
drawn upon.
The ESM expects any euro area Member State requesting financial assistance “…to address,
wherever possible, a similar request to the IMF”.13 This may limit the versatility of financing
to situations whereby ex post IMF lending is appropriate. The ESM offers precautionary
lending facilities – the Precautionary Conditioned Credit Line (PCCL) and the Enhanced
Conditions Credit Line (ECCL) – which are currently unused. Once a country has qualified,
these are more flexible instruments which can be drawn at will.
Where RFA borrowing is conditional on an economic adjustment programme, there may be
political difficulties associated with RFA members applying conditionality on neighbouring
countries. Programme negotiation may therefore be rather complex which could reduce the
flexibility and speed of access to RFA funds.
Effectiveness: There has been limited use of some RFAs to date which raises some questions
about the robustness of the arrangements. But in the euro area, the ESM (and its predecessor
the EFSF) have been widely used with Cyprus, Greece, Ireland, Portugal and Spain having
all received funds.
13
http://esm.europa.eu/about/index.htm. The ESM is also able to grant precautionary credit lines which do not have a link to the IMF. These
have yet to be used.
21A significant limitation of RFAs is that shocks to members are likely to be correlated. If a
country facing a crisis is unable to contribute resources, the RFA’s lending capacity will fall
at times when calls upon are likely to be high.
Table B Summary of key regional financial arrangements, August 2015
RFA & year of Size (US$ Funding Distribution IMF involvement Conditionali Prior usage
establishment billions) source ty
and
number of
members
ESM (2012) 785 total Member Loans, interventions in Expected but not Yes. Loans to Greece,
560 lending capital debt markets, necessary. Ireland, Portugal,
capacity leveraged precautionary Cyprus, Bank
(19) with capital assistance and loans to recapitalisation for
market government for bank Spain, Greece.
borrowing. recapitalisations.
Chiang Mai Initiative 240 FX Central bank swaps. If access > 30% Yes, if –
Multilateralisation (13) reserves. Precautionary lines of maximum. access
(CMIM) (2012) possible >30%.
BRICS Contingent 100 FX Central bank swaps. If access > 30% Yes, if –
Reserve (5) reserves. Precautionary lines of maximum. access
Arrangement (CRA) possible. >30%.
(2014)
EU BoP assistance 56 Member Loans to non-euro area Not necessary, Yes. Loans to Italy, Ireland,
facility (established in (9) capital EU countries. but post-2008 France and Greece in
its current form in leveraged programmes 1970-90s. Loans to
2002, predecessors with capital jointly with IMF. Hungary, Latvia,
in 1970) market Romania post-2008
borrowing.
EU EFSM (2010) 54 Member Loans and pre- Yes. Yes. Contributed around one
(28) capital cautionary financing to third to the recent
(a)
leveraged all EU countries . Ireland and Portugal
with capital programmes and a
market bridge loan to Greece in
borrowing. mid-2015.
Eurasian Fund for 8.5 Fully paid Loans to member – Yes. US$3billion loan to
Stabilisation and (6) by governments or for Belarus (2011),
Development (EFSD) members. infrastructure projects. US$70 million to
(2009) Tajikistan (2010).
Arab Monetary Fund 4 Member Seven facilities from – Yes, if loan > Loans thirteen
(AMF) (22) capital short-term to seven 100% of countries since 1978,
(1976) leveraged years and for various paid-in most recently Egypt
with capital purposes. capital. and Morocco drew
market both about US$500
borrowing. million.
Latin American 6 Member Five loan types, – Ex ante for Six of its eight
Reserve Fund (8) capital including precautionary some loan members drawn on
(FLAR) (1978) leveraged tools, up to three years. types. the fund since 1978.
with capital No conditionality in Post-2008 Ecuador
market practice. drew US$2 billion.
borrowing.
Sources: Regional financial arrangement websites.
(a)
Since the establishment of the ESM, euro-zone countries are expected to approach the ESM first, though
“there may be exceptional situations where practical, procedural or financial reasons call for use of the EFSM,
generally before or alongside ESM financial assistance”. (Council Regulation (EU) 2015/1360). A case in point
was the bridge loan for Greece in mid-2015.
Cost to the borrower: RFAs that are built on FX reserves pooling can be significantly more
cost-effective than FX reserves accumulation by individual countries. If shocks hit individual
countries (but not entire regions), then a regional FX reserve pool works like an insurance
mechanism: countries can access the FX reserves pool when necessary and hence need to
accumulate fewer reserves themselves. This saves fiscal costs incurred through sterilisation.
Borrowing costs are often unspecified. The ESM pools the creditworthiness of the whole
euro area, giving borrowers access to finance at rates significantly lower than they could
22access independently. For example, the ESM charges its own borrowing costs, a charge to
cover the cost of holding liquid assets, a (~50 basis points) service fee, plus a (10-35 basis
points) margin that varies by type instrument.14 For example, this meant that Spain and
Cyprus were charged lending rates between 0.6% and 1.1% during 2014 for their ESM
program loans.15
Global considerations: RFAs can be a valuable source of additional financing in the case of
idiosyncratic shocks and are a more efficient way of accessing insurance than relying heavily
on FX reserve accumulation. But RFAs may be less suitable for dealing with region-wide or
global economic shocks. There is a risk that the continued evolution of RFAs could be seen
to undermine the case for a strong global financial backstop like the IMF. In reality, only a
global institution has broad enough membership to effectively backstop countries in region-
wide or global crises.
2.4 Multilateral insurance: IMF
The IMF has a mandate to ensure the effective operation of the international monetary
system, encourage monetary cooperation and attempt to prevent economic crises through a
system of surveillance and to resolve economic crises through lending to stricken countries.
IMF resources play a vital backstop role to the GFSN, serving as the last line of defence
when a country has a BoP or sovereign debt crisis. IMF resources are made up of four types
of funds:
Quotas: Quotas are the IMF’s permanent resource base. Each IMF member
contributes according to a formula based on their shares of GDP, FX reserves,
economic openness and the variability of capital flows. Quota is fully paid-up, with
25% being paid in SDR or an SDR currency and the rest paid in the member’s
domestic currency.16 The total value of IMF quotas has recently doubled from SDR
238 billion (US$334 billion) to SDR 477 billion (US$671 billion) with the
ratification of the 14th General Review of Quotas (GRQ).
GAB: The General Arrangements to Borrow are a set of credit arrangements between
eleven IMF members (plus Saudi Arabia who has an associated arrangement) that
was established in 1962. In 1983, it was expanded to its current size of SDR 17
billion (US$24 billion).
NAB: The New Arrangements to Borrow are a set of credit arrangements between 38
member countries which allows the IMF to temporarily increase its lending capacity
without going through a full quota review. The NAB was originally set up in 1995,
and was expanded to SDR 370 billion (US$ 520 billion)) in 2009.17 These resources
will fall to SDR 182 billion (US$256 billion) once the 14th GRQ quota increases are
fully paid-in. The NAB is currently due to expire in 2017.
14
See “FAQ on the ESM”. http://www.esm.europa.eu/publications/index.htm
15
ESM (2014).
16
http://www.imf.org/external/np/exr/facts/quotas.htm
17
Although it didn’t become effective until 2011. https://www.imf.org/external/np/exr/facts/gabnab.htm
23 Bilateral loans: Since October 2012, 35 IMF members have entered into bilateral
lending arrangements with the IMF. 33 of these agreements are effective and
currently provide the IMF with US$380 billion.18 They were initially intended as
temporary arrangements designed to give the Fund additional lending capacity during
a period of heightened volatility. These arrangements are due to start expiring in late
2016.
Permanent IMF quotas have historically made up the vast majority of IMF resources, but the
situation has significantly changed since the 2007-08 financial crisis. Until the ratification of
the 14th GRQ, borrowed resources accounted for three quarters of total IMF resources, an
unprecedented break from the IMF being an institution funded primarily by quotas. The 14th
GRQ has delivered some rebalancing, with permanent resources rising to just over half of
total resources. But even after this rebalancing the IMF will still be exceptionally reliant on
temporary borrowing which may not be reliably available over the medium term. NAB
activation can be blocked by members with only 15% of votes. And without renewal, the
scheduled expiry of the NAB and bilateral loan agreements over the next two years would
significantly reduce the IMF’s lending capability (Charts 15 and 16).
Chart 15 IMF resources as percentage of global Chart 16 IMF resources as percentage of global
GDP, 1980-2020(a) external liabilities, 1980-2020(a)
Quota GAB Quota GAB
Bilateral borrowing NAB Bilateral borrowing NAB
Per cent Per cent
2.0 3.0
1.8
2.5
1.6
1.4
2.0
Resource path
without extension 1.2
Resource path
1.0 without extension 1.5
0.8
1.0
0.6
0.4
0.5
0.2
0.0 0.0
1980 84 88 92 96 2000 04 08 12 16 20 1980 84 88 92 96 2000 04 08 12 16 20
Sources: IMF International Financial Statistics, IMF Sources: IMF International Financial Statistics,
World Economic Outlook and our own calculations. updated and extended version of dataset constructed
by Lane and Milesi-Ferretti (2007) and our own
(a): Resource path without extension assumes all calculations.
temporary resources roll-off at current expiry dates,
with no further extension. The path includes the quota (a): Resource path without extension assumes all
increase as a result of the ratification of the 14th GRQ. temporary resources roll-off at current expiry dates,
with no further extension. Assumes constant global
external liabilities. The path includes the quota
th
increase as a result of the ratification of the 14 GRQ.
18
http://www.imf.org/external/np/exr/facts/pdf/finfac.pdf
24Since 1980, IMF resources have fluctuated around 1% of global GDP. The sharp increase in
temporary borrowing has taken Fund resources to about 1.7% of global GDP. A better
indicator of the adequacy of IMF resources is the IMF’s size relative to global external
liabilities. These cross-border capital positions are a proxy for the risk that the IMF is
designed to protect countries against. On this measure, despite a rise in recent years, the IMF
has been on a downward trend since 1980. IMF resources are now equivalent to 1% of global
external liabilities, down from 2.5% in 1980.
Key features of IMF lending
There are three broad types of IMF lending: ex ante precautionary lending facilities, ex post
crisis lending and concessionary lending to low income countries. In this paper we focus on
the first two.
Ex ante precautionary lending facilities, the Flexible Credit Line (FCL) and the
Precautionary and Liquidity Line (PLL), are arrangements that provide qualifying countries
access to a guaranteed credit line for a fixed commitment fee. The FCL, aimed at countries
with very strong fundamentals, comes with no ex post conditions. The PLL, aimed at slightly
weaker countries, comes with some ex post conditionality.
Ex post crisis lending is focussed on providing finance to countries who have lost market
access, or who can only borrow on prohibitive terms. There are a range of instruments
available. The most common type is a Stand-By Arrangement (SBA) which lends over 12-24
months with a repayment period of 3¼ to 5 years and comes with conditionality to address
weaknesses in the borrowing economies fundamentals. Other facilities include the Extended
Fund Facility, for longer-term funding difficulties and the Rapid Financing Instrument for
very short-term emergency liquidity.
Versatility of use: The IMF lends directly to governments and is primarily used to finance
external borrowing needs and debt repayments. IMF lending has a relatively long maturity,
with repayment over a 3¼ to 5 year time horizon, suggesting it is targeted at medium to long
term financing needs.
Ex ante precautionary lending has limited conditionality so can be used much more freely by
the borrower. Once a country has qualified and has paid its commitment fee, the funds are
available to be drawn at any time. At this point they are certain, available at very short notice
and can be used for any purpose.
Ex post crisis lending is less versatile due to the nature of the programme conditionality.
Funding availability depends upon the borrower and the IMF coming to an agreement over
lending terms. Monitoring by IMF country experts limits the freedom to use the funds. There
can be delays both in countries approaching the IMF, due to stigma concerns, and then in
programme negotiations.
Effectiveness: The IMF has played a key role in providing financing during many crisis
events. The Fund’s enduring role since its creation in 1945 suggests that it provides an
25You can also read