Voluntary Health Insurance expenditure in low- and middle-income countries: Exploring trends during 1995-2012 and policy implications for progress ...
←
→
Page content transcription
If your browser does not render page correctly, please read the page content below
Pettigrew and Mathauer International Journal for Equity in Health (2016) 15:67
DOI 10.1186/s12939-016-0353-5

 RESEARCH                                                                                                                                      Open Access

Voluntary Health Insurance expenditure in
low- and middle-income countries:
Exploring trends during 1995–2012 and
policy implications for progress towards
universal health coverage
Luisa M. Pettigrew1 and Inke Mathauer1,2*

  Abstract
  Background: Most low- and middle-income countries (LMIC) rely significantly on private health expenditure in the
  form of out-of-pocket payments (OOP) and voluntary health insurance (VHI). This paper assesses VHI expenditure
  trends in LMIC and explores possible explanations. This illuminates challenges deriving from changes in VHI
  expenditure as countries aim to progress equitably towards universal health coverage (UHC).
  Methods: Health expenditure data was retrieved from the WHO Global Health Expenditure Database to calculate
  VHI, OOP and general government health (GGHE) expenditure as a share of total health expenditure (THE) for the
  period of 1995–2012. A literature analysis offered potential reasons for trends in countries and regions.
  Results: In 2012, VHI as a percentage of THE (abbreviated as VHI%) was below 1 % in 49 out of 138 LMIC.
  Twenty-seven countries had no or more than five years of data missing. VHI% ranged from 1 to 5 % in 39
  LMIC and was above 5 % in 23 LMIC. There is an upwards average trend in VHI% across all regions. However,
  increases in VHI% cannot be consistently linked with OOP falling or being redirected into private prepayment.
  There are various countries which exhibit rising VHI alongside a rise in OOP and fall in GGHE, which is a less
  desirable path in order to equitably progress towards UHC.
  Discussion and Conclusion: Reasons for the VHI expenditure trends across LMIC include: external influences;
  government policies on the role of VHI and its regulation; and willingness and ability of the population to
  enrol in VHI schemes. Many countries have paid insufficient attention to the potentially risky role of VHI for
  equitable progress towards UHC. Expanding VHI markets bear the risk of increasing fragmentation and
  inequities. To avoid this, health financing strategies need to be clear regarding the role given to VHI on the
  path towards UHC.
  Keywords: Private health insurance, Voluntary health insurance, Universal health coverage, Low- and middle-
  income countries, Health expenditure

* Correspondence: mathaueri@who.int
1
 Department of Health Services Research and Policy, London School of
Hygiene and Tropical Medicine, 15-17 Tavistock Place, London WC1H 9SH,
UK
2
 Department of Health Systems Governance and Financing, World Health
Organization, Avenue Appia, Geneva, Switzerland

                                      © 2016 Pettigrew and Mathauer. Open Access This article is distributed under the terms of the Creative Commons Attribution
                                      4.0 International License (http://creativecommons.org/licenses/by/4.0/), which permits unrestricted use, distribution, and
                                      reproduction in any medium, provided you give appropriate credit to the original author(s) and the source, provide a link to
                                      the Creative Commons license, and indicate if changes were made. The Creative Commons Public Domain Dedication waiver
                                      (http://creativecommons.org/publicdomain/zero/1.0/) applies to the data made available in this article, unless otherwise stated.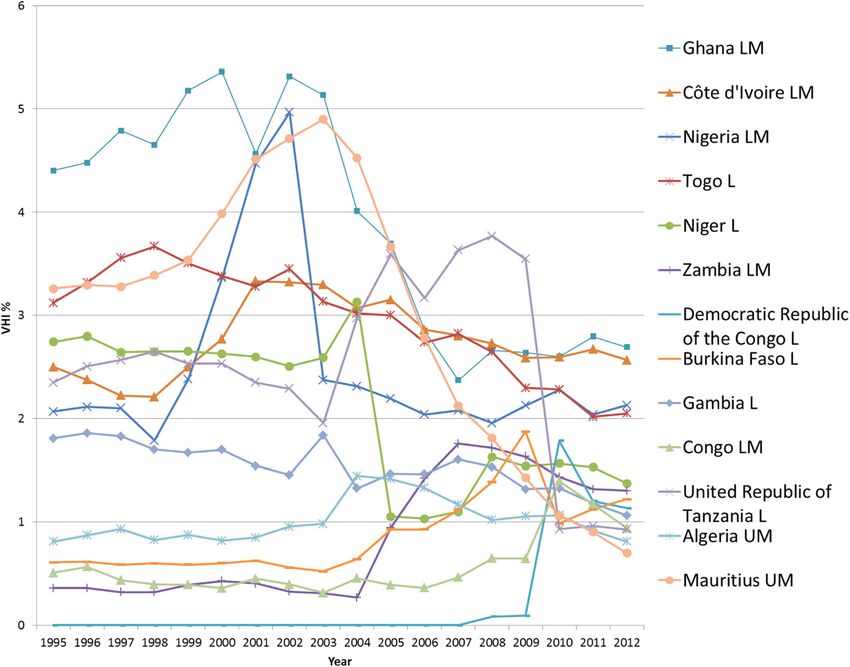
Pettigrew and Mathauer International Journal for Equity in Health (2016) 15:67                                             Page 2 of 19

Background                                                                  However there are no more recent publications pre-
Countries are increasingly determined to move towards                    senting and exploring overall trends in VHI expenditure
universal health coverage (UHC). This involves creating                  globally in LMIC with NHA data after 2002. The signifi-
financing mechanisms to ensure “that all people can use                  cance and role of VHI may have changed during this
the health services they need, of sufficient quality to be ef-           period as many LMIC have begun to place more attention
fective, while also ensuring that the use of these services              on their health financing system. The purpose of this paper
does not expose the user to financial hardship” [1]. This                is therefore to provide a comprehensive overview of VHI
progress towards UHC should be equitable in that lower                   expenditure trends in LMIC and to explore potential rea-
income and other vulnerable or disadvantaged population                  sons for these trends throughout the whole period of avail-
groups should equitably benefit from progress rather than                able NHA data since 1995 and with an additional 10 years
being left out until later [2]. Yet many low- and middle-                of data since the previous studies. This NHA data is made
income countries (LMIC) are still far from reaching UHC,                 available through the World Health Organization’s (WHO)
as they rely significantly on private health expenditure                 Global Health Expenditure Database (GHED) [13]. As such,
(PvtHE) as a share of total health expenditure (THE).                    this paper also serves as a data repository on VHI expend-
Most of PvtHE is made up of regressive out-of-pocket                     iture as a basis for further country analysis and future
payments (OOP). Another part of PvtHE is private health                  research.
insurance, now more frequently referred to as voluntary                     Voluntary health insurance (VHI) schemes are based
health insurance (VHI), which is also usually a more re-                 voluntary prepayment of premiums with the mode of
gressive form of prepayment than tax revenue or social se-               participation being upon the discretion of an individual
curity funds (referred to here as public health insurance)               or a firm or group. Benefits are agreed between the
and offers a more limited form of risk sharing. Overall,                 beneficiary and insurer. This is in contrast to compul-
PvtHE is thus a more inequitable form of health financing,               sory schemes where membership and payment of contri-
through which it is more difficult to progress towards                   butions are made compulsory by the government (by
UHC in an equitable way.                                                 law) for the population as a whole or large sections of
   This paper focuses on VHI in LMIC. Increases in VHI                   the community. VHI appears in many forms: there are
expenditure as a mechanism to finance health systems                     large commercial schemes as well as smaller non-profit
have implications on countries’ efforts to move towards                  ones. They include employer-based insurance contracts,
UHC. We do not argue that there is a threshold of VHI                    and community-based health insurance (CBHI) [14].
share that is harmful for UHC progress, but global evi-                     There are different categorizations of the role of VHI
dence suggests that VHI is not a suitable mechanism to                   in relation to public health insurance [5, 6]. The OECD
move towards UHC in an equitable way given its regres-                   categorization of VHI functions distinguishes between the
sive nature and other reasons outlined further below [1].                following: Primary; complementary; supplementary; or du-
It is therefore important to be aware of trends in VHI ex-               plicative [5] which are further explained in Table 1. In
penditure and to respond to potential challenges deriving                practice, several roles for VHI for different population
from changes in VHI expenditure and the role VHI plays.                  groups may co-exist in a country. It is often difficult to
   For countries of the Organisation for Economic Co-                    distinguish primary from supplementary VHI coverage
operation and Development (OECD) and the European                        when there is only a vaguely defined package of services,
Union various reviews of VHI expenditure trends, often                   in particular if they are of poor quality, or actually not
previously referred to private health insurance (PHI), as                available in practice.
well as country specific analyses are available [3–7]. Sekhri               The extent of advantages and disadvantages of VHI de-
and Savedoff (2005) provide a global overview and de-                    pends on its specific type. Each of the four types outlined
scriptive analysis of the share of PHI from THE in 2001.                 above has potential positive (foremost reducing OOP ex-
They indicate that in 2001 PHI expenditure was above                     penditure) and negative implications in progressing towards
5 % of THE in 39 countries worldwide, 25 (64 %) of these                 UHC, through specific effects on access, equity and effi-
being LMIC, pointing out how widespread PHI had be-                      ciency from a health system perspective. When prepayment
come across the globe [8]. Drechsler and Jütting (2005)                  levels through compulsory sources are minimal, VHI as a
provided an analysis of PHI as a share of THE from 1997                  form of prepayment and limited pooling could be prefera-
to 2001 based on National Health Accounts (NHA) [8, 9]                   ble to OOP expenditure, as it may expand financial protec-
which included LMIC, and gave an update for the period                   tion and access to additional services [1]. VHI has also been
1998-2002. They observed a rising, although so far overall               argued to potentially bring more money into the health sys-
small PHI shares of THE in LMIC [10, 11]. To note, glo-                  tem and to cross-subsidise at provider level as well as to en-
bally, there is no relationship (R2 = 0.01) between GDP                  hance uptake of new technologies [5, 6, 9, 15]. However,
per capita and VHI% [12], which was also earlier observed                VHI can suffer from a number of market failures due to ad-
by Drechsler and Jütting [10].                                           verse/risk selection, leading to a spiral of increasing
Pettigrew and Mathauer International Journal for Equity in Health (2016) 15:67                                                               Page 3 of 19

Table 1 Classification of VHI roles
VHI role                                                                       Country examples
Primary
Principal: Represents the only available access to health insurance.           In the United States of America, VHI has been the principal
                                                                               source of coverage before 2014 [78].
Substitutive: Substitutes for cover which would otherwise be available        In Germany and Chile, opt out options from the public health insurance
from the public health insurance system, but the individual has voluntarily system exist in order to be covered by VHI [3, 47]. Such substitutive VHI
opted out of this or is not entitled to it. In the case of opting out, people often includes additional services and is thus also supplementary in nature.
do not pay public health insurance contributions.
Complementary
Complements coverage of publicly insured services or services within           France’s complementary VHI primarily serves to reimburse copayments
principal/substitute health insurance, by covering all or part of the          required in the public health insurance system [79].
residual costs (e.g. co-payments).
                                                                               Community based health insurance schemes in Sub-Saharan Africa usually
                                                                               cover user fees, although they may also represent a form of principal
                                                                               voluntary health insurance.
Supplementary
Covers additional health services not covered by the public scheme;            In Germany supplementary VHI exists for additional services (e.g. dental
depending on the country this may include for example elective care,           care, private hospital room). Similarly supplementary VHI is found in the
long-term care, dental care, pharmaceuticals, rehabilitation, alternative or   Russian Federation, Latvia and Hungary [80].
complementary medicine, superior hotel and amenity hospital services.
Duplicative
Covers health services already covered under public health insurance, but In the United Kingdom duplicative VHI exists as an additional alternative
with access to other, additional providers or levels of service, e.g. private to the public system.
health facilities. However unlike substitutive insurance it does not exempt
enrollees from contributing to public health insurance.                       Similarly in Nicaragua, wealthy people may purchase VHI that provides
                                                                              access to the private sector and coverage of additional services that are
                                                                              not included in the mandatory public scheme. Yet, they continue paying
                                                                              public health insurance contributions [81].
Source for classification of VHI roles [5]

premiums, further enhancing adverse selection, thus poten-                      Methods
tially making VHI unaffordable and creating market instabil-                    This study is based on data from the WHO’s GHED
ity. VHI can significantly contribute to fragmentation and                      downloaded in December 2014. This provided data for
unbalanced risk pools in public health insurance with a lar-                    the years 1995–2012. Looking at the whole period for
ger proportion of sicker patients. It builds up barriers to re-                 which data is available helps to identify broader trends
distribute funding in favour of the poor or sick and thus                       and adds an additional 10 years of data to previous pub-
increases inequity in access if not well regulated. VHI can                     lications. The GHED covers all member states of the
also lead to increased use of unnecessary health care due to                    World Health Organization, currently 194, and provides
moral hazard and supplier-induced demand, this may be a                         a set of health expenditure data [13]. Data is added and
particular issue for supplementary and complementary VHI.                       updated on a yearly basis by the WHO Health Accounts
   Most importantly due to group interests and associated                       team. Each country makes data available in a standardized
resistance, it may be politically more difficult to introduce                   format by following the Health Accounts methodology,
or expand compulsory prepayments to finance coverage                            considered as the international standard [14, 16]. The
extension for less affluent population groups when a VHI                        Health Accounts methodology outlines basic accounting
market is already in place. This is can be seen in particular                   criteria and guidance on timeliness, data completeness,
where primary VHI coverage exists, even if it only covers                       consistency and accuracy as well as data validation and tri-
a small percentage of the population or contributes a                           angulation. This guidance aims to increase the reliability of
modest amount to the share of THE.                                              both public as well as private expenditure data collection.
   The next section describes the methodology for this                             However of particular concern is the data quality of
study. The results presents trends in VHI expenditure in                        VHI expenditure data. The OECD’s Systems of Health
LMIC and identifies factors that may explain these. A dis-                      Accounts and WHO’s Guide to Producing Health Ac-
cussion follows which brings together three emergent                            counts note that collecting data on VHI expenditure is
themes of factors from a global perspective which may in-                       one of the most challenging out of all the health expend-
fluence the development and role given to VHI. Finally                          iture types. As the NHA guidebook states: “Incomplete
conclusions, policy lessons and implications in relation to                     sources and estimation methods of private expenditure
VHI and equitable progress towards UHC are offered.                             on health are among the major limitations for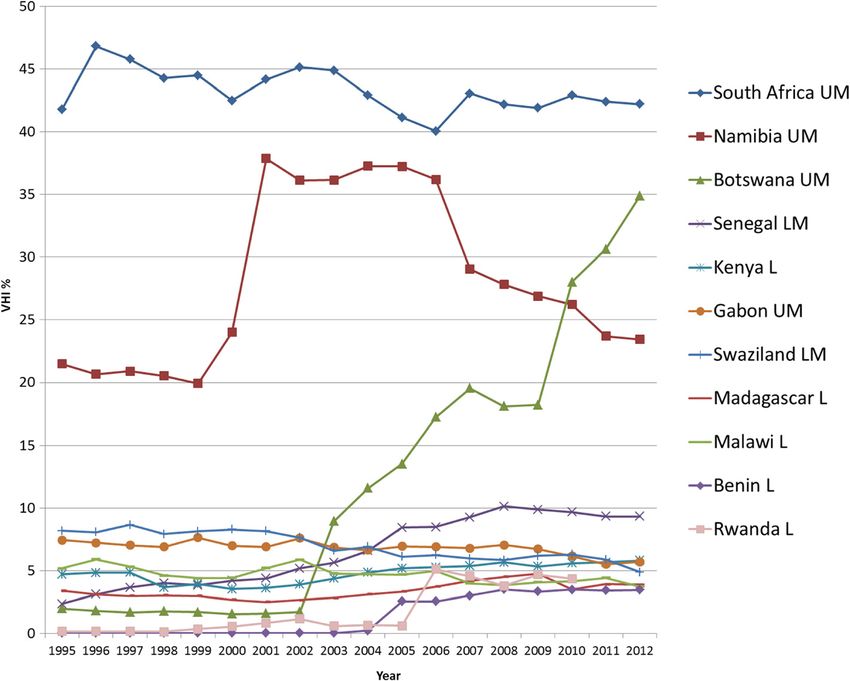
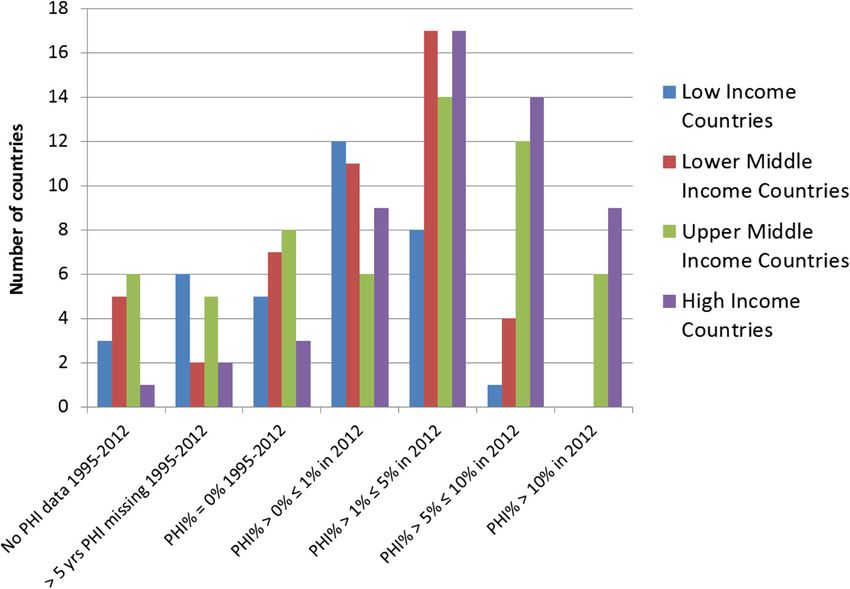
Pettigrew and Mathauer International Journal for Equity in Health (2016) 15:67                                              Page 4 of 19

international comparison” [16]. One specific challenge is                of the period in question (1995–2012) they were considered
that health insurance may be part of other types of in-                  as LMIC.
surance (e.g. life insurance) or health insurance may                      Countries with no data or more than five years of data
cover benefits beyond healthcare (e.g. income benefits)                  missing on VHI expenditure during 1995–2012 were ex-
which may be hard to disaggregate. Moreover, a fast                      cluded from the calculation of the VHI% average by
turnover of VHI organisations and limited or immature                    WHO region. For country trend analysis within each re-
market regulation can result in poor quality VHI data                    gional section below countries having had a VHI% ≥ 1 %
being provided. These factors alongside others around                    at least once during the last 5 years of the observation
the timing of data collection and movement of funds be-                  period (i.e. 2008–2012) were included.
tween the insurer, policy holder and healthcare provider,                  Grouped by WHO Regions the following individual
as well as the existence of reserve and surplus funds and                country data analyses are presented:
administrative costs, create potential limitations to the
accuracy of data [14, 16].                                                  1. VHI% trends between 1995–2012
   It also should be noted that the underlying terminology                  2. Summary tables in the Addendum (Additional file 2)
and definitions for the NHA data currently available in                        with:
GHED is based on the System of Health Accounts 1.0 [17]                        a. the direction in change (rise or fall) of VHI, OOP
which uses the term private health insurance (PHI). How-                          and GGHE as a share of THE (VHI%, OOP%,
ever, the newer System of Health Accounts (SHA) 2011                              GGHE%) between 1995 and 2012
edition has modified the classification and terminology in                     b. OOP% of THE in 2012, grouped into 3 categories
order to be more precise and employs the term voluntary                           (below 20 %, between 20–40 % and above 40 %)
health insurance [14]. In line with the SHA 2011 termin-
ology, this paper uses the term voluntary health insurance                 Changes in per capita expenditure in purchasing power
to refer to private health insurance, although data is based             parity dollars in VHI, OOP and GGHE were also analysed.
on the previous definitions.                                             As was THE as a percentage of GDP. These have not been
   The GHED includes estimates on GGHE (general gov-                     presented in this paper but have helped informed the results
ernment health expenditure) and PvtHE (private health                    and analysis. In addition to assessing VHI expenditure
expenditure) as percentages of THE (total health expend-                 trends, potential reasons for the trends in VHI expenditure
iture) and as expenditure in national currency units. It                 were explored and interpreted based on analysis of the lit-
also provides OOP and VHI expenditure as a percentage                    erature. A literature search of English publications was
of PvtHE. Importantly the VHI data available does not                    undertaken in PubMed and Web of Knowledge starting
identify what role VHI is playing as outlined in Table 1.                from 1990 to June 2015. Grey literature was searched for in
Only further country context information and literature                  Google, for which the first 7 pages (70 results) were
analysis allows exploration of which VHI role prevails.                  screened for relevant material. Titles identified through the
   VHI expenditure as a share of THE was calculated                      search process were reviewed, and if found to be relevant
based on the share of PvtHE in THE multiplied by the                     the abstract or executive summary was read. If this sug-
share of VHI expenditure in PvtHE. VHI expenditure as                    gested that the publication could provide a reason for the
a percentage of THE is abbreviated as “VHI%” as are                      trend in VHI expenditure the full publication was assessed.
“OOP%” and “GGHE%” when respectively referring to                        Additional papers were identified through the reference list
OOP and GGHE as a percentage of THE.                                     of literature identified, as well as through the authors’ know-
   To explore VHI expenditure trends countries were                      ledge of relevant publications. Potential explanations for
grouped by the WHO Regions as follows; African Region                    trends in VHI expenditure were recorded and then analysed
(AFRO) Region of the Americas (AMRO), Eastern Medi-                      to identify emerging themes. Health sector and health finan-
terranean Region (EMRO), European Region (EURO),                         cing strategy documents available on the IHP+ Platform
South East Asian Region (SEARO) and Western Pacific Re-                  were screened for whether they mentioned or defined the
gion (WPRO). Whilst there are differences between coun-                  role of VHI [18].
tries, this grouping is useful in that LMICs in these regions
show, on the whole, geographical and socio-economic simi-                Results
larities. The 2012 World Bank classification of country in-              Number of countries with VHI% data
come levels was used to categorize countries into low,                   The GHED provided information on 193 countries,
lower-middle, upper-middle and high income. Countries                    when data was downloaded. Out of these 55 countries
which moved into the high income classification between                  were classified as high-income countries (HIC) and 138
2010 and 2012 were still included in the LMIC country                    as LMIC in 2012. Figure 1 provides a summary of VHI data
trend analysis. Otherwise their exclusion could have missed              availability by country income group. Twenty-seven LMIC
relevant information on VHI trends as during the majority                (20 %) had no data or more than five years of missing VHI
Pettigrew and Mathauer International Journal for Equity in Health (2016) 15:67                                         Page 5 of 19

 Fig. 1 Overview of VHI in 2012 by country income classification

expenditure data; these were excluded from further analysis              WPRO country. In total, 74 countries met the final inclu-
(listed in Additional file 1). This left 111 LMIC with avail-            sion criteria for individual country trend analysis.
able data. Seven HIC countries (Antigua and Barbuda,
Chile, Latvia, Lithuania, the Russian Federation, Uruguay                VHI% trends by country income classification and by
and Saints Kitts and Nevis) were included in the regional                WHO region
analysis and in the literature search as they had been LMIC              A total of 46 countries had VHI% > 5 % in 2012, of these
for the majority of the 1995–2012 period (Fig. 2). From this             23 were LMIC and three countries had recently become
total of 118 countries, 20 countries reported zero VHI%                  HIC (Fig. 1). Worldwide, 56 countries had VHI% be-
throughout the period, and 30 countries reported a VHI%                  tween 1 % and 5 %, 39 of these were LMIC and three
of below 1 % in 2012. Countries with a VHI% of below 1 %                 had recently become HIC.
in 2012 were excluded from the individual country trend                    Figure 2 provides an overview of VHI% in LMIC in the
analysis and literature search, unless the VHI% had been                 six WHO regions in 2012. AFRO, AMRO and EURO have
above 1 % at some point during the period of 2008–2012,                  the greatest number of countries with missing data.
which was the case for five AFRO countries and one                       WPRO is the region with highest proportion of countries

 Fig. 2 Overview of VHI% in 2012 in LMIC + 7 recent HIC by WHO Region
Pettigrew and Mathauer International Journal for Equity in Health (2016) 15:67                                       Page 6 of 19

 Fig. 3 Average VHI% trends in LMIC + 7 recent HIC by WHO Region

reporting zero expenditure on VHI. AMRO has the high-                    has increased slightly. The highest average VHI% is
est proportion of countries with VHI% > 5 % compared to                  found in AMRO.
other regions. EURO, SEARO and WPRO have no coun-
tries with VHI% > 10 %.                                                  Country VHI% trends in LMIC by WHO region
   Figure 3 shows the VHI% averages of LMIC by WHO                       African Region (AFRO)
region during 1995–2012. With the exception of EMRO                      Out of the 46 AFRO LMIC, VHI expenditure data is re-
countries, since 1995 the average VHI% in all regions                    corded for 39 countries. The regional average VHI% for

 Fig. 4 AFRO Individual country trends of VHI%, 1995–2012, VHI% >3 % in 2012
Pettigrew and Mathauer International Journal for Equity in Health (2016) 15:67                                           Page 7 of 19

 Fig. 5 AFRO Individual country trends of VHI%, 1995–2012, VHI% ≤ 3 % in 2012

AFRO appears fairly stable between 3.2 %–4.2 % with a                    Kenya) GGHE% decreases, and notably the VHI% in-
slight upward increase (see Fig. 3). Fifteen countries                   creases in the latter two of these countries with OOP%
recorded a VHI% of less than 1 % over the past five                      also going up. This scenario with a fall in GGHE%, rise in
years in 2012, and five countries reported zero VHI%                     VHI% and rise in OOP% is undesirable with respect to
throughout 1995–2012. There is thus some consider-                       equitably moving towards UHC.
able variance across AFRO countries, as revealed in                         Community based health insurance (CBHI) usually
Figs. 4 and 5, which present individual country trends                   covers user fees and thus primarily serves as complemen-
of VHI% for 24 countries with a VHI% above 1 % be-                       tary insurance, but also may provide additional services in
tween 2008-2012. The data has been split into two                        a supplementary role. As such, it has increasingly been
graphs to enable reading with Figure 4 showing coun-                     perceived as a possible avenue through which to improve
tries with VHI% 3                       healthcare coverage in LMIC in Sub-Saharan Africa. The
% in 2012.                                                               uptake in the number of CBHI schemes [19] might be one
   South Africa, Namibia and Botswana have a notably                     reason for high percentage increases in per capita VHI
much higher VHI% in comparison to other countries in                     spending massively outstripping the associated relative
the region, with a significant increase in Botswana after                percentage increase in THE per capita expenditure be-
2002. Overall, though, only six countries have a VHI%                    tween 1995 and 2012, seen in Benin, Burkina Faso and
above 5 % in 2012. On looking more closely Senegal,                      Senegal. Rwanda also showed a substantial rise in VHI%
Benin and Rwanda respectively saw relatively sharp rises                 and VHI expenditure per capita, which can be explained
in VHI% during the period in question.                                   by the government's decision in 2005 to nationally roll out
   For each country it was assessed whether there was an                 the CBHI schemes (Mutuelles de Sante) [20, 21]. These
overall rise or fall in OOP% and VHI% set against a rise                 have been counted as VHI even though enrolment has
or fall in GGHE% (see Additional file 2). It shows that                  been mandatory in practice and therefore their classifica-
the GGHE% increases in 20 out of 24 countries. In six of                 tion will change under the new system of health accounts.
these countries, both OOP% and VHI% go down, while in                    Despite heavy promotion by some development partners
the other 13 countries, VHI% increases, whilst OOP% de-                  and some ministries, rates of CBHI enrolment remain lim-
creases. Ghana is the only country with rising GGHE as                   ited in most of the AFRO area [22]. Therefore ultimately,
well as an OOP% increase, while VHI% declines. However,                  increases in VHI expenditure via CBHI are also limited.
in four countries (Tanzania, Mauritius, Namibia and                      Thus, assumingly, some other part of the VHI expenditure
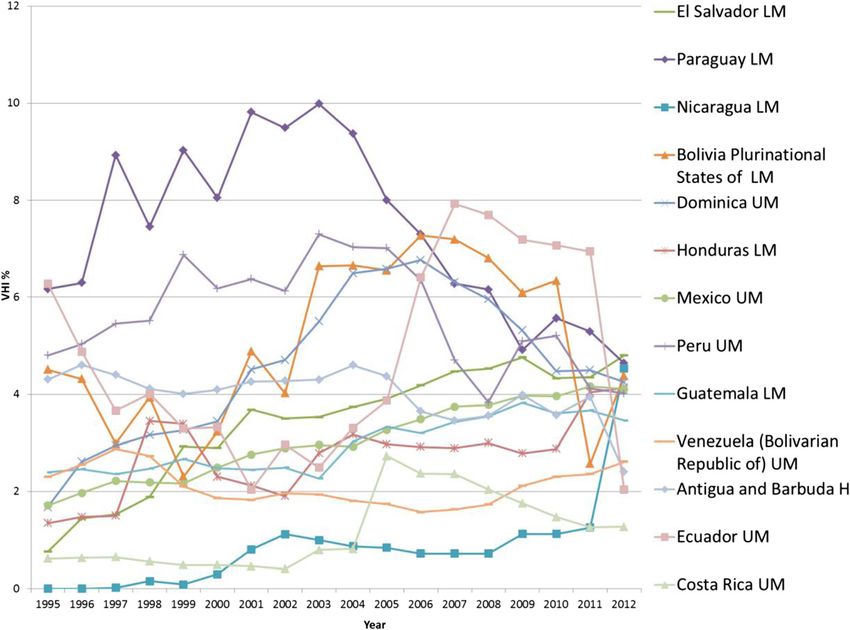
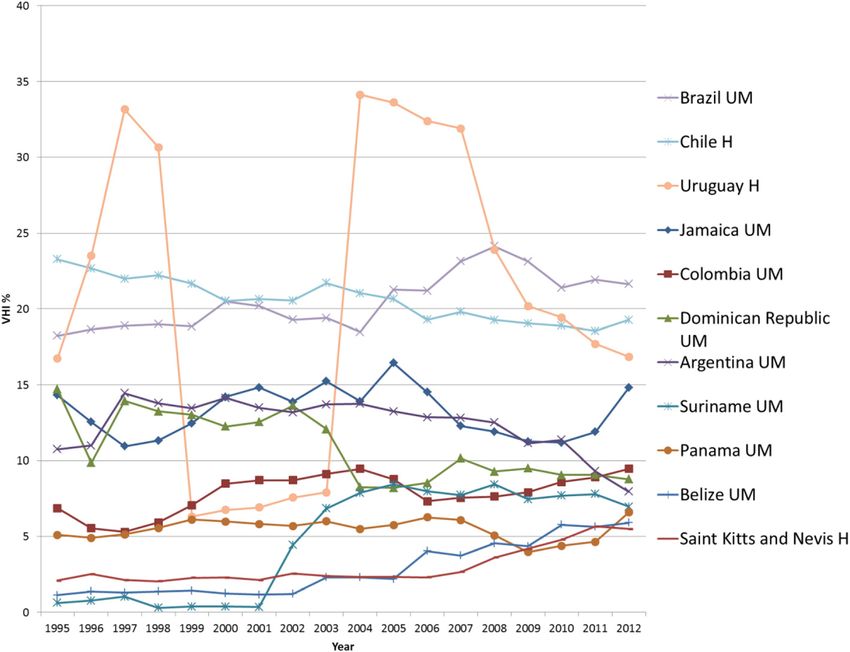
Pettigrew and Mathauer International Journal for Equity in Health (2016) 15:67                                         Page 8 of 19

increase may be explained by commercial VHI, also in a                   spent on VHI previously recorded (18 % in 2001), as re-
complementary and supplementary role targeted at                         ported by Drechlser and Jütting [11].
wealthier segments of the population, although this re-                    In summary, in AFRO, there is no consistent trend re-
mains affordable to very few.                                            garding the VHI expenditure changes: On the one hand,
  The much higher levels of VHI% preceding 1995 in                       some Southern African countries (South Africa,
South Africa and Namibia were due to the long exist-                     Namibia, Swaziland) with primary (principal) VHI,
ence of VHI that served the more affluent populations                    which had historically relatively higher levels, show de-
as primary (principal) coverage [11]. A similar develop-                 creasing VHI%, largely due to increased GGHE.
ment occurred in Botswana, where a rising middle class                   Botswana and Senegal show exceptionally large increases
could afford VHI [23]. Notably, VHI% is much higher                      of more than 30 and 5 percentage points respectively in
than the percentage of the population covered by VHI.                    VHI%. On the other hand, for countries with VHI%
The South African legacy of the apartheid period left a                  below 8 %, there are both upward and downward devel-
very inequitable and fragmented health financing system.                 opments within the range of 2 % percentage points for
VHI (called “medical aid schemes”) had been set up and                   most countries. In countries with an overall downward
tailored to the needs of wealthy white urban populations                 trend, increasing VHI expenditure per capita due to a
[24]. However, increasing unaffordability of VHI due to                  growing increasing middle class demanding better (sup-
high premiums led to a decline in VHI population cover-                  plementary and complementary) VHI coverage as well
age [25, 26]. There was also a fall in the number of VHI                 as the promotion of CBHI schemes may thus be offset
funds [27]. Following the African National Congress                      by increased government commitment for higher
coming into power in 1994 there has been progress to                     GGHE, which we argue is a more desirable direction on
address these inequities, reflected in the falling OOP%                  the path to UHC [31].
and rising GGHE% [28], which marginally reduced
VHI% in the post-apartheid period. Yet, the introduction                 American Region (AMRO)
of market-oriented policies in 1996, which intended to                   Out of a total of 30 LMIC in AMRO, 26 have VHI
stimulate the economy were a barrier to quick growth in                  data. Figures 6 and 7 present the individual country
public spending [29, 30]. It should also be noted that al-               trends in VHI% from 1995–2012 for the 24 AMRO
though Zimbabwe has been omitted in this study due to                    countries with VHI% above 1 % in any year between
missing data, it also had a substantial percentage of THE                2008 and 2012. Included are also Chile, Uruguay,

 Fig. 6 AMRO Individual country trends of VHI%, 1995–2012, VHI% > 5 % in 2012
Pettigrew and Mathauer International Journal for Equity in Health (2016) 15:67                                           Page 9 of 19

 Fig. 7 AMRO Individual country trends of VHI%, 1995–2012, VHI% ≤ 5 % in 2012

Antigua and Barbuda, and Saint Kitts and Nevis,                          just under half of these also showing an increase in VHI%,
which recently became HIC. Together with AFRO,                           while OOP% decreased (see Additional file 2).
AMRO has a much wider variation in VHI% com-                                For the 18 countries with a VHI% below 10 % in 2012,
pared to other regions. It also has the greatest pro-                    the overall trend has been for the VHI% to rise, at least
portion of countries with VHI% >5 %, and so AMRO                         during the first half of the period studied. In Suriname,
has had the highest average VHI% throughout the                          VHI exists in several roles: public health insurance is
18 year period (see Fig. 3). Although none of the                        primarily for civil servants, with voluntary membership
AMRO countries maintain as high a VHI% as South                          for others and the private formal sector is primarily cov-
Africa and Namibia, five AMRO countries maintained                       ered via employer based health insurance or other VHI
a VHI% of >10 % during all of the 18 year period,                        [32]. This covered about 17 % of the population in 2002
and only in the Dominican Republic did the VHI% of                       [33] and may have contributed to the rises noted in
15 % in 1995 decline and reach between 8–10 % from                       VHI%. In Colombia, the health sector underwent reform
2004 onwards. Likewise, Argentina shows a declining                      in 1993 guided by international financial institutions that
trend since 2000. There are also several countries in                    contributed to a slight growth of VHI [34]. In the Do-
AMRO with relatively sharp variations in VHI ex-                         minican Republic it was reported that deficiencies in the
penditure data. In the absence of plausible reasons to                   public tax financed system led to the initial growth of
explain such steep variations, questions around the                      the VHI sector, but in 2001 new laws created a social se-
data itself arise, in particular in Uruguay where there                  curity system with public health insurance that led to
is a significant dip and then return to the previous                     greater GGHE and caused VHI% in turn to fall gradually
trend in the early 2000s. The data has been split into                   over the 2000s [35]. In Mexico, the opt-out option from
two graphs to enable reading with Figure 6 showing                       the public health insurance scheme for private sector
countries with VHI% 5 % in 2012.                                                            tive) VHI instead since 1995 only led to a minor rise in
  In seven out of 24 countries included in the analysis,                 VHI%. This limited growth has been attributed to the
GGHE% decreased, and in most of these, both VHI% and                     lack of regulation to support the private sector's growth
OOP% increased, which is a less desirable health expend-                 in a secure financial and fiscal environment [36]. High
iture development in moving towards UHC equitably. On                    VHI premiums constitute an important financial barrier
the other hand, in 17 countries, GGHE% increased, with                   for the majority of the Mexican population. Moreover,
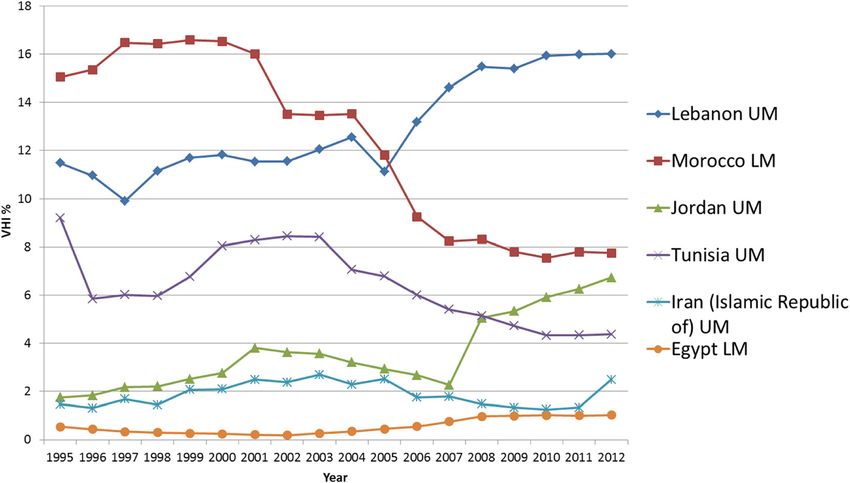
Pettigrew and Mathauer International Journal for Equity in Health (2016) 15:67                                           Page 10 of 19

the national public health insurance programs have been                  the introduction of AUGE (Acceso Universal con Garan-
reported to provide a relatively comprehensive package                   tias Explicitas - Universal Access with Explicit Guarantees)
[37].                                                                    made public health insurance more appealing, which re-
  In the group of countries with VHI% >10 % in 1995,                     sulted in VHI membership substantially falling and
various of these, e.g. Chile, Argentina, Uruguay and                     remaining stable over more recent years [46, 47].
Brazil, have been influenced by market focused reforms                      In summary, many Latin American countries reached
which were encouraged by multilateral lending agencies                   high VHI% levels, largely due to private sector policies in
prior to 1995 [38]. Income growth among the wealthier                    the past as well as due to increasing demands of the popu-
population was also a reason for a rise in the VHI%. In                  lation. As a number of countries were strongly committed
Brazil, for example, 25 % of the population have VHI                     to expanding GGHE and undertaking equity focused re-
coverage, largely in its supplementary role [39, 40]. Like-              form in efforts to move towards UHC since the mid-
wise, in Chile, where opting out of public health insur-                 2000s, VHI% has gone down in many settings, especially
ance was previously allowed, 25 % of the population                      in those countries which had VHI% levels above 10 % in
chose primary (substitutive) VHI coverage by 1997,                       the 1990s.
resulting in a significant rise in VHI%. Of note the VHI
schemes also manage the 7 % public health insurance
contribution, so only the contribution above the 7 % is                  Eastern Mediterranean Region (EMRO)
VHI in nature and includes supplementary coverage,                       The average VHI% is around 3–4 % in the 15 EMRO coun-
even though the current GHED data does not disaggre-                     tries (Fig. 3) that provided VHI expenditure data. There
gate this and reports all as VHI.                                        were six countries with a VHI > 1 % in 2012. As Fig. 8 pre-
  Despite coalitions of health professionals, academics,                 sents, three of these countries (Lebanon, Morocco, Tunisia)
unions and local communities coming together to resist                   had a VHI% above 5 % for the majority of the period in
reforms [38, 41] and with limited regulatory frameworks                  question, and Jordan’s VHI% rose above 5 % in 2008.
in place described as a “legal vacuum” [36], the VHI mar-                Morocco has had a VHI% which is noticeably the highest
ket grew substantially in the 1980s–90s. Health Mainten-                 for all lower-middle income countries included in this
ance Organisations (HMO), often from overseas, emerged,                  study. However Morocco and Tunisia show downward
targeting the rising incomes and desires of the wealthier                trends in VHI%, whereas a strong upward trend is noted
middle-classes [42]. Yet, rising VHI premiums resulted in                for Jordan and Lebanon in the latter 2000s. Iran’s and
reduced enrolment rates as found in Argentina [43] and in                Egypt’s supplementary/complementary VHI markets are
fact contributed to a decline in VHI%. Importantly, in-                  still relatively small at less than 2.5 % of THE.
creased investment in GGHE to provide coverage to poor                      In four out of six countries (Jordan, Morocco, Lebanon,
and vulnerable groups in Uruguay, Brazil and Chile                       Tunisia) GGHE% increases. In the remaining two countries
coupled with firmer regulation [44, 45] have contributed                 (Egypt and Iran), GGHE% decreases with slightly increas-
to a decline in VHI% in recent years. For example in Chile,              ing VHI%. OOP% decreases in Iran however it increases in

 Fig. 8 EMRO Individual country trends of VHI%, 1995–2012
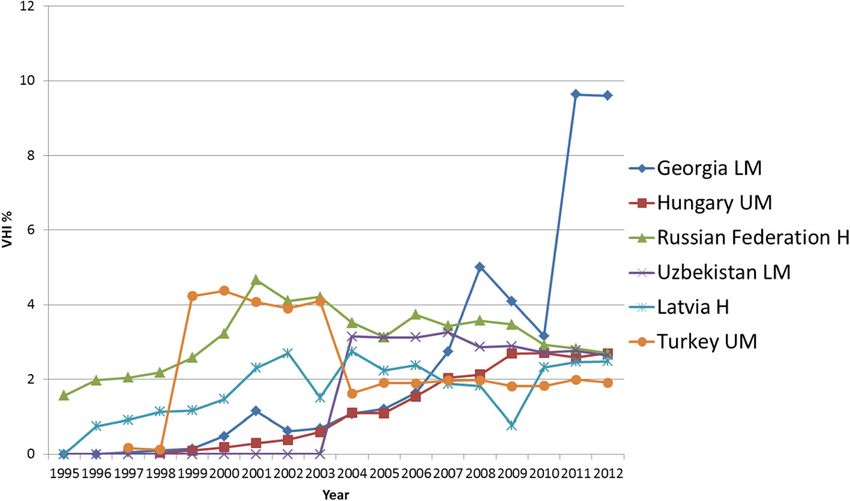
Pettigrew and Mathauer International Journal for Equity in Health (2016) 15:67                                           Page 11 of 19

Egypt, this being a less desirable trend with respect to                 why OOPs in the private sector did not turn into supple-
equitably moving towards UHC (see Additional file 2).                    mentary VHI [56].
   In Jordan limited public health insurance and eco-                      In summary, the different trends found in this region
nomic policies that promoted trade liberalization and                    can be related to diverse reasons, namely: limited growth
privatization have been offered as explanatory factors for               in VHI% related to non-conducive conditions for the VHI
Jordan's steady rise in VHI% [48], where the VHI sector                  market to expand (Egypt), or improvements in public
comprises of private insurance companies, self-insured                   provision and public health insurance (Tunisia, Morocco).
firms, and third party administrators principally for the                Vice versa larger growth in VHI% was also due to gaps in
upper-middle professional classes [49]. In addition co-                  public health insurance (Jordan, Lebanon).
ordination between the Ministry of Industry and Trade,
which is responsible for VHI regulation, and the Minis-
try of Health has been reported to be limited [50]. In                   European Region (EURO)
Lebanon the VHI sector boomed post 1992 due to gaps                      The availability of VHI expenditure data was very limited
in public health insurance after the end of a 17 year                    for the 23 EURO LMIC countries, with only 12 countries
civil that had left the public sector with very limited                  reporting VHI expenditure with less than five years of data
capacity and with a fragmented health system and                         missing. Out of these, six countries had a VHI% > 1 % in any
health financing structure [51, 52]. Despite improve-                    year between 2008 and 2012 (Georgia, Hungary, Russian
ments in the government health sector, private sector                    Federation, Uzbekistan, Latvia and Turkey). Based on the
provision has still remained dominant and patients                       available data, EURO LMIC show the overall lowest average
faced high user charges. This may explain why VHI%                       VHI%, only since 2011 is the average VHI% slightly lower
increased substantially in the mid-2000s, coupled with                   in SEARO LMICs (see Fig. 3). It should be noted that the
a lack of effective control mechanisms, which led to                     Russian Federation and Latvia (and Lithuania which did
rising premiums.                                                         not have a VHI% >1 % between 2008 and 2012, so not in-
   The decrease in VHI% in Morocco can be explained                      cluded in the trend analysis) became HIC in 2012. All
by an increase in GGHE% due to the expansion of com-                     countries included with a VHI% > 1 % (see Fig. 9 for the
pulsory public health insurance from the mid-2000s on-                   detailed country analysis) have seen an overall rise in
wards, although the speed of decline may be slower than                  VHI% since 1995, but other than Hungary and Georgia,
had been expected [53], also given the continued opting-                 the VHI% decreases from the early 2000s onwards. Ex-
out option for employers to provide VHI to their em-                     cept for Georgia, VHI% remained below 5 % in all
ployees [54]. A similar explanation may be valid for                     countries.
Tunisia, where VHI play a supplementary but also pri-                      In Hungary, Russian Federation and Latvia, the GGHE%
mary (substitutive) role [55]. The lower VHI% rate found                 decreases, with both OOP% and VHI% increasing, which
in Egypt can be explained by a lack of regulation condu-                 we argue is not a desirable way of equitably moving to-
cive for the VHI sector to develop. This may explain                     wards UHC. In contrast, in Georgia, Uzbekistan and

 Fig. 9 EURO Individual country trends of VHI%, 1995–2012
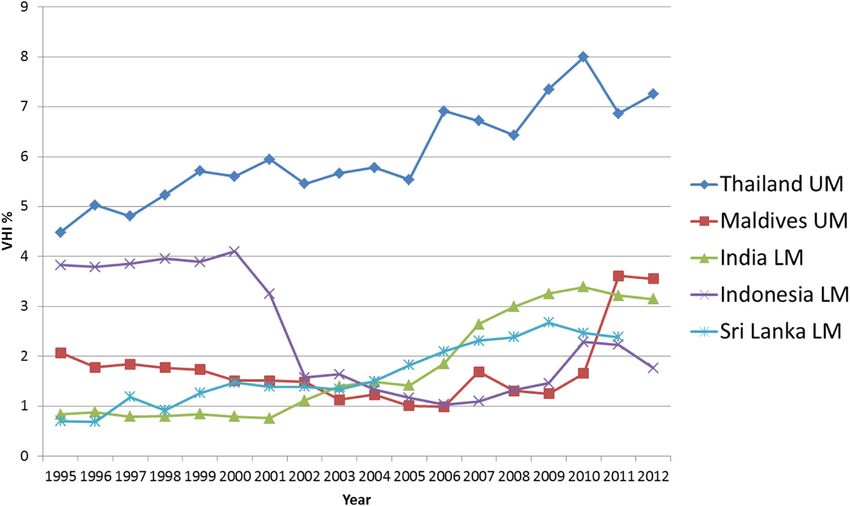
Pettigrew and Mathauer International Journal for Equity in Health (2016) 15:67                                         Page 12 of 19

Turkey, GGHE% and VHI% increases, while OOP% goes                        GGHE. This resulted in a decline of the share of the
down (see Additional file 2). Some OOP expenditure is                    population covered by VHI [60].
likely to have been turned into VHI, and as total private                  In Georgia in 1995, the government introduced public
health expenditure is going down, the trend of these three               health insurance. However after the Rose Revolution in
countries is going in a more desirable direction towards                 2003 the changing political ideology led to the abolish-
UHC. However in terms of equity it may be preferable for                 ment of the public health insurance and VHI has become
a greater part of OOP% to be redirected into GGHE% ra-                   the principal mechanism for pre-payment of health ser-
ther than to VHI%.                                                       vices. Those not belonging to the defined groups of the
   More than half of the EURO countries assessed here                    poor and pensioners benefiting from subsidized health in-
have a hybrid financing system of payroll taxes and gov-                 surance had to revert to VHI as primary (principal) cover-
ernment budget transfers. With the exception of                          age. Accompanied by relatively weak regulation, this is
Georgia, the other remaining countries have a national                   reflected in the rise in VHI% from 2003 onwards [61].
health service in place. The legacy of the Soviet health                   In summary, VHI has largely a supplementary/comple-
system model, with its strong focus on central govern-                   mentary role in most EURO countries studied here,
ment funding and the absence of a private sector, would                  whereby higher income groups in particular demand VHI.
explain why the majority of ex-Soviet countries have
very low VHI% (below 1 % or reported as 0 %). In the                     South-East Asian Region (SEARO)
post-Soviet transition lack of trust in private institutions             VHI in its various roles has played a rather moderate
and affordability issues further contributed to this [11]. In            role so far in SEARO, which is reflected in its very low
the Russian Federation, Latvia and Hungary, which have a                 average VHI% trend lines (see Fig. 3) compared to other
mandatory health insurance system that is also financed                  regions. From 2011 it had the lowest VHI% average of
through budget revenues, VHI plays largely a complemen-                  all the regions.
tary and/or supplementary role [7, 57, 58]. This is also the               Out of 10 SEARO LMIC only five (Thailand, Maldives,
case in Uzbekistan with a state-run health system [6]. Of                India, Indonesia and Sri Lanka) reported a VHI% > 1 %
note the cost of VHI policies is not regulated and these are             in any year between 2008 and 2012 (see Fig. 10). With
relatively high due to small risk pools and limited number               the exception of Indonesia all countries have reported
of sales, which makes them predominately accessible only                 arise in VHI% since 1995. In two countries (Sri Lanka
to higher income groups [59].                                            and Maldives), GGHE% decreases, while both OOP%
   In Turkey, despite its growth, supplementary VHI                      and VHI% increase which is a less desirable scenario. In
plays a minor role so far. It covers solely one percent of               the remaining countries GGHE% increases and OOP%
the population, in particular higher income households                   goes down, while VHI% goes up (in Thailand and India)
that seek supplementary coverage. A major reason for                     or down (in Indonesia) (see Additional file 2).
the decline in VHI% in 2004 is linked to the Health                        Despite the moderate role of VHI% in SEARO, VHI ex-
Transformation Program starting 2003 with increased                      penditure per capita is growing gradually. One significant

 Fig. 10 SEARO Individual country trends of PHI%, 1995–2012
Pettigrew and Mathauer International Journal for Equity in Health (2016) 15:67 Page 13 of 19
explanatory factor in SEARO is economic growth of parts reflected in the relatively low average VHI% trend lines
of the region and the growing middle class with expanding for the region (see Fig. 3).
health care demands. For example, for Thailand, Drechsler There are 21 LMIC countries in WPRO (out of the 37
and Jütting reported that the growing middle classes are countries and areas that make up the region), with only
assumed to be the most likely consumers of supplemen- one country not reporting on VHI expenditure. Nine of
tary VHI [9]. By contrast, in Indonesia limited VHI growth these reported a VHI% > 1 % in any one year between
of approximately 20 ‘bapels’, which are HMO type organi- 2008 and 2012, five of which were pacific islands. Mean-
sations accessed through a voluntary insurance scheme, while ten countries reported that none of their THE was
has been attributed to the belief that they are of poor qual- spent on VHI, the highest number across all the regions.
ity and provide limited choice [62]. Additionally, coverage Of the countries included in the country trend analysis,
for formal sector workers was expanded and the govern- a general upwards trend can be seen in half of the coun-
ment provided funding to subsidize coverage for poor tries (see Figs. 11 and 12). The data has been split into
population groups, called Jamkesmas [63], which led to an two graphs; non-pacific island states (Fig. 11) and pacific
expansion of GGHE. island states (Fig. 12).
While India has one of the largest private provider GGHE% increases in five out of nine countries in
health sectors in the world, VHI% is still relatively small WPRO, but there is no observable pattern with respect
(0.8 % in 1995–3.1 % in 2012), against a notably high to changes in OOP% and VHI%. The remaining four
share of OOP expenditure. The growth of India's VHI countries where GGHE% decreases, both OOP% and
market is due to growing demands of an emergent VHI% increase (see Additional file 2); this is the less de-
wealthier middle class for supplementary/complemen- sirable scenario on the path of moving equitably towards
tary VHI and the expansion of numerous CBHI schemes UHC.
for the poorer populations [64]. During the 2000s, un- As for SEARO, one significant explanatory factor in
clear guidance from India's regulatory bodies for insurers WPRO for changes in VHI seems again to be economic
has been attributed as a factor for restricted growth [65]. growth of parts of the region and sectors of the population
In summary, economic growth and the growing with expanding health care demands. In Malaysia, VHI
middle-class with expanding health care demands can be mostly targets the more affluent parts of the population
seen as a common reason for a rising VHI% trend in [66, 67], which together with increasing wealth in the
particular in some countries in the SEARO region. upper middle classes has led to a gradual rise in VHI%.
Similarly in the Philippines, even though its government
has made efforts to expand the public health insurance
Western Pacific Region (WPRO) package (PhilHealth), VHI% increased from 3.7 to 7.3 %
As for SEARO countries, VHI has also played a rather between 1995 and 2012. This could be explained by an in-
moderate role so far in WPRO countries, which is crease in additional services offered by VHI that are
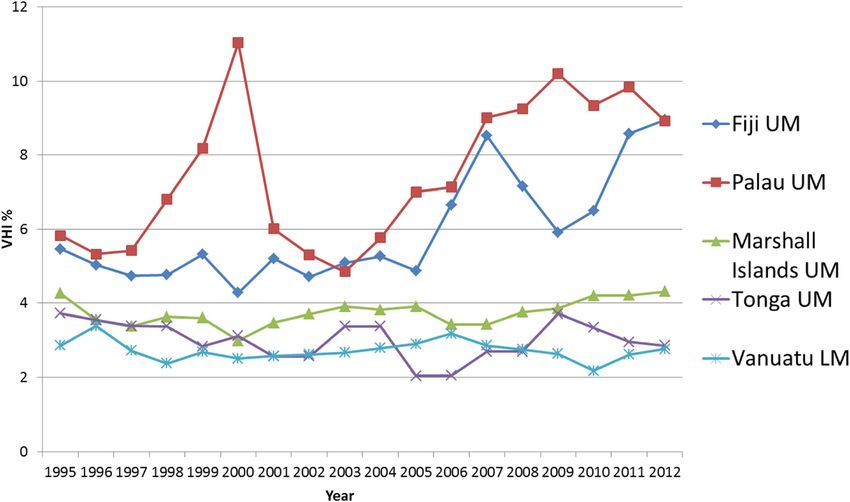
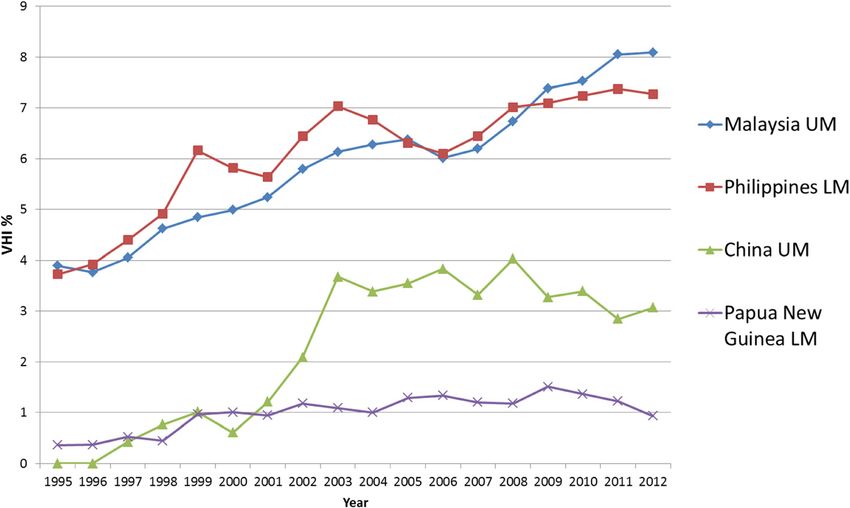
Fig. 11 WPRO Individual country trends of VHI%, 1995–2012, non-pacific island statesPettigrew and Mathauer International Journal for Equity in Health (2016) 15:67 Page 14 of 19 Fig. 12 WPRO Individual country trends of VHI%, 1995–2012, pacific island states particularly attractive for the increasing middle class, as countries with historic and markedly higher VHI% this has the PhilHealth package is limited in benefits [68]. been driven by primary VHI. Existence and changes in du- For Vietnam, no VHI data is reported in the GHED. plicate coverage appear to have been less pertinent, al- However, evidence and previous analysis of VHI trends in though its relevance could only be established on the basis the country [11] reveals that despite substantial UHC ex- of a detailed country by country analysis of the actual VHI tension efforts and government subsidies for the public policy and national SHI laws. health insurance system, duplicative VHI plays an import- It is also interesting to note the shifts between VHI%, ant role [69]. A major problem is that VHI regulation is OOP% and GGHE% between 1995 and 2012 to reveal how not coordinated with the ministry of health’s efforts to ex- countries progress towards UHC: Out of the 74 countries pand coverage via the Vietnam Social Security scheme. In included in the detailed individual country trend analyses China, the VHI sector was opened up to foreign compan- (with VHI% > 1 % in any one year between 2008 and 2012), ies in 1992 [70]. The modest increase in VHI% is largely 29 countries had a rise in VHI% and GGHE%, while the result of the expansion of the upper middle class that OOP% declined, but eight out of these still had OOP% > buys complementary/supplementary VHI coverage on top 40 %. Yet, seventeen countries had a rise in VHI% plus a of the existing public health insurance programs [71]. rise in OOP% and a fall in GGHE%, which is an undesir- Up to now, overall, VHI has played a rather marginal able trend on the path towards UHC. Moreover, eight out role in South East Asia and Western Pacific Regions in of these 17 countries still had OOP% >40 % of THE (see contrast to the economic potential of parts of the regions. Additional file 2). Global VHI% trends in LMIC Discussion While data is missing for around one fifth of all LMIC over From 193 countries worldwide in 2012, 163 had avail- the period between 1995 and 2012, a slight upward trend able data. Out of 138 LMIC, VHI expenditure was insig- of VHI% can be seen on average. VHI% increased in 68 nificant in 49 LMIC, i.e. with VHI% below 1 % or LMIC (including the recent HICs). Yet the rise in regional reported as 0 %. VHI% ranged from 1 % to 5 % in 56 averages of VHI% has been less than one percentage point countries of all income levels, with 39 of these being (and 2 percentage points in EURO) over this whole period, LMIC and 3 having recently become HIC. VHI% was and thus rather modest. Nonetheless, many individual above 5 % in 46 countries worldwide, 23 of these being AMRO and AFRO countries show larger increases. In a LMIC and 3 being new HIC. In 2001, in comparison, few countries the increase in VHI% between 1995 and 2012 VHI% was above 5 % in 39 countries worldwide, with 25 was above 5 percentage points, namely in Botswana, of these being LMIC then [8]. The absolute number of Georgia, Suriname and Senegal. On the other hand, in 30 countries of all incomes with VHI% >5 % has increased LMIC, VHI% decreased. While more recent VHI market between 1995 and 2012, from 36 to 46. The overall aver- developments largely relate to the expansion of supplemen- age global trend of VHI% in LMIC between 1995 and tary/complementary coverage in many countries, in some 2012 is slightly upwards. This increase has been noted
Pettigrew and Mathauer International Journal for Equity in Health (2016) 15:67                                           Page 15 of 19

by studies of NHA data prior to 2002 [10] and has also                   strategies VHI is mentioned as complementing and sup-
taken place over the last 10 years as observed in this                   plementing health financing, but in what form, and what
study. Moreover, we need to keep in mind that underre-                   regulation will be required is often not specified.
porting and general difficulties in obtaining data may                      One challenge is that VHI often does not fall under the
imply that VHI expenditure is actually higher than sug-                  policy and regulation of the ministry of health. When reg-
gested by the data presented here.                                       ulated by the Ministry of Finance or another ministry,
   Analysis of changes in OOP% between 1995 and 2012                     their policy objective is often private sector growth (in-
indicates that increases in VHI% cannot be consistently                  cluding VHI). If not aligned and regulated, this could
linked with OOP% falling or being redirected into volun-                 contradict UHC and financial protection objectives.
tary prepayment. This suggests that generally VHI is not                    The country analyses reveal that regulation has been
effective in covering gaps in publicly financed coverage.                weak overall, and this has had various effects. On the one
There were also several countries where despite a rise in                hand, a general lack of regulation enhanced the expansion
VHI% there has been a rise in OOP% coupled with a fall                   of primary as well as supplementary and complementary
in GGHE%.                                                                VHI in several countries. This has been documented for
   Diverse reasons for the VHI expenditure trends were                   South Africa during apartheid and many parts of Latin
identified in the previous section, from these three over-               America, where VHI was described to have developed in a
arching themes emerge: 1) external influences; 2) gov-                   “legal vacuum” coupled with laissez faire market oriented
ernment policies on the role of VHI and its regulation;                  policies. VHI has also been noted to grow in post-conflict
and 3) willingness and affordability of various population               countries, such as Lebanon, potentially due to limited cap-
segments to pay to enrol in VHI schemes. These themes                    acity of public institutions to regulate private industries.
are interrelated, and can increase or decrease VHI ex-                   On the other hand, the lack of a regulatory framework
penditure depending on the country context.                              such as in Mexico or India may have inhibited the antici-
                                                                         pated development of primary (substitutive) or supple-
External influences                                                      mentary/complementary VHI. The absence of a secure
External influences were one driving factor for increases                legal framework for VHI companies to grow and profit
in VHI expenditure. Several Latin American countries                     can be a significant disincentive to investment.
underwent structural adjustment programmes in the                           This also seems to explain expenditure trends in the
1980s. International trade agreements to attract foreign                 two large emerging economies China and India. These
investment, like in Georgia, and market oriented                         can be considered together as there has been speculation
liberalization efforts have tended to encourage the                      that India's and China's VHI market would expand rap-
growth of the private sector and the reduction of invest-                idly, with their anticipated economic growth [9]. These
ment in the public sector. This attracted interest from                  countries have had the greatest % increases in VHI expend-
overseas VHI companies and resulted in AMRO having                       iture per capita in their respective region, but it is still
the greatest proportion of LMICs with a VHI% >10 %.                      within the average range. However trend analysis of overall
Likewise, in post-apartheid South Africa such policies                   VHI% growth for India since 1995 is still modest, and
led to the further growth of the private sector and                      VHI% actually decreased in China since 2008. This perhaps
overseas investment.                                                     less than anticipated VHI% growth has been attributed to
   Another cause for VHI changes are development part-                   inadequate clarity regarding government and health regula-
ners and international donors that influence health policy               tors’ policies on the role of VHI [65]. It should be empha-
or provide external funding. They contributed significantly              sized however that aggregate figures for large countries
to the promotion of CBHI in terms of numbers of                          with marked social gradients, such as India and China,
schemes, primarily in sub-Saharan Africa. However, the                   may mask substantial increases in VHI expenditure within
absolute VHI expenditure increases due to CBHI have                      certain segments of the population. It should also be noted
been marginal, largely due to relatively low enrolment                   that VHI% are affected by changes in OOP and GGHE,
rates [22].                                                              which also contribute to THE.
                                                                            Although less frequent, explicit government policy to ex-
Government policy on the role of VHI and its regulation                  pand VHI has played a role in some countries. For example,
In most LMIC, VHI has so far played a limited role,                      the promotion of CBHI as a key pillar for UHC expansion
whereas in some countries it has played a more import-                   foremost in West African countries, the introduction of a
ant role. Yet, the role of VHI is often not adequately                   regulatory framework and a federation of CBHIs to support
reflected in health sector policies and is largely absent in             their growth in Senegal, the promotion of principal VHI
health financing policies or health financing strategies,                coverage in Georgia, or legislation to allow people to opt
as was revealed when screening such documents, which                     out of public health insurance in favour of substitutive VHI
are available on the IHP+ platform [18]. In some                         in Chile. In fact, although CBHI expenditure is rather
Pettigrew and Mathauer International Journal for Equity in Health (2016) 15:67 Page 16 of 19
marginal in Africa and Asia, its existence and promotion system reviews revealed that VHI plays an important role
through donors and development partners has made it in in some countries, even when no VHI expenditure is re-
some countries turn into a strong political actor and poten- corded in the GHED or VHI is recorded as zero. This sug-
tially an overvalued health financing mechanism. A crucial gests that there may be considerable under-reporting from
yet unrealistic role of CBHI contributing towards UHC has some countries, which confirms Drechsler and Jütting’s
been ascribed by envisaging to cover the informal sector (2010) assessment [11]. For example, detailed health finan-
population which is often more than 80 % of the popula- cing system reviews of Lesotho revealed that there is an
tion. Assigning such a role to CBHI may have also poten- important VHI market [72, 73] despite 0 % being recorded
tially detracted governments in the past from expanding in GHED, as is the case for Nigeria [74, 75] and Vietnam
publicly financed coverage and from increasing GGHE. [69]. Similarly, in Cameroon, there is no VHI expenditure
In contrast explicit government regulation intended to reported despite a growing number of CBHI schemes in
limit VHI activity and increase investment in GGHE was place covering about 2 % of the population [76]. It is also
seen in post-apartheid South Africa and post-military rule likely that VHI continues to play a role in Zimbabwe al-
Chile, where social movements to diminish inequities though unrecorded.
precipitated a shift in government policies. However Underreporting is also due to the fact that GHED re-
the success of such policies was limited by existing VHI cords VHI expenditure, rather than VHI premiums col-
industry interests operating in a primary VHI market. lected, i.e. revenues. In many countries, there are large
This is an important lesson for countries on the path to profit margins in the VHI market, and thus household
UHC, suggesting that although VHI may be considered spending on VHI may be considerably above the re-
to help increase pre-payment mechanisms and reduce ported VHI expenditure of financing agents [77].
financial risk in the first instance if vested interests be- The literature analysis also had its limitations. It iden-
come significant this may hinder future efforts to ex- tified sometimes patchy and at times contradictory
pand GGHE. causes to explain potential rises and falls in VHI% and
VHI expenditure in individual countries. However, clear
Willingness and affordability to enrol in VHI schemes themes did emerge regarding potentially causal factors
A common issue across all regions is the emergence of a for changes in VHI. These are applicable taking into ac-
middle class with disposable income and the desire to count different country contexts.
access better quality health services. This is often the
case when the services provided by the public system do Conclusion
not meet expectations, and in some countries has been Over the years several countries have paid insufficient
catalysed by the labour unions of private companies ne- attention to the role of VHI. Much of the initial expan-
gotiating VHI for their workers. The growth in purchas- sion of VHI in many countries was a result of limited in-
ing power by a segment of the population is seen in vestment in the public sector as well as limited
emerging economies such as China, India and Thailand, regulation and thereafter its maintenance due to vested
and was or continues to be a cause of growth in VHI in interests, rather than a coordinated effort for it to
its various roles in a diverse range of countries, such as play an ancillary role in achieving UHC. In some
several upper-middle income countries in Latin Amer- countries, VHI may have hindered moving equitably
ica, EURO countries as well as Jordan and Botswana. Of towards UHC. Current health financing strategies
note existing inequality, as expressed by a high Gini- still put insufficient attention on specifying the role
coefficient, was found to be correlated with a higher of VHI on the path to UHC. A systematic review of
VHI% in previous studies [11]. available health sector strategies would be useful to
On the other hand, various countries have experienced provide more evidence on existing gaps. It is of high
the consequences of excessive fragmentation and limited importance that health financing strategies are clear
pooling of VHI, including CBHI schemes, which led to un- about the role they give to VHI in their path to-
affordable rising premiums and/or unsustainable schemes, wards UHC if previous oversights are not to be
such as in Turkey, South Africa, Chile and Mexico. In repeated.
some cases this was precipitated by economic crises. Future research could explore in more depth possible
associations between the rate of change in VHI expend-
Limitations iture and OOP, GGHE, THE or GDP as relative percent-
Important limitations around the quality of VHI data age changes or as per capita expenditure. Likewise more
have been discussed in the methodology section. Unex- work is needed to disaggregate data to understand how
plained sharp rises and falls of VHI expenditure which these changes play out across different segments of the
were seen in a few countries point to possible variations population. Furthermore, attention needs to be placed
in the quality of data reporting. Country health financing on improving data collection of VHI expenditure and itsYou can also read