WP/18/54 The Distribution of Gains from Globalization
←
→
Page content transcription
If your browser does not render page correctly, please read the page content below
WP/18/54

                  The Distribution of Gains from Globalization

                                 by Valentin F. Lang and Marina Mendes Tavares

IMF Working Papers describe research in progress by the author(s) and are published
to elicit comments and to encourage debate. The views expressed in IMF Working Papers
are those of the author(s) and do not necessarily represent the views of the IMF, its
Executive Board, or IMF management.
© 2018 International Monetary Fund                                                                              WP/18/54

                                                 IMF Working Paper

                                     Strategy, Policy, and Review Department

                                The Distribution of Gains from Globalization

                      Prepared by Valentin F. Lang and Marina Mendes Tavares1

                                 Authorized for distribution by Rupa Duttagupta

                                                        March 2018

    IMF Working Papers describe research in progress by the author(s) and are published to
    elicit comments and to encourage debate. The views expressed in IMF Working Papers are
    those of the author(s) and do not necessarily represent the views of the IMF, its Executive Board,
    DFID or IMF management.

                                                          Abstract

We study economic globalization as a multidimensional process and investigate its effect on
incomes. In a panel of 147 countries during 1970-2014, we apply a new instrumental variable,
exploiting globalization’s geographically diffusive character, and find differential gains from
globalization both across and within countries: Income gains are substantial for countries at early
and medium stages of the globalization process, but the marginal returns diminish as globalization
rises, eventually becoming insignificant. Within countries, these gains are concentrated at the top
of national income distributions, resulting in rising inequality. We find that domestic policies can
mitigate the adverse distributional effects of globalization.
JEL Classification Numbers: F62, F63, I24, O15, O47
Keywords: Globalization, Growth, Inequality
Author’s E-mail Addresses: lang@ipz.uzh.ch, MMendesTavares@imf.org

1
  Valentin F. Lang: University of Zurich and Heidelberg University; Marina Mendes Tavares: International Monetary Fund. We
thank Alberto Behar, Mehmet Cangul, Axel Dreher, Rupa Duttagupta, Raphael Espinoza, Stefania Fabrizio, Andreas Fuchs, Davide
Furceri, Lennart Kaplan, Suhaib Kebhaj, Kangni Kpodar, Sarah Langlotz, Li Lin, Prakash Loungani, Ali Mansoor, Chris
Papageorgiou, Hector Perez-Saiz, Niklas Potrafke, Andrea Presbitero, Samuele Rosa, Jan-Egbert Sturm, Konstantin Wacker,
participants of the PEGNet Conference 2017 in Zurich, and at seminars at the IMF, Frankfurt University, and Heidelberg University
for helpful comments. This paper is part of a research project on macroeconomic policy in low-income countries supported by the
U.K. Department for International Development (DFID).

                                                               1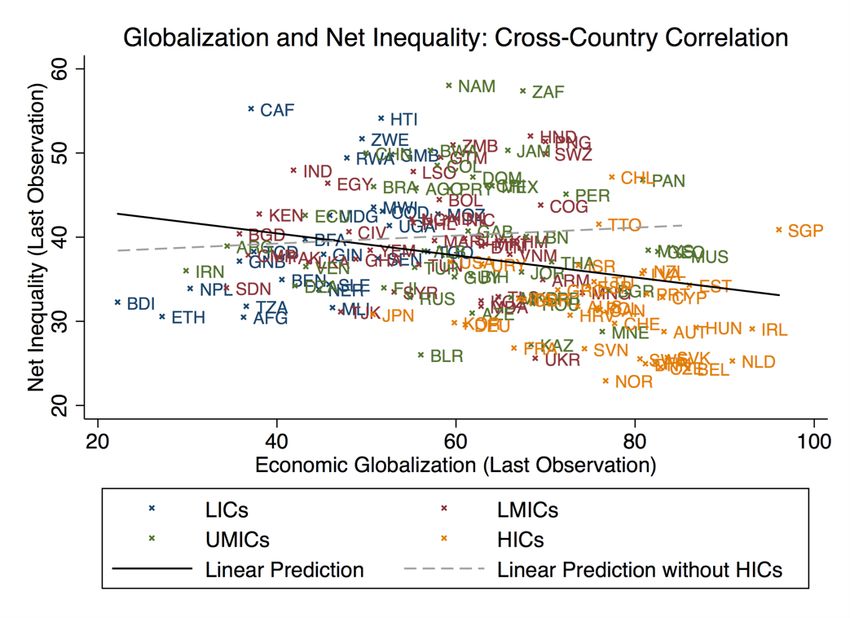
CONTENTS

I. INTRODUCTION ............................................................................................................................ 4
II. STYLIZED FACTS AND DESCRIPTIVE EVIDENCE .................................................................. 9
A. Trends in Globalization ..................................................................................................................10
B. Globalization, Growth, and Inequality ............................................................................................13
III. DATA AND METHOD ................................................................................................................16
A. Measures of Globalization ..............................................................................................................16
B. Dependent Variables.......................................................................................................................17
C. Control Variables ...........................................................................................................................19
D. Identification ..................................................................................................................................20
IV. EMPIRICAL RESULTS ...............................................................................................................22
A. Growth: Main Results.....................................................................................................................22
B. Inequality: Main Results .................................................................................................................24
C. Income Growth by Decile ...............................................................................................................27
D. Results: Channels ...........................................................................................................................29
E. Results: Robustness ........................................................................................................................31
V. THE ROLE OF DOMESTIC POLICIES ........................................................................................34
VI. CONCLUSION.............................................................................................................................38
VII. REFERENCES ............................................................................................................................40
VIII. APPENDICES............................................................................................................................55
A. Appendix 1: List of Countries Included in the Analysis ..................................................................55
B. Appendix 2: Descriptive Statistics and Data Sources .......................................................................56
C. Appendix 3: Robustness Tests ........................................................................................................59

                                                                           2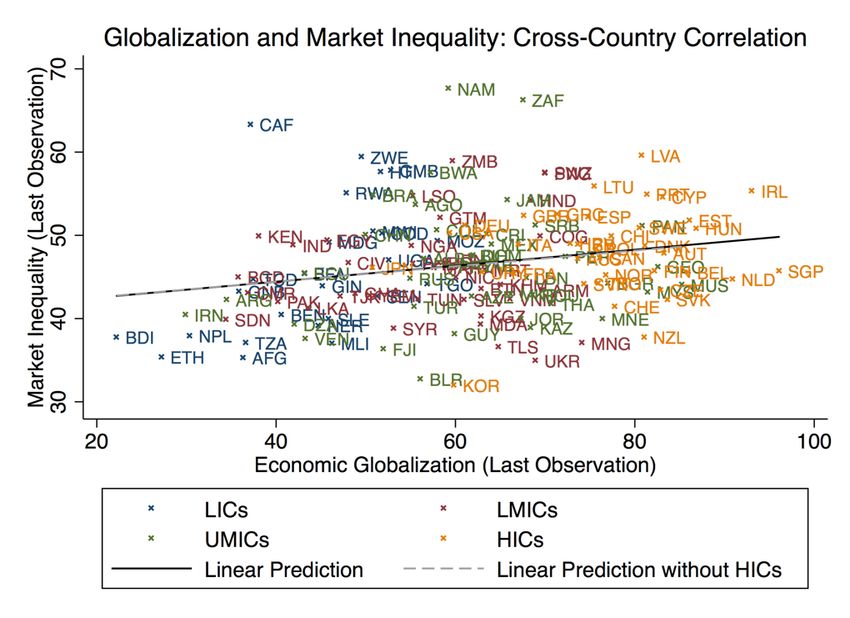
FIGURES

Figure 1: Trends in Economic Globalization.............................................................................. 10
Figure 2: Collinearity of Globalization Indicators ...................................................................... 12
Figure 3: Cross-Country Correlations between Globalization, Growth, and Inequality ............... 14
Figure 4: Correlation of Changes in Globalization and Growth / Inequality over Time .............. 15
Figure 5: Diminishing Marginal Returns to Globalization .......................................................... 23
Figure 6: Globalization and Inequality ....................................................................................... 26
Figure 7: Income Growth by Decile – Coefficient Plot .............................................................. 28
Figure 8: Globalization and Redistribution ................................................................................ 35
Figure 9: Globalization, Inequality, and Education Expenditure................................................. 37
Figure 10: Relative Income Shares (Visualization of Table 10).................................................. 61
Figure 11: Globalization and Growth: Sensitivity of Coefficients (Jackknife Test) .................... 64
Figure 12: Globalization and Inequality: Sensitivity of Coefficients (Jackknife Test)................. 65

                                                            TABLES

Table 1: Collinearity of Globalization Indicators ....................................................................... 11
Table 2: Growth – Main Results ................................................................................................ 49
Table 3: Inequality – Main Results ............................................................................................ 50
Table 4: Income Growth by Decile ............................................................................................ 51
Table 5: Growth – Channels ...................................................................................................... 52
Table 6: Inequality – Channels .................................................................................................. 53
Table 7: Market Gini and Education Spending........................................................................... 54
Table 8: Robustness – GDP Figures from Penn World Tables ................................................... 59
Table 9: Robustness – Gini Indices from PovcalNet and All the Ginis ....................................... 60
Table 10: Robustness – Relative Income Shares ........................................................................ 61
Table 11: Additional Robustness Tests of Growth Regressions .................................................. 62
Table 12: Additional Robustness Tests of Inequality Regressions .............................................. 63

                                                                 3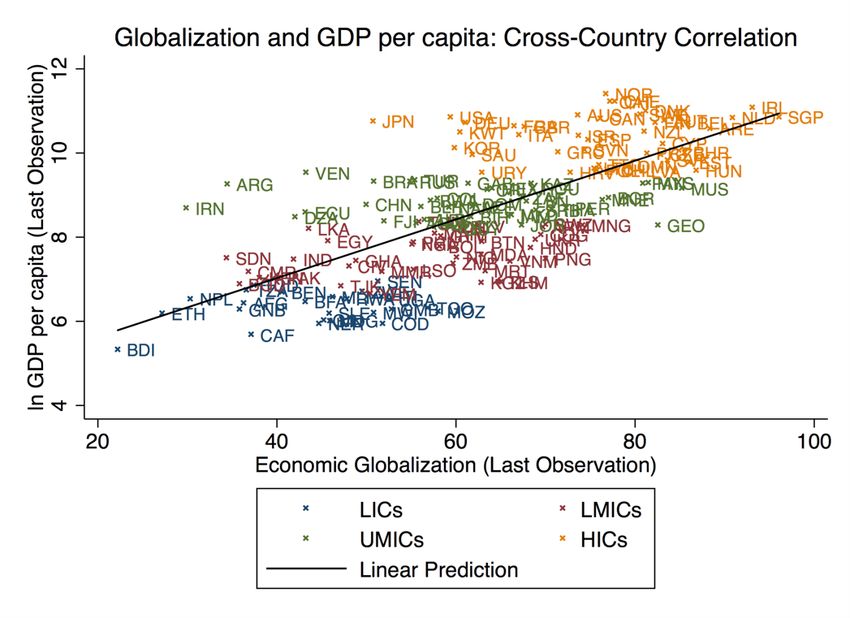
I.        INTRODUCTION

Over the course of the last decades the world economy has witnessed rapid integration. Most
countries have opened up their economies and experienced an unprecedented rise in the flow of
goods and capital across borders. This phenomenon – now widely known as economic
globalization2 – was coincident with rising living standards in a large number of countries. Many
developing countries have experienced episodes of strong economic growth and substantial poverty
reduction as they integrated their economies with the rest of the world. At the same time, however,
incomes within many countries have drifted apart. Income inequality has increased significantly in
many advanced economies, and, even if declining in some, has increased or remained high in many
developing economies.3 Such coincidence of rising economic integration with widening domestic
inequality has to some extent contributed to skepticism about the benefits of globalization (Rodrik
2017). However, while the general trends of economic integration, growth, and income inequality
are now well established, the links between them are much less clear: Are these trends in incomes
only coincident with globalization or are they a direct result of it?

In this paper, we examine the importance of economic globalization for explaining changes in
income levels and income inequality by investigating how the gains from globalization are
distributed both across and within countries. Rather than focusing exclusively on an average growth
effect, we empirically analyze how globalization affects countries at different stages of the
integration process – and different income groups within these countries – differently. Empirically,
we develop a novel instrumental variable (IV) to estimate these effects in a large sample of up to
147 countries4 in the 45-year-period between 1970 and 2014. Our approach contributes to existing
research in a number of ways:

First, we study the impact of economic globalization on growth and inequality jointly. The previous
literature has typically looked at this as two separate questions. While there is no definitive
consensus in either literature, the former set of studies tends to find positive growth effects of
various measures of globalization, while the latter often finds that the same measures have

2
  See section III for a more detailed definition of the concept of “economic globalization.” See also Nye and Donahue (2000) and
in particular, the chapters by Keohane and Nye, Frankel, and Rodrik in this volume. Throughout the paper, we use the terms
economic globalization and economic integration interchangeably.
3
  See, for instance, the recent reports by the World Bank (2016) and the World Inequality Lab (2017) for detailed descriptions of
these trends.
4
  See Appendix 1 for the list of countries included in the analysis.

                                                               4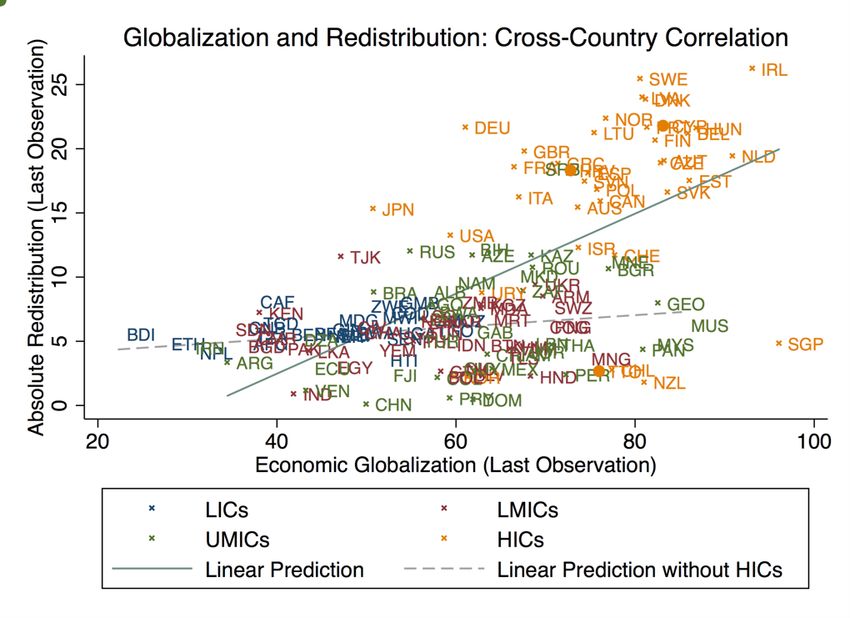
inequality-increasing effects.5 We argue that the effects of globalization on income and its
distribution are best studied together to comprehensively locate the income gains and losses from
globalization. In this study we thus look at a) aggregate growth statistics from different datasets,
b) aggregate measures of income inequality from different datasets, and c) a new dataset on income
data for different deciles of the national income distributions. The results emerging from these
different types of data are consistent with each other and together paint a nuanced picture of
globalization’s effect on incomes.6

Second, for the purpose of the analysis we consider economic globalization as a comprehensive,
multidimensional process and examine how it affects incomes at different stages of this process.
The concept of economic globalization we apply covers the de jure liberalization of various
economic cross-border flows as well as the de facto increases in the volume of these flows.
According to economic theory, these interlinked processes affect incomes via multiple channels.
Rather than trying to disentangle and separate individual mechanisms, in this paper we focus on
empirically estimating the effect of economic globalization on incomes when understood as a
process consisting of multiple interconnected components. While we thus aim to contribute to
answering a broad question that underlies a large body of economic literature, our approach
specifically speaks to some of the more recent contributions which suggest that the effect of
globalization on incomes could be non-linear.

In general, and in line with Ricardian and Heckscher-Ohlin models, globalization is expected to
make countries specialize in economic activities in which they have a comparative advantage. In
addition to the enhanced productivity resulting from such specialization, standard models of
endogenous growth suggest that economic integration improves the flow of knowledge and
technological diffusion across countries and extends the potential market for those who innovate.7
These processes facilitate and intensify incentives for inventing new products and improving

5
  As a comprehensive review of this multi-faceted literature is beyond the scope of this paper and is provided by existing studies,
we refer the reader to the following reviews of the theoretical and empirical literature on the growth and distributional effects of
globalization: Goldberg and Pavcnik (2007), Grossman and Helpman (2015), de Haan and Sturm (2016), Harrison, McLaren, and
McMillan (2010), Helpman (2016), IMF, World Bank, and WTO (2017), Kanbur (2013), Potrafke (2015), Prasad et al. (2007). For
the two pioneering studies applying the measure of globalization we also use, see Dreher (2006) on growth and Dreher and Gaston
(2008) on inequality; see also Dorn, Fuest, and Potrafke (2018) for a related paper.
6
  We would like to emphasize that studies considering the global income distribution as a whole are important complements to
studies that focus on national distributions like ours (Lakner and Milanovic 2016; Milanovic 2016).
7
  For empirical evidence linking international flows of goods and capital to the diffusion of technology across borders see Acharya
and Keller (2009) as well as Bloom et al. (2016).

                                                                 5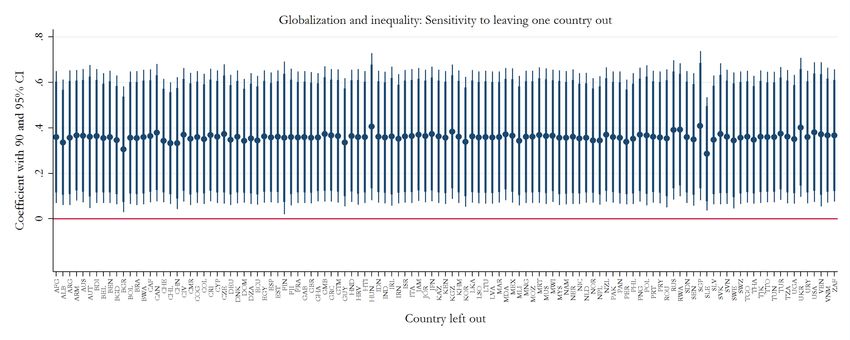
productivity, thereby increasing growth.8 Some recent literature, however, suggests that while
globalization might on average be good for growth, more might not always be better for all.
Focusing on financial globalization, Rodrik and Subramanian (2009) point to the possibility that
surges in inflows of foreign finance can appreciate real exchange rates and thereby reduce the
profitability of traded goods.9 Ghosh et al. (2016) note that a very high degree of openness to capital
flows can increase economic volatility and vulnerability, and might thus on average be associated
with stagnating or declining output. Cordella and Ospino (2017) find that high levels of financial
globalization can increase financial volatility in turbulent times (and reduce it in more tranquil
times). What is more, some trade models also suggest that for very low levels of transport costs
“peripheral” nations gain more from globalization than “core” nations (Krugman and Venables
1995). More generally, many highly integrated countries have mature, globalized value chains that
are less likely to significantly improve further through additional integration efforts than value
chains in initially closed economies.10 Other theories predict efficiency losses resulting from high
levels of inequality (Alesina and Rodrik 1994; Galor and Moav 2004; Galor and Zeira 1993;
Persson and Tabellini 1994), which, as a related literature suggests, globalization potentially
promotes: 11

Stolper and Samuelson (1941) have famously extended the Heckscher-Ohlin model to predict that
economic integration increases the relative return of the relatively abundant factor. Under the
assumption that labor is abundant in poorer countries, this model expects globalization to reduce
inequality in developing countries (see Kanbur 2013 for an overview of related theories). More
recent models, however, focus on heterogeneous firms within sectors and emphasize dynamics that
suggest increases in inequality in both developing and advanced economies (Helpman et al. 2010;
Melitz 2003). Similar conclusions are drawn from theories that shift the focus from trade to capital
flows and suggest that outsourcing and FDI flows from an advanced to a developing economy
increase skill intensity, and thus the wage gap between skilled and unskilled work, in both
economies (Feenstra and Hanson 1995, 1996, 1997). Recent evidence on the distributional effects

8
  See Grossman and Helpman (2015) and the literature cited therein for a useful overview of these models.
9
  Rodrik popularized a broader version of this argument in his (2011) book. He suggests that “hyperglobalization” might have gone
too far and “ended up promulgating instability rather than higher investment and more rapid growth” (p. xvii).
10
   We thank Jan-Egbert Sturm for suggesting this argument.
11
   For instance, recent studies focusing on the United States find that increases in trade and offshoring had adverse effects on local
worker wages and point to “medium-run efficiency losses associated with adjustment to trade shocks” (Autor et al. 2013: p. 2159;
see also Acemoglu et al. 2016; Autor et al. 2014; Ebenstein et al. 2014).

                                                                  6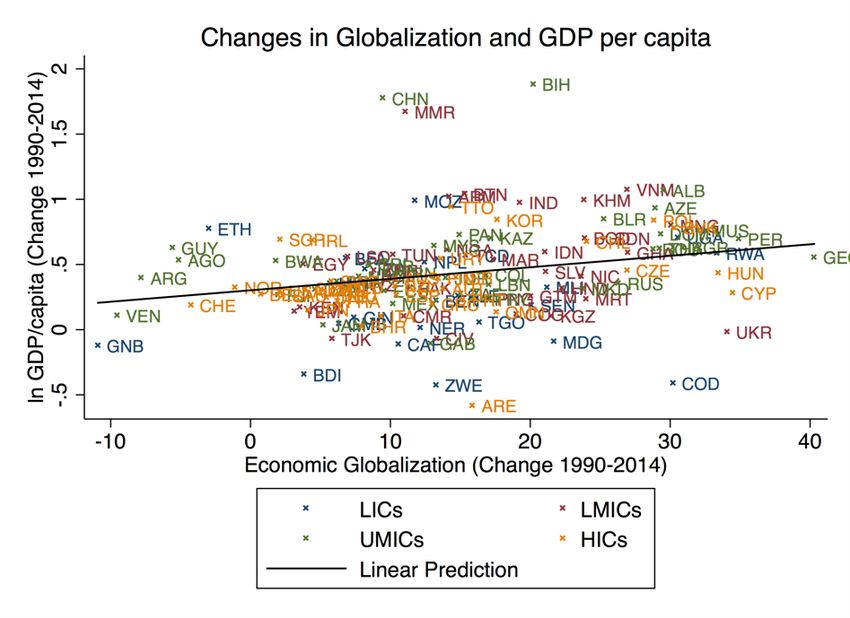
of financial liberalization tends to support this view (Dabla-Norris et al. 2015; de Haan and Sturm
2016; Furceri and Loungani 2018).

In sum, several theories suggest that the impact of globalization on incomes could be nonlinear. In
regards to average income levels, countries that are already relatively globalized might gain less
from globalizing further than countries that open up relatively closed domestic economies. This is
why we contribute to the empirical literature by testing whether there are diminishing marginal
returns to globalization. In regards to national income distributions, some models predict that
globalization should increase inequality in all countries while others expect this effect to be
concentrated in advanced economies; we also test these competing hypotheses. The prime objective
of our empirical analysis is to estimate the total effect of economic integration. This approach also
allows us to circumvent the obvious collinearity and simultaneity problems that bias estimates
when the effects of multiple interrelated dimensions of globalization (e.g., trade, capital flows,
technology diffusion, liberalization policies) that theory models as links between globalization and
incomes are tested simultaneously.12 Understanding economic globalization as a multidimensional
process is also closer to the common usage and definitions of the term than an individual indicator
like trade openness, and helps to account for the possibility that the comprehensive concept may
be more than the sum of its constituent parts. The obvious downside of such an approach, however,
is its limited value for identifying the more fine-grained mechanisms underlying the broad effects
we find. This is why studies focusing on the individual economic transformations that form part of
globalization are important complements to this paper.13

A third contribution of this study is the use of a new instrumental variable (IV) strategy to examine
these effects. Most existing literature on the relationship between multidimensional measures of
globalization and either growth or inequality is limited to providing conditional correlations.14
These, however, neither say much about the direction of the effect nor can they exclude the
possibility that the statistical association is due to omitted factors that are correlated with both

12
   See section II for details on this point.
13
   Studies analyzing the growth effects of individual components of economic globalization focus, e.g., on trade (Alcalá and Ciccone
2004; Dollar and Kraay 2004; Felbermayr and Gröschl 2013; Frankel and Romer 1999), capital flows (Alfaro et al. 2006;
Borensztein et al. 1998), financial openness (Quinn and Toyoda 2008; Ranciere et al. 2006; Rodrik and Subramanian 2009), or
changes in tariffs (Topalova and Khandelwal 2011). Studies that look at the effects of individual components of globalization on
inequality and, more recently also poverty, focus on the role played by, e.g., trade and FDI (Behar 2016; Jaumotte et al. 2013;
Meschi and Vivarelli 2009), exporting (Klein et al. 2013), capital account liberalization (Furceri and Loungani 2018), tariff reforms
(Topalova 2010), or on a pro-poor bias of trade resulting from the fact that poorer consumers spend more on sectors that are traded
more (Fajgelbaum and Khandelwal 2016). For comprehensive surveys of this literature see the reviews referenced in footnote 5.
14
   In his literature review, Potrafke (2015, p. 510) notes that “one main shortcoming of empirical studies using the KOF indices [is]
endogeneity.”

                                                                 7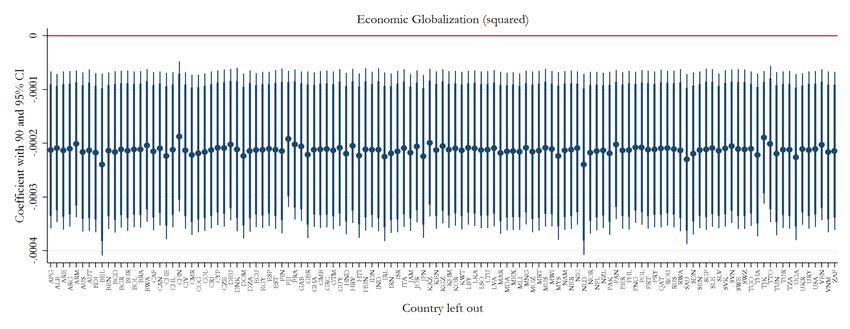
globalization and changes in incomes. It is not far-fetched to presume that countries globalize
because they grow economically (and not the other way around) or that governments that pursue
policies of trade liberalization also tend to implement other policies with more direct distributional
effects. In both scenarios, we would find correlations even in the absence of a causal effect of
globalization on incomes. It is, however, equally possible that countries reform and liberalize more
when their economy is weak; the evidence on IMF-supported programs, which typically promote
liberalization in times of economic crisis, for instance, suggests this (Biglaiser and DeRouen 2010;
Chwieroth 2010; Woods 2006). In such cases, simple regressions could underestimate the true
growth effects of globalization as crises would be correlated with liberalization because of their
effect on the likelihood of reforms. We circumvent these potential endogeneity problems with the
help of IV panel regressions that exploit the geographically diffusive character of globalization.
The instrument we propose is inspired by Acemoglu et al. (2017) and is a country-period specific,
inverse-distance weighted average of the lagged globalization scores of all other countries.
Consistent with the idea that globalization is transmitted across borders from one period to another
particularly between countries that are geographically close to each other, we show that this
measure is a strong predictor of a country’s level of economic globalization. Similar to Acemoglu
et al. (2017), who use a related and analogous measure to identify the effect of democracy on
income, we assume that the extent of globalization in geographically close countries only affects
income levels and distributions in a given country via the extent of globalization in that country.

Our results show that economic globalization increases many but not all incomes. First, there are
indeed diminishing marginal returns to globalization. Countries with lower levels of globalization
benefit more from globalizing than countries that are already highly globalized. While increasing
a country’s level of economic integration leads to significantly higher incomes in subsequent years
at low and medium levels of globalization, for the most globalized countries we do not find
statistically significant effects of further globalizing. Assuming no changes in domestic policies,
most low- and middle-income countries, which typically have relatively low levels of globalization
would thus be expected to substantially benefit from further globalizing. Most high-income
countries, which are typically more globalized, however, cannot anticipate significant additional
gains in average income, under the assumption that domestic policies remain unchanged.

When we shift the analysis to how income gains from globalization are distributed within countries,
we also find globalization to have different effects on different incomes: economic globalization

                                                  8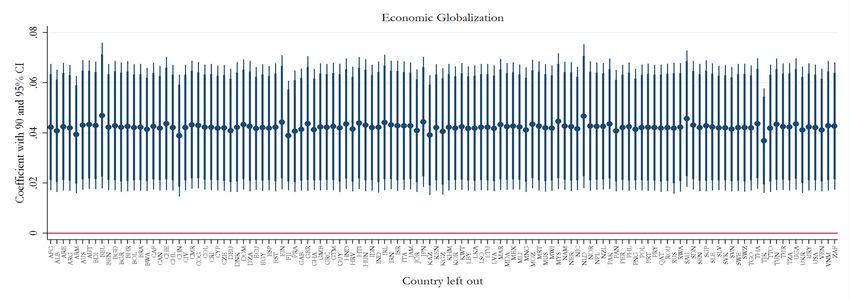
increases income inequality by lifting absolute incomes for the (very) rich without significantly
affecting the incomes of the poor in many countries. In the subsample of developing countries
where the gains from globalization are generally larger, however, they also reach the bottom of the
income distribution and reduce poverty.

As a caveat, these results are based on the assumption that all else remains equal. They therefore
do not take into account the role of policies that could be designed to affect how the gains of
globalization are realized and distributed across and within countries. As such, policymakers
should not interpret the identified effects as a necessary consequence of globalization, but rather
as an indication that domestic policy would need to be adjusted if the benefits of globalization are
to be more inclusive. To explore this further, the final section of the paper analyzes the role of
redistributive policies and investments in education that provide suggestive evidence that domestic
policies have a role in realizing more inclusive gains from globalization.

In the remainder of this paper we initially showcase stylized facts on globalization and income
dynamics (section II). The subsequent section III presents our data and the econometric methods
we apply. We report our empirical results in section IV, discuss policy implications in section V,
and conclude in section VI.

                                II. STYLIZED FACTS AND DESCRIPTIVE EVIDENCE

We begin the empirical analysis by presenting stylized facts on the general trends of globalization,
income levels, and income inequality over the course of the last decades. We group the countries
in our sample by their income level following the World Bank’s classification of low income
countries (LICs), lower middle income countries (LMICs), upper middle income countries
(UMICs) and high income countries (HICs).15 We first analyze trends in economic globalization
using the KOF index and its constituent sub-indices, and illustrate the collinearity problem.
Subsequently, we link these trends to dynamics in income levels and income inequality by
presenting cross-country and within-country correlations.

15
     We classify countries according to their status in 2015 (World Bank 2017a).

                                                                  9
A. Trends in Globalization
To quantify economic globalization, we use the economic dimension of the Index of Globalization
provided by the KOF Swiss Economic Institute (Dreher 2006; Dreher et al. 2008; KOF 2016).16
This widely used index combines eight prominent measures of economic globalization to measure
the concept in a multidimensional way.17 The measure can be split into two sub-indices indicating
the (de facto) extent of economic flows and the (de jure) extent of legal restrictions to these flows.
Figure 1: Trends in Economic Globalization
Note: unweighted means of the respective measure of globalization across the four income classifications over time
16
More than 100 studies use the KOF index. A list of them is available at http://globalization.kof.ethz.ch/papers/. Potrafke (2015)
provides a recent survey of the literature using this index.
17
For more details on the index see section III.
10Figure 1 depicts trends in the unweighted cross-country average of economic globalization and its
two sub-indices for the four income groups.18 Several stylized facts emerge. First, today’s richer
countries have been more globalized than today’s poorer countries across all dimensions at all
times over the past half century. While inferences concerning causal linkages can obviously not be
drawn from this, we can at least record a distinct association between income levels and economic
integration. Second, countries of all income classifications have, on average, experienced processes
of strong economic globalization. Countries that are HICs today have started the integration process
earlier than MICs and LICs. For HICs we see strong increases in both sub-dimensions already in
the 1970s; for the average MIC the significant lifting of economic restrictions to cross-border flows
began in the early 1990s and the flows themselves increased shortly after; the average LIC followed
suit in the mid-1990s. Third, when focusing on the most recent years it becomes visible that HICs
reached the highest level of globalization in the late 2000s and are currently experiencing
stagnation or even a decline; this trend appears to be particularly driven by decreasing de jure
openness. To a slightly lesser extent the same is also true for UMICs and LMICs. This observation
is consistent with IMF (2016), which has shown that trade liberalization has decelerated in many
countries in the last decade. LICs on the other hand still appear to be in a process of strongly
globalizing. A fourth observation based on Figure 1 is that the de jure and de facto dimensions of
economic integration are correlated. The dynamics of the two sub-indices within income groups
appear to be similar. We look at this in more detail in Table 1 and Figure 2.
Table 1: Collinearity of Globalization Indicators
Pairwise correlations (r) Trade FDI Capital account
Tariff reduction
(N = 697) (% GDP) (% GDP) restrictions
Trade (% GDP) 1.00 0.59 0.35 0.30
FDI (% GDP) 0.59 1.00 0.37 0.38
Tariff reduction 0.35 0.37 1.00 0.57
Capital account restrictions 0.30 0.38 0.57 1.00
18
In the KOF index “economic restrictions” measures the absence of the de jure restrictions import barriers, tariffs, taxes on trade,
and capital account restrictions; we name this dimension “economic liberalization” to clarify that higher values always indicate
more globalization. “Economic flows” measure the de facto cross-border flows trade, foreign direct investment, portfolio
investment and income payments to nonresidents.
11Figure 2: Collinearity of Globalization Indicators
Note: added-variable-plots of OLS regressions of the variable plotted on the y-axis on the variable plotted on
the x-axis when country fixed effects are controlled for
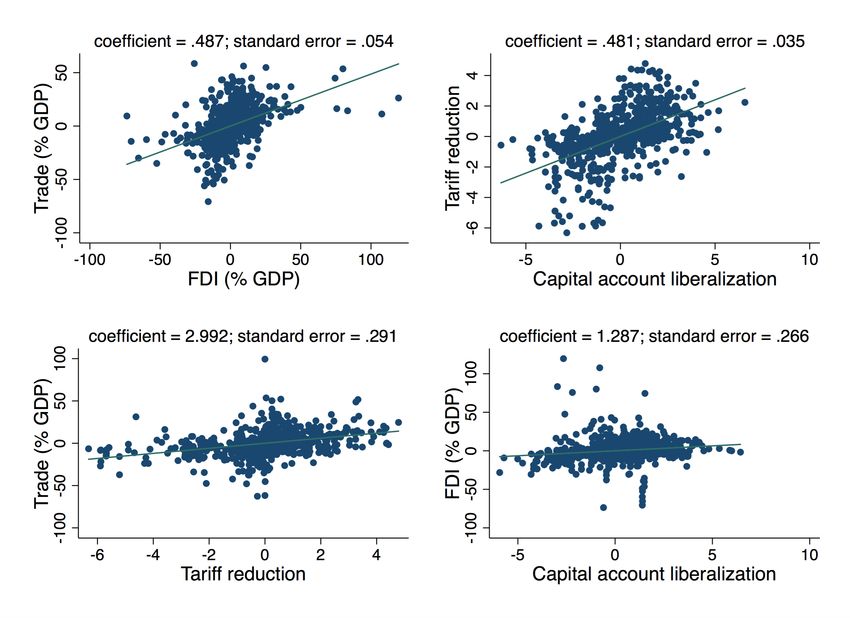
Table 1 and Figure 2 show pairwise correlations between the four most important indicators of
economic globalization that are also used for the construction of the KOF index.19 The unit of
observation is a country-period (5-year-averages). Both the figures and the tables confirm that these
individual components are strongly correlated. All correlation coefficients are positive and between
0.30 and 0.59; the pairwise correlations between the two de facto flow variables (trade and FDI)
and between the two de jure restriction variables (tariffs and capital account restrictions) are
strongest, as could be expected (0.59 and 0.57, respectively). Figure 2 shows that these strong
positive associations hold when unobserved country-specific, time-invariant heterogeneity is
netted out by means of country fixed effects. In addition to the association between the two flows
and the two restrictions variables, the figures also show the conditional correlations between the
two variables related to trade (trade and tariff reduction) and between the two variables related to
19
To illustrate the collinearity problem in Table 1 and Figure 2 we consider the two de jure and the two de facto measures for which
data coverage is largest.
12capital (FDI and capital account liberalization). In sum, these observations suggest that the
individual sub-components of economic globalization are highly correlated. This is a key reason
why our measure of economic globalization is built on an overall index aggregated from the
individual de jure and de facto measures, without any presumption as to which of the underlying
components may be the dominant driver of openness (see Section III).
B. Globalization, Growth, and Inequality
Having established these general stylized facts about globalization trends, we now descriptively
link these trends to dynamics in income levels and income inequality. Figure 3 depicts simple cross-
country correlations between globalization and both GDP per capita levels and net inequality with
the most recent data available for each country.20 This figure reveals that economic globalization
is positively correlated with income level and negatively correlated with income inequality.
The top panel of Figure 3 shows that most low income countries have a globalization score of
around 50 and not one surpasses 60. The scores of middle income countries demonstrate a fairly
large amount of variation, with countries like Iran and Argentina at the lower end of the distribution
and Georgia and Mauritius at the upper end. Most high income countries have scores higher than
60, with Japan being a noticeable exception. In sum, the figure suggests that there is a fairly strong
positive correlation between current income levels and economic integration.
The bottom panel of Figure 3 shows that in countries with currently high levels of economic
integration net income is distributed more evenly across society. It also becomes evident, however,
that this negative cross-country association is driven by the high income countries in the sample.
As the dotted regression line indicates, the negative association turns positive once HICs are
excluded. This, on the one hand, points to a difference in the globalization-inequality-nexus
between advanced and developing economies, which to a significant extent could be due to the
differences in domestic policies with distributional implications (see Section V). On the other hand,
it also suggests that simple cross-country correlations miss important parts of the overall picture
because they are strongly driven by time-invariant peculiarities of certain countries. To net these
out, the within-country dynamics over time need to be considered.
20
See section III for details on the data used for this.
13Figure 3: Cross-Country Correlations between Globalization, Growth, and Inequality
To address these issues, we use Figure 4 to assess the relationship between changes in globalization
and income (inequality) within countries over time. The top panel plots the within-country change
in globalization between 1990 and 2014 (on the x axis) against the change in the natural logarithm
of GDP per capita between 1990 and 2014 (on the y axis). 21 The figure suggests that countries that
21
Note that we use values from 1990 (instead of 1970 or 1980) for this figure because this allows us to include more countries,
especially from the developing world, as inequality data prior to 1990 is frequently missing. Nevertheless the figures with 1970 or
1980 as starting years, which are available upon request, look generally similar.
14globalized more over the course of these 25 years also grew more strongly. The bottom panel
compares the change in globalization to the change in net inequality over the same period. The
countries that globalized more saw, on average, stronger increases in net inequality. This is true for
the full sample as well as for developing countries only.
Figure 4: Correlation of Changes in Globalization and Growth / Inequality over Time
In sum, these stylized facts suggest that while globalization is positively associated with growth,
its association with income inequality is more mixed. While the dynamics over time within
countries suggest that processes of increasing economic globalization and increasing inequality
15tend to coincide, the cross-country evidence shows that the highly integrated countries do not
exhibit the most unequal income distributions. This indicates that highly globalized (mostly high-
income) countries are more likely to have policies that keep net inequality at lower levels and thus
points to a role for domestic policies in distributing the benefits of economic globalization more
broadly.22 The findings also illustrate some of the methodological problems associated with
studying globalization’s effects. Collinearity, unobserved country-specific heterogeneity, and
endogeneity need to be taken into account. We thus caution against giving too much weight to this
essentially descriptive evidence and turn to a more rigorous econometric analysis in the subsequent
section.
III. DATA AND METHOD
A. Measures of Globalization
A key challenge for any study investigating the effects of globalization is the question of how to
define and measure it. Globalization is broadly understood as a process “that erodes national
boundaries, integrating national economies, cultures, technology, producing complex relations of
mutual interdependence” between actors across the globe (Norris 2000, p. 155). Scholars generally
underline that globalization is a multidimensional concept that covers economic, social, and
political processes (Keohane and Nye 2000). While this study focuses on the economic dimension,
even the narrower concept of “economic globalization” is not unidimensional: On the one hand, it
includes the increasing liberalization of restrictions to economic flows across borders. This is often
referred to as the de jure dimension of economic globalization and includes the reduction of tariffs
and other barriers to trade, as well as the liberalization of the capital account. On the other hand,
the actual amount of a country’s cross-border economic flows clearly also indicates its level of
globalization. Standard de facto measures of economic globalization thus include the role that trade
and foreign investment play for a given domestic economy.
As in this study we are interested in the overall effects of economic globalization, this
multidimensionality is a challenge: a single indicator (e.g., trade over GDP) is unlikely to be
representative of what we usually think of as economic globalization. Adding multiple indicators
to our statistical analyses, however, creates collinearity problems. As we have shown above, the
individual indicators of globalization are highly correlated with each other. In joint regression
22
In section V, we show that redistribution plays an important role in explaining this finding.
16analyses their variations would thus overlap and to a substantial extent cancel each other out.
Additionally, the overall effect of economic globalization may be different from the sum of the
effects of its constituent parts. This is why we follow the empirical literature on globalization that
uses composite indices to measure this multidimensional concept. The most widely used among
them is the KOF Index of Globalization (Dreher 2006; Dreher et al. 2008). By means of a principal
component analysis that yields weights for each indicator the index combines eight prominent de
facto and de jure measures of economic globalization (de facto: trade, FDI, portfolio investment,
income payments to nonresidents; de jure: import barriers, tariffs, taxes on trade, capital account
restrictions).23 The index ranges from 0 (no globalization) to 100 (maximum globalization) but is
slow to change within countries: its median (mean) change from one period to the next is 2.1 (2.9)
points. As discussed in the introduction, we suspect that the effect of globalization on income might
be different for different stages of the globalization process. To allow for such nonlinearity, we
also include the squared term of globalization in the regressions.24 And while our study focuses on
the composite index, we also run empirical analyses with individual components to shed light on
the underlying mechanisms.
B. Dependent Variables
Our goal is to study how income gains and losses from globalization are distributed. To do so, we
consider multiple outcome variables. First, we look at the average per capita growth of a country’s
gross domestic product (GDP) to examine how average income levels within countries are affected.
These GDP figures are taken from the most recent version of the World Development Indicators
(World Bank 2017a), and we also run robustness tests with data from the Penn World Tables
(Feenstra et al. 2015). Second, we go beyond country means and look at the Gini index of income
inequality to see how globalization affects the distribution of income within countries. In the
baseline we use data on inequality of net incomes from the Standardized World Income Inequality
Database (SWIID) (Solt 2016), but also run robustness tests with the latest data from PovcalNet
(World Bank 2017b) and All the Ginis (ATG) (Milanovic 2014). As a third step, we look at income
23
Note that this concept of “economic globalization” is similar though somewhat distinct from the concept of “financial
globalization.” For a recent discussion on the measurement of the latter, see Cordella and Ospino (2017).
24
If there are indeed positive but diminishing marginal returns to globalization, not allowing for such nonlinearity by means of
including the squared term will lead to a downward bias. The size of this bias will increase over time as average globalization
scores have increased. See Arcand et al. (2015) for details and an application of this approach in a related setting.
17growth by income deciles within countries to see how different parts of the income distribution are
affected. These data are taken from the new Global Income and Consumption Project (Lahoti et al.
2016).
The use of these data comes with the usual caveats. GDP and growth figures for many developing
– especially sub-Saharan African – economies have repeatedly been criticized for being inaccurate
(Jerven 2013). Data on income inequality are often considered even more problematic because they
require fine-grained microdata, which especially for many developing countries in earlier periods
were not gathered frequently and reliably enough, thus limiting coverage. For many countries the
data underlying the inequality measures are, furthermore, based on different measurement methods
(e.g., household level vs. individual level, income vs. consumption, net income vs. market income),
thus limiting comparability. The existing datasets deal with these issues in different ways:
PovcalNet and ATG disregard the country-year observations for which no or no good data are
available. If multiple Gini indices exist for a given country-year observation they pick the one with
the highest quality (“choice by precedence”) (Milanovic 2014; World Bank 2016). SWIID and
GCIP, on the other hand, apply interpolation and imputation methods that use the available
information from multiple sources to calculate estimates for some missing country-year
observations to increase coverage and adjust others to increase comparability (Lahoti et al. 2016;
Solt 2016). For our baseline regressions we use SWIID and GCIP data, but show that our results
are robust to using data from PovcalNet and ATG.25 We thus make sure that this study is based on
the most reliable, most standard, and most up-to-date data sources that currently exist for a large
panel of countries. Nevertheless, we explicitly ask readers to be aware of these shortcomings,
which this study shares with all similar analyses of the determinants of income growth and income
inequality based on times-series cross-country data.
25
We report the results of these robustness regressions in section IV.E. and Appendix 3. We use both kinds of data because we
acknowledge that there are trade-offs between coverage, comparability, and precision of inequality data. For the purpose of our
study, the bias resulting from not being able to consider a large number of country-period observations is arguably more severe than
larger measurement error in the dependent variable: While inequality data is unlikely to be missing at random (potential correlates
include, for instance, the quality of institutions), we have no reason to expect a systematic measurement bias in either direction that
results from interpolation and imputation and is correlated with our explanatory variables of interest. This is why in the baseline we
aim to maximize coverage. To be sure, measurement error is likely to be larger when interpolated and imputed values are used but
this only increases standard errors and reduces the likelihood of detecting statistically significant effects even if they exist. Our
focus on 5-year-averages further mitigates this concern. In contrast to studies that aim to report exact figures for country-year
specific levels of inequality our focus is on establishing broad long-term links between trends in globalization and inequality for
which some idiosyncratic imprecision for individual observations is less of a problem. Note that the correlation between the Ginis
taken from the SWIID and the Ginis taken from PovcalNet and ATG is p = .89 in our sample. For recent contributions to the
discussion on cross-national inequality data see Ferreira, Lustig, and Teles (2015), Jenkins (2015), Solt (2015), and World Bank
(2016). For a recently published study that is closely related to ours and based on the SWIID, see Furceri and Loungani (2018).
18C. Control Variables
In the choice of our control variables we aim to be as close to the existing, related literature as
possible.26 As is common in most growth regressions we include the natural logarithm of GDP per
capita (in constant US dollars) of the previous 5-year-period to control for convergence as predicted
by the Solow model. In the inequality regressions we additionally include a squared term of logged
GDP per capita to control for a potential non-linear association between income levels and income
inequality as predicted by Kuznets (1955).27 Additional standard control variables of growth
regressions that we add include the rate of population growth, average life expectancy as a proxy
for the country’s health level, and average years of schooling as a proxy for its education level. We
also add the Polity index to control for the quality and openness of political institutions. For all of
these variables we use the average of the previous 5-year period.28
When applying our IV we also run regressions without these control variables. They are then not
necessary for identification because we assume that our exclusion restriction will hold without
conditioning on these covariates.29 The covariates, however, are potentially “bad controls,” as they
could themselves be outcomes of changes in globalization (Angrist and Pischke 2008). If
globalization, for instance, increases health or education levels, which in turn are plausible
determinants of income levels, then controlling for these variables would prevent the regression
from attributing this effect to the estimated effect of globalization. This is why our baseline
regressions include either no or only a parsimonious set of lagged controls. Nevertheless, in
robustness tests, we show that our results are not affected upon adding a more extensive set of
controls including investment, debt, and government expenditure (all as a share of GDP), which in
our setting are more likely to be bad controls but are often controlled for in the related literature.
In addition to these variables, we exploit the panel structure of our data and control for period fixed
effects and country fixed effects. The former control for all global time trends such as economic
and technological shocks.30 The latter absorb all country-specific time-invariant characteristics
such as a country’s geography, colonial history, legal origin, natural resource endowment, etc.
26
See, for instance, Acemoglu et al. (2017), Barro (2003), Dreher (2006), and Ostry et al. (2014).
27
See also Milanovic (2016).
28
See Appendix 2 for sources and descriptive statistics of all variables used in this study.
29
See the next section (III.D.) for details of the identification strategy.
30
We decide against controlling for a country-period specific control variable for technology because, as mentioned above, we
consider technological diffusion, at least on the macro level, to be inextricably linked to economic flows. Arguably, the existing
technology is the same for all countries in a given year and thus in principle available; what differs, however, is countries’ access
19D. Identification
Based on these data we estimate the following dynamic panel regression:
!"# = & '"#() + +′-.(/ 0 + 1" + 2# + 3"# (1)
where y represents one of the dependent variables of interest (i.e., income growth, income
inequality, income growth by decile). g denotes one of our measures of globalization, X’ the vector
of control variables described above. 1" and 2# are full sets of country fixed effects and period
fixed effects, respectively. ε is the error term. All variables enter as averages of 5-year-periods
(indicated by t) in a given country (indicated by i).
Initially we run standard OLS fixed effects regressions to identify the conditional correlations
between globalization and our outcome variables. While we find such conditional correlations
interesting in themselves, in this setting we cannot exclude the possibility that these correlations
are driven by omitted variables or reverse causality. In additional regressions, we thus address this
potential endogeneity of globalization by means of IV regressions in which g is substituted by ĝ,
denoting the fitted values of a first stage regression of g on an excluded IV as well as X’, 1" , and
2# .31
Our IV exploits the geographically diffusive character of globalization. Due to geographical
transmission effects it is likely that a country’s degree of globalization is affected by the
globalization score that countries in its geographical vicinity had in the previous period. At the
same time, it is unlikely that the lagged globalization scores of these countries affect the levels and
the distribution of income in the given country through channels other than the country’s
globalization score itself, when country fixed effects and period fixed effects are netted out. This
to this technology. This access, we argue, is a direct function of a countries’ economic openness and controlling for it would take
out the arguably important effects of globalization operating via enhancing such access to globally available technology. This is
consistent with Grossman and Helpman (1991, 2015), who consider and model the diffusion of technology as an important channel
for the effect of trade on incomes, and with Rodrik (2017, p. 10), who argues that for effects on wages “a sharp distinction between
trade and technology has become harder to make.” See also Ebenstein et al. (2014). For studies aiming to disentangle these effects
see Dabla-Norris et al. (2015) and Jaumotte et al. (2013).
31
An alternative empirical strategy of addressing endogeneity we explicitly decide against is employing the difference or system
generalized methods of moments (GMM) estimators proposed by Arellano and Bond (1991) and Blundell and Bond (1998)
particularly for the use in dynamic “large-N small-T panels”. These GMM estimators instrument potentially endogenous
explanatory variables using lagged values and first differences of the same variables. Having been used frequently in related research
(particularly in growth empirics), the most recent literature has become highly skeptical as to whether the underlying assumptions
are fulfilled in most settings: Bazzi and Clemens (2013) show that weak instrument bias is widespread and often masked when
employing the system GMM estimator. More recently, Kraay (2015) demonstrates the fragility of estimated effects in recent studies
when accounting for this bias. In addition, many scholars have raised doubts as to whether the internal instruments used in GMM
estimations actually fulfill the exclusion restriction in most growth regressions (Acemoglu 2010; Deaton 2009; Dreher and Langlotz
2017).
20argument is inspired by the identification strategy in Acemoglu et al. (2017) who, in similar growth
regressions, instrument for democracy with democratizations in geographically close countries.
They argue that democratization in nearby countries should affect income levels only through
democratization in the given country. In analogy, we argue that globalization in nearby countries
should affect a country’s average income and its distribution only through globalization in that
country.
As is true for all IV-based identification strategies it is impossible to rule out all alternative channels
that would violate the exclusion restriction with absolute certainty. In our setting, such violations
would occur if economic shocks in country i’s neighboring countries affected their own
globalization score as well as incomes in country i, independent of country i’s level of
globalization. While the existence of shocks affecting the two former measures is plausible, it is
unlikely that they operate independently of country i’s level of globalization. In other words, these
shocks would be likely to also affect globalization in this country, and the estimation would
correctly attribute this effect to the coefficient of interest. In addition to concerns regarding
exclusion restrictions, weaknesses of IV-based strategies include their limitation of only
identifying a Local Average Treatment Effect (LATE) (Imbens and Angrist 1994) and their
sensitivity to outliers (Young 2017). We further address these limitations when discussing results
and their robustness but also note that our main findings emerge in both IV and OLS regressions,
and thus in estimations with different identifying assumptions and different sets of strengths and
weaknesses.
Specifically, we instrument the globalization score of country i (with i ∈ I, the set of countries) at
time t with the one-period-lagged, inverse-distance-weighted globalization scores of all other
countries j ≠ i (with j, i ∈ I) at time t-1. To further reduce the likelihood of capturing unobserved
confounders we lag the IV by one period, thus combining the spatial lag with a temporal lag:
:
∑CHF:)
;?@ABWe use this regression to calculate fitted values ĝ for the second stage of our 2SLS dynamic panel
regressions (equation 1). Note that we run these 2SLS regressions also without the control variables
+′-.(/ described above, because we assume the exclusion restriction to hold without conditioning
on them. Formally, the identifying assumption is:
N (67"#(K 3"# | 1" , 2# ) = N (67"#(K 3"# | 1" , 2# , +′-.(/ ) = 0 (4)
The subsequent chapter presents the results of these regressions.
IV. EMPIRICAL RESULTS
A. Growth: Main Results
We begin our regression analyses by looking at the effect of economic globalization on rates of
economic growth in the subsequent 5-year period. In general, we find that economic globalization
increases growth; these gains from globalizing, however, get smaller the more globalized the
country already is.
[Table 2 here]
In Table 2 we first estimate OLS fixed effects regressions of 5-year growth rates on average
economic globalization in the previous period that control for country and year fixed effects and
the level of GDP per capita in the previous period. In column 2 we add the set of covariates
described above. The controls that are statistically significant at conventional levels enter with the
expected sign: Higher life expectancy and more democratic institutions are associated with higher
per capita growth rates while population growth is negatively associated. Turning to the coefficient
of interest, we find a positive, but economically weak conditional correlation between lagged
economic globalization and growth in these two regressions. A one-point increase in globalization
is associated with an increase in the 5-year growth rate by 0.3 percentage points (translating into
an average annual growth effect of 0.06 percentage points). In columns 3 and 4, we apply our IV
strategy to account for potential endogeneity. The first stage diagnostics show that the instrument
is relevant: The IV’s coefficient in the first stage (α = 0.66) is highly significant (t = 4.81, p <
0.001) and the Kleibergen-Paap (K-P) statistics pass standard tests of instrument relevance.32 In
32
The Kleibergen-Paap weak identification F-statistics show that the IV surpasses the relevant thresholds calculated by Stock and
Yogo (2005), i.e., 16.38 for the regressions with one endogenous regressor and 7.03 for the regressions with two endogenous
22You can also read