Rental Affordability Snapshot 2019 - Greater Sydney and the Illawarra - John Bellamy, Penny Andersen and Gordon Bijen, Anglicare Diocese of ...
←
→
Page content transcription
If your browser does not render page correctly, please read the page content below
Rental Affordability
Snapshot 2019
Greater Sydney and the Illawarra

John Bellamy, Penny Andersen and Gordon
Bijen, Anglicare Diocese of Sydney, Social
Policy & Research Unit
About the Rental Affordability Snapshot
The Rental Affordability Snapshot (RAS) was originally developed by the Social Action
Research Centre at Anglicare Tasmania to highlight the lived experience of looking for
housing whilst on a low income. An audit of rental properties determines the extent to
which on the nominated day a person on a low income is able to find housing that is both
affordable and appropriate for their needs.

The RAS has been coordinated by the national peak body, Anglicare Australia.

The following organisations participated in the 2019 Snapshot:
• AC Care, SA
• Anglicare Central Queensland
• Anglicare North Coast
• Anglicare North Queensland
• Anglicare Northern Inland
• Anglicare NSW South, NSW West and ACT
• Anglicare NT
• Anglicare SA
• Anglicare Southern Queensland
• Anglicare Sydney
• Anglicare Tasmania
• Anglicare Victoria
• Anglicare WA
• Anglicare Willochra
• Samaritans Foundation

The findings from the Rental Affordability Snapshot are not intended to be compared across
each state and territory and as such, should only be considered within the context of their
geographic area. National findings are available at www.anglicare.asn.au

© Anglicare Diocese of Sydney, 2019

ISBN: 978 0 9875870 8 4

                                                                      #RentalSnapshot2019
Acknowledgments: The authors wish to
acknowledge the following people for their                            #AddressRentalStress
assistance and advice: Liping Yan (SPRU), Malina
Mumbi (Communications Div) and Imogen Ebsworth                             facebook.com/ANGLICARESydney
(Anglicare Australia).
                                                                           twitter.com/anglicaresydney
We wish to acknowledge REA Group for the generous
provision of data for this Snapshot.                                       linkedin.com/company/anglicare-sydney
Media Contact: Agnes Wilson, Media Coordinator
(0466 692 098) or Janine Jones, Public Affairs
Manager (0407 066 813).                                                www.anglicare.org.au
Research Contact:
John Bellamy at: research@anglicare.org.au
 2 2 Anglicare Rental Affordability Snapshot 2018 - Greater Sydney and the Illawarra
Contents

  Executive Summary                                                  4
  1. Introduction                                                    6

  2. Methodology                                                     7
  2.1 Measuring affordability and appropriateness                    7
  2.2 How affordability was calculated                               8
  2.3 Share accommodation                                            10
  2.4 Geographic coverage                                            11
  3. Results for Greater Sydney                                      13
  3.1 Income support households                                      13
  3.2 Minimum wage households                                        14
  4. R
      esults for the Illawarra region                               16
  4.1 Income support households                                      16
  4.2 Minimum wage households                                        17
  5. Combined Results for Greater Sydney and the Illawarra          19
  5.1 Increased rental listings                                      19
  5.2 Overall results by household type                             19
  5.3 Share accommodation                                            21
  5.4 National comparability                                         21
  6. Breakdown of Results by Statistical Area                        22
  6.1 Income support households                                      22
  6.2 Minimum wage households                                       23
  7. Discussion and Policy Recommendations                           26
  7.1 Increase social and affordable rental housing stock           29
  7.2 Increased Government commitment to affordable housing         30
  7.3 Improve income support and rent assistance                    31
  7.4 R
       eview housing taxes and concessions                          34
  7.5 Improve conditions in the private rental market for renters   35
  8. References                                                      36
  Appendix A: Sydney Metropolitan Rings
                                                                     39
  by Local Government Area (LGA)

                                                                          3
Executive Summary
Anglicare Australia’s member agencies conducted the                            people. Where 2-bedroom properties are assumed
annual Rental Affordability Snapshot over a weekend                            to be appropriate for families with 2 children, it was
in March 2019, with the aim of highlighting the difficulty                     found that 4,791 properties in Greater Sydney and
in finding affordable and appropriate rental properties                        501 properties in the Illawarra region were affordable
for low income households. As part of this national                            and appropriate.
project, Anglicare Sydney examined approximately
24,000 rental advertisements in Greater Sydney                                 Compared with previous Snapshots, the number of
(including the Central Coast)1 and the Illawarra region,2                      suitable rental properties for people on the minimum
over the weekend of 23-24 March, using online media.                           wage has increased in Greater Sydney (up from 2,709
The total number of listings has increased substantially                       properties in 2018), and in the Illawarra region (380
by 30% since the 2018 Snapshot. Results are provided                           properties in 2018). However, the majority of suitable
for Greater Sydney and the Illawarra, and for the 17                           properties for people on the minimum wage were
Statistical Areas that comprise these larger regions.                          located further away from the CBD in areas such as
The findings reveal that for households reliant on                             Western and Southern Western Sydney, the Central
income support payments, finding appropriate and                               Coast and the Blue Mountains.
affordable housing is almost impossible.
                                                                               Payment of 30-45% of income as rent:
Affordability of rental properties for people on                               Anglicare Sydney also explored the availability of
income support: These households include single                                rental properties in the 30-45%-of-income band that
parents, people living with a disability, the elderly and                      would place a household into rental stress. Using
frail aged, full-time students, and people seeking paid                        this criterion, there were 2,555 additional suitable
employment. For income support recipients, finding                             listings in Greater Sydney and 340 in the Illawarra
an affordable and appropriate rental dwelling which                            region, where households relying on income support
costs less than 30 percent of their household income                           would have spent between 30 and 45 percent of
is a difficult challenge, with few low-cost, private                           their income. For households earning the minimum
rental dwellings being available. Based on the criteria                        wage, there were 8,233 additional suitable listings in
that 2-bedroom properties would be appropriate                                 Greater Sydney and 612 in the Illawarra region in the
for families with 2 children, only 50 properties in                            30-45%-of-income band.3
Greater Sydney and 16 properties in the Illawarra
were affordable and appropriate. The total number of                           A range of policy solutions are needed to improve
suitable rental properties (66) was higher than in 2018                        rental affordability for low income households,
(57 properties) and in 2017 (30 properties), and was                           including the urgent need for increases in the supply
less than one percent of total advertised properties.                          of social housing, raising the rate of Commonwealth
                                                                               Rent Assistance and increasing the Newstart
Most affordable and appropriate properties were                                Allowance. There needs to be firm and long-term
located in the Outer Ring of Sydney (at least 20km                             commitment to the supply of affordable housing from
from the CBD). It is concerning that there were no                             all levels of government, community and business
rental properties in Sydney and the Illawarra that were                        sectors. Detailed policy recommendations are
suitable for single people on the Parenting Payment,                           outlined in this report.
Disability Pension, Youth Allowance or Newstart,
without placing them into rental stress.

Affordability of rental properties for minimum
wage households: Rental affordability was also
examined for people earning the minimum wage,
including couple families, single parents and single

1 Greater Sydney is here defined as the Sydney Greater Capital City Statistical Area (GCCSA) which includes the Central Coast.
2 The Illawarra region is here defined as the Illawarra Statistical Area Level 4 (SA4), plus the Southern Highlands and Shoalhaven SA4. Current and
previous data for the Illawarra region have been adjusted throughout this report to exclude the postcodes 2536, 2579 and 2622 (now included in
Anglicare NSW South, NSW West and ACT region). 3 Calculations for the 30-45%-of-income band were also based on 2-bedroom properties being
appropriate for families with 2 children.

 4
Rental Affordability Snapshot 2019 - Results at a Glance
                                                Max.
                                             Affordable                           No.of appropriate
                              Payment                                                                       Location of suitable
  Household Type                              Rent/Wk       Assumptions             & affordable
                               Type                                                                             properties
                                            (30% income                              properties
                                               or less)
Income Support Recipients (results for Greater Sydney and the Illawarra Region)

Couple, two children        Newstart                       At least 2                                   Sydney – Middle Ring (1)
                                                                            11 (less than 1% of
(one aged less than 5,      Allowance       $247.43        bedrooms needed,                             Sydney – Outer Ring (5),
                                                                            listed properties)
one aged less than 10)      (both adults)                  not share-house                              Shoalhaven/SH (3) Illawarra (2)

Single, two children (one   Parenting                      At least 2
                                                                            1 (less than 1% of          Shoalhaven/Southern
aged less than 5, one       Payment         $218.77        bedrooms needed,
                                                                            listed properties)          Highlands (1)
aged less than 10)          Single                         not share-house

                                                                                  52 (less than 1% of   Sydney – Inner Ring (1)
                                                                                  listed properties)    Sydney – Middle Ring (2),
Couple, no children         Age Pension     $225.63        Not share-house
                                                                                                        Sydney – Outer Ring (37),
                                                                                                        Shoalhaven/SH (7), Illawarra (5)

                            Parenting                      At least 2
Single, one child
                            Payment         $191.34        bedrooms needed, None                        N/A
(aged less than 5)
                            Single                         not share-house

                                                           At least 2
Single, one child           Newstart
                                            $149.45        bedrooms needed, None                        N/A
(aged over 8)               Allowance
                                                           not share-house

                                                                                  7 (less than 1% of
                                                                                  listed properties)    Sydney – Inner Ring (1),
Single                      Age Pension     $157.40        None                                         Sydney – Outer Ring (5),
                                                                                                        Illawarra (1)

                            Disability
Single aged over 21         Support         $157.41        Not share-house        None                  N/A
                            Pension
                            Newstart
Single                                      $89.79         None                   None                  N/A
                            Allowance

                            Youth
Single aged over 18                         $70.34         None                   None                  N/A
                            Allowance

Total unique properties                                                           66 (less than 1%)

Minimum Wage Recipients (results for Greater Sydney and the Illawarra Region)

                                                                                                        Sydney – Inner Ring (56),
                            Min Wage (x2)
Couple, two children                                       At least 2                                   Sydney – Middle Ring (1,139),
                            + Family Tax                                    5,227 (22% of listed
(one aged less than 5,                      $438.02        bedrooms needed,                             Sydney – Outer Ring (3,541),
                            Benefit                                         properties)
one aged less than 10)                                     not share-house                              Illawarra (270), Shoalhaven/
                            (FTB) A
                                                                                                        SH (221)

                            Min. Wage
Couple, two children        + Parenting                    At least 2                                   Sydney – Middle Ring (66),
                                                                            960 (4% of listed
(one aged less than 5,      payment         $333.50        bedrooms needed,                             Sydney – Outer Ring (747),
                                                                            properties)
one aged less than 10)      (partnered) +                  not share-house                              Illawarra (77), Shoalhaven/SH (70)
                            FTB A & B

Single, two children        Minimum                        At least 2                                   Sydney—Middle Ring (6),
                                                                            219 (Less than 1% of
(one aged less than 5,      Wage + FTB      $296.76        bedrooms needed,                             Sydney – Outer Ring (183),
                                                                            listed properties)
one aged less than 10)      A&B                            not share-house                              Illawarra (15), Shoalhaven/SH (15)

                                                                                                        Sydney – Inner Ring (16),
                            Minimum                                               65 (less than 1% of   Sydney – Middle Ring(9),
Single                                      $190.09        None
                            Wage                                                  listed properties)    Sydney – Outer Ring (30),
                                                                                                        Illawarra (8), Shoalhaven/SH (2)

Total unique properties                                                           5,292 (22%)

                                                                                                                                        5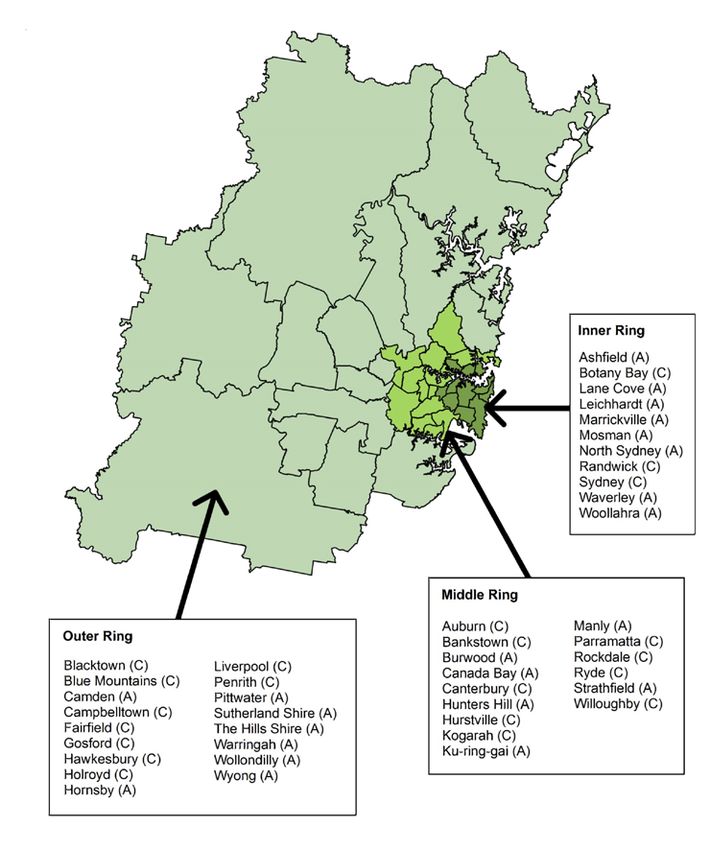
1. Introduction
On the weekend of 23-24 March 2019, Anglicare            Our service users invariably need a pathway to
agencies across Australia conducted a Rental             affordable and sustainable housing in order to lay a
Affordability ‘Snapshot’. The Snapshot involved          secure foundation for all other aspects of their lives
identifying rental property listings available on        and those of their families.
the private market at a common point in time and
comparing these with the ability of prospective          Anglicare Sydney’s 2019 Snapshot confirms what our
renters to pay the advertised rates, without being       service users, staff and volunteers have reported –
subject to rental stress. Anglicare Sydney’s findings    there is a chronic, continuing shortage of affordable
are presented for 17 Statistical Areas comprising the    and appropriate properties available to households
Greater Sydney and Illawarra regions.                    on income support. An increasing number of
                                                         households are competing in the private rental
This is the ninth annual Rental Affordability Snapshot   market, resulting in a tight market where low income
report released by Anglicare Sydney. Once again,         renters pay more than 30% of their income in order to
the report focuses on the rental expenditure for         procure a rental property.
people who are receiving income support payments
(government benefits) as their only source of income.    This report outlines the findings of the Snapshot,
This Snapshot also examines the availability of rental   factors contributing to the shortage of affordable
properties for full-time workers earning the lowest      properties in the private rental market and policy
after-tax level of the minimum wage. The proportion      recommendations to improve housing affordability
of Australian employees on the minimum wage              and availability for income support recipients and
varies. This proportion is higher for those working      minimum wage households.
casually or part time, women, younger workers and
those with low levels of education. The latest figures
reveal that of the 12,380,100 Australian employees
in the workforce, 2.3 million are on national awards,
and about 200,000 of all employees are paid
the minimum wage (DJSB, 2018). This equates to
approximately 2% of the workforce being paid the
national minimum wage rate.

For households in the lowest income bands,
procuring safe, affordable and appropriate housing
in Sydney’s private rental market can be difficult.
For such households, housing stress, housing
insecurity, short tenancies and re-location to
more distant areas with less infrastructure, can
exacerbate other risk factors for disadvantage: food
insecurity, reduced opportunities for education and
employment, and ill-health. As Anglicare Sydney
aims to deliver services that seek to address
the needs of people living with disadvantage in
a holistic way, long-term housing security and
affordability feature prominently in the primary
needs that our service users face. They require
a stable housing foundation on which to build or
re-build their lives in the face of significant social
and economic disadvantage, including disability,
mental or physical illness, homelessness, family
violence, child abuse, unemployment, frail ageing,
and full-time caring for a person with mental illness
or disability.

 6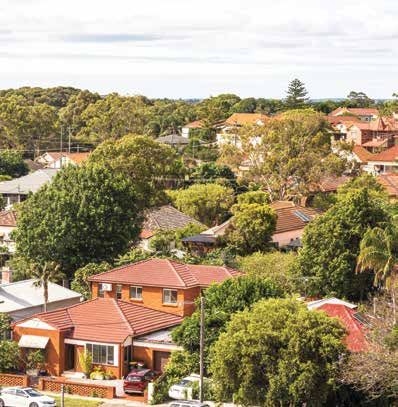
2. Methodology
The Rental Affordability Snapshot for Greater Sydney        2.1 Measuring Affordability and
and the Illawarra was conducted over the weekend            Appropriateness
of 23-24 March 2019. Advertisements for rental
                                                            This study defined an affordable rental property as
accommodation were sourced from realestate.com.au.
                                                            one which took up 30% or less of the household’s
                                                            income. Exceeding the 30% benchmark is commonly
Eligible rental properties were assessed for
                                                            used as an indicator of “housing stress” among low
affordability and appropriateness across a range of
                                                            income households. Anglicare Sydney also counted
household types receiving the basic income support
                                                            the number of rental properties available where 30-
payments from Centrelink. Each household was
                                                            45% of income would be required to be spent on rent,
assumed to be receiving the maximum rate of income
                                                            placing a household into “housing stress” but not into
support, including Family Tax Benefit if applicable.
                                                            “extreme rental stress” (ie, at least 50% of income
The following advertisements were excluded from
                                                            spent on rent).
the Snapshot:
                                                            Appropriateness was determined by the following criteria:
• Housing in retirement villages, student
  accommodation and holiday accommodation
                                                            • A room in a share house, bedsit or at least a 1
• Advertisements for “non-dwellings”, e.g. car spaces,        bedroom property was considered suitable for a
  garages, office, shops etc.                                 single person
• Properties that were already listed as being              • A room in a bedsit or at least a 1 bedroom property
  “leased” “deposit received”                                 was considered suitable for a couple without children
• Short-term leases (less than 6 months)                    • A 2 bedroom property was considered suitable for
• Multiple advertisements for the same rental property        parent(s) with one or two children.
• Properties that include a condition such as
  childminding or other ‘employment’ activities             Regarding the last of these points, the Canadian
• For the purposes of the survey, the following             Housing Occupancy Standard states that each child
  assumptions were applied:                                 of the opposite sex aged 5 years and above will need
• Where rents were banded (e.g. the property was            to have a separate bedroom (CMHC 2018). Generally,
  advertised as renting at $200-$220 per week),             it is assumed that households are overcrowded if
  the highest rent in the band was considered as the        these conditions are not met. However, the standard
  actual price (e.g. $220).                                 has also assumed that it is reasonable for children of
                                                            the same gender aged 18 years and below to share
• Where rents were listed as ‘from $x’ or ‘offers above
                                                            a bedroom. The maximum number of occupants per
  $x’ or ‘$x negotiable’, the figure given ($x) was used.
                                                            bedroom is two.
• Where rents were not stated in the advertisement, it
  was assumed that these properties would be                Consistent with previous Snapshots, Anglicare Sydney
  too expensive.                                            has elected to count properties with 2 bedrooms
• Where multiple properties were advertised in the          as appropriate for households with 2 children.
  same listing (e.g. 2 rooms available in the one share     This approach is less conservative than assuming
  house), they were counted as separate properties.         3 bedrooms as appropriate, and has the effect of
• The exception to the above rule was when it               increasing the estimated number of appropriate
  was not clear from the advertisement how many             properties available for households with 2 children.
  properties were available – in these cases, they          It should be noted that Anglicare Australia’s national
  were counted as two properties.                           study has adopted the more stringent criterion of a
                                                            3 bedroom property being necessary where there
                                                            are 2 children, resulting in a lower number of suitable
                                                            properties available for households with two children.

                                                                                                                  7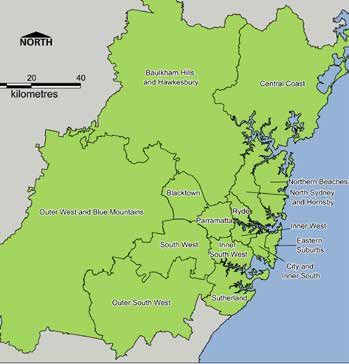
In order for a rental property to be considered suitable    Rent assistance is paid at 75 cents for every dollar
for a particular household type – either at the 30% or      above the minimum rent needed to qualify, up to a
45% benchmark, it needed to be both affordable and          maximum rent. Once their rent exceeds that maximum
appropriate. However, it was beyond the scope of this       rent, the household does not receive any extra rent
Snapshot to determine whether housing was properly          assistance, no matter how high their rent goes. Single
maintained, satisfactory and/or safe.                       households earning the minimum wage are not eligible
                                                            to receive CRA, as it is assumed they are not in receipt
                                                            of any income support payments.
     “This study defined an affordable
      rental property as one which took                     The segmentation of single parent families by the age
      up 30% or less of the household’s                     of the child has been conducted again in this year’s
      income. Exceeding the 30%                             Snapshot, to reflect changes to the Parenting Payment.
      benchmark is commonly used as an                      From 1 January 2013, Parenting Payments ceased
                                                            for couple families when their youngest child turned
      indicator of ‘housing stress’.”
                                                            6 years old. In addition, payments ceased for single
                                                            parents when their youngest child turned 8 years old.
2.2 How Affordability was Calculated
The first step in the Rental Affordability Snapshot
involved determining the maximum affordable rent
for each household type and payment type. This
was carried out by Anglicare Australia as part of
the national study, and is shown in Table 1. The only               Amanda’s Story
income sources taken into account for households                    Amanda is a single mother with a toddler,
on income support were the household’s main                         who rents a property with another single
income support payment and Family Tax Benefit. It                   mum with a toddler. Altogether they
was assumed that households were receiving the                      pay $600 pw in rent, with a combined
maximum rate of these payments. Other allowances
                                                                    household income of about $1,000
the household might receive (e.g. Mobility Allowance)
                                                                    pw. Amanda and her friend are having
were excluded. It was assumed that households
                                                                    trouble keeping up with the rent, which
receiving income support payments had no income
                                                                    is in arrears, and have now fallen behind
from paid work.
                                                                    in paying the electricity bills. They are
As per last year’s Snapshot, it was assumed that
                                                                    unable to provide enough for basic
households earning the National Minimum Wage                        essentials. To make matters worse, there
were receiving the lowest after-tax level of this wage.             are significant electrical repairs required
All income figures were taken from the information                  to the dwelling, including lights hanging
provided on the Centrelink website and the Fair Work                from the ceiling, power switches coming
Australia website (current as of April 1 2019).                     away from the walls and exposed wiring.

Commonwealth Rent Assistance (CRA) payments,
as listed in Table 1, were included as part of a
household’s total income, rather than being treated
separately as a housing allowance. This inclusion was
based on earlier research by Hulse (2002), who found
that surveyed households were using this income to
pay for other (non-housing) bills as they became due,
rather than setting the payment aside to specifically
pay for their rent. Information on CRA rates was taken
from the Centrelink website (current as of 1 April 2019).
All entitlements are paid fortnightly.

 8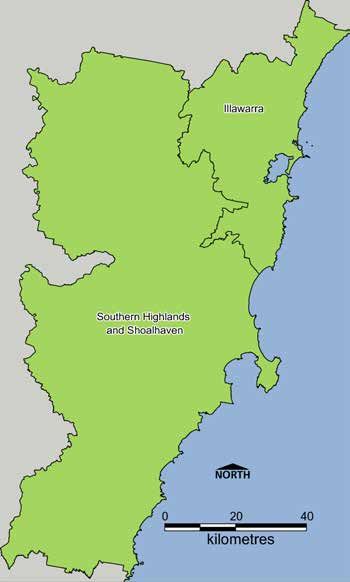
Table 1: Total Income and Maximum Affordable Rent per Household Type

                                                                      Total                   Maximum      Maximum
                                                                     Income       Max CRA     Affordable   Affordable
                                                        Minimum
                                                                       per           per         Rent         Rent
      Household Type                 Payment type       Bedrooms
                                                                    fortnight     fortnight   per week     per week
                                                         needed
                                                                   (excl. CRA)                 (30% of      (45% of
                                                                                               income)      income)

 Couple, two children (one
                                   Newstart Allowance
 aged less than 5, one aged                             2          $1,467.52     $182.00      $247.43      $371.14
                                   (both adults)
 less than 10)

 Single, two children (one aged
                                   Parenting Payment
 less than 5, one aged less                             2          $1,297.32     $161.14      $218.77      $328.15
                                   Single
 than 10)

 Couple, no children               Age Pension          Studio     $1,375.00     $129.20      $225.63      $338.45

 Single, one child (aged less      Parenting Payment
                                                        2          $1,114.48     $161.14      $191.34      $287.01
 than 5)                           Single

 Single, one child (aged over 8)   Newstart Allowance   2          $892.58       $161.14      $149.45      $237.09

 Single                            Age Pension          Studio     $912.10       $137.20      $157.40      $236.09

                                   Disability Support
 Single aged over 21                                    Studio     $912.19       $137.20      $157.41      $236.11
                                   Pension

 Single                            Newstart Allowance   Studio     $555.70       $137.20      $89.79       $155.90

                                   Youth Allowance,
 Single aged over 18                                    Studio     $455.20       $137.20      $70.34       $123.42
                                   Austudy

                                   Youth Allowance,
 Single in share house                                  Studio     $455.20       $91.47       $70.34       $123.00
                                   Austudy

 Couple, two children (one
                                   Minimum Wage (two
 aged less than 5, one aged                             2          $2,738.14     $182.00      $438.02      $657.03
                                   full-time workers)
 less than 10)

 Couple, two children (one         Minimum Wage and
 aged less than 5, one aged        Parenting Payment    2          $2,041.35     $182.00      $333.50      $500.25
 less than 10)                     Partnered

 Single, two children (one
 aged less than 5, one aged        Minimum Wage         2          $1,817.26     $161.14      $296.76      $445.14
 less than 10)

 Single                            Minimum Wage         Studio     $1,267.27     $0.00        $190.09      $285.14

                                                                                                                     9
2.3 Share Accommodation It was not possible to arrive at an indicative number
An important change in the rental market has of listings on the flatmates.com website. Instead the
been the growth of website platforms for share approach taken in the study has been to sample
accommodation. ‘Share accommodation’ is advertised manually the flatmates.com website, to estimate
as renting a bedroom but with shared facilities such the proportion of listings which would meet the
as bathroom, kitchen and laundry, or renting a share affordability and appropriateness criteria for the single
bedroom (ie, more than one bed) within a share person categories in the study. Where possible, any
house arrangement. Share accommodation includes listings indicating the need to share a bedroom have
commercial boarding houses and sharing a house or been excluded from these totals; only those listings
apartment with unrelated adults. There was a small where, at face value, the renter would have their own
number of boarding house and share house rooms bedroom, have been included.
(n=221) which formed part of the data received from
realestate.com.au for 23-24 March 2019, and which are
included in the main results tables of this Snapshot.
However, the general approach taken in this study
has been to exclude from the tables of results the
more numerous private share house listings found
on flatmates.com and gumtree.com; these share
house results are presented separately in this report.
While some share house listings will be affordable
for the categories of single persons in the study,
there are points at which many such listings fail to
meet the appropriateness criteria used in the study.
It is not considered appropriate that people be Bill’s Story
forced into shared bedrooms or shared living simply Bill lives on his own, and is currently
because it meets affordability criteria; in this respect, renting a room in a hotel for $230 pw.
shared accommodation is different to other rental The rent takes most of his $330 pw
accommodation where the prospective renter would income, leaving him with just over $100
also be the lessee, and would thus have the choice to pw for food, living expenses, clothes and
share or not to share their accommodation. travel to find a job. He is also paying off
a debt to a payday lender and, because
In addition, many share accommodation listings he has had to move so often, pays to
are conditional, meaning that the person placing keep some of his possessions in storage.
the advertisement is looking for a particular kind of
He has been on the waiting list for social
flatmate; apart from conditions such as ‘female only’,
housing for 4 years.
other conditions such as ‘working person’ or ‘student’
would, at face value, appear to exclude income support
recipients. In this respect, many listings would fail to
meet the appropriateness criteria on these grounds.
The online classifieds site Gumtree (gumtree.com.
au) was used in this year’s Snapshot to provide an
indicative total of additional ‘Flatshare/Houseshare’
listings that could be affordable for single persons.
102.4 Geographic Coverage 30,000 people. Table 2 describes the breakdown
The geographic areas for reporting the Snapshot of Level 4 Statistical Areas and key suburbs located
results are based on the Australian Statistical within the Statistical Area. Greater Sydney may
Geography Standard (ASGS), which was introduced also be divided into three metropolitan rings (Inner,
by the Australian Bureau of Statistics (ABS) in Middle and Outer) according to Local Government
September 2011. The results in this report are sorted Area. As such, each Statistical Area may span one
into Greater Sydney’s 15 ‘Level 4’ Statistical Areas, or more rings. A map of metropolitan rings in Sydney
each of which have a resident population of at least is included in Appendix A.
Figure 1. Map of Greater Sydney
Key Statistics from the 2016 Census
(Greater Sydney)
Total Population: 4,823,993
Population born overseas: 1,773,493 (39 percent)
Unemployment rate: 6.0 percent
Total household income less than $650 per
week*: 16.9 percent of households
Population residing in private rental dwellings:
26.5 percent
Source: ABS Census of Population and Housing (2016),
extracted from Census TableBuilder, 9-10April 2018.
* A single person household on the minimum wage would
have an income of up to $650 per week.
Table 2: Statistical Areas and Key Suburbs
Level 4 Statistical Areas Key Suburbs
Baulkham Hills and Hawkesbury Baulkham Hills, Castle Hill, Dural, Kellyville, Windsor
Blacktown Blacktown, Marayong, Mount Druitt, Rooty Hill, Seven Hills
Central Coast Erina, Gosford, Terrigal, The Entrance, Toukley, Tuggerah, Woy Woy, Wyong
City and Inner South Alexandria, Glebe, Lewisham, Marrickville, Mascot, Newtown, Redfern, Surry Hills
Eastern Suburbs Bondi Junction, Kensington, Paddington, Randwick, Waverley, Woollahra
Inner South West Bankstown, Beverly Hills, Hurstville, Kogarah, Mortdale, Rockdale, Wolli Creek
Inner West Ashfield, Burwood, Canterbury, Dulwich Hill, Homebush, Leichhardt, Strathfield
North Sydney and Hornsby Chatswood, Hornsby, Mosman, Pymble, North Sydney, St Ives, St Leonards
Northern Beaches Dee Why, Manly, Narrabeen, Pittwater, Terrey Hills
Outer South West Camden, Campbelltown, Glenfield, Macquarie Fields, Menai, Minto, Tahmoor
Outer West and Blue Mountains Emu Plains, Katoomba, Kingswood, Penrith, Richmond, St Marys
Parramatta Auburn, Carlingford, Granville, Parramatta, Regents Park, Sefton, Westmead
Ryde Eastwood, Epping, Gladesville, Hunters Hill, Pennant Hills, Ryde, West Ryde
South West Cabramatta, Fairfield, Holsworthy, Liverpool
Sutherland Cronulla, Engadine, Jannali, Sutherland
11The geographic areas for reporting data are based Figure 2: Map of the Illawarra, Shoalhaven
on the Australian Statistical Geography Standard and Southern Highlands
(ASGS), as developed by the Australian Bureau of
Statistics. Results for the Illawarra are sorted into
two Level 4 Statistical Areas, as outlined below.
Key Statistics from the 2016 Census
(Illawarra)
Total Population: 440,856
Population born overseas: 78,629 (19%)
Unemployment rate: 6.5%
Total household income less than $650 per
week*: 23.4% of households
Population residing in private rental dwellings:
19.5%
Source: ABS Census of Population and Housing (2016),
extracted from Census TableBuilder, 9-18 April 2018.
* A single person household on the minimum wage would
have an income of up to $650 per week.
Table 3: Statistical Areas and Key Suburbs
Level 4 Statistical Areas Key Suburbs
Albion Park, Dapto, Fairy Meadow, Gerroa, Gerringong, Helensburgh, Kiama, Port Kembla,
Illawarra
Shellharbour, Wollongong
Shoalhaven and Southern
Bowral, Mittagong, Moss Vale, Jervis Bay, Nowra, Ulladulla
Highlands
123. Results for Greater Sydney
3.1 Income Support Households The Sydney rental market remains largely unaffordable
Of the 22,653 properties available for private rent for households on income support, without entering
in Greater Sydney for the weekend of 23-24 March into rental stress.
2019, only 50 unique properties were affordable
and appropriate, without placing income support As was the case in 2018, the majority of suitable
households into rental stress. The bulk of suitable properties at the less-than-30%-of-income band
properties (45) were located in Sydney’s Outer Ring, were only appropriate for couples on the Aged
over 20kms from the CBD. Three suitable properties Pension, including a number of studio apartments.
were located in Sydney’s Middle Ring and two in the This suggests that finding suitable housing in Sydney
Inner Ring. for low income households is almost impossible for
the majority of household types without entering into
Table 4 shows the distribution of affordable properties rental stress. In particular, there were no suitable rental
for different household types. Given that some properties across Sydney for particular households in
individual properties were affordable and appropriate the less-than-30-percent of income group – including
for more than one household type, the unadjusted total single parents on Newstart Allowance or Parenting
for each household type shown in Table 4 below may Payment and single persons receiving the Youth
exceed the total number of unique properties identified. Allowance or Newstart Allowance. For those willing
to enter into rental stress, the number of available
Comparison with the results of the 2018 Snapshot suitable properties increased for single people on the
indicates that the number of affordable and Aged Pension (+163 properties) and Disability Pension
appropriate properties for income support households (+54), but remained poor for those on Newstart (+6).
remains scarce. While the number of listings that were No additional properties were suitable for single
affordable and appropriate has improved slightly, the people on Youth Allowance, even at 45% of income.
proportion of listings available has remained constant
for all household types.
Table 4: Rental Properties in Greater Sydney - Income Support Households, March 2019 and March 2018
No. and % No. and % No. and % No. and %
affordable & appropriate affordable & appropriate
Results by Household Type
appropriate (at 30% - 45% appropriate (at 30% - 45%
(30% income) income) (30% income) income)
Income Support 2019 (total 22,653 properties advertised) 2018 (total 17,395 properties advertised)
Couple, 2 children
6 (less than 1%) 1,856 (8%) 7 (less than 1%) 911 (5%)
(Newstart Allowance)
Single, 2 children
None (0%) 631 (3%) 1 (less than 1%) 353 (2%)
(Parenting Payment Single)
Couple, no children (Aged Pension) 40 (less than 1%) 1,421 (6%) 35 (less than 1%) 851 (5%)
Single, 1 child < 5 years
None (0%) 118 (less than 1%) None (0%) 62 (less than 1%)
(Parenting Payment Single)
Single, 1 child > 8 years
None (0%) 2 (less than 1%) None (0%) 5 (less than 1%)
(Newstart Allowance)
Single (Aged Pension) 6 (less than 1%) 163 (less than 1%) 4 (less than 1%) 146 (less than 1%)
Single (Disability Pension) None (0%) 54 (less than 1%) 1 (less than 1%) 47 (less than 1%)
Single (Newstart Allowance) None (0%) 6 (less than 1%) None (0%) 4 (less than 1%)
Single, 18+ years (Youth Allowance) None (0%) None (0%) None (0%) 1 (less than 1%)
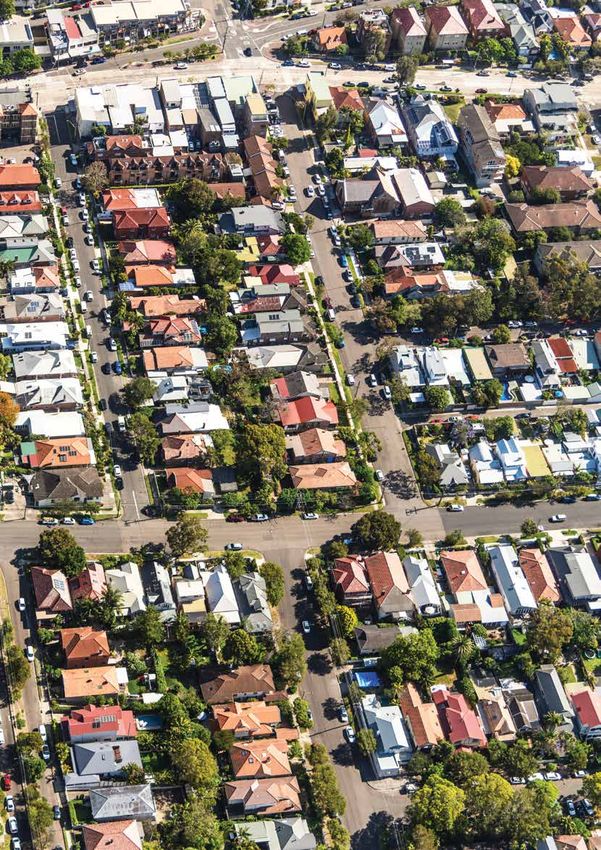
Total unique properties 50 (As was the case in previous Snapshots, there was a Chart 1: Proportion of Total Rental Listings that were
notable difference between single parents with one Affordable and Appropriate for Households Receiving
child receiving Parenting Payments and those on the Income Support Payments, Greater Sydney (2015-19
Newstart Allowance. While there were no affordable Snapshots)
and appropriate properties found for these two
groups, a handful of properties were available for
Parenting Payment households prepared to enter into
rental stress (30-45%-of-income spent on rent). Among
this group, single parents on the Parenting Payment
could afford an additional 118 appropriate properties
across Sydney, compared with those on Newstart
who could only afford 2. While both sets of results
are rather poor, the cessation of Parenting Payments
may determine whether households can access
appropriate housing.
Across Greater Sydney, there were 2,555 additional
unique listings that would require 30-45% of income
to be spent for at least one of the household types
shown. Given that there are some overlaps in listings
between household categories in Table 4, the
unadjusted total will exceed the total number of unique Table 5: Unique Affordable and Appropriate Rental
listings. Therefore the total for the 30-45%-of-income Listings in Greater Sydney – Income Support
band has been adjusted to remove these overlaps. Households (2018-19)
Chart 1 shows the proportion of all rental listings in No. affordable & No. appropriate
Greater Sydney that were affordable and appropriate Year appropriate (at 30% - 45%
(30% income) income)
for households receiving income support payments
in the last five Snapshots. For the less-than-30%- Unique rental listings suitable for Income Support households
of-income band, the proportion of appropriate and
affordable properties remained at less than one 2019 result 50 (Table 6: Rental Properties in Greater Sydney - Minimum Wage Households, March 2019 and March 2018
No. and % No. and % No. and % No. and %
affordable & appropriate affordable & appropriate
Results by Household Type
appropriate (at 30% - 45% appropriate (30% (at 30% - 45%
(30% income) income) income) income)
Minimum wage 2019 (total 22,653 properties advertised) 2018 (total 17,395 properties advertised)
Couple, 2 children (2 x MW) 4,736 (21%) 7,851 (35%) 2,672 (15%) 5,981 (34%)
Couple, 2 children(1 x MW, 1 x
813 (4%) 7,061 (31%) 365 (2%) 4,304 (25%)
Parenting Payment (partnered))
Single, 2 children 189 (less than 1%) 4,853 (21%) 120 (less than 1%) 2,876 (17%)
Single, no children 55 (less than 1%) 500 (2%) 37 (less than 1%) 295 (2%)
Total unique properties 4,791 (21%) 8,233 (36%) 2,709 (16%) 6,237 (36%)
This year’s Snapshot also examined rental affordability Single parents with two children on the Minimum
for families with two children in which one parent was Wage also had few options, with only 189 affordable
earning the Minimum Wage and the other parent and appropriate properties at the less-than-30%-of-
was receiving the Parenting Payment (Partnered). income band.
Such families would have been able to afford 813
appropriate properties without entering into rental
stress (4% of all advertised properties). “Only 50 unique properties were
Single persons without children who were earning the affordable and appropriate, without
Minimum Wage had limited options available to them – placing income support households
only 55 appropriate properties were affordable without into rental stress.“
entering rental stress.
Leonie’s Story
Leonie is a single mum with two children.
Changes to child support payments meant
that her last rental property became
unaffordable; she was forced to break
the lease, losing her bond in the process.
She has rented another property for $355
pw, which is still more than 50% of her
gross income of $650 per week. Leonie
now lives a long way from her children’s
school, but is reluctant to move the
children to another school again.
154. Results for the Illawarra Region
4.1 Income Support Households Couples receiving the Aged Pension had the highest
Of the 1,268 properties available for private rent in number of suitable properties available to them in
the Illawarra region on 23-24 March 2019, only 16 the less-than-30%-of-income band (n=12), followed
properties were affordable and appropriate, without by couple families on the Newstart Allowance (n=5).
placing households who were receiving income There were few or no affordable and appropriate
support payments into rental stress. Given that some properties for the remainder of household types
individual properties were affordable and appropriate dependent on income support payments.
for more than one household type, the unadjusted
total for each household type shown in Table 7 below More properties were available where households
will exceed the total number of unique properties were prepared to spend 30-45%-of-income, such as
identified. Most suitable properties were located in couple families on the Newstart Allowance (n=271),
the Shoalhaven or Southern Highlands (8) and 8 in the Aged Pension couples (n=206) and single parents on
Illawarra statistical area. the Parenting Payment with 2 children (n=119). Very
small increases were noted for single parents with a
The Illawarra region also had a very low proportion of child on the Parenting Payment (n=20) and for single
appropriate and affordable properties in the less-than- parents on the Newstart Allowance (n=4).
30%-of-income band (1%).
Table 7: Rental Properties in the Illawarra Region - Income Support Households, March 2019 and March 2018
No. and % No. and % No. and % No. and %
affordable & appropriate (at affordable & appropriate
Results by Household Type
appropriate 30% - 45% appropriate (30% (at 30% - 45%
(30% income) income) income) income)
Income Support 2019 (total 1,268 properties advertised) 2018 (total 1,051 properties advertised)
Couple, 2 children
5 (less than 1%) 271 (21%) 4 (less than 1%) 193 (18%)
(Newstart Allowance)
Single, 2 children
1 (less than 1%) 119 (9%) None (0%) 89 (8%)
(Parenting Payment Single)
Couple, no children
12 (less than 1%) 206 (16%) 13 (1%) 153 (15%)
(Aged Pension)
Single, 1 child < 5 years
None (0%) 20 (2%) None (0%) 23 (2%)
(Parenting Payment Single)
Single, 1 child > 8 years
None (0%) 4 (less than 1%) None (0%) 2 (less than 1%)
(Newstart Allowance)
Single (Aged Pension) 1 (less than 1%) 25 (2%) 2 (less than 1%) 19 (2%)
Single (Disability Pension) None (0%) 15 (1%) 1 (less than 1%) 15 (1%)
Single (Newstart Allowance) None (0%) 1 (less than 1%) None (0%) 2 (less than 1%)
Single, 18+ years
None (0%) None (0%) None (0%) None (0%)
(Youth Allowance)
Total unique properties 16 (1%) 340 (27%) 16 (2%) 236 (22%)
16Given that there are some overlaps in listings between In contrast, single parents with two children on the
household categories in Table 7, the unadjusted minimum wage were only able to afford 30 dwellings.
total will exceed the total number of unique listings. Single persons earning the minimum wage had only
Therefore the total for the 30-45%-of-income band has ten affordable and appropriate housing options at
been adjusted to remove these overlaps, resulting in their disposal. A couple family earning the Minimum
an additional 340 unique listings that would require Wage and Parenting Payment would have been able
30-45% of income to be spent for at least one of the to afford 147 appropriate properties. There was a
household types shown. substantial increase in suitable dwellings available for
these households in the 30-45%-of-income band (+621
Chart 2 shows the decline since 2015 in the proportion properties). There were an additional 571 appropriate
of rental listings in the Illawarra region that were properties for couple families (both MW), 489 additional
suitable for households receiving income support properties for single parents and 61 additional
payments. For the less-than-30%-of-income band, the properties for single people if they had chosen to
proportion of appropriate and affordable properties spend 30-45% of their income on rent.
has declined from three percent to one percent during
the period 2015-19. For households in the 30-45%-of- Chart 2: Proportion of Total Rental Listings that
income-band, the proportion of appropriate properties were Affordable and Appropriate for Households
has declined from 33 to 27 percent. Receiving Income Support Payments, Illawarra Region
(2015-2019 Snapshots)
4.2 Minimum Wage Households
Of the 1,268 properties available for private rent in
the Illawarra region on 23-24 March 2019, 501 unique
properties were affordable and appropriate for at least
one of the household types earning the minimum
wage (MW), without placing these household/s
into rental stress. Table 8 shows the distribution of
affordable properties for different household types.
Nearly all of the properties in the Illawarra region were
affordable and appropriate for couple families earning
the minimum wage (n=491) in the less-than-30%-of-
income band.
Table 8: Rental Properties in the Illawarra Region - Minimum Wage Households, March 2019 and March 2018
No. and % No. and % No. and % No. and %
affordable & appropriate (at affordable & appropriate (at
Results by Household Type
appropriate 30% - 45% appropriate (30% 30% - 45%
(30% income) income) income) income)
Minimum Wage 2019 (total 1,268 properties advertised) 2018 (total 1,051 properties advertised)
Couple, 2 children (2 x MW) 491 (39%) 571 (45%) 377 (36%) 469 (45%)
Couple, 2 children (1 x MW, 1 x
147 (12%) 621 (49%) 96 (9%) 468 (45%)
Parenting Payment (partnered))
Single, 2 children 30 (2%) 489 (39%) 33 (3%) 373 (35%)
Single, no children 10 (less than 1%) 61 (5%) 3 (less than 1%) 46 (4%)
Total unique properties 501 (40%) 612 (48%) 380 (36%) 501 (48%)
17In total, there were 612 additional unique listings in the Table 9: Unique Affordable and Appropriate Rental
Illawarra region that would require 30 to 45% of income Listings in the Illawarra Region – Minimum Wage
to be spent for at least one of the household types Households (2018-2019)
shown. Given that there are some overlaps in listings
between household categories in Table 8, the unadjusted
total will exceed the total number of unique listings. Table No. Affordable & appropriate
Year
(30% income)
9 shows the number and proportion of unique affordable
and appropriate rental listings in the Illawarra region for
Unique rental listings suitable for Minimum Wage
Minimum Wage earners. For the less-than-30%-of-income households
band, the number of unique properties increased by 121
properties, or 4% of listed properties. 2019 result 501 (40%)
2018 result 380 (36%)
Change (2018-19) +121
185. Combined Results for Greater Sydney & the Illawarra
5.1 Increased Rental Listings income band. In summary, only 66 properties were
There were substantially more listings on the Snapshot available for income support households without
weekend (23-24 March 2019) than on any of the sending them into rental stress. This number
equivalent Snapshot weekends in 2015-18. The increased by 2,895 properties where income support
number of listings in 2019 (23,921) was 30% higher households were prepared to enter into rental stress.
than the equivalent snapshot in 2018 (18,446), across This highlights the trade-off that occurs for people on
Greater Sydney and the Illawarra. low incomes; while devoting greater proportions of
household income leads to greater housing choice,
The greater number of listings is likely to reflect the at the same time households lose valuable income
record number of dwelling completions in recent that would otherwise be available for food, utility bills,
years. Figures from the NSW Dept. of Planning show transport costs and education and training.
that there were 42,529 dwellings completed in 2017-18
in the Greater Sydney area, compared with 34,412 in It is notable that there were no affordable and
2016-17 and 30,191 in 2015-16. This level of completions appropriate properties available anywhere in Sydney
is substantially higher than the yearly average of 16,160 or the Illawarra region for single persons on the
for the period 2005-2014 (DPE 2019). This increase in Disability Pension, Newstart Allowance or Youth
the supply of dwellings would be expected to account Allowance. Even single people on Youth Allowance
for a greater number of listings, particularly where who were prepared to pay 45% of their income on
demand has not rapidly soaked up this additional rent would have found only seven suitable properties
supply of dwellings. on the Snapshot weekend. Single parents on the
Newstart Allowance or on Parenting Payments also
The greater number of listings would also reflect the had no appropriate properties available to them in
relentless growth of the private rental sector in recent the less-than-30%-of-income band. In the 30-45%-of-
decades. It has been estimated that the private rental income band, there were 6 additional properties
sector has increased by 38% nationally between 2006 available for single parents on the Newstart Allowance
and 2016, more than twice the rate of household and 138 available for those on Parenting Payments.
growth. There has also been considerable change in
the way that private rental properties are advertised For households on the minimum wage, greater
through major on-line portals, providing greater levels numbers of rental properties were affordable than
of information and giving greater reach to prospective for households reliant upon income support. Over
tenants (Hulse et al 2018). 5,000 properties (5,292) were affordable and
appropriate without placing households into rental
5.2 Overall Results by Household Type stress, particularly for couples with two minimum
wages. This figure was substantially more than in 2018
Once again, the Rental Affordability Snapshot
(3,089), reflecting the greater number of listings on the
highlights the shortage of low-cost private rental
Snapshot weekend in 2019 compared with 2018.
accommodation in Greater Sydney and the Illawarra
region. The implication of these results is that
Chart 3 shows the proportion of all rental listings in
households which are solely reliant on income support
Sydney and the Illawarra that were affordable and
payments will find it difficult to compete on equal terms
appropriate for households receiving income support
for a small pool of affordable private rental properties.
payments in the last five Snapshots. For the less-than-
These households may require additional assistance
30%-of-income band, the proportion of appropriate
in obtaining and maintaining a tenancy, whether this
and affordable properties remained at less than one
is through financial or material aid, developing a
percent during the period 2015-19. For households
rental history, learning how to negotiate the housing
in the 30-45%-of-income band, the proportion of
system, developing skills to be a good tenant, case
appropriate properties has increased, climbing to 12%
management and/or advocacy to real estate or
of listed properties.
government agencies. Table 10 shows the combined
results for Greater Sydney and the Illawarra for income
support households and minimum wage households in
the less-than-30%-of-income band and the 30-45%-of-
19Table 10: Combined Results for All Households in Greater Sydney and the Illawarra, March 2019 and March 2018
No. and % No. and % No. and % No. and %
affordable & appropriate affordable & appropriate
Results by Household Type
appropriate (at 30% - 45% appropriate (at 30% - 45%
(30% income) income) (30% income) income)
Income Support 2019 (total 23,921 properties advertised) 2018 (total 18,446 properties advertised)
Couple, 2 children
11 (less than 1%) 2,127 (9%) 11 (less than 1%) 1,104 (6%)
(Newstart Allowance)
Single, 2 children
1 (less than 1%) 750 (3%) 1 (less than 1%) 442 (2%)
(Parenting Payment Single)
Couple, no children
52 (less than 1%) 1,627 (7%) 48 (less than 1%) 1,004 (5%)
(Aged Pension)
Single, 1 child < 5 years
None (0%) 138 (less than 1%) None (0%) 85 (less than 1%)
(Parenting Payment Single)
Single, 1 child > 8 years
None (0%) 6 (less than 1%) None (0%) 7 (less than 1%)
(Newstart Allowance)
Single (Aged Pension) 7 (less than 1%) 188 (less than 1%) 6 (less than 1%) 165 (less than 1%)
Single (Disability Pension) None (0%) 69 (less than 1%) 2 (less than 1%) 62 (less than 1%)
Single (Newstart Allowance) None (0%) 7 (less than 1%) None (0%) 6 (less than 1%)
Single, 18+ years
None (0%) None (0%) None (0%) 1 (less than 1%)
(Youth Allowance)
Total unique properties 66 (5.3 Share Accommodation Table 11 shows that relatively few of these listings
At least 1,500 listings were identified on Gumtree would be affordable for single people on income
which would be affordable for a single person on the support. Single people on the Aged Pension had
minimum wage. Far fewer listings would be affordable the greatest proportion of such listings which were
for those on Newstart or Youth Allowance. This affordable (1%) and single people on Newstart or
number was higher than the 1,200 suitable listings the Youth Allowance had the least (0%). Higher
identified in the 2018 Snapshot for the same website. proportions of share accommodation would be
affordable for single people on the minimum wage
It was not possible to ascertain the equivalent number (5%), than for single people reliant on income support.
of accommodation listings on the flatmates.com.au
website. However, a sample of listings from 72 suburbs
was taken and appropriateness criteria applied.
Table 11: Share Accommodation: Greater Sydney and Illawarra
Results by Household Type Percent affordable Percent available
(No. of listings sampled = 1,787) (up to 30% of income) (at 30% - 45% income)
Income Support
Single (Aged Pension) 1% 17%
Single (Newstart Allowance) 0% 1%
Single, 18+ years (Youth Allowance) 0% 0%
Minimum Wage
Single, no children 5% 33%
Source: flatmates.com.au sample listings, 23-24 March 2019.
5.4 National Comparability to avoid double-counting of this region in the national
As mentioned in Section 2.1, Anglicare Australia has picture. The number of unique properties quoted in the
adopted the more stringent criterion of a 3 bedroom Anglicare Australia report for Sydney and the Illawarra
property being appropriate where there are 2 children, is shown in Table 12. It is clear that the adoption of the
resulting in a lower estimate of suitable properties more stringent 3 bedroom criterion results in far fewer
available for these households, compared with the listings being considered suitable for people on the
Anglicare Sydney report. However, the Sydney results minimum wage (1,628 properties) than the less stringent
quoted in the national report adhere to the Anglicare 2 bedroom criterion (4,832 properties).
Australia criteria, and also exclude the Central Coast,
Table 12: Unique Affordable and Appropriate Rental Listings as per the Anglicare Australia Report*
Income Support Minimum Wage
Total properties
Households Households
reviewed
(30% of income) (30% of income)
Greater Sydney (ex. Central Coast)
48 (less than 1%) 1,628 (7%) 22,911
and the Illawarra
* Assumes that families with two children would require a minimum of 3 bedrooms
With 2 bedrooms appropriate for families with 2 children:
The number of unique properties affordable and appropriate for people on income support is 54
The number of unique properties affordable and appropriate for people on minimum wage is 4,832
216. Breakdown of Results by Statistical Area
The Rental Snapshot also identifies the geographical 6.1 Income Support Households
distribution of affordable properties across Greater The Rental Affordability Snapshot is a point-in-time
Sydney and the Illawarra. Table 13 shows the number of study, so some degree of volatility is to be expected
affordable and appropriate properties for households when comparing annual results. However, the
on income support relative to the number of advertised clear message from Table 13 is that the number of
properties available for rent in each statistical area. The properties that were appropriate and affordable
number of properties is also compared with results from for households on income support has remained
previous Snapshots for each Statistical Area in Greater consistently low. In proportional terms, less than one
Sydney and the Illawarra region. percent of properties in Greater Sydney and about
one percent in the Illawarra region were affordable
Complete tables of results by household type for and appropriate for these households in 2019.
each statistical area are included in a separate
document entitled Rental Affordability Snapshot 2019:
Breakdown of Results by Statistical Area.
Table 13: Results for Statistical Areas in Greater Sydney and the Illawarra Region, Income Support Households
(2019, 2018 and 2017)
Statistical Area No. Affordable and Appropriate* Total Properties Advertised
2019 2018 2017 2019 2018 2017
Baulkham Hills and Hawkesbury 6 3 1 823 725 495
Blacktown 9 10 6 1,362 989 792
Central Coast 12 15 4 1,008 1,020 1,000
City and Inner South 1 0 3 2,523 1,821 1,441
Eastern Suburbs 0 0 0 1,920 1,409 1,153
Inner South West 2 0 2 2,067 1,486 1,112
Inner West 1 0 1 1,695 1,205 859
North Sydney and Hornsby 0 0 3 2,222 1,831 1,352
Northern Beaches 0 0 0 848 752 651
Outer South West 3 1 0 952 720 708
Outer West and Blue Mountains 4 5 1 1,273 1,049 832
Parramatta 4 4 4 2,637 1,995 1,561
Ryde 0 0 0 1,057 744 507
South West 8 3 0 1,625 1,184 837
Sutherland 0 0 0 641 465 317
Greater Sydney 50 41 25 22,653 17,395 13,617
Illawarra 8 5 0 839 742 563
Shoalhaven/Southern Highlands 8 11 5 429 309 267
Illawarra region 16 16 5 1,268 1,051 830
Combined results for Greater
66 57 30 23,921 18,446 14,447
Sydney and the Illawarra
* Total number of unique properties suitable for income support households at the less-than-30%-of-income band. Results for
families with two children based on a minimum of two bedrooms per property.
226.2 Minimum Wage Households Affordability still remains a critical issue for households
Table 14 shows the number and proportion of dependent on income support payments and a
affordable and appropriate properties in each challenge for minimum wage households. The continued
Statistical Area for households earning the minimum shortfall of dwellings in New South Wales and the
wage. Across Greater Sydney and the Illawarra, 17 shortfall in social housing dwellings mean that obtaining
percent of rental properties were deemed appropriate affordable housing is likely to remain a considerable
and affordable for minimum wage households (two challenge for Sydney’s poorest households. Housing
wage earners with two children), without them affordability will also remain a long-term challenge for the
entering into rental stress. In 2019, affordable Federal and State Governments, as the construction of
properties for minimum wage households as a additional dwellings and the introduction of new housing
proportion of all listings was higher than that found policies may take several years to bring about change. In
in the 2018 Snapshot, and more such properties the light of these Snapshot findings, and in view of the
available for rental compared with 2017. The largest broader issues on housing affordability, the next section
increases since 2018 in the number of suitable of this report makes recommendations with the aim of
properties for these households were in Parramatta creating a ‘safety net’ for the most disadvantaged people
(+348 properties), the South West (+350 properties), in our society, not just in social housing, but across
and Blacktown (+310 properties). private rental and home ownership.
Table 14: Results for Statistical Areas in Greater Sydney and the Illawarra Region, Minimum Wage Households
(2019, 2018 and 2017)
Statistical Area No. and % Affordable and Appropriate*
2019 2018 2017
Baulkham Hills and Hawkesbury 120 (15%) 64 (9%) 32 (6%)
Blacktown 670 (49%) 360 (36%) 242 (31%)
Central Coast 460 (46%) 404 (40%) 445 (45%)
City and Inner South 20 (1%) 6 (less than 1%) 4 (less than 1%)
Eastern Suburbs 19 (1%) 1 (less than 1%) 3 (less than 1%)
Inner South West 489 (24%) 247 (17%) 163 (15%)
Inner West 85 (5%) 22 (2%) 10 (1%)
North Sydney and Hornsby 36 (2%) 6 (less than 1%) 4 (less than 1%)
Northern Beaches 5 (1%) 1 (less than 1%) 0 (0%)
Outer South West 472 (50%) 307 (43%) 234 (33%)
Outer West and Blue Mountains 743 (58%) 466 (44%) 389 (47%)
Parramatta 713 (27%) 365 (18%) 185 (12%)
Ryde 139 (13%) 41 (6%) 15 (3%)
South West 750 (46%) 400 (34%) 224 (27%)
Sutherland 70 (11%) 19 (4%) 8 (3%)
Greater Sydney 4,791 (21%) 2,709 (16%) 1,958 (14%)
Illawarra 278 (33%) 233 (31%) 141 (25%)
Shoalhaven/Southern Highlands 223 (52%) 147 (48%) 129 (48%)
Illawarra region 501 (40%) 380 (36%) 270 (33%)
Combined results for Greater
5,292 (22%) 3,089 (17%) 2,228 (15%)
Sydney and the Illawarra
* Total number of unique properties suitable for Minimum Wage households at the less-than-30%-of-income band. Percent of
all available rental properties. 2+ bedroom results provided for families with 2 children.
23You can also read