Immigration and Preferences for Redistribution in Europe - IZA DP No. 12130 FEBRUARY 2019
←
→
Page content transcription
If your browser does not render page correctly, please read the page content below
DISCUSSION PAPER SERIES

IZA DP No. 12130

Immigration and Preferences for
Redistribution in Europe

Alberto Alesina
Elie Murard
Hillel Rapoport

FEBRUARY 2019
DISCUSSION PAPER SERIES

IZA DP No. 12130

Immigration and Preferences for
Redistribution in Europe

Alberto Alesina
Harvard University and IGIER Bocconi
Elie Murard
IZA
Hillel Rapoport
Paris School of Economics, Université Paris 1 Panthéon-Sorbonne, Institut Convergences
Migrations, CEPII and IZA

FEBRUARY 2019

Any opinions expressed in this paper are those of the author(s) and not those of IZA. Research published in this series may
include views on policy, but IZA takes no institutional policy positions. The IZA research network is committed to the IZA
Guiding Principles of Research Integrity.
The IZA Institute of Labor Economics is an independent economic research institute that conducts research in labor economics
and offers evidence-based policy advice on labor market issues. Supported by the Deutsche Post Foundation, IZA runs the
world’s largest network of economists, whose research aims to provide answers to the global labor market challenges of our
time. Our key objective is to build bridges between academic research, policymakers and society.
IZA Discussion Papers often represent preliminary work and are circulated to encourage discussion. Citation of such a paper
should account for its provisional character. A revised version may be available directly from the author.

                                                     ISSN: 2365-9793

                                           IZA – Institute of Labor Economics
Schaumburg-Lippe-Straße 5–9                      Phone: +49-228-3894-0
53113 Bonn, Germany                             Email: publications@iza.org                                    www.iza.org
IZA DP No. 12130 FEBRUARY 2019
ABSTRACT
Immigration and Preferences for
Redistribution in Europe*
We examine the relationship between immigration and attitudes toward redistribution using
a newly assembled data set of immigrant stocks for 140 regions of 16 Western European
countries. Exploiting within-country variations in the share of immigrants at the regional
level, we find that native respondents display lower support for redistribution when the
share of immigrants in their residence region is higher. This negative association is driven
by regions of countries with relatively large Welfare States and by respondents at the center
or at the right of the political spectrum. The effects are also stronger when immigrants
originate from Middle-Eastern countries, are less skilled than natives, and experience more
residential segregation. These results are unlikely to be driven by immigrants’ endogenous
location choices.
JEL Classification: D31, D64, I3, Z13
Keywords: income redistribution, population heterogeneity,
welfare systems, immigration
Corresponding author:
Elie Murard
IZA
Schaumburg-Lippe-Str. 5-9
53113 Bonn
Germany
E-mail: murard@iza.org
* We thank Francesc Ortega, Thomas Piketty, Claudia Senik, Ekaterina Zhuravskaya and Max Lobeck as well as
seminar participants at the Paris School of Economics, IZA, the 67th AFSE Conference and the 17th LAGV Conference
for helpful suggestions. Hillel Rapoport acknowledges support by a French government subsidy managed by the
Agence Nationale de la Recherche under the framework of the Investissements d’Avenir, programme reference ANR-
17-EURE-001. This paper follows and actually replaces a working paper entitled “Immigration and the Future of the
Welfare State in Europe” (Alesina, Harnoss and Rapoport PSE working paper #2018-04 ).1 Introduction
Private and public generosity (charity and welfare) travel more easily within the same ethnic
lines, nationality and religious affiliation.1 Alesina and Glaeser (2004) argue that one of the
reasons why the welfare state is more generous and expensive in Western Europe than in
the US is that European countries have been traditionally much more homogeneous than
the US, a country built by waves of relatively recent immigrants. However in the last two
decades immigration in Western Europe has substantially increased and has become (and
will remain for the foreseeable future) a major political issue. The question, then, is: does
immigration reduce support for redistributive policies in Europe? The answer provided by
this paper is ”yes”, but with important qualifications.
To answer the question, we assemble a unique data set of fully harmonized population
census/register data at the regional level for 140 regions in 16 different European countries
(in the years 2000 and 2010), which is then matched with attitudinal data from the biannual
2002-2016 rounds of the European Social Survey. We investigate the relationship between
immigration and natives’ attitudes to redistribution by exploiting within-country (i.e., re-
gional) variation in the share of immigrants, thus holding constant Welfare policies at the
national level. Our paper combines a large geographical coverage (sixteen different European
countries) with (i) immigration data at the regional level, and (ii) an empirical methodology
based on a rich set of fixed effects, which allows for addressing some of the endogeneity prob-
lems (e.g., welfare magnets) that have plagued previous multi-country descriptive studies.
We cannot hold constant welfare policies that vary at the local level, an issue which may
be of limited importance in some countries (e.g., France) but are more relevant in others
(e.g., Sweden or Germany). In any event, we analyze the robustness of our results to vari-
ous potential confounders such as the non-random location choices of immigrants (or to the
residential sorting of natives). The results are also robust to excluding Federal States where
welfare policies are largely set at the regional level, suggesting that they are not driven by
welfare magnet effects.
We first find that local (i.e., regional) exposure to immigrants in the residence region af-
fects natives’ perception of the number of immigrants at the national level and, therefore, also
1
See Alesina and Giuliano (2011) and Stichnoth and Van der Straeten (2013) for a survey on the literature
on redistributive policies, and Alesina and La Ferrara (2005) for a survey on the effect of social heterogeneity
on social capital and trust; see also Algan et al. (2016) for recent results.
2their perception about the identity (natives versus immigrants) of the potential beneficiaries
of the Welfare State. We then uncover that native respondents in our sample display lower
support for redistribution when the share of immigrants in their residence region is higher.
This attitudinal effect is sizeable in reltative terms, in comparison to the effect of individual
variables such as education or income that are important determinants of preferences for
redistribution (Alesina and Giuliano, 2011). For example, the anti-redistribution effect of a
one-quintile increase in the immigrants’ share is about half as large as the attudinal impact
of a one-quintile increase in household income.2
This average effect hides considerable heterogeneity along a number of dimensions: types
of receiving countries, natives’ individual characteristics, and immigrant types. The most
important dimension of the individual heterogeneity we uncover is political affiliation. The
anti-redistribution impact of immigration is almost entirely driven by individuals placing
themselves at the center or the right of the political spectrum, while the attitudes of leftist
individuals are barely affected. We also find that the reaction against redistribution is sig-
nificantly stronger among natives who hold negative views about immigrants or think that
immigrants should not be entitled to welfare benefits. We address the issue of the endo-
geneity of political affiliations to immigration by showing that it is statistically small and
by applying a bounds analysis to demonstrate that it is unlikely to affect our coefficient
estimates. Secondly, the attitudinal effect of immigration greatly depends on immigrants’
countries of origin and skills. Immigrants originating from the Middle-East (North-Africa
included) generate a larger anti-redistribution effect (about three times more negative) rela-
tive to other types of immigrants. We also uncover that immigrants’ skills, both in terms of
formal education and labor market occupation, shape natives’ attitudinal reaction: a higher
proportion of more skilled immigrants (relative to natives) tends to significantly mitigate the
anti-redistribution effect of immigration. Thirdly, the negative association between immi-
gration and support for redistribution is significantly stronger in destination countries with
more generous Welfare States (e.g., Nordic countries and France) relative to countries with
smaller Welfare States (e.g., the UK or Ireland).
The attitudinal response to immigration is also more pronounced among less educated
2
More specifically, a one standard-deviation increase in the log share of immigrants reduces natives’
support for redistribution by 6.2% of the standard-deviation of attitudes. We cannot compare this effect
with the impact of a one standard deviations increase in household income because the income variable is
not continuous (but, rather, categorical) in the ESS data.
3individuals and among members of the middle and upper class. Furthermore, natives’ reac-
tion against redistribution appears to be driven by both the recent cohorts of immigrants
arrived in the last decade (2000-2010) and by earlier cohorts arrived before 1990. Finally,
we uncover that, for a given share of immigrants in a region, a higher residential segrega-
tion of immigrants is significantly associated with a further reduction in the support for
redistribution.
Our paper relates to the literature on population diversity and demand for redistribution.
Beliefs about who is a worthy recipient of public generosity correlate with race, especially
in the United States. Many studies find that the white American majority is much less
supportive of redistribution than members of minority groups (holding income constant) –
see Alesina and La Ferrara (2005) for a survey. Using individual data for the U.S., Luttmer
(2001) shows evidence for “group loyalty effects”, namely that support for redistribution in-
creases if members of the respondent’s own ethnic group are over-represented among welfare
recipients. Using experimental data, Fong and Luttmer (2009) study the role of racial group
loyalty on generosity, measured by charitable giving in a dictator game (where respondents
choose how to divide $100 between between themselves and a charity dedicated to Hurri-
cane Katrina victims), and find that racial discrimination in giving importantly depends on
subjective racial identification (how close one feels to one’s own racial group). With more
specific reference to immigration, Tabellini (2018) looks at the Great Migration in the US
in the first part of the last century and shows results consistent with those of the present
paper, namely that natives became less favorable to social policies in cities which received
more immigrants (and more so when immigrants were culturally or religiously further away
from the natives). These effects hold despite the economic benefits brought about by the
immigrants.
Turning more specifically to Europe, Dahlberg et al. (2012) analyze changes in natives’
attitudes to redistribution resulting from the arrival of refugees in Sweden in the late 1980s
and early 1990s and find a strong negative effect, especially among high-income earners.
They take advantage of the existence between 1985 and 1994 of a “refugee placement pro-
gram” which allocates refugees to municipalities in Sweden, essentially without refugees
having a say as to where they can be placed; hence, they thereby solve the problem of
endogenous immigrants’ location choice. Indeed, one difficulty when analyzing the conse-
quences of immigration on welfare policies is that immigrants (especially the poorest) may
4be attracted to so called ”welfare magnets”. Boeri (2010) and Borjas (1999) find evidence
of such welfare magnet effects respectively in the context of the US and in the context of
Western Europe (see also Razin and Wahba, 2015). How this effect may bias the results
for attitudes to redistribution is not obvious: immigrants may indeed flow to countries or
regions with more generous welfare systems, however these are precisely the countries in
which individuals tend to be more favorable towards redistribution, so that the direction of
the bias is unclear. This is addressed in our analysis, at least partly, by focusing on within-
country (i.e., regional) variation in immigrants’ shares. Senik et al. (2009) use the European
Social Survey to analyze the role of individual characteristics (especially attitudes toward
immigration) in determining attitudes to redistribution in response to increased perceived
immigration. There is also a large, mostly descriptive political science literature (see, e.g.,
Burgoon et al., 2012; Burgoon, 2014) that stresses the role of occupational exposure to im-
migration and of immigrants’ integration, respectively. Finally, Alesina et al. (2018) perform
an original survey on six countries (the US and five major Western European countries: the
UK, Sweden, Germany, Italy and France) and show two sets of results. First, natives are
vastly misinformed about immigrants, regarding their number, country of origin, education
level and reliance on the welfare state. Second, there is a strong correlation between natives’
beliefs about immigrants and their preferences for redistribution. They also find, as we do,
that this relationship is stronger for self-reported right-wing respondents.
This paper is organized as follows. The next section describes in detail the novel data set
we assemble. Section 3 presents our empirical strategy. Section 4 describes our main results,
robustness checks, and the heterogeneity analysis. The last section concludes.
2 Data
We construct a novel data set on the stocks of immigrants at the regional level for a total
of 140 regions in 16 Western European countries. While there have been several efforts to
compile global bilateral immigrant stocks across countries (e.g. Docquier et al., 2009; Özden
et al., 2011), we provide a new data set of immigrant population by origin country and by
educational level in each region (NUTS) of Europe by harmonizing population censuses and
registers in the years 1991, 2001 and 2011. We then combine this data set with individual
attitudinal data drawn from the European Social Survey across more than 140 regions in
5western Europe.
2.1 Stock of immigrants at the regional level
2.1.1 Primary sources of data
We draw on population census and register data, from the 1991, 2001 and 2011 rounds – see
Table A.11 in the appendix. Census data were used for 10 countries: Austria, Belgium, Ire-
land, Italy, France, Greece, Portugal, Spain, Switzerland, and the United Kingdom. These
data were either provided by the national statistical offices or taken from IPUMS Inter-
national.3 For countries not taking periodic censuses but keeping population registers, we
extracted data from those registers.4 In order to obtain immigrants stock data by educational
level, we sometime rely on the European Labor Force Survey (due to the lack of suitable
census data) – see Table A.12 in the appendix.5
We compile the immigrant stock data in the regions of residence of the 16 European
countries we cover by using the NUTS geocode standard for referencing the subdivisions of
countries. The NUTS standard defines minimum and maximum population thresholds for
the size of the NUTS regions: between 3 and 7 millions for NUTS1 units, between 800,000
and 2 millions for NUTS2 units, and between 150,000 and 800,000 for NUTS3 units. NUTS
regions are generally based on existing national administrative subdivisions.6
Definition of migrants Official records usually apply two different definitions as to what
constitutes a migrant: either being born in a foreign country, or being a citizen of a foreign
country. When harmonizing the data, we gave priority to the definition based on country
of birth. Birthplace data is available from most of the primary sources, expect for the
3
For the UK, the census data we used (as provided by the ONS) does not cover Scotland nor Northern
Ireland. Those two countries run separately their own census which we could not have access to.
4
This is the case for 6 countries: Denmark, Finland, Germany, Norway, the Netherlands and Sweden.
5
We use the European Labor Force Survey (ELFS) instead of population censuses in three countries:
Belgium, Switzerland and Germany. In Belgium and Switzerland, we chose not to rely on census data
because of the high share of foreign-born with unknown level of education. In Germany, the census does not
report the birthplace, only the Labor Force Survey does.
6
For example in mainland France, NUTS1 mirrors the 9 French areas ”Zones d’etudes et d’amenagement
du territoire ” while the NUTS2 corresponds to the 22 French ”Regions” and NUTS3 to the 96 French
”Departements”.
61991 rounds of the Austrian and Greek censuses, as well as for the 1991 and 2001 rounds
of the German registers. In order to have a consistent definition of immigrants over time
that is comparable across countries, we had to impute the number of foreign-born in the
few instances in which data are missing. We follow the approach of Brücker et al. (2013)
by using the ratio between foreign citizens and foreign-born in year t in order to infer the
7
number of foreign born in the previous years t − 10 or t − 20.
Countries of origin Following the end of the cold war, many countries redrew their
political boundaries. The coding of birthplace data, which varies from one population census
to another, often only reports the original territory as it existed before the split into newly
constituted countries. For example, in many censuses of the 16 European countries, Serbia,
Croatia or Bosnia are aggregated under the name of the former Yugoslavia. We treated
as a single entity the countries that belonged to each of the following territory: the former
Yugoslavia, the former Czechoslovakia, the Netherlands Antilles, the Channel Islands, Sudan
and South Sudan, Indonesia and East Timor. With respect to the ex-USSR, we choose to
impute (when not known) the number of immigrants originating from the individual countries
that comprise that area as follows: observing the total number of migrants from USSR in a
given destination region, we allocated these migrants to each individual countries by using
the IAB brain-drain database Brücker et al. (2013) which provides, at the national level,
7
In practice we impute the number N
br,o,t of foreign-born from origin country o living in region r at time
t by using the observed number of foreign citizen Cr,o,t in the same year, region and coming from the same
origin country:
br,o,t = ro,t+10 ∗ Cr,o,t
N
No,t+10
with ro,t+10 = Co,t+10 the ratio at time t + 10 between national-level number of foreign-born and foreign-
citizen from origin o and living in the same destination country of region r. For Austria and Greece, we
impute the number of foreign-born in 1991 by using the ratio between foreign-born and foreign-citizen in 2001.
For Germany, we impute the number of foreign-born in 1991 and 2001 by using the ratio in 2011. In order
to assess the precision of such imputation, we predicted the number of foreign-born in Austria and Greece
in 2000 following the same approach (i.e., using the 2011 ratio between foreign-born and foreign-citizen) and
compared the imputed 2000 values and the observed 2000 values of foreign-born by origin country and region
of residence. In both Austria and Greece, we obtained a coefficient of correlation above 0.97 between the
observed and the imputed values. For Germany, we checked how the 2000 imputed values by origin countries
correlate with the DIOC data 2000 values at the national level (Docquier and Marfouk, 2006). Considering
only origin countries with positive DIOC numbers of migrants, we obtained a coefficient of correlation above
0.96 – and in particular a similar number of migrants from the ex-USSR, the so-called ethnic Germans.
7the number of immigrants by individual origin.8 After harmonization, we have 217 different
countries of origin in 1991, 2001 and 2011. The share of the population for whom the place
of birth is missing or too imprecise is below 1% for most receiving countries and not higher
than 4% for two countries (the UK and Switzerland).
Education data We distinguish three levels of education using the International Stan-
dard Classification of Education: primary (ISCED 0/1/2, i.e. lower secondary, primary and
no schooling); secondary (ISCED 3/4 : high-school leaving certificate or equivalent) and
tertiary education (ISCED 5A/5B/6 or higher).
2.1.2 Other sources of data at the regional level
Occupation data We use the 2011 Census database of Eurostat that harmonises statis-
tical definitions and classifications in order to ensure the comparability of population census
data across different countries. This database gives information on the 2011 population struc-
ture at the NUTS regional level. In particular, we use data on the number of foreign-born
and native workers in various occupations, categorized by the ISCO 1-digit classification.
This occupational data is available for every country used in the analysis expect for Austria,
Belgium and France.9
Segregation data We also draw on a dataset providing the distribution of the immigrant
population at a very high spatial resolution in order to measure the residential segregation
of immigrants within NUTS regions of Europe. This dataset has been assembled by the
Joint Research Centre (JRC) of the European Commission that harmonized 2011 population
censuses in 8 different countries: France, Germany, Ireland, Italy, Netherlands, Portugal,
Spain and UK. The ensuing data is a uniform grid giving the numbers of immigrants in cells
of 100 by 100 meters in each of these 8 European countries. The primary source of data is the
population at the census tract level. However, the geographical resolution and geometries
8
For example, for a given year and destination region, we impute the number of Ukrainian migrants by
multiplying the number of migrants from the USSR in the same year and destination region with the share
of Ukrainians among all USSR migrants in the same year and destination country, as provided by the IAB
dataset.
9
For details, see https://ec.europa.eu/eurostat/web/population-and-housing-census/census-data/2011-
census
8of census sampling units are extremely variable across European countries. In the case of
the Netherlands, sampling areas are at the postal code level (groups of buildings including
around 25 households). Other countries report data at higher resolution (from 0.01 to 1.7
square km) using census sampling areas with a regular grid (Germany) or polygons with
variable shapes and sizes. These differences in geometries and resolution were harmonized
through the dasymmetric mapping method.10 We aggregate this data at the regional level
by constructing an index of immigrants’ spatial segregation within each NUTS region. We
will explain the construction of this index in the results section 4.3.4.
2.2 Individual attitudinal data
Data on individual attitudes towards redistribution are from the European Social Survey
(ESS), which contains information on a wide range of socioeconomic and political values for
individuals in 28 European countries. The data are available for seven biannual survey waves
starting in 2002 and have been widely used.11 We measure preferences towards redistribution
by relying on answers to the statement “The government should take measures to reduce
differences in income levels ”. We use a 5-point scale variable V1 that measures the extent
to which the respondent agrees with the previous statement: agrees strongly (5), agrees (4),
neither agrees nor disagrees (3), disagrees (2), disagrees strongly (1).
We also use the 2008 and 2016 rounds of the ESS that include a rich set of specific
questions on attitudes towards Welfare. In particular, respondents are asked to what extent
they agree that “For a society to be fair, differences in people’s standard of living should
be small ” (V2 ). Respondents also report how much responsibility they think governments
should have to ensure a reasonable standard of living for the old (V3 ), the unemployed (V4 ), as
well as to ensure sufficient child care services for working parents (V5 ). Finally, respondents
report their views on social benefits, and in particular the extent to which they agree with
10
This method me redistributes the population (by origin country) from the original census areas to
a regular grid at 100 m resolution. The method allocates higher shares of the total population to cells
characterized by a higher surface occupied by buildings and with an urban land cover classification, as
compared to cells occupied, for example, by green areas or with an agricultural land.For details, see
https://bluehub.jrc.ec.europa.eu/datachallenge/data
11
For preferences towards redistribution see Burgoon et al. (2012); Finseraas (2008); Luttmer and Singhal
(2011); Senik et al. (2009). For views about immigration see Card et al. (2005) and Ortega and Polavieja
(2012).
9the following three statements: “social benefits place too great strain on economy ” (V6 ),
“social benefits cost businesses too much in taxes and charges ” (V7 ), “social benefits make
people lazy ” (V8 ).
Table 1 shows that, somewhat surprisingly, these eight different variables are not as
strongly correlated as one may expect, with coefficients of correlation below 0.5 (variables
have been recoded in such a way that a higher value corresponds to stronger support for Wel-
fare and redistribution). We construct a composite index of attitudes as the first component
of a Principal Component Analysis of these eight variables.12
In the analysis of the effect of immigration on attitudes towards redistribution, we use
both this overall index of Welfare attitudes and the support for reduction in income differ-
ences (V1 ) as dependent variables. The advantage of the index is to combine the diverse
facets of Welfare attitudes into one single indicator instead of relying on only one dimension.
The advantage of the attitudinal outcome V1 is to be available for every round of the ESS
while the index can only be constructed in the 2008 and 2016 rounds. Finally, we stan-
dardize these two dependent variables (Z-score formula) in order to make the results more
comparable (i.e., variables are rescaled to have a mean of 0 and a standard deviation of 1).
Table 1: Cross-correlations of Welfare attitudes
Variables V1 V2 V3 V4 V5 V6 V7 V8
V1 : Favors reduction in income differences 1.00
V2 : Favors small differences in standard of living for a fair society 0.41 1.00
V3 : Favors government responsibility for the standard of living for the old 0.22 0.20 1.00
V4 : Favors government responsibility for the standard of living of the unemployed 0.24 0.24 0.48 1.00
V5 : Favors government responsibility for child care services 0.19 0.17 0.43 0.42 1.00
V6 : Disagrees that social benefits place too great strain on economy 0.08 0.07 0.09 0.19 0.11 1.00
V7 : Disagrees that social benefits cost businesses too much 0.08 0.07 0.05 0.17 0.08 0.44 1.00
V8 :Disagrees that social benefits make people lazy 0.11 0.11 0.08 0.27 0.12 0.38 0.36 1.00
2.3 Matched data on attitudes and immigrant stocks
The ESS provides relatively precise information on the place of residence of the respondents:
at the regional NUTS2 level for most countries expect for Belgium, France, Germany and the
UK for which only larger NUTS 1 regions are available. In Ireland, smaller NUTS 3 region
are available. In few instances the coding of the place of residence in the ESS data does
12
The weights obtained by the PCA are very similar for each of the height different variables
10not fully coincide with the NUTS classification or is sometimes inconsistent across different
survey rounds. To address this issue, in some instances we aggregate different NUTS regions
into one larger unit.13 Moreover, three NUTS regions are not covered by the ESS survey,
and four regions are extremely poorly covered, and were therefore excluded them from the
analysis.14
Once these small adjustments are made, we can combine the ESS attitudinal survey
with the immigrant stock data across 148 different regions of residence – either NUTS2 or
NUTS1 – in the 16 European countries we cover over the period 2002-2016. Table A.13 in
the Appendix provides the exhaustive list of the regions included in the analysis. We match
each ESS round in a given decade to the immigrant stock data at the beginning of the same
decade. We thus merge all biannual ESS rounds from 2002 to 2008 with the 2000 immigrant
stocks, and all biannual ESS rounds from 2010 to 2016 with the 2010 immigrant stocks.
2.3.1 Sample
Since we are interested in the effect of immigration on natives’ support for redistribution,
we restrict the ESS sample to native-born individuals, i.e. born in their current European
country of residence. We consider only respondents with both non-missing data on attitudes
towards redistribution (variable V1 ) and non-missing data on individual characteristics. Pool-
ing all biannual ESS rounds from 2002 to 2016, we obtain a repeated cross-section of 134,033
15
individuals without missing information. In the estimation sample there are on average
905 individual observations by region, with a minimum of 33 in the Italian region of Liguria
(ITC3) and a maximum of 6200 in the Belgium Flemish region (BE2). When using the
composite index of Welfare attitudes, we obtain an estimation sample of 31,223 individual
13
The northwestern region of Switzerland with Zurich (CH03-CH04), the Southern part of Finland with
Helsinki (FI1B-FI1C), and the Trentino province with the Bolzano province in Italy (ITH1-ITH2)
14
This is the case of the regions of Ceuta and Melilla in Spain (with only 30 and 15 respondents in
the entire 2002-2016 period), the Acores and Madeira in Portugal (not covered), Aland in Finland (with
44 respondents), Molise (not covered) and the Valle d’Aosta (with 38 respondents) in Italy. In the other
regions, the number of respondents is typically around 1500, and always greater than 100.
15
This sample represents 66% of the initial sample because it keeps observations where all control vari-
ables are jointly non-missing. We checked that this restricted sample does not differ substantially from the
initial sample in terms of attitudes, political preferences and socio-demographics: We obtain standardized
differences (Rosenbaum and Rubin, 1985) always lower than 7%, which indicates that there are no important
imbalances between the two sample.
11observations in the 2008 and 2016 rounds of the ESS.
2.4 Descriptive Statistics
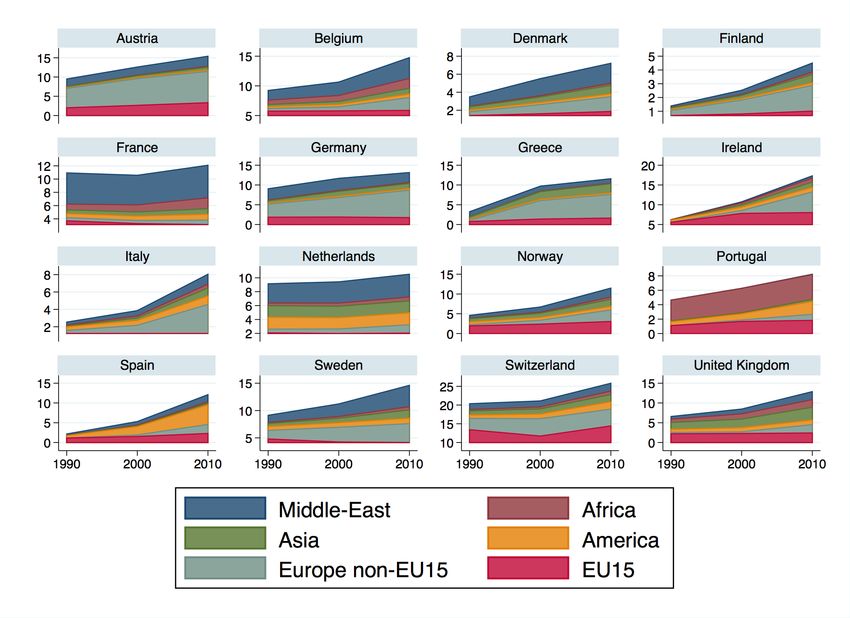
Immigrants in Europe Over the last decades, immigration has increased in every Euro-
pean country, and has dramatically accelerated since the early 2000s, particularly in Spain,
Italy and Ireland (see Figure A.1 in the Appendix). This increase is due to a inflow of im-
migrants coming from countries outside of the EU15, and mainly from Central and Eastern
Europe, the Middle East, and South America (see Figure A.2 in the Appendix). As shown
by Figure 1, the population share of immigrants in 2010 is very heterogenous across coun-
tries, but also across regions within the same country. For example, northern regions of Italy
host much more immigrants than southern regions, which is also true for western regions of
Germany relative to eastern regions.
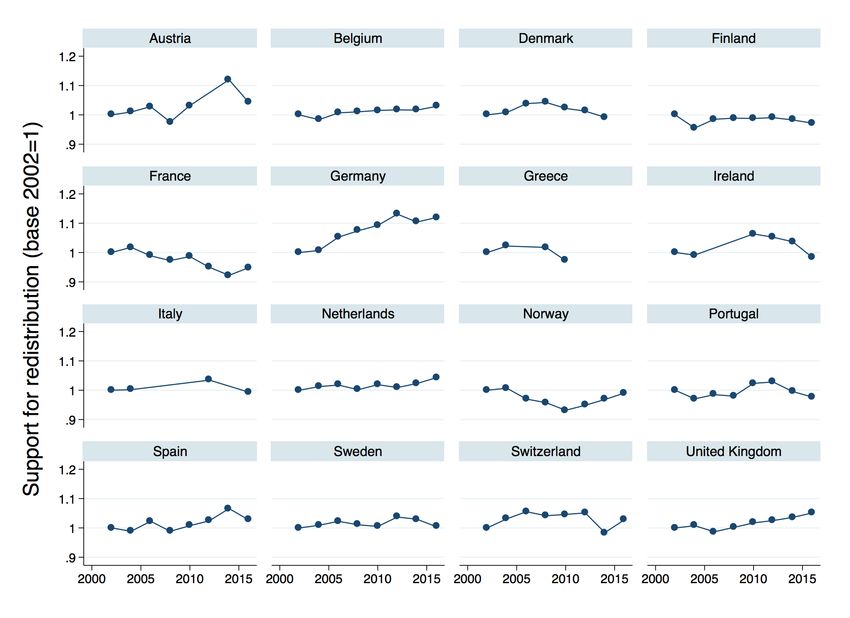
Preferences for redistribution The average support for reduction in income differences
(variable V1 ) is also heterogeneous across European countries, with higher support in Greece
and France relative to Denmark and Germany (Figure A.3). Preferences for redistribution
have been very stable over the last decades, as the Figure A.4 shows in the Appendix.
Between 2002 and 2016 the average support for redistribution has varied by at most 10%
relative to its initial level, and this is true for every European country. How attitudes
towards redistribution would have looked liked in the absence of immigration remains an
open question. In order to estimate the no-immigration counterfactual, we will exploit
sources of variation in individual attitudes across regions within the same country. Indeed,
Figure 2 shows that there is a significant within-country variability in the average support
for redistribution: for example, there is lower support for redistribution in western regions of
Germany relative to eastern regions, as well as in the North of Italy relative to the South.16
16
A variance-decomposition analysis reveals that, at the regional level, 35% of the variation in attitudes is
due to within-country variation. On differences between Western and Eastern parts of Germany, see Alesina
and Fuchs-Schündeln (2007)
12Figure 1: Population share of immigrants in 2010 at the regional level
Share of immigrants in 2010
0.024 - 0.04
0.04 - 0.06
0.06 - 0.08
0.08 - 0.10
0.10 - 0.15
0.15 - 0.20
0.20 - 0.30
0.30 - 0.424
Country borders
3 Empirical strategy
3.1 Specification
We estimate the following linear regression for native-born individual i, living in region n of
country c at survey round t:
yinct = M ignt β + Xit α + Znt λ + δct + int (1)
where yint is individual i’ s support for redistribution as described in the data section.
M ignt is the share of immigrants (i.e. foreign born) in the population of region n at the
beginning of the decade of year t. Given the skewness of the distribution of the share of
foreign-born, we use the logarithm of the population share in the empirical estimation.17
The regression includes country-year fixed effect δct . The vector Znt includes controls at the
17
The results remain robust when using a quadratic specification. Details are available from the authors.
13Figure 2: Average support for reduction in income differences at the regional level
Average support for redistribution [1,5]
2.97 - 3.10
3.10 - 3.24
3.24 - 3.38
3.38 - 3.52
3.52 - 3.66
3.66 - 3.80
3.80 - 3.94
3.94 - 4.08
4.08 - 4.22
4.22 - 4.36
4.36 - 4.50
4.50 - 4.64
Country borders
regional level such as the native population (log), GDP per capita (log), unemployment rate,
and the share of tertiary educated among the native population. The vector Xit controls
for individual socio-demographic characteristics, such as the respondent’s gender, age, ed-
ucation, main activity during the week before the interview, the size of his/her household,
parental education and immigration background, as well as usual place of residence. We
test the sensitivity of the results to the inclusion of a richer set of individual controls related
either to the individual’s income and social class18 or to the individual’s political views and
ideology.19 We cluster standard errors at the region-by-year level to account for possible
18
Current or former occupation (2-digits isco88 categories), household income quintile, and self-assessed
standard of living.
19
Self-declared placement on a left-right political scale, opinions about whether people should be treated
equally and have equal opportunities, opinions about the importance of helping people and caring for others
well-being, and views about whether most people try to take advantage of you, or try to be fair.
14correlation of the individual-level residuals int within the same region and year.
The specification we propose exploits cross-sectional variations in the immigrants’ share
across regions within the same country. In theory we could effectively include a set of
region fixed effects in order to control for time-invariant heterogeneity at the regional level.
However, we face data constraints that precludes us from exploiting variation over time
in individual attitudes. The ESS is a repeated cross-section of individual interviews, not
a longitudinal survey. Furthermore, the ESS is not representative at the regional level,
but only at the country level. This lack of representativeness results in that the regional
average of individual attitudes cannot be compared over time (i.e., from one survey rounds
to another) in a meaningful way, because the pool of respondents varies and is not sampled
in a representative way. Also, as previously documented, attitudes appear quite persistent
over time (at the country level). This suggests that a cross-sectional empirical specification
might be more appropriate to capture the long to medium-run effect of immigration, relative
to a Diff-in-Diff regression exploiting short-term variations in attitudes.
3.2 Endogeneity
In cross-country studies about immigration and redistribution, a key endogeneity question is
the self-selection of immigrants, the ”welfare magnet” issue. It is possible that immigrants
self-select in places with more generous welfare policies, although it is not a priori obvious
whether this would imply that preferences for redistribution change more drastically in these
places. On the one hand, in places with more generous welfare polices poorer immigrants
”cost” (or are perceived to cost) more to the natives, on the other hand the natives must be in
principle more favorable to the welfare state by reveled preferences. As already emphasized,
the unit of observation in this study is the region; hence, the country-year fixed effects control
for country-level heterogeneity and hold constant welfare policies set at the national level.
However, immigrants are not randomly distributed across regions within the same country.
Thus, it could still be that immigrants are attracted by regions offering relatively more
generous social services (e.g., social housing), even within the same country. In order to
address the issue of potential regional welfare magnets, we exclude Federal countries where
regions have more autonomy to set welfare policies locally. Immigrants may also reside
in relatively poorer regions (e.g. due to constraints on the housing market), where people
have higher (or lower) preferences for redistribution. To test this, we include the share of
15households in or at risk of poverty at the regional level. We find that the results are robust
to the inclusion of these potential confounders.
An additional concern is that immigrants may self-select into regions with higher eco-
nomic growth and higher prospect for upward income mobility. Since people have lower
support for redistribution when the prospects for upward mobility are higher, this could gen-
erate a negative correlation between support for redistribution and share of immigrants.20
We address this concern by: (i) controlling for long-run regional GDP growth between the
1960s and 2000 (ii) controlling for negative trade shocks and industrial decline over the last
two decades (iii) excluding capital regions, and (iv) using the share of immigrants in 1990
(instead of 2000 and 2010) as main regressor.
Finally we consider the residential choice of the native population, which can be driven
by attitudes toward immigrants. For example, native individuals that are intolerant towards
ethnic minorities are unlikely to choose to live in areas with large immigrant populations.
To the extent that racially intolerant natives tend to have a lower support for redistribution
(as is observed in the ESS survey), this type of residential sorting would yield an upward
bias in any correlation between immigrants’ share and attitudinal support for redistribution.
Given that we find a negative association between immigration and support for distribution
(see next section), this type of bias is not a concern a priori since it plays against us. In
any case, the NUTS regions used in the analysis are very large spatial areas, with typically
around 1.5 millions inhabitants, and always more than 200,000 inhabitants. As Dustmann
and Preston (2001) argues, the ethnic composition of such large areas may be regarded as
beyond the control of individuals whose mobility is likely to be geographically limited.
4 Results
4.1 Main findings
We begin by establishing that the natives’ perception of the number of immigrants in their
country (at the national level) is affected by the share of immigrants in their residence
region. Table 2 shows that a one percentage-point increase in the regional immigration
share is associated with a 0.3 percentage-point increase in the perceived national share of
20
For recent evidence on the relationship ship between perceptions of social mobility and preferences far
redistribution see Alesina, Stantcheva and Teso (2018)
16immigrants. This suggests that the natives’ perception of the identity of potential welfare
recipients (native or non-native) is determined by what they observe locally, i.e. by the local
composition of the population.
Table 2: Perceived share of immigrants in the country and actual share in the residence
region
Dep var : “Of every 100 people in the country how many
are foreign-born?”
Share of immigrants 0.196*** 0.325*** 0.307*** 0.310*** 0.304***
(0.039) (0.050) (0.046) (0.045) (0.044)
R2 0.14 0.14 0.21 0.22 0.24
N 32,358 32,358 32,358 32,358 32,358
Country-year FE X X X X X
Regional control X X X X
Basic Individual-controls X X X
Income controls X X
Ideology controls X
Note: The dependent variable is the answer to the question: “Out of every 100 people living
in the country, how many do you think were born outside the country?”, available only in
the 2002 and 2016 rounds of the European Social Survey. Regional controls include: native
population (log), GDP per capita (log), unemployment rate, share of tertiary educated among
the native population. Individual controls include: year of birth*sex , sex*education, household
composition, employment status (unemployed, self-employed, retired..), education of parents and
country of birth of parents, type of respondent’s domicile (big city, suburbs, small town, village).
Individual income controls include: current or former occupation (isco88 2 digits), household
income quintile in the country, and feeling about current household’s income. Ideology controls
include: Placement on left right scale, opinions about whether people should be treated equally
and have equal opportunities, opinions about the importance to help people and care for others
well-being, opinions about whether Most people try to take advantage of you, or try to be fair.
Standard errors are clustered at the NUTS- year level. *** ptrols (column 2), individual socio-demographics (column 3), income and occupation controls
(column 4), and proxies for altruism, aversion for inequality and sense of fairness (column
5). We estimate very similar effects for both measures of preferences for redistribution, i.e.
the index of welfare attitudes that we constructed and the support for reducing income dif-
ferences. When the full list of controls is included in column 5 of Table 3 , we obtain a highly
statistically significant coefficient of -0.10, which suggests that a one standard-deviation in-
crease in the log share of immigrants (0.62) reduces natives’ support for redistribution by
6.2% of the standard-deviation of attitudes. In order to get some sense of the relative size
of this effect, note that an increase in income by one quintile implies a decrease of 8% of
the standard deviation of preferences for redistribution. The anti-redistribution effect of a
one-quintile increase in the immigrants’ share (i.e., 0.42) is thus about 50% as large as a one-
quintile increase in household income. We cannot compare the effect of immigration with the
impact of a one standard deviation increase in household income because the income variable
is not continuous but rather categorical in the ESS data. Also, note that, by construction
the share of immigrants at the regional level can only explain variation in attitudes across
and not within regions. We could thus also compare the effects of immigration to the typical
cross-regional variation in attitudes, rather than to the overall variation: a one-standard-
deviation increase in the share of immigrants lowers preferences for redistribution by about
20% of the cross-regional standard-deviation of natives’ attitudes.
4.2 Robustness
Table 4 tests the robustness of the results to various issues discussed in section 3.2. Table
4 shows that, relative to the baseline specification (column 1), results remain unchanged
when we use the share of immigrants in 1990 (instead of 2000 and 2010) as main regressor
(column 2). Also, we obtain similar estimates when we: (i) control for long-run regional
GDP growth between the 1960s and 2000 (columns 5 and 6), (ii) include a region-specific
exposure to Chinese import shocks (column 7) or the share of the manufacturing sector in
the early 1990s (column 8), (iii) exclude capital regions (column 4), and (iv) exclude Federal
countries that have more autonomy to set welfare policies at the regional level (column 3).
The robustness of the results holds for both dependent variables (Panel A and Panel B). Only
the inclusion of the regional poverty rate (column 9) generates a smaller and insignificant
estimate of the effect of immigration, but only when the index of welfare attitudes is used
18Table 3: Immigration and Attitudes towards Redistribution: Average Effect
Dep var. : Index of welfare attitudes
Share immigrants (log) -0.060** -0.108*** -0.116*** -0.110*** -0.104***
(0.028) (0.033) (0.032) (0.033) (0.030)
R2 0.10 0.11 0.13 0.15 0.28
N 31,223 31,223 31,223 31,223 31,223
Dep var. : Support for reduction in income differences
Share immigrants (log) -0.153*** -0.127*** -0.121*** -0.116*** -0.101***
(0.020) (0.023) (0.023) (0.021) (0.017)
R2 0.09 0.10 0.13 0.15 0.22
N 134,033 134,033 134,033 134,033 134,033
Country-year FE X X X X X
Regional control X X X X
Basic Indiv-controls X X X
Income controls X X
Ideology controls X
Note: The dependent variable Index of welfare attitudes is constructed as the first compo-
nent of a principal component analysis using height attitudinal variable (see Data section),
and is available only in the 2008 and 2016 rounds of the ESS. The dependent variable Sup-
port for reduction in income differences uses answers to the question as to whether “The
government should take measures to reduce differences in income levels”. All dependent
variable are standardized (Z-score formula). Regional controls include: native population
(log), GDP per capita (log), unemployment rate, share of tertiary educated among the na-
tive population. Individual Controls include: year of birth*sex , sex*education, household
composition, employment status (unemployed, self-employed, retired..), education of par-
ents and country of birth of parents, type of respondent’s domicile (big city, suburbs, small
town, village). Individual income controls include: current or former occupation (isco88
2 digits), household income quintile in the country, and feeling about current household’s
income. Ideology controls include: Placement on left right scale, opinions about whether
people should be treated equally and have equal opportunities, opinions about the impor-
tance to help people and care for others well-being, opinions about whether Most people
try to take advantage of you, or try to be fair. Standard errors are clustered at the NUTS-
year level. *** pas outcome (Panel A).
4.2.1 Placebos
Finally, we run placebos test in Table A.1 of the Appendix, using three attitudinal dependent
variables that should not, in principle, be affected by immigration: attitudes towards the
environment, opinions about traditions and customs, and views on whether it is important
to seek fun and things that give pleasure in life. As already mentioned, we find no statistical
significant correlations for these outcomes.
4.3 Heterogeneity
We now explore various heterogeneity aspects of our main results.
4.3.1 Receiving countries
Table 5 examines the heterogeneity of the attitudinal effect of immigration depending on
the generosity of the national Welfare State. We define the binary variable High Welfare
State that equals one when the country’s GDP share of welfare spending (social protection,
health and education) is higher than the sample median and include its interaction with the
share of immigrants in the regression.21 The inclusion of country-year fixed effects absorbs
the direct effect of living in a High Welfare State on attitudes towards redistribution. We
find that the negative association between immigration and support for redistribution is
significantly stronger in receiving countries with relatively more generous Welfare States
(e.g., Nordic countries and France) relative to countries with smaller Welfare State (e.g.,
the UK or Ireland). Among the latter, the attitudinal effect of immigration becomes much
less significant. Table A.2 in the Appendix shows that these results are very robust to the
different potential confounders that we mentioned previously.
21
Government expenditures are drawn from COFOG Eurostat data and are averaged over the 1998-2004
period. Welfare spending is defined as the sum of expenditures in social protection (social transfers, safety
net and aid, social housing, etc.), in health and education. See Table A.7 for details
20Table 4: Robustness Checks: Average Effect
Baseline Immigrants Excluding Long-term growth De-industrialization Regional
in 1990 Federation Capitals Poverty
(1) (2) (3) (4) (5) (6) (7) (8) (9)
Panel A Dep var. : Index of welfare attitudes (pca, 2008 and 2016 rounds)
Share immigrants (log) -0.116*** -0.086** -0.127*** -0.089* -0.124** -0.122*** -0.127*** -0.050
(0.032) (0.043) (0.033) (0.048) (0.051) (0.032) (0.032) (0.032)
Share immigrants in 1990 (log) -0.099***
(0.027)
yearly GDP growth from 1980-85 to 2000 0.059
(0.390)
yearly GDP growth from 1965-70 to 2000 1.192
(3.336)
Import shock with China 2007-1991 -0.024
(0.021)
Employment share of manufacturing in 1990 -0.421**
(0.195)
Share poor households (log) -0.454***
(0.086)
N 31,223 31,223 19,725 26,455 22,905 20,302 30,127 28,591 25,069
Panel B Dep var. : Support for reduction in income differences
Share immigrants (log) -0.121*** -0.127*** -0.121*** -0.129*** -0.073** -0.123*** -0.129*** -0.111***
(0.023) (0.028) (0.022) (0.026) (0.030) (0.023) (0.024) (0.027)
Share immigrants in 1990 (log) -0.099***
(0.017)
yearly GDP growth from 1980-85 to 2000 -0.316
(0.318)
yearly GDP growth from 1965-70 to 2000 -3.454***
(1.310)
Import shock with China 2007-1991 -0.007
(0.018)
Employment share of manufacturing in 1990 0.094
(0.113)
Share poor households (log) -0.015
(0.066)
N 134,033 134,033 87,895 112,293 98,835 86,370 125,988 118,554 109,085
Country-year FE X X X X X X X X X
Regional control X X X X X X X X X
Basic Indiv-controls X X X X X X X X X
Note: Data on regional GDP growth from the 1960s is taken from Gennaioli et al. (2014), which provides a dataset at the NUTS 2 level for most of the European
countries. Import shock with China 2007-1991 is a variable taken from Colantone and Stanig (2018). This variable measures the exposure of a region to the growth
in Chinese imports depending on the ex-ante industry specialization. Share poor households is a measure of the number of people at risk of poverty or social exclusion
defined and provided by the Eurostat Database. See Data Appendix for details.
4.3.2 Natives’ individual characteristics
Education and income Table 6 explores how the effect of immigration depends on native
individuals’ characteristics. When using the index of welfare attitudes as the dependent
21Table 5: Heterogeneous effects across receiving countries: Size of the Welfare State
Dep var. : Index of welfare attitudes
Share immigrants (log) 0.068** -0.012 -0.014 -0.001 -0.013
(0.032) (0.040) (0.040) (0.041) (0.038)
Share immigrants (log) * High Welfare State -0.208*** -0.157*** -0.167*** -0.178*** -0.148***
(0.048) (0.045) (0.045) (0.045) (0.041)
N 31,223 31,223 31,223 31,223 31,223
Dep var. : Support for reduction in income differences
Share immigrants (log) -0.019 -0.038 -0.040 -0.037 -0.036*
(0.022) (0.027) (0.027) (0.025) (0.020)
Share immigrants (log) * High Welfare State -0.215*** -0.145*** -0.132*** -0.128*** -0.104***
(0.032) (0.025) (0.024) (0.023) (0.020)
N 134,033 134,033 134,033 134,033 134,033
Country-year FE X X X X X
Regional control X X X X
Basic Indiv-controls X X X
Income controls X X
Ideology controls X
Note: High Welfare State is a binary taking one if the GDP share of welfare spending (social protection, health
and education) is higher than the sample median. High Welfare State takes one for Austria, Germany, Denmark,
Finland, Norway, Sweden and France. It takes zero for the rest of the EU15 countries and Switzerland.
Standard errors are clustered at the NUTS- year level. *** psignificantly less affected by immigration (column 2 and 3). This could be explained by the
fact that, in Europe, tax systems are generally progressive and bear relatively more on the
middle and upper class than on the lower class. As immigrants are often net recipients of
welfare benefits (they take more in benefits than they contribute in taxes), the fiscal burden
of the welfare policies directed towards (poorer) immigrants is more likely to be felt by the
22
middle and upper class relative to the lower income classes.
In column 4, we look at the differential attitudinal response of 6 groups based on income
and education: the poor (bottom income quintile), the middle class, and the rich (top income
quintile), with or without tertiary education. When focusing on the index of welfare attitudes
(upper panel), we find that immigration has the least negative attitudinal effect among poor
individuals without tertiary education (defined as the bottom income quintile). Among this
group, immigration has no significant impact, which can be due to two opposing forces. On
the one hand, low-educated, low-income natives may dislike ethnic diversity and reduce their
support for redistribution when welfare recipients are more likely to be immigrants (Group
Loyalty effects). On the other hand, this group of natives is the most exposed to tighter
labor market competition with immigrants, and may thus demand more redistribution as
an insurance (or compensation) against a higher risk of downward income mobility. We also
find that the anti-redistribution effect of immigration is the highest among middle and upper
class natives without tertiary education. When using the other dependent variable, we find
no detectable heterogeneity in the attitudinal response.
Political affiliation Table 7 shows that the attitudinal response to immigration cru-
cially depends on the respondent’s political affiliation. Relative to center-rightists (i.e.,
non-leftists), the preferences for redistribution of leftist individuals are significantly less neg-
atively affected by the level of immigration. The average negative anti-redistribution effect
of immigration seems almost entirely driven by center-rightist respondents. When using the
index of welfare attitudes as dependent variable, we find no significant impact of immigra-
tion on leftists’ attitudes. Given that immigrants are on average poorer than natives, this
result could be explained by the relatively higher aversion of leftist individuals to inequal-
ity (or to poverty): the latter likely maintain their support for a system of redistribution
directed towards poorer immigrants in order to mitigate the inequality-increasing effect of
22
Alesina et al. (2018) show that at least for their six countries under consideration, natives in general
overestimate the reliance of immigrants on the national welfare state.
23Table 6: Heterogeneity across individual characteristics : Education and Income
Dep var. : Index welfare attitudes
Share. immigrants (log) -0.135*** -0.124*** -0.154*** -0.159***
(0.034) (0.036) (0.037) (0.037)
Tertiary educated respondent * Share. immigrants (log) 0.067** 0.077***
(0.026) (0.026)
Household income in bottom quintile * Share. immigrants (log) 0.043* 0.058**
(0.023) (0.023)
Household income in top quintile * Share. immigrants (log) 0.024 0.003
(0.029) (0.028)
Non-Tertiary Educated Poor * Sh. immigrants(log) 0.137**
(0.055)
Tertiary-Educated Poor * Sh. immigrants(log) 0.063***
(0.024)
Tertiary-Educated Middle income * Sh. immigrants(log) 0.091***
(0.026)
Tertiary-Educated Rich * Sh. immigrants(log) 0.070*
(0.038)
Non-Tertiary Educated Rich * Sh. immigrants(log) 0.051
(0.046)
N 31,223 31,223 31,223 31,223
Dep var. : Support for reduction in income differences
Share. immigrants (log) -0.121*** -0.117*** -0.125*** -0.126***
(0.022) (0.020) (0.022) (0.022)
Tertiary educated respondent * Share. immigrants (log) 0.015 0.020
(0.018) (0.016)
Household income in bottom quintile * Share. immigrants (log) 0.008 0.013
(0.012) (0.012)
Household income in top quintile * Share. immigrants (log) -0.014 -0.018
(0.029) (0.027)
Non-Tertiary Educated Poor * Sh. immigrants(log) 0.009
(0.025)
Tertiary-Educated Poor * Sh. immigrants(log) 0.017
(0.013)
Tertiary-Educated Middle income * Sh. immigrants(log 0.025
(0.020)
Tertiary-Educated Rich * Sh. immigrants(log) 0.019
(0.038)
Non-Tertiary Educated Rich * Sh. immigrants(log) -0.033
(0.031)
N 134,033 134,033 134,033 134,033
country-year FE X X X X
regional control X X X X
Basic Indiv-controls X X X X
Income controls X X X X
Note: Each regression include country-year fixed effects, regional controls, basic individual controls and income controls(see
previous tables’ notes for details). Each variable that is interacted with the log share of immigrants is included in the controls
of the regression. Standard errors are clustered at the NUTS- year level. *** pYou can also read


