AZERBAIJAN CLIMATE RISK COUNTRY PROFILE
←
→
Page content transcription
If your browser does not render page correctly, please read the page content below
CLIMATE RISK COUNTRY PROFILE

      AZERBAIJAN
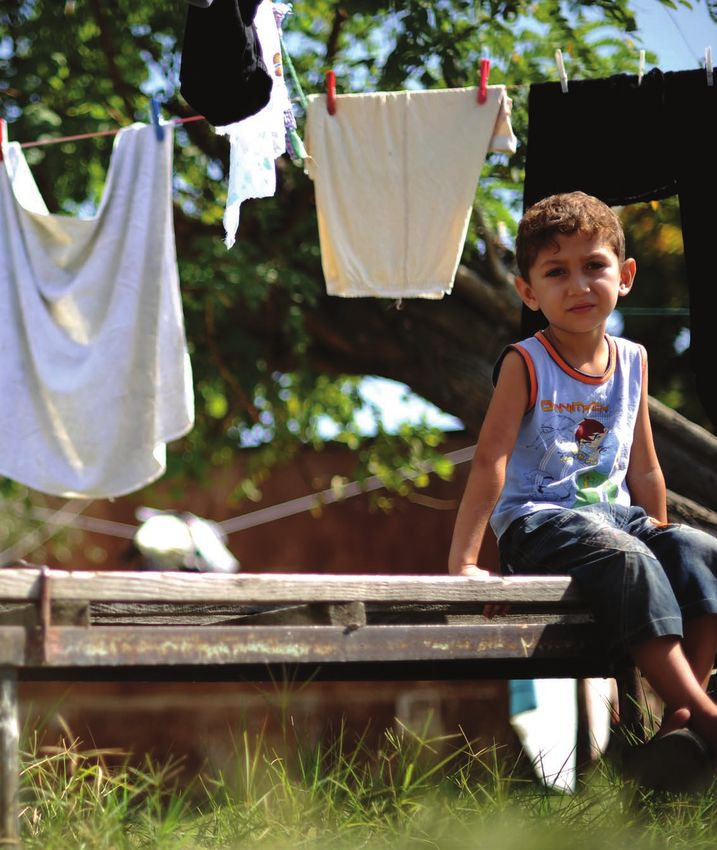
COPYRIGHT
© 2021 by the World Bank Group
1818 H Street NW, Washington, DC 20433
Telephone: 202-473-1000; Internet: www.worldbank.org

© 2021 Asian Development Bank
6 ADB Avenue, Mandaluyong City, 1550 Metro Manila, Philippines
Tel +63 2 8632 4444; Fax +63 2 8636 2444
www.adb.org

This work is a product of the staff of the World Bank Group (WBG) and the Asian Development Bank (ADB) and with external
contributions. The opinions, findings, interpretations, and conclusions expressed in this work are those of the authors’ and do not
necessarily reflect the views or the official policy or position of the WBG, its Board of Executive Directors, or the governments
it represents or of ADB, its Board of Governors, or the governments they represent.

The WBG and ADB do not guarantee the accuracy of the data included in this work and do not make any warranty, express or
implied, nor assume any liability or responsibility for any consequence of their use. This publication follows the WBG’s practice
in references to member designations, borders, and maps. ADB, however, recognizes “China” as the People’s Republic of China.
The boundaries, colors, denominations, and other information shown on any map in this work, or the use of the term “country” do
not imply any judgment on the part of the WBG or ADB, their respective Boards, or the governments they represent, concerning
the legal status of any territory or geographic area or the endorsement or acceptance of such boundaries.

The mention of any specific companies or products of manufacturers does not imply that they are endorsed or recommended
by either the WBG or ADB in preference to others of a similar nature that are not mentioned.

RIGHTS AND PERMISSIONS
The material in this work is subject to copyright. Because the WB and ADB encourage dissemination of their knowledge, this
work may be reproduced, in whole or in part, for noncommercial purposes as long as full attribution to this work is given. This
work is licensed under the Creative Commons Attribution-NonCommercial 3.0 IGO License. To view a copy of this license, visit
http://creativecommons.org/licenses/by-nc/3.0/igo/ or send a letter to Creative Commons, PO Box 1866, Mountain View,
CA 94042, USA.

This CC license does not apply to WBG or non-ADB copyright materials in this publication. If the material is attributed to another
source, please contact the copyright owner or publisher of that source for permission to reproduce it. WBG or ADB cannot be
held liable for any claims that arise as a result of your use of the material.

Please cite the work as follows: Climate Risk Country Profile: Azerbaijan (2021): The World Bank Group and Asian
Development Bank.

Any queries on rights and licenses, including subsidiary rights, should be addressed to World Bank Publications, The World Bank
Group, 1818 H Street NW, Washington, DC 20433, USA; fax: 202-522-2625; e-mail: pubrights@worldbank.org.

Cover Photos: © Allison Kwesell/World Bank, “Alyiev plays outside his home” September 22, 2012 via Flickr, Creative Commons
CC BY-NC-ND 2.0. © Allison Kwesell/World Bank, “Water Users Associations Development Project.” September 24, 2012 via
Flickr, Creative Commons CC BY-NCND 2.0.

Graphic Design: Circle Graphics, Reisterstown, MD.

CLIMATE RISK COUNTRY PROFILE: AZERBAIJAN                                                                                         ii
ACKNOWLEDGEMENTS
This profile is part of a series of Climate Risk Country Profiles that are jointly developed by the World Bank Group (WBG) and the
Asian Development Bank (ADB). These profiles synthesize the most relevant data and information on climate change, disaster
risk reduction, and adaptation actions and policies at the country level. The profile is designed as a quick reference source for
development practitioners to better integrate climate resilience in development planning and policy making. This effort is co-led
by Veronique Morin (Senior Climate Change Specialist, WBG), Ana E. Bucher (Senior Climate Change Specialist, WBG) and
Arghya Sinha Roy (Senior Climate Change Specialist, ADB).

This profile was written by Alex Chapman (Consultant, ADB), William Davies (Consultant, ADB) and Ciaran Downey (Consultant).
Technical review of the profiles was undertaken by Robert L. Wilby (Loughborough University). Additional support was provided
by MacKenzie Dove (Senior Climate Change Consultant, WBG), Jason Johnston (Operations Analyst, WBG), Yunziyi Lang
(Climate Change Analyst, WBG), Adele Casorla-Castillo (Consultant, ADB), and Charles Rodgers (Consultant, ADB). This profile
also benefitted from inputs of WBG and ADB regional staff and country teams.

Climate and climate-related information is largely drawn from the Climate Change Knowledge Portal (CCKP), a WBG online
platform with available global climate data and analysis based on the latest Intergovernmental Panel on Climate Change (IPCC)
reports and datasets. The team is grateful for all comments and suggestions received from the sector, regional, and country
development specialists, as well as climate research scientists and institutions for their advice and guidance on use of climate
related datasets.

CLIMATE RISK COUNTRY PROFILE: AZERBAIJAN                                                                                       iii
CONTENTS

FOREWORD  .  .  .  .  .  .  .  .  .  .  .  .  .  .  .  .  .  .  .  .  .  .  .  .  .  .  .  .  .  .  .  .  .  .  .  . 1

KEY MESSAGES .   .   .   .   .   .   .   .   .   .   .   .   .   .   .   .   .   .   .   .   .   .   .   .   .   .   .   .   .   .   .   .   .   .  2

COUNTRY OVERVIEW .   .   .   .   .   .   .   .   .   .   .   .   .   .   .   .   .   .   .   .   .   .   .   .   .   .   .   .   .   .   .  2

CLIMATOLOGY  .   .   .   .   .   .   .   .   .   .   .   .   .   .   .   .   .   .   .   .   .   .   .   .   .   .   .   .   .   .   .   .   .   .   5
   Climate Baseline .  .  .  .  .  .  .  .  .  .  .  .  .  .  .  .  .  .  .  .  .  .  .  .  .  .  .  .  .  .  .  .  .  .  .  .  .  .  .  .           5
      Overview  .  .  .  .  .  .  .  .  .  .  .  .  .  .  .  .  .  .  .  .  .  .  .  .  .  .  .  .  .  .  .  .  .  .  .  .  .  .  .  .  .  .         5
      Key Trends .  .  .  .  .  .  .  .  .  .  .  .  .  .  .  .  .  .  .  .  .  .  .  .  .  .  .  .  .  .  .  .  .  .  .  .  .  .  .  .  .           6
   Climate Future .  .  .  .  .  .  .  .  .  .  .  .  .  .  .  .  .  .  .  .  .  .  .  .  .  .  .  .  .  .  .  .  .  .  .  .  .  .  .  .  .          7
      Overview  .  .  .  .  .  .  .  .  .  .  .  .  .  .  .  .  .  .  .  .  .  .  .  .  .  .  .  .  .  .  .  .  .  .  .  .  .  .  .  .  .  .         7

CLIMATE RELATED NATURAL HAZARDS .   .   .   .   .   .   .   .   .   .   .   .   .   .   .   .   .   .   .   .   .   . 12
       Heatwaves .  .  .  .  .  .  .  .  .  .  .  .  .  .  .  .  .  .  .  .  .  .  .  .  .  .  .  .  .  .  .  .  .  .  .  .  .  .  .  .  . 13
       Drought  .  .  .  .  .  .  .  .  .  .  .  .  .  .  .  .  .  .  .  .  .  .  .  .  .  .  .  .  .  .  .  .  .  .  .  .  .  .  .  .  .  . 13
       Flood .  .  .  .  .  .  .  .  .  .  .  .  .  .  .  .  .  .  .  .  .  .  .  .  .  .  .  .  .  .  .  .  .  .  .  .  .  .  .  .  .  .  .  . 14

CLIMATE CHANGE IMPACTS .   .   .   .   .   .   .   .   .   .   .   .   .   .   .   .   .   .   .   .   .   .   .   .   .   .   .   . 15
   Natural Resources  .  .  .  .  .  .  .  .  .  .  .  .  .  .  .  .  .  .  .  .  .  .  .  .  .  .  .  .  .  .  .  .  .  .  .  .  .  .  . 15
     Water .  .  .  .  .  .  .  .  .  .  .  .  .  .  .  .  .  .  .  .  .  .  .  .  .  .  .  .  .  .  .  .  .  .  .  .  .  .  .  .  .  .  . 15
     The Coastal Zone  .  .  .  .  .  .  .  .  .  .  .  .  .  .  .  .  .  .  .  .  .  .  .  .  .  .  .  .  .  .  .  .  .  .  .  .  .  . 16
     Land and Soil  .  .  .  .  .  .  .  .  .  .  .  .  .  .  .  .  .  .  .  .  .  .  .  .  .  .  .  .  .  .  .  .  .  .  .  .  .  .  .  . 16
   Economic Sectors  .  .  .  .  .  .  .  .  .  .  .  .  .  .  .  .  .  .  .  .  .  .  .  .  .  .  .  .  .  .  .  .  .  .  .  .  .  .  . 17
     Agriculture .  .  .  .  .  .  .  .  .  .  .  .  .  .  .  .  .  .  .  .  .  .  .  .  .  .  .  .  .  .  .  .  .  .  .  .  .  .  .  .  . 17
     Energy  .  .  .  .  .  .  .  .  .  .  .  .  .  .  .  .  .  .  .  .  .  .  .  .  .  .  .  .  .  .  .  .  .  .  .  .  .  .  .  .  .  .  . 18
   Communities  .  .  .  .  .  .  .  .  .  .  .  .  .  .  .  .  .  .  .  .  .  .  .  .  .  .  .  .  .  .  .  .  .  .  .  .  .  .  .  .  . 20
     Poverty and Inequality .  .  .  .  .  .  .  .  .  .  .  .  .  .  .  .  .  .  .  .  .  .  .  .  .  .  .  .  .  .  .  .  .  .  . 20
     Gender  .  .  .  .  .  .  .  .  .  .  .  .  .  .  .  .  .  .  .  .  .  .  .  .  .  .  .  .  .  .  .  .  .  .  .  .  .  .  .  .  .  .  . 21
     Human Health .  .  .  .  .  .  .  .  .  .  .  .  .  .  .  .  .  .  .  .  .  .  .  .  .  .  .  .  .  .  .  .  .  .  .  .  .  .  .  . 21

POLICIES AND PROGRAMS  .   .   .   .   .   .   .   .   .   .   .   .   .   .   .   .   .   .   .   .   .   .   .   .   .   .   .   . 23
       National Adaptation Policies and Strategies .  .  .  .  .  .  .  .  .  .  .  .  .  .  .  .  .  .  .  .  .  .  .  .  .  . 23
       Climate Change Priorities of ADB and the WBG .  .  .  .  .  .  .  .  .  .  .  .  .  .  .  .  .  .  .  .  .  .  .  . 23

CLIMATE RISK COUNTRY PROFILE: AZERBAIJAN                                                                                                             iv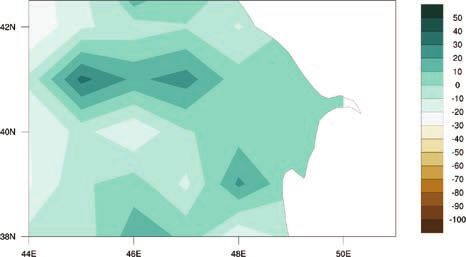
FOREWORD

Climate change is a major risk to good development outcomes, and the World Bank Group is committed to playing an important
role in helping countries integrate climate action into their core development agendas. The World Bank Group (WBG) and the
Asian Development Bank (ADB) are committed to supporting client countries to invest in and build a low-carbon, climate-
resilient future, helping them to be better prepared to adapt to current and future climate impacts.

Both institutions are investing in incorporating and systematically managing climate risks in development operations through
their individual corporate commitments.

For the World Bank Group: a key aspect of the World Bank Group’s Action Plan on Adaptation and Resilience (2019) is to help
countries shift from addressing adaptation as an incremental cost and isolated investment to systematically incorporating climate
risks and opportunities at every phase of policy planning, investment design, implementation and evaluation of development
outcomes. For all International Development Association and International Bank for Reconstruction and Development operations,
climate and disaster risk screening is one of the mandatory corporate climate commitments. This is supported by the World
Bank Group’s Climate and Disaster Risk Screening Tool which enables all Bank staff to assess short- and long-term climate
and disaster risks in operations and national or sectoral planning processes. This screening tool draws up-to-date and relevant
information from the World Bank’s Climate Change Knowledge Portal, a comprehensive online ‘one-stop shop’ for global,
regional, and country data related to climate change and development.

For the Asian Development Bank (ADB): its Strategy 2030 identified “tackling climate change, building climate and disaster
resilience, and enhancing environmental sustainability” as one of its seven operational priorities. Its Climate Change Operational
Framework 2017–2030 identified mainstreaming climate considerations into corporate strategies and policies, sector and
thematic operational plans, country programming, and project design, implementation, monitoring, and evaluation of climate
change considerations as the foremost institutional measure to deliver its commitments under Strategy 2030. ADB’s climate
risk management framework requires all projects to undergo climate risk screening at the concept stage and full climate risk
and adaptation assessments for projects with medium to high risk.

Recognizing the value of consistent, easy-to-use technical resources for our common client countries as well as to support
respective internal climate risk assessment and adaptation planning processes, the World Bank Group’s Climate Change Group
and ADB’s Sustainable Development and Climate Change Department have worked together to develop this content. Standardizing
and pooling expertise facilitates each institution in conducting initial assessments of climate risks and opportunities across sectors
within a country, within institutional portfolios across regions, and acts as a global resource for development practitioners.

For common client countries, these profiles are intended to serve as public goods to facilitate upstream country diagnostics,
policy dialogue, and strategic planning by providing comprehensive overviews of trends and projected changes in key climate
parameters, sector-specific implications, relevant policies and programs, adaptation priorities and opportunities for further actions.

We hope that this combined effort from our institutions will spur deepening of long-term risk management in our client countries
and support further cooperation at the operational level.

Bernice Van Bronkhorst                            Preety Bhandari
Global Director                                   Chief of Climate Change and Disaster Risk Management Thematic Group
Climate Change Group                              concurrently Director Climate Change and Disaster Risk Management Division
The World Bank Group                              Sustainable Development and Climate Change Department
                                                  Asian Development Bank

CLIMATE RISK COUNTRY PROFILE: AZERBAIJAN                                                                                            1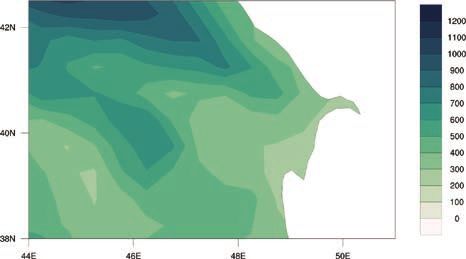
KEY MESSAGES

•     Temperatures in Azerbaijan are projected to rise at a faster rate than the global average, with potential warming
      of 4.7°C by the 2090s over the 1986–2005 baseline, under the highest emissions pathway (RCP8.5).
•     Maximum and minimum temperatures are projected to rise faster than the global average, which will amplify
      the impacts on human health, livelihoods, and ecosystems.
•     The strongest warming is expected to occur during summer months, with average temperatures between July
      and September projected to rise by almost 6°C by the 2090s, under the RCP8.5 pathway.
•     Increases in temperature of this magnitude could reduce agricultural productivity, exacerbate issues of
      desertification and soil salinity, and increase demand for irrigation, putting further pressure on the country’s
      water supply.
•     A warmer climate would also pose multiple threats to public health in Azerbaijan, increasing the rate of heat-
      related medical issues in urban areas such as Baku, and lengthening the seasonal window during which
      malaria occurs.
•     There is a risk that the impacts of climate change will be disproportionately felt by those least able to adapt.
      For example, poorer communities in rural areas are more reliant on rain-fed agriculture, which is likely to be
      negatively impacted by more frequent droughts.
•     Poorer communities are often dependent on poor quality water infrastructure, lack diversified income sources
      and assets, and will be least able to adapt their livelihoods to disaster risks such as drought and extreme heat.

COUNTRY OVERVIEW

A
         zerbaijan is the largest of the three countries of the southern Caucasus by area, lying at the boundaries of
         Europe and Asia. The country is bounded to the east by the Caspian Sea with an 850 km coastline and to
         the north by the Greater Caucasus mountain range. The country is covered by a substantial river network
as part of the Caspian Sea basin.1 Azerbaijan had an estimated population of 9.9 million in 2018 and has been
classified as an upper-middle income country since 2016. This classification reflects the very high GDP per capita
growth, which in 2014 stood at over eight times its 2004 level. Economic growth and relative prosperity is primarily
as a result of the substantial increase in oil and gas production. The oil and gas sector represented 88% of the
country’s exports in 2016 (OEC, 2016). In terms of employment, the services sector represented 49.3% of jobs in
2017, followed by the agricultural (36.4%) and industrial (14.4%) sectors. Since the 1990’s significant progress
has been made on key social indicators, such as the prevalence of poverty, undernourishment, and infant mortality
in Azerbaijan (see key indicators in Table 1).

Azerbaijan has signed and ratified the Paris Climate Agreement. In its Nationally Determined Contributions (2017),
the country has outlined climate change mitigation actions in its energy, oil and gas, residential and commercial,
transport, agricultural, and waste sectors. Azerbaijan’s NDC is currently under review and an updated NDC is

1
    Ministry of Ecology and Natural Resources (2015). Republic of Azerbaijan. Third National Communication to the UNFCCC on
    Climate Change. URL: https://unfccc.int/sites/default/files/resource/azenc3.pdf

CLIMATE RISK COUNTRY PROFILE: AZERBAIJAN                                                                                      2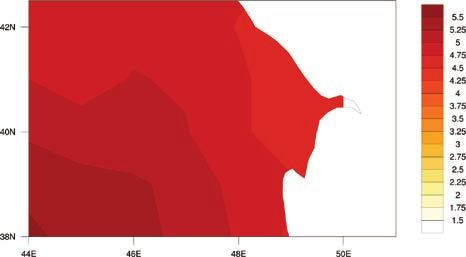
expected to be released by the end of 2021. Azerbaijan is also planning to align its climate change legislation
with the EU standards and to develop industry-specific guidelines for the implementation of the Paris Agreement
across various sectors, in particular agriculture and energy sectors. These actions primarily entail technological
improvements to reduce the negative environmental impact of various sectors of the economy, together with some
regulatory changes and public awareness measures. Additionally, adaptation measures in the areas of agriculture,
water supply, forestry, coastal communities, human health and tourism have been identified in the country’s Third
National Communication to the UNFCCC (NC3) (2015). Azerbaijan has begun its National Adaptation Plan (NAP)
process, which is anticipated be in place by 2024. While Azerbaijan’s National Communications address a wide
range of sectors in relation to projected climate change impacts and related adaptation measures, the NAP will
focus on three areas, as defined by the Ministry of Ecology: water, agriculture, and coastal areas.2 Azerbaijan has
also developed and implemented its Nationally Appropriate Mitigation Actions (NAMA), which primarily target
three key sectors: energy efficiency in buildings (retrofitting), transport through the modification of transport
fleet (introduction of hybrid cars) and eco-driving, and oil industry through capturing and use of associated gas.
Azerbaijan’s first NAMA projects were piloted with SOCAR (State Oil Company, major GHG emitter) and are being
considered for replication across the country and sectors.3

TABLE 1.  Key indicators

     Indicator                                                    Value                               Source
     Population Undernourished       4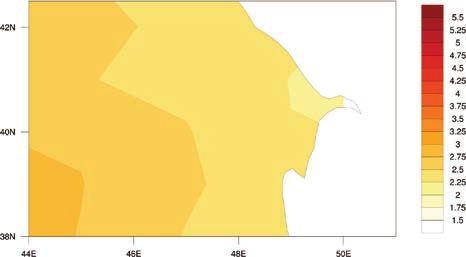
Green, Inclusive and Resilient Recovery
The coronavirus disease (COVID-19) pandemic has led to unprecedented adverse social and economic impacts.
Further, the pandemic has demonstrated the compounding impacts of adding yet another shock on top of
the multiple challenges that vulnerable populations already face in day-to-day life, with the potential to create
devastating health, social, economic and environmental crises that can leave a deep, long-lasting mark. However,
as governments take urgent action and lay the foundations for their financial, economic, and social recovery, they
have a unique opportunity to create economies that are more sustainable, inclusive and resilient. Short and long-
term recovery efforts should prioritize investments that boost jobs and economic activity; have positive impacts on
human, social and natural capital; protect biodiversity and ecosystems services; boost resilience; and advance the
decarbonization of economies.

This document aims to succinctly summarize the climate risks faced by Azerbaijan. This includes rapid onset and
long-term changes in key climate parameters, as well as impacts of these changes on communities, livelihoods and
economies, many of which are already underway. This is a high-level synthesis of existing research and analyses,
focusing on the geographic domain of Azerbaijan, therefore potentially excluding some international influences and
localized impacts. The core data presented is sourced
from the database sitting behind the World Bank
Group’s Climate Change Knowledge Portal (CCKP),             FIGURE 1.  The ND-GAIN Index summarizes
incorporating climate projections from the Coupled          a country’s vulnerability to climate change
Model Inter-comparison Project Phase 5 (CMIP5). This        and other global challenges in combination
document is primarily meant for WBG and ADB staff           with its readiness to improve resilience.
to inform their climate actions and to direct them to       It aims to help businesses and the public
many useful sources of secondary data and research.         sector better prioritize investments for a
                                                                        more efficient response to the immediate
Due to a combination of political, geographic, and social               global challenges ahead.
factors, Azerbaijan is recognized as vulnerable to climate                      53

change impacts, ranked 73rd out of 181 countries                                52

in the 2020 ND-GAIN Index.13 The ND-GAIN Index
                                                                                51
ranks 181 countries using a score which calculates
a country’s vulnerability to climate change and other                           50
                                                                        Score

global challenges as well as their readiness to improve                         49

resilience. The more vulnerable a country is the
                                                                                48
lower their score, while the more ready a country is to
                                                                                47
improve its resilience the higher it will be. Norway has
the highest score and is ranked 1st. Figure 1 is a time-                        46
                                                                                     1995 1997 1999 2001 2003 2005 2007 2009 2011 2013
series plot of the ND-GAIN Index showing Azerbaijan’s                                  Azerbaijan

progress.

13
     University of Notre Dame (2020). Notre Dame Global Adaptation Initiative. URL: https://gain.nd.edu/our-work/country-index/

CLIMATE RISK COUNTRY PROFILE: AZERBAIJAN                                                                                                 4
CLIMATOLOGY
Climate Baseline
Overview
Azerbaijan’s climate is highly varied, with different areas of the country containing examples of nine of the world’s
eleven climate zones. This includes semi-arid zones in the center and east of the country (including the capital,
Baku), temperate zones in the north, continental zones in the west, cold and tundra zones, meaning that
there are marked variations in average annual temperature and precipitation in different regions. In general,
more mountainous parts of Azerbaijan receive higher levels of precipitation and lower average temperatures than
the central lowlands and Caspian Sea coast, where the climate is drier and hotter. Azerbaijan experiences hot
summers (especially in lowland areas) and moderate winters. Average temperatures for the latest climatology,
1991–2020, ranged between approximately 24°C in the summer months of July and August, and −1°C to 1°C
during the winter (December to February). The average monthly temperatures vary significantly between different
regions and altitudes across Azerbaijan. Average temperatures in Baku and other parts of the east and southeast
reach approximately 27°C during the hottest months of July and August, while temperatures during these months
remain between 15°C and 20°C in parts the mountainous north and west. Similarly, during the winter (December
to February) temperatures in Baku average between 3°C and 4°C, whereas in western and northern areas average
monthly temperatures fall to between −5°C and −10°C.14
Average rainfall in Azerbaijan follows a bimodal distribution throughout the months of the year, with average
levels above 40 millimeters (mm) per month from April to June, and again in October (Figure 2). Precipitation
is highest in May and June in the northern and western areas of Azerbaijan, where it can exceed 100 mm per
month in places. On the other hand, precipitation in Baku remains below 25 mm per month on average for
much of the year (from January to September) and averages only 33 mm in the wettest months of October and
November (Figure 3).
14
Ministry of Ecology and Natural Resources (2015). Republic of Azerbaijan. Third National Communication to the UNFCCC on
Climate Change. URL: https://unfccc.int/sites/default/files/resource/azenc3.pdf
CLIMATE RISK COUNTRY PROFILE: AZERBAIJAN 5Annual Cycle
FIGURE 2. Average monthly temperature and rainfall in Azerbaijan (1991–2020).15
30 60
Temperature (°C)
20 40
Rainfall (mm)
10 20
0 0
Jan Feb Mar Apr May Jun Jul Aug Sep Oct Nov Dec
Rainfall Temperature
Spatial Variation
FIGURE 3. (Left) annual mean temperature (°C), and (right) annual mean rainfall (mm) in
Azerbaijan over the period 1991–2020.
Maps present the coordinates of Azerbaijan: latitude 44°59′09″E – 50°20′24″E and 41°16′36″N – 38°28′10″N.
Key Trends
Temperature
Azerbaijan’s NC3 reports an increase in temperatures across the country of 1.3°CC in 2010, relative to the average
annual temperatures observed in the period 1961–1990. In Baku, the capital, temperatures during the summer
months of June, July and August 2010 were 2.9°CC−3.2°CC higher than the 1961–1990 baseline. This increase
in annual average temperatures was more acute in areas of higher altitude (>1,000 meters [m]), where 2010
temperatures were 1.9°CC above their 1961–1990 levels. Increase in temperature was observed mainly during
15
WBG Climate Change Knowledge Portal (CCKP, 2020). Climate Data: Historical. URL: https://climateknowledgeportal.worldbank.org/
country/azerbaijan/climate-data-historical
CLIMATE RISK COUNTRY PROFILE: AZERBAIJAN 6summer season which was about 0.90°CC in Absheron-Gobustan region, 1.10°C in Lesser Caucasus region,
0.80°C in Lankaran-Astara region and 0.90°C in Kura-Araz region. Increase in temperature in Nakhcivan region
was observed in summer and autumn seasons (0.80°C). Annual anomaly of temperature was observed mainly in
Ganja (1.10°C) and Dashkasan (1.20°C) stations of Lesser Caucasus. In line with these temperature increases,
glacial loss over the period 1906–2006 in Azerbaijan was approximately 50%.16
Precipitation
Trends in precipitation in Azerbaijan are variable with a
degree of uncertainty. The amount of precipitation, seasonal A Precautionary Approach
and annual is determined by the interaction of air masses
with the landscape and the Caspian Sea. The Southern Studies published since the last iteration of
shore of the Absheron Peninsula and Southeast of the IPCC’s report (AR5), such as Gasser
Gobustan traditionally receive the minimum average annual et al. (2018), have presented evidence which
precipitation (150–200 mm per year). The Southeastern suggests a greater probability that earth will
lowlands of Samur-Davachi, Araz plain of Nakhchivan AR, experience medium and high-end warming
main parts of Gobustan and Absheron Peninsula scenarios than previously estimated.18 Climate
precipitation experience less than 300 mm. Precipitation change projections associated with the highest
gradually increases from the Caspian Sea to the west and emissions pathway (RCP8.5) are presented
increases up the mountains and can experience as much as here to facilitate decision making which is
1,400 to 1,600 mm. While the majority of the precipitation robust to these risks.
coincides with the warm period (April-October), summer
months are mostly dry and even the annual precipitation
rate in the Lankaran-Astara, a region with abundant
precipitation, diminishes by 5–15%.17
Climate Future
Overview
The main data source for the World Bank Group’s Climate Change Knowledge Portal (CCKP) is the Coupled
Model Inter-comparison Project Phase 5 (CMIP5) models, which are utilized within the Fifth Assessment Report
(AR5) of the Intergovernmental Panel on Climate Change (IPCC), providing estimates of future temperature and
precipitation. Four Representative Concentration Pathways (i.e. RCP2.6, RCP4.5, RCP6.0, and RCP8.5) were
selected and defined by their total radiative forcing (cumulative measure of GHG emissions from all sources)
pathway and level by 2100. In this analysis RCP2.6 and RCP8.5, the extremes of low and high emissions pathways,
are the primary focus RCP2.6 represents a very strong mitigation scenario, whereas RCP8.5 assumes business-
as-usual scenario. For more information, please refer to the RCP Database.
16
Ministry of Ecology and Natural Resources (2015). Republic of Azerbaijan. Third National Communication to the UNFCCC on
Climate Change. URL: https://unfccc.int/sites/default/files/resource/azenc3.pdf
17
Ministry of Ecology and Natural Resources (2015). Republic of Azerbaijan. Third National Communication to the UNFCCC on
Climate Change. URL: https://unfccc.int/sites/default/files/resource/azenc3.pdf
18
Gasser, T., Kechiar, M., Ciais, P., Burke, E. J., Kleinen, T., Zhu, D., . . . Obersteiner, M. (2018). Path-dependent reductions in CO2
emission budgets caused by permafrost carbon release. Nature Geoscience, 11, 830–835. URL: http://pure.iiasa.ac.at/id/eprint/
15453/
CLIMATE RISK COUNTRY PROFILE: AZERBAIJAN 7For Azerbaijan, these models show a trend of consistent warming that varies by emissions scenario. While the
projections for precipitation reflect a higher degree of uncertainty, the projected precipitation trends indicate a
likely reduction in precipitation throughout the year. An increase in intensity for extreme rainfall events is also likely.
Tables 2 and 3 below, provide information on temperature projections and anomalies for the four RCPs over two
distinct time horizons; presented against the reference period of 1986–2005.
TABLE 2. Projected anomaly (changes °C) for maximum, minimum, and average daily temperatures in
Azerbaijan for 2040–2059 and 2080–2099, from the reference period of 1986–2005 for all RCPs. The
table is showing the median of the CCKP model ensemble and the 10–90th percentiles in brackets19
Average Daily Maximum Average Daily Minimum
Temperature Average Daily Temperature Temperature
Scenario 2040–2059 2080–2099 2040–2059 2080–2099 2040–2059 2080–2099
RCP2.6 1.3 1.2 1.3 1.2 1.3 1.1
(−1.1, 3.8) (−1.0, 3.8) (−0.7, 3.4) (−0.6, 3.3) (−0.6, 3.1) (−0.5, 3.2)
RCP4.5 1.8 2.5 1.7 2.3 1.7 2.2
(−0.6, 4.2) (0.3, 5.2) (−0.5, 3.8) (0.4, 4.7) (−0.3, 3.6) (0.3, 4.6)
RCP6.0 1.6 3.2 1.6 3.1 1.5 2.8
(−0.2, 3.7) (1.1, 5.5) (0.0, 3.4) (1.2, 5.1) (−0.2, 3.3) (0.9, 4.8)
RCP8.5 2.4 5.0 2.3 4.7 2.2 4.6
(−0.1, 4.9) (2.5, 7.6) (0.1, 4.5) (2.5, 7.1) (0.1, 4.3) (2.4, 6.9)
TABLE 3. Projections of average temperature anomaly (°C) in Azerbaijan for different seasons
(3-monthly time slices) over different time horizons and emissions pathways, showing the median
estimates of the full CCKP model ensemble and the 10th and 90th percentiles in brackets.18
2040–2059 2080–2099
Scenario Jun–Aug Dec–Feb Jun–Aug Dec–Feb
RCP2.6 1.5 1.2 1.4 1.2
(−0.3, 4.5) (−1.4, 3.1) (−0.6, 4.2) (−1.0, 3.1)
RCP4.5 2.1 1.5 2.8 1.9
(0.0, 5.2) (−1.5, 3.2) (1.0, 6.1) (−0.4, 4.2)
RCP6.0 1.8 1.7 3.5 2.8
(0.0, 3.8) (−0.3, 3.4) (1.5, 5.8) (0.8, 4.8)
RCP8.5 2.8 1.9 5.6 4.0
(0.8, 6.1) (−1.3, 3.7) (3.6, 9.0) (1.3, 6.1)
19
WBG Climate Change Knowledge Portal (CCKP, 2020). Climate Data: Projection. URL: https://climateknowledgeportal.worldbank.org/
country/azerbaijan/climate-data-projections
CLIMATE RISK COUNTRY PROFILE: AZERBAIJAN 8Model Ensemble
Climate projections presented in this document are FIGURE 4. ‘Projected average temperature
derived from datasets available through the CCKP, anomaly’ and ‘projected annual rainfall
unless otherwise stated. These datasets are processed anomaly’ in Azerbaijan. Outputs of 16 models
outputs of simulations performed by multiple General within the ensemble simulating RCP8.5
Circulation Models (GCM) (for further information see over the period 2080–2099. Models shown
Flato et al., 2013).20 Collectively, these different GCM represent the subset of models within the
simulations are referred to as the ‘model ensemble’. ensemble which provide projections across
Due to the differences in the way GCMs represent all RCPs and therefore are most robust for
the key physical processes and interactions within the comparison.18 Three models are labelled.
climate system, projections of future climate conditions 7
Average temperature anomaly (°C)
ipsl_cm5a_mr
can vary widely between different GCMs, this is 6
particularly the case for rainfall related variables and at 5
national and local scales. The range of projections from 4 mri_cgcm3
fio_esm
16 GCMs for annual average temperature change 3
and annual precipitation change in Azerbaijan under 2 Median,
10th and 90th
RCP8.5 is shown in Figure 4. Spatial representation 1 Percentiles
of future projections of annual temperature and 0
–30% –20% –10% 0% 10% 20%
precipitation for mid and late century under RCP8.5 Average annual precipitation anomaly (%)
are presented in Figure 5.
20
Flato, G., Marotzke, J., Abiodun, B., Braconnot, P., Chou, S. C., Collins, W., . . . Rummukainen, M. (2013). Evaluation of Climate
Models. Climate Change 2013: The Physical Science Basis. Contribution of Working Group I to the Fifth Assessment Report of the
Intergovernmental Panel on Climate Change, 741–866. URL: http://www.climatechange2013.org/images/report/WG1AR5_ALL_
FINAL.pdf
CLIMATE RISK COUNTRY PROFILE: AZERBAIJAN 9Spatial Variation
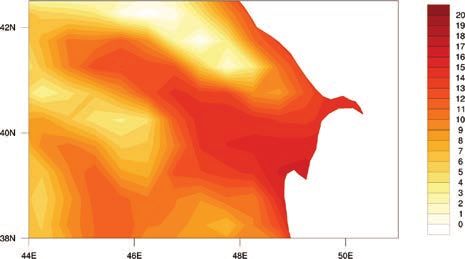
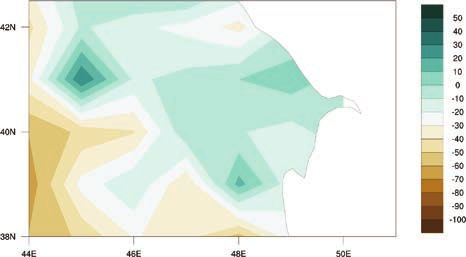
FIGURE 5. CMIP5 ensemble projected change (32 GCMs) in annual temperature (top) and
precipitation (bottom) by 2040–2059 (left) and by 2080–2090 (right) relative to 1986–2005
baseline under RCP8.5.21
Maps present the coordinates of Azerbaijan: latitude 44°59′09″E – 50°20′24″E and 41°16′36″N – 38°28′10″N.
Temperature
Projections of future temperature change are presented in three primary formats. Shown in Table 2 are the
changes (anomalies) in daily maximum and daily minimum temperatures over the given time period, as well as
changes in the average temperature. Figures 6 and 7 display the annual and monthly average temperature
projections. While similar, these three indicators can provide slightly different information. Monthly/annual average
temperatures are most commonly used for general estimation of climate change, but the daily maximum and
minimum can explain more about how daily life might change in a region, affecting key variables such as the viability
of ecosystems, health impacts, productivity of labor, and the yield of crops, which are often disproportionately
influenced by temperature extremes.
21
WBG Climate Change Knowledge Portal (CCKP 2020). Azerbaijan. Climate Data. Projections. URL: https://climateknowledgeportal.
worldbank.org/country/azerbaijan/climate-data-projections
CLIMATE RISK COUNTRY PROFILE: AZERBAIJAN 10Temperatures in Azerbaijan are projected to rise by approximately 4.7°C by the 2090s under the RCP8.5
emissions pathway, and by 1.2°C in the RCP2.6 emissions pathway, from the 1986–2005 baseline. The projected
increases in temperature in Azerbaijan are above the global average increases, especially in the more extreme
emissions scenarios. Temperature rises, as shown in Table 2, are even more significant in terms of maximum
and minimum temperatures.
FIGURE 6. Historic and projected average FIGURE 7. Projected change (anomaly) in
annual temperature in Azerbaijan under monthly temperature, shown by month, for
RCP2.6 (blue) and RCP8.5 (red) estimated Azerbaijan for the period 2080–2099 under
by the model ensemble. Shading represents RCP8.5. The value shown represents the
the standard deviation of the model median of the model ensemble with the shaded
ensemble.22 areas showing the 10th–90th percentiles.21
19 10
18 9
17 8
16 7
degC
6
degreesC
15
5
14
4
13
3
12
2
11
1
1980 2000 2020 2040 2060 2080 2100
Year 0
Historical RCP 2.6 RCP 4.5 RCP 6.0 RCP 8.5 Jan Feb Mar Apr May Jun Jul Aug Sep Oct Nov Dec
As shown in Figure 6, the projected increases in average temperature are more pronounced during the summer
months. This seasonal trend is present in all emissions pathways with the exception of RCP2.6. As seen in Figure 7,
average temperatures in the RCP8.5 pathway between July and September are forecast to rise by 5.6°C to 5.9°C
by the 2090s, compared with a projected rise of between 3.8°C and 4.1°C in the months of December, January
and February. The median number of summer days (days with temperature in excess of 25°C) per year is projected
to increase from 95 to 151 days by the end of the century, under RCP8.5.
22
WBG Climate Change Knowledge Portal (CCKP 2020). Azerbaijan. Climate Data. Projections. URL: https://climateknowledgeportal.
worldbank.org/country/azerbaijan/climate-data-projections
CLIMATE RISK COUNTRY PROFILE: AZERBAIJAN 11The spatial variation of climate changes in Azerbaijan is complex and further work is required to enhance downscaled
models that capture the full range of possible futures projected by the ensemble of global climate models. The
large-scale climate models in the CCKP ensemble suggests that the eastern parts of Azerbaijan along the Caspian
Sea coast (including the capital and largest city, Baku) will experience less of an increase in annual temperature
compared with the western parts of the country. Under the most extreme emissions pathway (RCP8.5), Baku is
projected to see annual temperatures rise around 0.6°C less, by the end of the 21st century, than in G nc , a large e e
city in the west of the country.
Precipitation
While considerable uncertainty clouds projections of local long-term future precipitation trends, some global trends
are evident. The intensity of sub-daily extreme rainfall events appears to be increasing with temperature, a finding
supported by evidence from different regions of Asia.23 However, as this phenomenon is highly dependent on
local geographical contexts further research is required to constrain its impact in Azerbaijan. The median level of
precipitation ranges between 454 mm and 499 mm in the four emissions pathways, relative to a baseline median
of 444 mm per year. There is greater confidence around changes to the future intensity of heavy rainfall events.
Increased rainfall events are likely to be experienced in the central and northern areas. These changes match global
trends, which suggests the intensity of sub-daily extreme rainfall will increase as temperatures increase, a finding
supported by evidence from different regions of Asia.24
CLIMATE RELATED NATURAL HAZARDS
A
zerbaijan faces significant disaster risk levels and is ranked 61st out of 191 countries by the 2020 Inform
Risk Index25 (Table 4). This ranking is driven strongly by the exposure component of risk. Azerbaijan has
relatively high exposure to natural hazards such as flooding, including, riverine, flash, and coastal, and
relatively low institutional strength to combat increased risks and natural hazard exposure. The country’s risk is
enhanced particularly by high levels of drought risk (ranked 35th), but also by its moderate levels of flood risk and
social vulnerability. The section that follows analyses climate change influences on the exposure component of
risk in Azerbaijan. As seen in Figure 1, the ND-GAIN Index presents an overall picture of a country’s vulnerability
and capacity to improve its resilience. In contrast, the Inform Risk Index identifies specific risks across a country to
support decisions on prevention, preparedness, response and a country’s overall risk management.
23
Westra, S., Fowler, H. J., Evans, J. P., Alexander, L. V., Berg, P., Johnson, F., Kendon, E. J., Lenderink, G., Roberts, N. (2014). Future
changes to the intensity and frequency of short-duration extreme rainfall. Reviews of Geophysics, 52, 522–555. URL: https://
agupubs.onlinelibrary.wiley.com/doi/10.1002/2014RG000464
24
Westra, S., Fowler, H. J., Evans, J. P., Alexander, L. V., Berg, P., Johnson, F., Kendon, E. J., Lenderink, G., Roberts, N. (2014). Future
changes to the intensity and frequency of short-duration extreme rainfall. Reviews of Geophysics, 52, 522–555. URL: https://
agupubs.onlinelibrary.wiley.com/doi/epdf/10.1002/2014RG000464
25
European Commission (2020). INFORM Index for Risk Management. Azerbaijan Country Profile. URL: https://drmkc.jrc.ec.europa.eu/
inform-index/Countries/Country-Profile-Map
CLIMATE RISK COUNTRY PROFILE: AZERBAIJAN 12TABLE 4. Selected indicators from the INFORM 2017 Index for Risk Management for Azerbaijan.
For the sub-categories of risk (e.g. “Flood”) higher scores represent greater risks. Conversely the
most at-risk country is ranked 1st. Global average scores are shown in brackets.
Socio- Lack of Overall
Natural Hazards & Institutional Economic Coping Inform
Hazards Exposures Strength Vulnerability Capacity Risk Level
(0–10) (0–10) (0–10) (0–10) (0–10) (0–10) Rank (1–191)
4.9 5.0 6.4 2.2 2.3 4.7 61
Heatwaves
Azerbaijan can experience high maximum temperatures, with an average monthly maximum of around 17°C, however,
summer temperatures peak with an average July maximum of 31°C. The current median probability of a heat wave
(defined as a period of 3 or more days where the daily temperature is above the long-term 95th percentile of daily
mean temperature) is around 2%21. The model ensemble projects an increase in the annual probability of a heatwave
occurring in Azerbaijan in the 2090s in all emissions
pathways, with the probability of a heat wave being
FIGURE 8. Boxplots showing the historical and
significantly higher than its historical (1986–2005)
projected annual maximum of daily maximum
level in all pathways except for RCP4.5. This increase
temperatures in Azerbaijan for the period
in the probability of heat waves is projected to affect
2080–2099 over four emissions pathways.21
all parts of the country equally. However, to a large
55
extent this rise reflects the impact of general long-
term warming, which moves the ambient temperature 50
further away from the baseline upon which heatwave 45
conditions are based. Overall, climate change is likely
degC
40
to mean that heat stress becomes a much more regular
35
occurrence. As shown in Figure 8, under three of the
four emissions pathways, Azerbaijan is projected to 30
experience temperatures above 40°C on an annual 25
Historical RCP 2.6 RCP 4.5 RCP 6.0 RCP 8.5
basis by the 2090s.
Drought
Two primary types of drought may affect Azerbaijan, meteorological (usually associated with a precipitation deficit)
and hydrological (usually associated with a deficit in surface and subsurface water flow, potentially originating in the
region’s wider river basins). In combination with local land and crop management practices, these may also lead to
agricultural drought. At present, Azerbaijan faces an annual median probability of severe meteorological drought of
around 2%, as defined by a standardized precipitation evaporation index (SPEI) of less than −2.26
26
WBG Climate Change Knowledge Portal (CCKP, 2020). Climate Data: Historical. URL: https://climateknowledgeportal.worldbank.org/
country/azerbaijan/climate-data-historical
CLIMATE RISK COUNTRY PROFILE: AZERBAIJAN 13Naumann et al. (2018) provide a global overview of changes in drought conditions under different warming scenarios.27
They project large increases in the duration and magnitude of meteorological droughts in West Asia by the end of
the 21st century under global warming levels of 1.5°C, 2.0°C and 3.0°C. Droughts of a magnitude that is extremely
rare at present in West Asia (100-year droughts)
are projected to become 5 to 10 times more common
FIGURE 9. Boxplots showing the annual
under the same warming scenarios. Similarly, the model
probability of experiencing a ‘severe drought’
ensemble projects a significant increase in the annual
in Azerbaijan (−2 SPEI index) in 2080–2099
probability of experiencing severe drought by the
under four emissions pathways.21
2090s in all four pathways (Figure 9). The projected
0.5
rise in the probability of severe drought is especially
0
pronounced in the higher emissions pathways, from –0.5
an observed median of 2% per year from 1986–2005 –1.0
to a forecast median probability of 73% or 85% by
unitless
–1.5
–2.0
the end of the century for RCP6.0 and RCP8.5,
–2.5
respectively. These estimates reflect a transition to
–3.0
a chronically drought-affected environment in many –3.5
regions of Azerbaijan, and are likely to contribute to –4.0
Historical RCP 2.6 RCP 4.5 RCP 6.0 RCP 8.5
the expansion of arid ecosystems and desertification.
Flood
Azerbaijan experiences frequent flooding, though estimates of the extent of this flooding vary. Flooding typically
occurs in late spring and early summer in higher altitude areas of the country (above 1,500 m in altitude), whereas
in lower areas, flooding may occur in spring or autumn.28 The parts of the country at greatest risk of floods are in
the central and south-eastern regions,29 while some parts of the country, such as the south slope of the Greater
Caucasus, experience mudflows caused by flooding.27 Severe flooding occurred in Azerbaijan in 2003, when
30,000 people were affected, resulting in over $70 million in damage. Flooding in 1995 affected 1.5 million people,
a far greater proportion of the population than in 2003, and caused approximately $30 million worth of damage.28
Azerbaijan’s water resources depend primarily on two key river basins, that of the Kur and Aras rivers. The future
hydrology of their basins, including the greater and lesser Caucasus mountain ranges, will likely determine fluvial
flooding trends.
27
Naumann, G., Alfieri, L., Wyser, K., Mentaschi, L., Betts, R. A., Carrao, H., . . . Feyen, L. (2018). Global Changes in Drought Conditions
Under Different Levels of Warming. Geophysical Research Letters, 45(7), 3285–3296. URL: https://agupubs.onlinelibrary.wiley.com/
doi/10.1002/2017GL076521
28
Skøien, J., Salamon, P., Alagic, E., Alobeiaat, A., Andreenko, A., Bari, D., Ciobanu, N., Doroshenko, V., El-Ashmawy, F., Givati, A., Kastrati, B.,
Kordzakhia, M., Petrosyan, Z., Spalevic, M., Stojov, V., Tuncok, K., Verdiyev, A., Vladikovic, D. & Zaimi, K. (2018). Assessment of the
capacity for flood monitoring and early warning in Enlargement and Eastern/ Southern Neighbourhood countries of the European
Union, EUR 29073 EN, Publications Office of the European Union, Luxembourg, ISBN 978-92-79-77771-4, doi:10.2760/18691,
JRC108843. URL: https://publications.jrc.ec.europa.eu/repository/bitstream/JRC108843/kjna29073enn.pdf
29
GFDRR (2017). Disaster Risk Profile: Azerbaijan. URL: https://www.gfdrr.org/en/publication/disaster-risk-profile-azerbaijan
[accessed 14/02/2019]
CLIMATE RISK COUNTRY PROFILE: AZERBAIJAN 14The World Resources Institute’s AQUEDUCT Global Flood Analyzer can be used to establish a baseline level of
river flood exposure.30 As of 2010, assuming protection for up to a 1 in 25-year event, the population annually
affected by flooding in Azerbaijan is estimated at 19,200 people and expected annual impact on GDP is estimated
at $169 million. Development and climate change are both likely to increase these figures and by 2030, is expected
to decrease the annually affected population by 1,100 people, and to have no significant GDP impact under the
RCP8.5 emissions pathway (AQUEDUCT Scenario B).
With regard to flash flooding, the model ensemble does not project a significant increase in heavy rainfall: the
average largest 5-day cumulative rainfall is not expected to be significantly higher in the 2090s than its current
level in any of the four emissions pathways. However, further research is required to constrain future flash flood
and landslide potential, as this rainfall projection contradicts global trends of increased rainfall intensity. Azerbaijan
currently has pockets of significant landslide risk in its northern and western mountain belts.31
CLIMATE CHANGE IMPACTS
Natural Resources
Water
Water supply poses a challenge in Azerbaijan, due to uneven distribution of water resources both seasonally and
spatially.2 In addition to distributional issues, the country’s aggregate water resources per capita are relatively low
and 70%–75% of this water supply comes from sources that originate outside Azerbaijan’s borders.32 Although
uncertainty exists regarding the projected levels of precipitation in Azerbaijan in future decades, increased
temperatures are likely to lead to greater evaporation of water resources and reduced river flows, putting pressure
on one of Azerbaijan’s main sources of freshwater.2 UNDP (2011) modelling of the impact of climate change
on water resources in the South Caucasus, albeit relying on the previous iteration of general circulation models
(CMIP3) in which precipitation is expected to fall in all three countries in the region by the end of the century,
gives some insight into the downside risks for Azerbaijan.33 Models projects that by 2100, streamflow will fall by
26%–35% in the Alazani basin on the Georgian border, and by 59%–72% in the Aghstev basin on the Armenian
border. Given that water demand is likely to increase with higher temperatures and population growth, they project
water shortfalls in the summer months in the Alazani basin.32
30
WRI (2018). AQUEDUCT Global Flood Analyzer. URL: https://floods.wri.org/# [Accessed: 22/11/2018].
31
WHO (2010). Azerbaijan: Landslide Hazard Distribution Map. World Health Organization. URL: http://data.euro.who.int/e-atlas/
europe/images/map/azerbaijan/aze-landslides.pdf
32
Ministry of Ecology and Natural Resources (2015). Republic of Azerbaijan. Third National Communication to the UNFCCC on
Climate Change. URL: https://unfccc.int/sites/default/files/resource/azenc3.pdf
33
UNDP (2011). Regional climate change impacts study for the South Caucasus region. United Nations Development Programme.
URL: https://www.ge.undp.org/content/dam/georgia/docs/publications/GE_SC-CC-2011.pdf
CLIMATE RISK COUNTRY PROFILE: AZERBAIJAN 15Water shortages are likely to coincide with an increased need for irrigation (due to higher temperatures and
changes in length of growing season). This impact will be more severe in certain regions of Azerbaijan, and could
reduce crop yields. The effect may be exacerbated if the existing issues in water distribution (such as leaks in the
system) are not addressed. Increases in temperature associated with climate change will also lead to more rapid
glacial melt, which will increase the risk of downstream flooding, landslides and mudslides.2 For one of Azerbaijan’s
major glacial areas, the Gusarchay Basin, glacial area has decreased by approximately 50% over the past century.31
Increased average temperatures in the coming decades are likely to accelerate the melting process; if this proceeds
in line with the projections of glacial mass in other countries, this melting will lead to an initial increase in the flow
of related rivers, followed by a longer term reduction in flow by the end of the 21st century.
The Coastal Zone
As of 2015, Azerbaijan’s coastal areas were home to approximately 4 million, as well as the country’s largest
cities, and 75% of its industrial resources.16 Azerbaijan’s capital, Baku which sits on the Caspian Coast, accounted
for approximately $39 billion (71%) of the country’s GDP in 2015.28 The Caspian Sea level fell by an average
of 6.7cm per year between 1996 and 2015, with recent research finding that evaporation played a dominant
role in this sea-level reduction.34 As average temperatures in the region increase in the coming decades, this
decrease in the level of the Caspian Sea is expected to continue.35 Studies have tended to show declines in the
range of 4–5 m by the end of the 21st century.36 The socioeconomic impact of a fall of this magnitude however,
is poorly studied.
Land and Soil
Climate change is projected to impact on the quality of land and soil in Azerbaijan. The country’s supply of arable
land is already significantly affected by issues of soil erosion, soil salinization, swamping and chemical pollution. The
government of Azerbaijan estimates that approximately 42% of the country’s territory is negatively affected by soil
erosion, while approximately 7% of the country’s area is subject to salinization.16 These processes have contributed
to the low productivity that prevails in Azerbaijan’s agriculture sector.2
The temperature increases that are projected under the model ensemble’s warming scenarios are likely to lead
to increased soil salinization in Azerbaijan. Higher temperatures and more frequent drought will lead to increased
evaporation, with farmers expected to respond by increasing their use of water for irrigation purposes.16 Given
the poor state of drainage systems in parts of the country,31 the evaporation of this additional irrigation water may
speed the process of salinization and damage agricultural productivity. Azerbaijan is prone to desertification, and
34
Chen, J. L., Pekker, T., Wilson, C. R., Tapley, B. D., Kostianoy, A. G., Cretaux, J.-F., & Safarov, E. S. (2017). Long-term Caspian Sea
level change. Geophysical Research Letters, 44(13), 6993–7001. URL: https://agupubs.onlinelibrary.wiley.com/doi/full/10.1002/
2017GL073958
35
Elguindi, N. and Giorgi, F. (2006). Projected changes in the Caspian Sea level for the 21st century based on the latest AOGCM
simulations. Geophysical Research Letters, 33(8). URL: https://agupubs.onlinelibrary.wiley.com/doi/full/10.1029/2006GL025943
36
Renssen, H., Lougheed, B. C., Aerts, J. C. J. H., de Moel, H., Ward, P. J., & Kwadijk, J. C. J. (2007). Simulating long-term Caspian
Sea level changes: The impact of Holocene and future climate conditions. Earth and Planetary Science Letters, 261(3), 685–693.
URL: https://research.vu.nl/en/publications/simulating-long-term-caspian-sea-level-changes-the-impact-of-holo-3
CLIMATE RISK COUNTRY PROFILE: AZERBAIJAN 16this phenomenon has been exacerbated in past decades by overgrazing, improper irrigation and farming practices,
and the removal of trees.37 As climate change increases the frequency of drought in the country, the process of
desertification may accelerate in the absence of sufficient mitigation measures. One study conducted at the global
level highlighted Azerbaijan as a hotspot for the expansion of more arid land covers.38
Economic Sectors
Agriculture
Agriculture is an important sector of the Azerbaijan economy, with approximately 58% of land area used for farming
and over 36.4% of employment taking place in this sector. Productivity in agriculture, however, is below the national
average, so that the sector only accounted for 5.0% of GDP on average from 2013 to 2017. Climate change in
Azerbaijan is expected to influence food production via direct and indirect effects on crop growth processes. Direct
effects include alterations to carbon dioxide availability, precipitation and temperatures. Indirect effects include
impacts on water resource availability and seasonality, soil organic matter transformation, soil erosion, changes in
pest profiles and the arrival of invasive species, and decline in arable areas due land degradation and desertification.
On an international level, these impacts are expected to damage key staple crop yields, even on lower emissions
pathways. Tebaldi and Lobell (2018) estimate 5% and 6% declines in global wheat and maize yields respectively
even if the Paris Climate Agreement is met and warming is limited to 1.5°C.39
As the projected effects of climate change are
realized over the coming decades, greater variability FIGURE 10. Boxplots showing the model
in precipitation, increased probability of drought and ensemble estimate of the annual number of
increased temperatures are likely to negatively impact very hot (Tmax >35°C) days in 2080–2099
the agricultural sector. The increase in the frequency under four emissions pathways in Azerbaijan.21
of extreme temperatures over 35°C, as shown below 100
90
in Figure 10, is a particular threat, likely damaging 80
crop yields. In many cases, increased temperatures will 70
60
also increase crop water demand. One study suggested
days
50
a potential demand increase of 16% by the 2030s 40
in eastern Azerbaijan.40 In combination with glacial 30
20
melting, transboundary competition for water resources, 10
and unpredictable rainfall patterns, there is potential for 0
Historical RCP 2.6 RCP 4.5 RCP 6.0 RCP 8.5
significant stress on irrigation systems. From the 30%
37
Government of Azerbaijan. (2005). NATIONAL ACTION PLAN on Strengthening Capacity to Respond to Challenges of Biodiversity
Conservation, Climate Change and Desertification / Land Degradation. URL: https://www.preventionweb.net/files/60655_
azerbaijan.pdf [accessed 14/02/2019]
38
Huang, J., Yu, H., Guan, X., Wang, G., & Guo, R. (2016). Accelerated dryland expansion under climate change. Nature Climate
Change, 6(2), 166–171. URL: https://doi.org/10.1038/nclimate2837
39
Tebaldi, C., & Lobell, D. (2018). Differences, or lack thereof, in wheat and maize yields under three low-warming scenarios.
Environmental Research Letters: 13: 065001. URL: https://iopscience.iop.org/article/10.1088/1748-9326/aaba48
40
Sadat, A. P., Bozorg, H. O., & Miguel, A. M. (2013). Climate Change Impact on Reservoir Performance Indexes in Agricultural
Water Supply. Journal of Irrigation and Drainage Engineering, 139(2), 85–97. URL: https://ascelibrary.org/doi/abs/10.1061/
%28ASCE%29IR.1943-4774.0000496
CLIMATE RISK COUNTRY PROFILE: AZERBAIJAN 17of agricultural land area that is irrigated produces over 80% of all agricultural output.31 This suggests that greater
variability in precipitation, increased probability of drought and increased temperatures are likely to exacerbate regional
and sectoral inequality in Azerbaijan, by having a disproportionately severe effect on rain-fed agriculture.
In the country’s NC3, the Ministry of Ecology and Natural Resources assesses the likely impact of climate change
on a number of agricultural subsectors. The cotton subsector, which has suffered from low productivity in recent
decades, is expected to benefit from higher temperatures and a longer growing season, although this benefit may
be offset by water shortages that are likely to affect irrigation of cotton fields. Subject to securing enough water
for irrigation, cotton productivity is expected to rise by 4–5% by the latter decades of the 21st century.
Rising temperatures are projected to lead to significant changes in the altitudes at which winter wheat and vineyards
may be planted in Azerbaijan by the end of the 21st century.31 In practice this will mean that vineyards, which are
currently most productive at altitudes of 800–900 m, will become productive at much higher altitudes of 1,400–1,700 m,
whereas winter wheat production will become viable above its current range of 1,600–1,800 m. This is likely to reduce
Azerbaijan’s productivity for these two land uses, because there is a shortage of suitable land at such altitudes relative
to the area under cultivation at the current productive altitudes.
There is considerable uncertainty surrounding the impact of climate change on summer and winter pasture growth
in Azerbaijan.31 Productivity in this subsector is positively related to soil moisture levels, which may be positively or
negatively affected depending on precipitation levels in the coming decades. The increased probability of drought
that the model ensemble projects will lead to greater volatility of production in this subsector. Any potential
improvement in productivity is likely to be counterbalanced by a lack of suitable land and continuing processes
of soil erosion.
A further, and perhaps lesser appreciated influence of climate change on agricultural production is through its impact
on the health and productivity of the labor force. Work by Dunne et al. (2013) suggests that labor productivity
during peak months has already dropped by 10% as a result of warming, and that a decline of up to 20% might
be expected by the 2050s under RCP8.5.41 In combination, it is highly likely that the above processes will have
a considerable impact on national food consumption patterns both through direct impacts on internal agricultural
operations, and through impacts on the global supply chain.
Energy
Research has established a reasonably well constrained relationship between heat stress and labor productivity,
household consumption patterns, and (by proxy) household living standards. 42 In general terms the impact of
an increase in temperature on these indicators depends on whether the temperature rise moves the ambient
temperature closer to, or further away from, the optimum temperature range. The optimum range can vary depending
on local conditions and adaptations.
41
Dunne, J. P., Stouffer, R. J., & John, J. G. (2013). Reductions in labour capacity from heat stress under climate warming. Nature
Climate Change, 3(6), 563–566. URL: http://www.precaution.org/lib/noaa_reductions_in_labour_capacity_2013.pdf
42
Mani, M., Bandyopadhyay, S., Chonabayashi, S., Markandya, A., Mosier, T. (2018). South Asia’s Hotspots: The Impact of
Temperature and Precipitation changes on living standards. South Asian Development Matters. World Bank, Washington DC.
URL: http://documents.worldbank.org/curated/en/201031531468051189/pdf/128323-PUB-PUBLIC-DOC-DATE-7-9-18.pdf
CLIMATE RISK COUNTRY PROFILE: AZERBAIJAN 18You can also read