The Quality of Government Expert Survey 2020
←
→
Page content transcription
If your browser does not render page correctly, please read the page content below
The Quality of Government
Expert Survey 2020
(Wave III): Report

Marina Nistotskaya
Stefan Dahlberg
Carl Dahlström
Aksel Sundström
Sofia Axelsson
Cem Mert Dalli
Natalia Alvarado Pachon

WORKING PAPER SERIES 2021:2
QoG THE QUALITY OF GOVERNMENT INSTITUTE
Department of Political Science
University of Gothenburg
Box 711, SE 405 30 GÖTEBORG
March 2021
ISSN 1653-8919
© 2021 by Marina Nistotskaya, Stefan Dahlberg, Carl Dahlström, Aksel Sundström, Sofia Axelsson, Cem Mert
Dalli & Natalia Alvarado Pachon. All rights reserved.
The Quality of Government Expert Survey 2020

                                         (Wave III): Report*

Marina Nistotskaya†1 , Stefan Dahlberg2 , Carl Dahlström1 , Aksel Sundström1 , Sofia

                Axelsson1, Cem Mert Dalli ‡1, and Natalia Alvarado Pachon §1

                                         1
                                             University of Gothenburg
                                             2
                                                 Mid Sweden University

                                                    March 15, 2021

   *Marina Nistotskaya is the principal investigator of the research project. The authors would like to thank the experts
who took part in the project for generously sharing their knowledge with the research community. We would also like to
thank our colleagues at the V–Dem Institute — particularly, Brigitte Seim, Daniel Pemstein, and Johannes von Römer —
and at the Department of Political Science, University of Gothenburg — particularly, Jon Polk — for their suggestions
and assistance regarding the methodology of anchoring vignette and computational methods.
   †marina.nistotskaya@gu.se
   ‡cem.mert.dalli@gu.se
   §natalia.alvarado@gu.se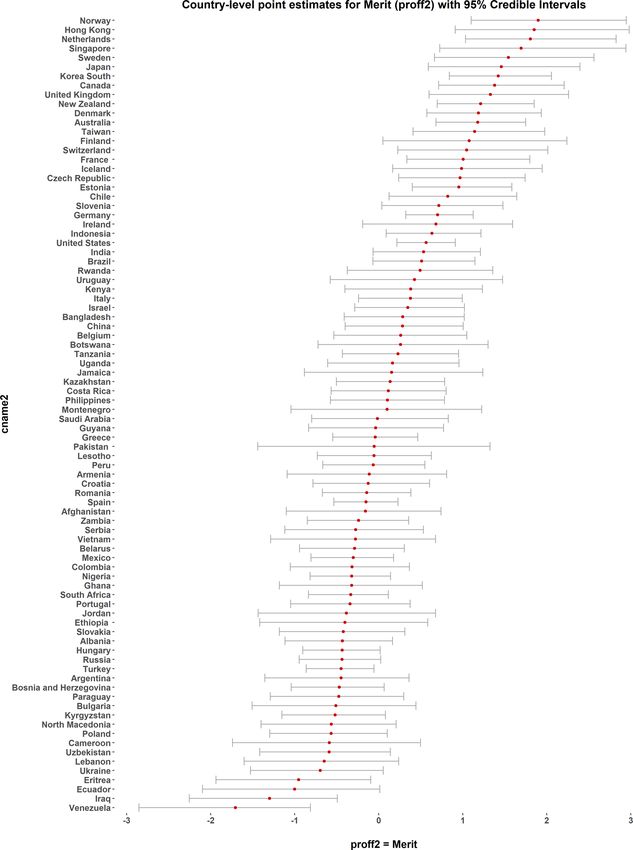
Abstract

   The Quality of Government Expert Survey (QoG Expert Survey) is a research project aimed

at documenting the organizational design of public bureaucracies and bureaucratic behavior in

countries around the world. This report documents the design and implementation of the third

wave of the QoG Expert Survey, and initial analysis of the new data. The QoG Expert Survey

2020 produced ten country-level indicators, pertaining to bureaucratic structure (meritocratic re-

cruitment, security of tenure, closedness) and bureaucratic behavior (political interference into

day-to-day bureaucratic decision-making and impartiality). The data is based on the assessments

of more than 550 experts, carefully selected for their contextual subject-matter knowledge. The

experts took part in the research pro bono. The main innovation of the third wave is the use of

anchoring vignettes and Item-Response Theory (IRT)-based aggregation techniques to produce

point estimates that account and adjust for systematic differences in expert subjective assess-

ments and variation in expert reliability. The resulting indicators are internally coherent and also

correlate well with other well-established measures for the same concepts. The strength of the

association between the data from 2020 and the two previous waves of the survey suggests that

the data is likely to measure the same underling phenomena, while offering enough variability

over time to be used in time-series analysis.

                                                 2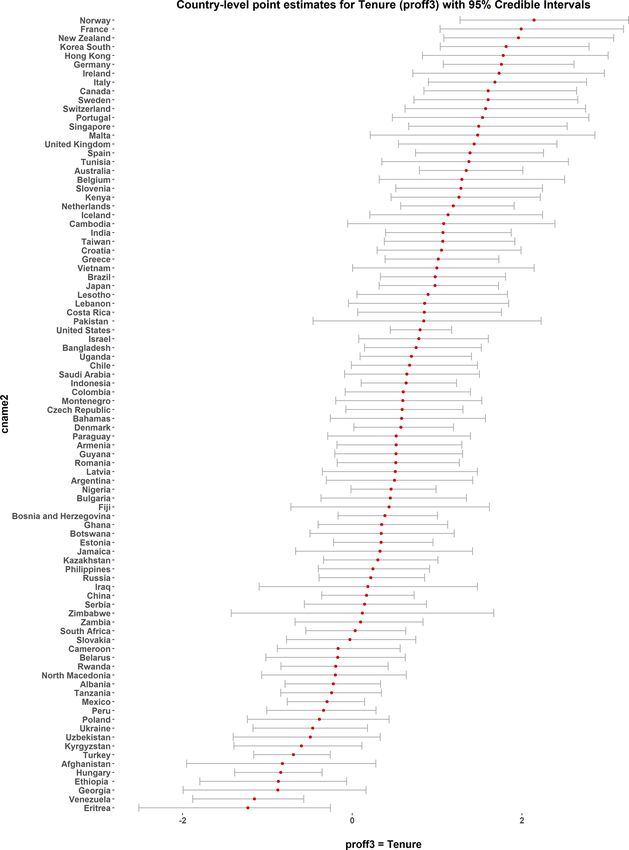
1    Introduction

The Quality of Government (QoG) Expert Survey 2020 is the third iteration of a well-established

research project by the Quality of Government Institute at the University of Gothenburg. The project

is motivated by the lack of observational data pertaining to bureaucratic organization and practices

(Dahlström et al., 2015). The aim of the survey is to empirically capture the organizational design of

public bureaucracies and bureaucratic behavior in countries around the world.

Conceptually, the project is underpinned by two theoretical frameworks. The first — the Weberian

bureaucracy framework — associates a set of organizational features of public bureaucracies with

developmental outcomes (Weber, 1978). Although Max Weber laid out a theory of developmental

bureaucracy more than 100 years ago, empirical research testing the effects of Weberianism only

began in the 1990s with a pioneering work by Peter Evans and James Rauch (Evans & Rauch, 1999;

Rauch & Evans, 2000). In their seminal effort, Evans and Rauch mapped the bureaucratic structures

in 35 less developed countries with regard to several prominent features of Weberian bureaucracy:

meritocratic recruitment, career security, promotion and remuneration. Meritocratic recruitment, ca-

reer security and openness/closedness became the features from Weber’s original characterization of

developmental bureaucracy that have attracted the most attention of scholars of comparative bureau-

cracy (Boräng et al., 2018; Charron et al., 2017; Cingolani et al., 2015; Cornell et al., 2020; Dahlström

et al., 2012; Krause et al., 2006; Lapuente & Nistotskaya, 2009; Lapuente & Suzuki, 2020; Lewis,

2007; Miller & Whitford, 2016; Nistotskaya & Cingolani, 2016; Oliveros & Schuster, 2018; Rauch,

1995; Suzuki & Hur, 2020; Ting et al., 2013).

The second theoretical framework — quality of government as impartiality — argues that impartiality

in the exercise of public authority is the key behavioral attribute of public bureaucracy that leads to

socially valued outcomes (Rothstein & Teorell, 2008). Empirical studies showed that impartiality of

government, measured through expert assessments or citizen perceptions, is associated with increased

entrepreneurship rates (Nistotskaya et al., 2015), aggregate economic growth (Ahlerup et al., 2016),

innovation (Suzuki & Demircioglu, 2019), lower electorate support for populist parties (Agerberg,

2017), and other socially desirable outcomes.

                                                    1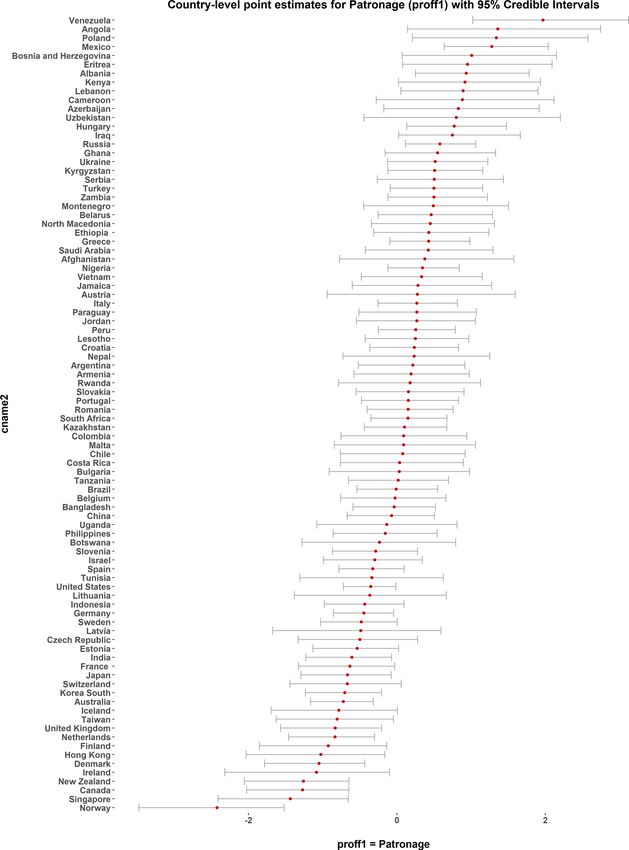
The project began in 2008 with the first wave of the QoG Expert Survey (Dahlström et al., 2010), and

the second survey was carried out in 2014 (Dahlström et al., 2015). In each of these waves more than

1,000 public administration scholars world-wide offered their judgements on such issues as the extent

of meritocratic recruitment, career stability, internal promotion, impartiality, openness/closedness,

women in public administration and many more. The QoG Expert Survey 2015 (Dahlström et al.,

2015) produced 59 country-level indicators for 159 countries and became an established source of

data in empirical research on institutional quality.

Expert data, however, is a subject of critique for probable measurement error due to differences in a)

how experts build their opinions and how they translate them into the ordinal scales (response options)

imposed by researchers (the so-called problem of differential item functioning) and b) variation in

expert reliability (Marquardt & Pemstein, 2018; Marquardt et al., 2019) that may produce biased

results in statistical analyses (Lindstadt et al., 2020; Marquardt, 2020). In the third wave of the survey

we address and adjust for these issues by applying anchoring vignettes and computational techniques

based on Item-Response Theory (IRT).

This report proceeds as follows: in section 2 we discuss the operationalization of the main concepts;

in section 3 we present the survey instrument; section 4 describes the process of fielding the survey

online; in section 5 we briefly describe the corps of experts and discusses whether their individual

characteristics impact their assessments; section 6 describes the methodology behind our country-

level point estimates; section 7 presents our data — ten country-level indicators; section 8 tests the

content, convergence and construct validity of the indicators; section 10 compares data from 2020

with that of 2015; section 11 summarizes the main takeaways.

2    Concepts and their operationalization

We operationalize the concept of Weberian bureaucracy through meritocratic recruitment (and its op-

posite — patronage), security of tenure and closedness. Meritocratic recruitment is an organizational

feature, where individual merits — such as education, knowledge, skills and job-related experience

— constitute the main grounds for hiring to bureaucratic positions. Conversely, recruitment predi-

                                                    2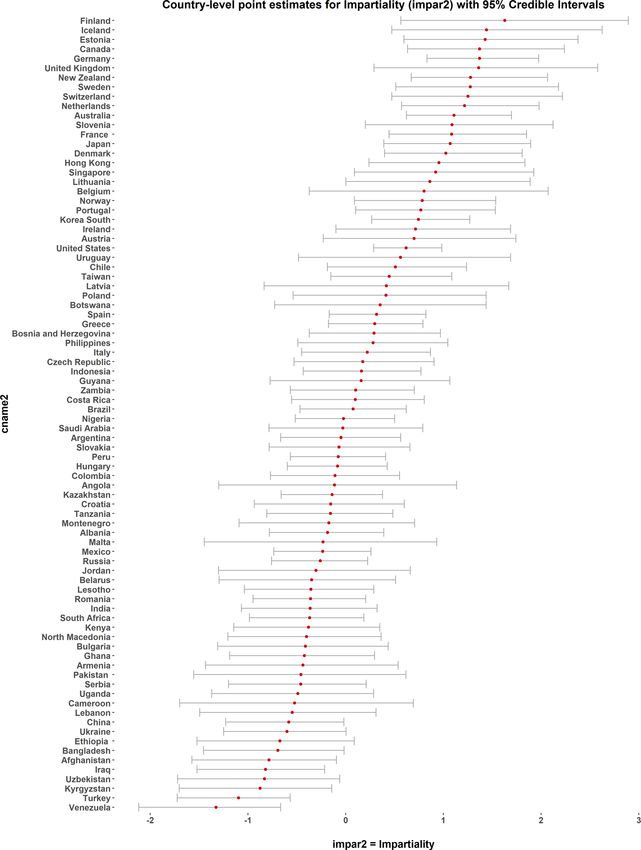
cated upon the political and/or personal connections of the applicant is opposite to merit, as embodied

in such empirical phenomena as nepotism, different forms of cronyism,1 and partisanship. Security

of tenure refers to the organizational practice in which no arbitrary dismissals take place, and legal

provisions specifying the circumstances and reasons for dismissal from office are observed in real-

ity. Following the QoG Expert Survey tradition (Dahlström et al., 2010), we call this vector of the

structural characteristics of public bureaucracies Professionalism.

In line with the literature that argues that Closedness is another dimension of bureaucratic organiza-

tions (Lœgreid & Wise, 2007; Silberman, 1993) that is distinctive from Professionalism (Dahlström et

al., 2010, 2012), we operationalize closed public bureaucracies as organizations in which

    • new employees are normally hired to the lowest-level positions and vacant positions at a rela-

      tively high level of responsibility (mid-career) are opened only to the current employees of the

      organization;

    • hiring to bureaucratic agencies involves formal civil service examination (in contrast to the

      hiring process in the private sector, involving a resume check and interview, but not an exam);

    • human resource management is regulated by a set of laws and regulations applicable only to

      the public sector (including government), which is different from the country’s labor code.

We expect the individual characteristics of each of the dimensions to be highly correlated: merit and

tenure is expected to be positively correlated, and patronage is expected to be negatively correlated

with both merit and tenure. Similarly, all three properties of the closedness dimension are expected

to be positively correlated. However, Professionalism and Closedness do not need to go hand in hand

in the sense that a less politicized bureaucracy should not also be a more “closed” one. We, therefore,

expect the Professionalism and Closedness indices to be uncorrelated.

With regard to bureaucratic behavior, we focus on impartiality and operationalize it in line with the

definition by Rothstein & Teorell (2008). They define impartiality as follows: “when deciding upon a

case, a public official should not take into consideration anything about the applicant’s circumstances,
   1For
          example, friendism and its most recent cousin chumocracy (Conn et al., 2020).

                                                          3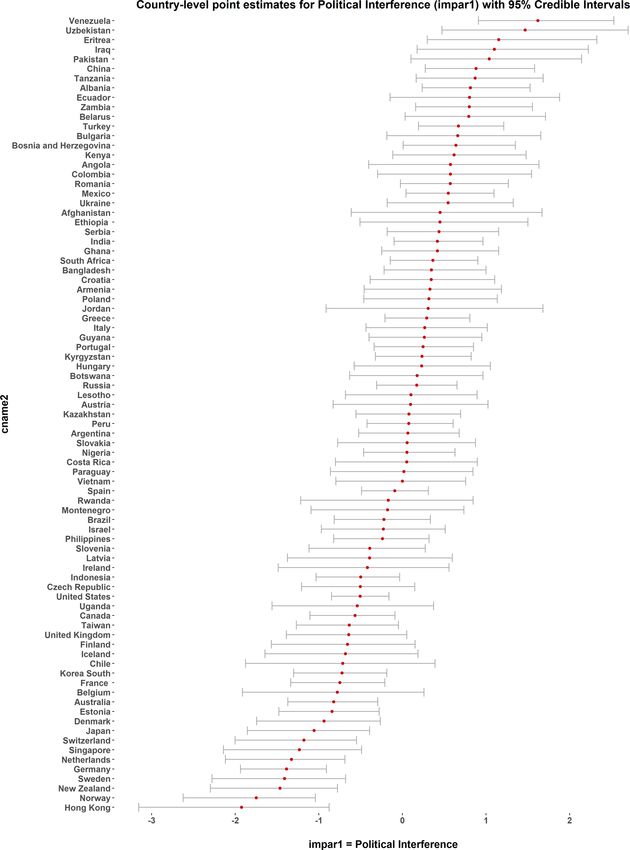
which is not stipulated in policy or law beforehand” (Rothstein & Teorell, 2008, p. 170). Following a

large political economy literature (Lewis, 2007; Miller, 2000; Miller & Whitford, 2016; Nistot- skaya

& Cingolani, 2016), we consider day-to-day interference by individual political figures into

bureaucratic decision-making the largest threat to bureaucratic impartiality. We expect our measures

of Impartiality and Politicization to be strongly negatively correlated.

To capture the above postulated properties of bureaucratic structure and bureaucratic behavior, we

developed a questionnaire, which is discussed next.2

3     Questionnaire

The questionnaire consists of three parts. Part one has eight questions, pertaining to the bureaucratic

structure and bureaucratic behavior in the central government of the country of their selection.3 Six of

eight questions pertain to organizational design and two to behavioral attributes. All eight questions,

including preambles and response options can be found in Appendix A.

Part two of the questionnaire contains anchoring vignettes — short hypothetical scenarios that ex-

perts assess, thereby providing information that allows researchers to “anchor” differing expert as-

sessments to a more consistent scale. The QoG Expert Survey’s vignettes describe hypothetical

situations regarding the recruitment to public bureaucracy, career stability, interference of politicians

into day-to-day bureaucratic decision-making and the extent to which bureaucrats follow the letter of

the law when dealing with individual cases. There are no vignettes pertaining to the concept of

openness/closedness.

The vignettes were designed using best practice, and we benefited from advice and discussions with

colleagues with expertise on the matter at the Department of Political Science, University of Gothen-

burg, and worldwide. The vignettes mention neither specific country, nor time period, and require
   2Since the main innovation of this survey is the use of anchoring vignettes, and given that experts take part in the

survey pro bono and their time is a precious commodity, we had to limit the number of vignettes presented to experts.
We, therefore, selected key properties that have generated the most scholarly interest.
   3We focus on the central government (not on the country’s public bureaucracy more generally as it was in the previous

rounds) in order to achieve a higher precision of expert assessments. We found a strong association between indicators
from all three waves of the survey (see Section 10 for more detail), suggesting that experts treat the central government’s
bureaucracy as equivalent to the country’s bureaucracy.

                                                          4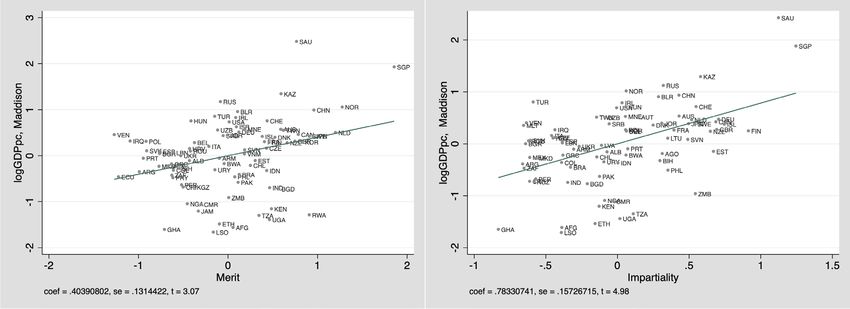
no specific knowledge to assess the case. Experts were informed that the vignettes were designed to

help the researchers to create better country-level measures, and not as a check on their expertise. Ap-

pendix A provides three vignettes on Patronage by way of example. The description of all vignettes

is available upon request. Section 6 discusses in more detail the use of information from anchoring

vignettes for estimating latent values.

Part three of the questionnaire contains questions regarding the personal characteristics of the experts,

including their highest level of education, work place, working experience, self-assessment of their

subject-matter knowledge, as well as age, gender, country of origin and country of current residence.

All background questions are provided in Appendix A.

4     Fielding the survey online

The link to the pilot survey was distributed to 127 experts, randomly selected from the QoG’s pool

of experts, in September 2019, and by the end of October 2019 twenty-three experts had filled in the

pilot questionnaire. In the pilot version all questions were vignetted, with four vignettes per

Professionalism and Impartiality question, each targeting a relative distance between two specific

response categories on the 5-point response scale. For the Closedness questions, one vignette per

question was designed.

Nineteen responses containing answers to all the vignettes were subjected to the vignette diagnostics

as per King & Wand (2007), using the software package “Anchors” in R (Wand et al., 2011). By

analyzing whether and to what extent the respondents violated the predefined order of vignettes (i.e.

by ranking a high-intensity vignette lower than a low-intensity vignette), we were able to assess the

success of the vignettes. Our analysis of the pilot vignettes suggested that some vignettes exhibited

substantial ordering inconsistency across experts, and therefore were not an effective tool in providing

information about expert thresholds.4

Based on this analysis, together with the respondents’ feedback that the survey was particularly time-
    4This situation is not uncommon. For example, the Varieties of Democracy (V-Dem) project replaces about 20 percent

of all vignettes each round (Pemstein et al., 2018, p.9).

                                                         5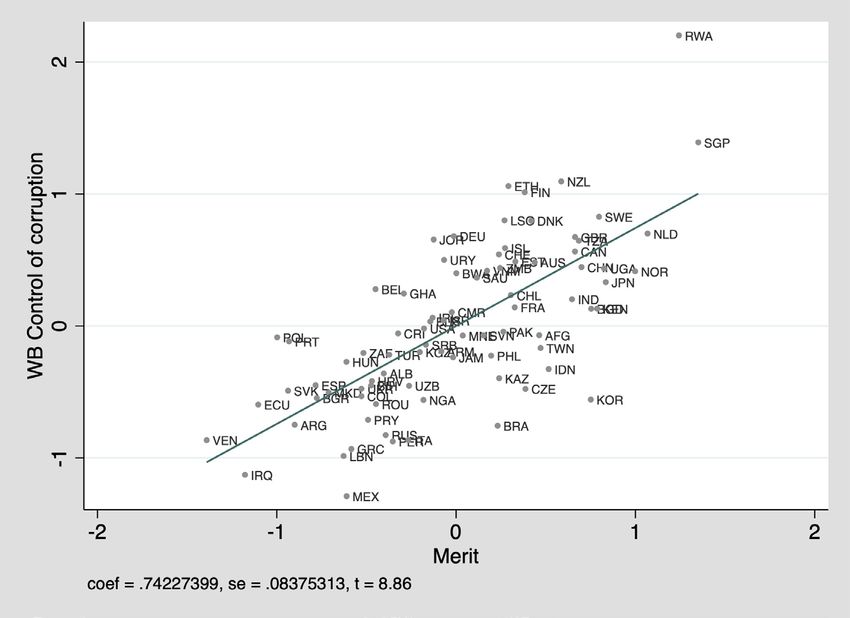
consuming, the vignettes were edited, re-written or dropped altogether. Specifically, the vignettes for

the binary questions about closedness were dropped, and for the remaining questions three vignettes

per question were retained. This reduction was not merely an issue of dropping the fourth vignette;

instead, the vignettes were edited or rewritten so as to more coherently reflect low-intensity, mid-

intensity and high-intensity scenarios corresponding to the particular question item. This effectively

reduced the total number of vignette questions from 24 to 15.

In order to increase our country coverage and make better estimates for each country, we conducted a

new expert recruitment campaign. First, we published a call for experts on the Quality of Government

Institute’s website and its social media accounts. Second, for several countries particularly low on

the number of experts, we reached out to those country experts who had already answered the survey

with a request to recommend experts. Third, we continued to identify country experts by scanning

relevant academic journals and the websites of targeted universities and NGOs. With these efforts, we

were able to make a significant contribution to the expert pool and, ultimately, the overall response

rate of the final survey.

The main survey was fielded between December 2019 and June 2020. In December 2019 the survey

link was sent to more than 6,000 experts from the QoG Institute’s pool of experts, of whom 996

individuals responded to at least the first part of the questionnaire, and 822 individuals completed the

first and second (vignettes) parts of the survey.

Respondents could select the language of the questionnaire. The overwhelming majority of them (86

percent) selected the questionnaire in English, followed by the Spanish, Russian and French language

questionnaires (7, 4 and 3 percent respectively).

Section 5 below discusses in more detail the individual characteristics of the experts that took part in

the survey and whether these characteristics affected expert assessments.

                                                    6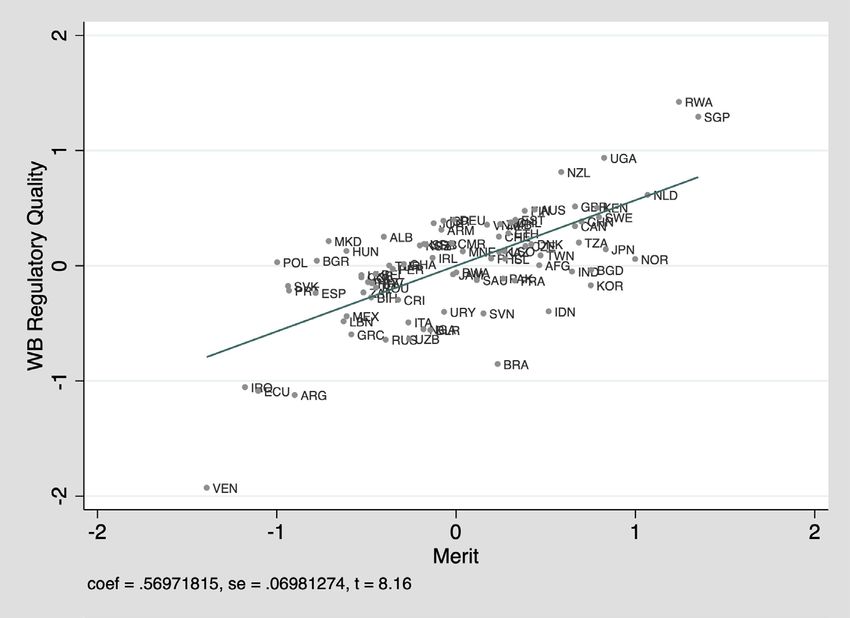
5       Experts

The Quality of Government Institute at the Department of Political Science at the University of

Gothenburg (Sweden) maintains a pool of country experts on bureaucratic structures and bureau-

cratic behavior in countries around the world. The pool was first assembled in 2008 and has been

periodically updated by adding newly identified individuals. We identify experts among scholars from

those with a record of peer-reviewed publication on public bureaucracy matters; professionals from

donor organizations (such as USAID or SIDA, the U.S. and Swedish government agencies for de-

velopment cooperation) or international organizations (such as the World Bank, IMF, Inter-American

Development Bank) working on administrative reforms, international and national non-governmental

organizations; and government officials with proven knowledge on their country’s bureaucratic struc-

ture and behavior.

The number of experts varies from question to question: from 1 to 42 respondents. Table B.1 of the

Appendix reports countries with less than three experts per country, and Table B.2 reports countries

with more than three experts per country. Given the natural process of attrition,5 not all QoG experts

provided the vignette responses. Nonetheless, 822 respondents provided responses to both part one

of the survey and all the vignettes. Thus, the response rate for the vignette part is 83 percent, which

is on a par with the return in projects employing paid coders, such as V-Dem (Pemstein et al., 2018,

p.9).

Below we provide some descriptive statistics regarding these 822 experts. The overwhelming major-

ity of these respondents (79 percent) provided assessments for the country in which they live, while

only 27 experts filled in the survey for more than one country.

Gender: 72 percent of these experts are male and 27 percent are female, with the rest selecting either

“Other” or “Prefer not to say” options (N=816).

Age: the largest share of respondents (40 percent) are aged 36-50, followed by a group aged 51-65

(37 percent). Experts older than 65 years make up 17 percent of all respondents. The age group 25-35
    5“Wearing
                away” or progressive loss of data in research, when respondents drop out of research for a variety of
reasons.

                                                         7
constitutes 6 percent of all experts who completed the survey. There is only one expert younger than
25 years (N=815).
Education: the overwhelming majority (81 percent) of experts reported having a PhD degree, fol-
lowed by an MA-level degree (17 percent) and the remaining 2 percent reported a BA-level degree
(N=816).
Employment: nearly three quarters of all experts (71 percent) work at a public or private university.
Experts employed in the third sector make up 9 percent of the sample and another 3 percent work in
the private sector. Those working in the public sector constitute 6 percent, including 4 percent of
those who work in the central government. Finally, 11 percent of the experts chose “Other” as their
current employer (N=813).
Experience: the majority of the experts (38.5 percent) have worked in their current employment for
more than 16 years. Those who have worked between 2 and 10 years make up 37 percent of all
respondents. 17.5 percent have worked between 11 and 16 years, and 7 percent have worked less
than 2 years (N=813).
Self-evaluation of contextual knowledge: almost 70 percent of the experts evaluated their knowledge
of bureaucratic structures and bureaucratic behavior in the central government of their chosen country
as 6 or 7 on a 7-point scale. Another 20 percent self-assessed their knowledge as 5 (N=813).
5.1 Individual-level determinants of expert assessments
Before proceeding with the aggregation of expert assessments, we ran a series of regression analy-
ses between individual expert assessments and their background characteristics. Previous research
has suggested that an expert’s background can influence their perception of latent traits of complex
empirical phenomena (for a review see, Marquardt (2020)). This literature points to gender, age,
education, employment, and self-assessment of the knowledge of the case as factors that may affect
assessments in a systematic way.
In our first analysis the outcome variables are the answers that the experts gave to the questions
8in part one of the questionnaire, i.e. their assessments of bureaucratic structure and bureaucratic
behavior.6 After the exclusion of missing values and “Don’t know” answers from the outcomes
variables, the number of observations is 780. The explanatory variables are six variables capturing
expert background: gender, age, education, workplace, work experience (years), self-assessment of
subject-matter knowledge. We dichotomize the workplace variable: 1 = experts with university
education, 0 = else.
Table C.1 of the Appendix reports OLS regressions estimates. Overall, we find little evidence of a
consistent substantial relationship between expert characteristics and their assessments. The most
consistent relationship is between university employment and assessments: the coefficient for this
dummy variable enters statistically significant in six out of eight assessments. In all regressions this
coefficient is negatively signed: on average university staff tend to evaluate bureaucratic structure as
less Weberian and bureaucratic behavior as less impartial. The university employment variable also
has the largest magnitude of all: up to a third of one step of the assessment scale. We replicated this
analysis, controlling for country fixed effects (Table C.2 of the Appendix) to find the results to be
substantively the same. Furthermore, we replicated the above analysis using the sample of experts
coming from countries for which at least three experts answered part one of the questionnaire (N of
experts = 568, N of countries = 101), to find the results to be substantively the same as those reported
in Table C.2.7 In sum, expert characteristics do not seem to affect assessments in a systematic way.
6 Computing country-level estimates for latent variables
Impartiality, meritocratic recruitment, closedness are, as are many other concepts in political sci-
ence, complex concepts, for which there is no clear way to quantify objectively. Researchers and
practitioners alike use expert assessments to measure concepts that are difficult to measure directly.8
The QoG Expert Survey asks experts to quantify the extent to which a given case “embodies” such
6This
includes the experts who did not answer the vignette part of the questionnaire.
7The
results of this analysis are not reported in this document, but are available upon request.
8For example, in addition to multiple research projects that use experts to capture complex concepts, the International
Country Risk Guide by the commercial PRC Group has provided the “Quality of Bureaucracy” indicator for 140 countries
since 1984 as part of its political, economic, and financial risk ratings.
9concepts as impartiality by selecting an answer on an ordinal scale (from low to high). The root
problem with expert assessments of complex concepts is that experts are likely to recall different
empirical manifestations of a phenomenon. For example, for meritocratic recruitment, one expert
may think of the frequency of job advertisements in the media, while another may think of whether
such job advertisements describe the educational requirements for candidates in sufficient detail; yet,
the third may focus only on whether the selection procedure involves formal examination or not. In
other words, different expert are likely to recall different empirical manifestations of a complex phe-
nomenon when making their assessment of a case. Furthermore, when building their assessment on
several pieces of relevant information, experts are likely to give some information more weight than
others. Finally, experts need to place their assessments on ordinal scales (answer options) developed
by researchers. The difference between answer options (thresholds) — such as, “Only a few of the
appointments are based on merit” and “Almost no appointments are based on merit” — is open to
interpretation. Experts are very likely to understand these differences idiosyncratically and apply
these thresholds differently: being more or less strict. These problems, known as differential item
functioning (DIF), are a major threat to the validity of expert data. DIF can be found both between
experts within the same country (Marquardt et al., 2019) and across countries (Bakker et al., 2020),
and could be the result of both the observable (e.g. working experience, place of employment) and
unobservable individual differences between experts.
In order to account and adjust for DIF, we apply — following the literature (Bakker et al., 2020; King
& Wand, 2007; Marquardt & Pemstein, 2018) — anchoring vignettes, which allow us to “anchor”
expert individual interpretations of the Likert scales (answer options) to a consistent scale. Anchoring
vignettes are short descriptions of imaginary scenarios that are designed in such a way as to gather
information about the expert’s parameters for thresholds and then to estimate these threshold param-
eters. We then incorporate these estimates into computations of the country-level indicators for our
main concepts of interests: meritocracy, security of tenure and impartiality. To compute our country-
level estimates we used information from experts who answered all three vignettes per question (with
at most one ordering violation, including ties) and at a minimum three experts per country.9
9This inclusion decision yielded the following number of responses per question: proff1(Patronage) = 553,
proff2(Merit) = 562, proff3(Tenure) = 542, impart1(Political Interference) = 546 and impar2(Impartiality) = 528.
10Our computation approach follows the two Item-Response Theory (IRT) models of DIF by Marquardt
& Pemstein (2018). While the ibeta model is built on “expert-specific intercepts, holding ordinal
threshold constant across experts, the beta model is built on “expert-specific ordinal thresholds for
mapping between latent and question scales” (Marquardt & Pemstein, 2018, p.432). In other words,
the first model assumes that experts systematically over- or underestimate latent values. For example,
there is no broad agreement between experts that bureaucracy in this country is largely filled through
political/personal connections. On the other hand, the second model assumes that experts largely
agree that bureaucracy in this country is based on political/personal connections, but disagree on the
extent to which this is the case. The second model is “more general, since intercept DIF is a specific
form of threshold-specific DIF. However, this more general parameterization demands much of the
available data...” (Marquardt & Pemstein, 2018, p.432). Marquardt & Pemstein (2018) showed that
the chosen IRT models perform better than other IRT models that do not account for DIF and variation
in expert reliability, as well as non-IRT models such as Bayesian Aldrich-McKelvey (BAM) scaling
Aldrich & McKelvey (1977).
We computed the estimates using STAN programming language in R interface (Stan, 2020). For each
variable, we ran the code four chains for 20,000 iterations with 5,000 warm-ups and a thinning
interval of 20.
7 Country-level estimates
We calculated both the beta and ibeta country-level point estimates of the latent concepts of interest
and quantified uncertainty around these point estimates for at least 83 (Political Interference variable)
and at most 90 (Patronage variable) countries. The estimates are available for almost all European
countries, as well as the USA, Canada, Australia and New Zealand. But the coverage in Africa, Asia
and Latin America is less full. Table D.1 of the Appendix reports the number of countries in each of
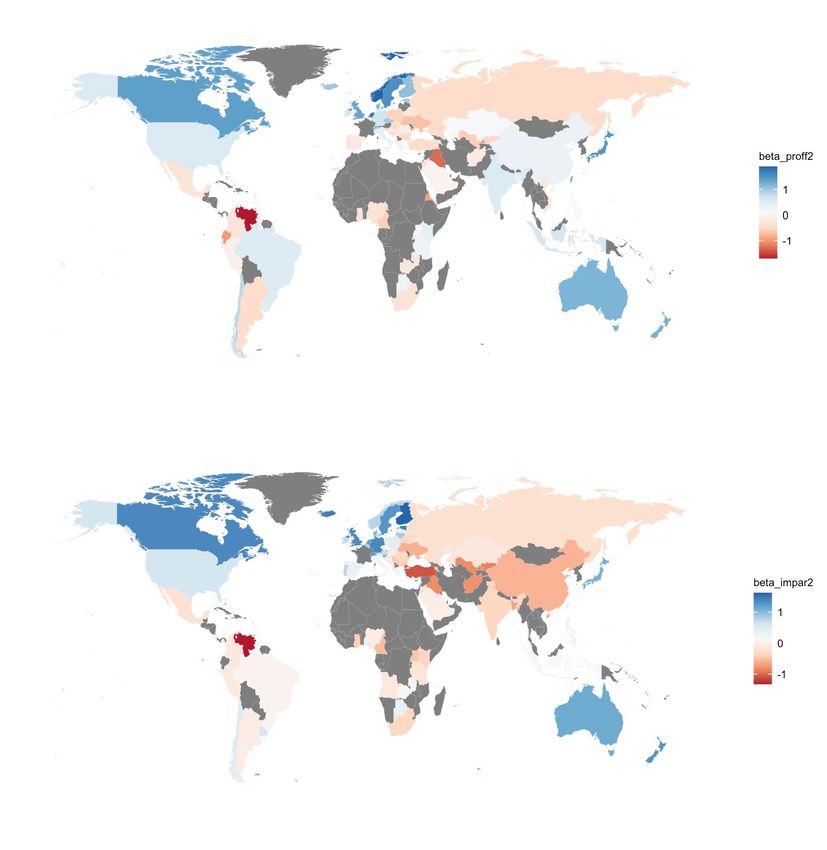
the major geographic regions for which estimates are available. Figure D.1 of the Appendix presents
spatial distribution of Merit and Impartiality across the globe.
Because beta and ibeta estimates are correlated at a very high level (r = .98***) and given a higher
11generalizability of the beta model (Marquardt & Pemstein, 2018), we provide a set of beta country-
level point estimates and measures of uncertainty. All estimates were recorded in such a way that
higher values of Merit, Tenure and Impartiality stand for more meritocratic and impartial bureaucracy,
and higher values of Patronage and Political Interference stand for more patrimonial and less impartial
bureaucracy. Figures D.2, D.3, D.4, D.5, and D.6 in the Appendix report country-level point estimates
with the associated credible intervals for all five latent concepts of interest.
In addition, Table F.4 in the Appendix reports country-level indicators for all ten variables produced
by the QoG Expert Survey 2020, including the estimates for five latent variables, simple averages for
three variables of the Closedness dimension of bureaucratic structure and two indices (Professional-
ism and Closedness), constructed with the help of Principal Component Analysis (PCA).
8 Validation
We demonstrate the validity of our measures by following the framework developed by Adcock &
Collier (2001). We show: a) content validity by demonstrating that our measures of bureaucratic
structure align with our two-dimensional conceptualization of welfare-enhancing public bureaucracy
and the indicators for bureaucratic behavior align well with the concept of impartial bureaucracy;
b) convergence validity by showing that they have the theoretically expected relationships with in-
dicators that measure similar concepts and c) construct validity by showing that the measures of
bureaucratic structure and bureaucratic behavior produce the theoretically expected results in regres-
sion analyses.
8.1 Content validity
As discussed above, we expect individual measures of Professionalism, Closedness and Impartiality
to be associated to a high degree. Specifically, Merit is expected to be positively associated with
Tenure, and negatively associated with Patronage. Relatedly, Patronage and Tenure are expected to
be negatively correlated. We expect the individual characteristics of Closedness to be correlated to
12each other, but to be uncorrelated, or at best weakly correlated, with the measures of Professionalism.
Finally, two measures of bureaucratic behavior (Political interference and Impartiality) are expected
to be negatively correlated with each other.
Figure 1 illustrates the relationship between different attributes of the Professionalism dimension of
bureaucratic structures (with the grey lines depicting the averages). As can be seen, Merit is strongly
negatively associated with Patronage (r = -.88***), and strongly positively with Tenure (r = .73***).
Patronage and Tenure are also strongly negatively related (r = -.72***).
Figure 1: Association between Merit, Tenure and Patronage
Note: Left panel: scores for Merit (X axis) and Patronage (Y axis), r = -.88***, N = 82. Right panel: scores
for Merit (X axis) and Tenure (Y axis), r = .73***, N = 82.
The variables pertaining to the Closedness dimension are only weakly correlated with each other,10but
they still load on one dimension in principal component analysis, allowing us to create a new variable
— Closedness Index.
As argued above, we expect Professionalism and Closedness to be orthogonal structural dimensions.
Figure 2 illustrates the relationships between Merit, Tenure and Closedness Index, supporting this
expectation. As can be observed, countries with high values on Merit exhibit varying levels of closed-
ness. For example, New Zealand and Switzerland have meritocratic open bureaucracies, while Japan
and South Korea have meritocratic closed bureaucracies (Figure 2, left panel). At the same time,
countries with low values on Merit can have both open (Zambia) and closed (Lebanon or Vietnam)
bureaucracies. A similar pattern is observed with regard to Tenure protection (Figure 2, right panel).
10The
strongest relation is between Examination and Special Laws (r = .29**), followed by between Entry at the
Lowest Level Only and Examination (r = .24**) and the weakest link is between Entry and Special Laws (r = .17*).
13Figure E.1 of the Appendix depicts association between Merit and each of the indicators of Closed-
ness.
Figure 2: Association between Merit, Tenure and Closedness Index
Note: Left panel: scores for Closedness Index (X axis) and Merit (Y axis), r = -.17, N = 85. Right panel: scores
for Closedness Index (X axis) and Tenure (Y axis), r = .09. N = 90.
Furthermore, Figure 3 depicts the association between the Professionalism and Closedness indices.11
The overall pattern is of a non-linear relationship between Professionalism and Closedness: highly
professional bureaucracies can be both open and closed organizations.
Figure 3: Association between Professionalism Index and Closedness Index
Note: Scores for Closedness Index (X axis) and Professionalism Index (Y axis). r = -.08. N = 80
Finally, we expect the two measures of bureaucratic behavior to be strongly negatively associated
11Professionalism
Index is constructed with the help of Principal Component Analysis. Merit, Patronage and Tenure
are loaded on the same dimension, which predicted scores are used as Professionalism Index.
14with each other. Indeed, as Figure 4 suggests, in countries where political interference into the day-
to-day bureaucratic decision-making is high, impartiality is low (e.g. Venezuela, Uzbekistan, or Iraq),
and vice-versa: where political interference is low, impartiality is high (e.g. New Zealand, Sweden or
Germany).
Figure 4: Association between Political Interference and Impartiality
Note: Scores for Impartiality (X axis) and Political Interference (Y axis). r = -.82***, N = 77.
Overall, the presented indicators tend to be associated with each other in the direction dictated by their
conceptualizations. The measures of Professionalism exhibit very high cohesion, while indicators on
Closedness are only weakly related to each other, suggesting avenues for future research, first of all,
in terms of improved conceptualization. Individual measures of Closedness still load on a single
factor in the PCA analysis, as do measures of Professionalism, enabling associational analysis
between them. The analysis provided support for the expectation that these two structural dimensions
of bureaucracies are orthogonal. The indicators of bureaucratic behavior are internally cohesive as
per the concept of impartial bureaucracy.
8.2 Convergence validity
To assess the convergence validity of our measures we analyze the association between our indicators
and 1) V-Dem indicators of meritocratic recruitment and bureaucratic impartiality;12 and 2) ICRG’s
12The
V-Dem meritocracy question (textit v2stcritrecadm is as follows: “To what extent are appointment decisions in
the state administration based on personal and political connections, as opposed to skills and merit?”. The followed up
15measure of bureaucratic quality. We expect to observe strong correlations between our indicators and
existing measures of meritocratic bureaucracy and impartiality, and indeed our estimates are strongly
correlated with the V-Dem and ICRG measures. Specifically, the measures of the concept of
meritocratic recruitment, produced by QoG and V-Dem, are strongly positively correlated (r =
.80***). Similarly, the QoG and V-Dem measures of impartial bureaucracy are positively associated
at an even higher level (r =.82***). Figure 5 provides a visual representation of these relationships.
Figure 5: Association between measures of Merit and Impartiality by QoG and V-Dem
Note: Left Panel: scores for Merit QoG (X axis) and Merit V-Dem (Y axis). r = -.80***, N = 85. Right panel:
score for Impartiality QoG (X axis) and Impartiality V-Dem (Y axis), r = .83***, N = 83.
Merit (QoG) is also positively associated with the ICRG’s indicator “Bureaucratic Quality” (r =.74***),
while Patronage is associated with the same indicator negatively (r = -.68***). Similarly, the ICRG
measure is strongly positively associated with our indicators of Impartiality (r = .81***). Although,
the precise meaning of the ICRG’s concept of bureaucratic quality has not been disclosed by its
commercial owners, the overall institutional qualities valued by entrepreneurs and investors, such
as stability, predictability and the absence of threat of expropriation (Henisz, 2000; Jensen, 2008;
Knott & Miller, 2006; North & Weingast, 1989), are also those that are associated with meritocratic
impartial bureaucracy (Miller, 2000; Nistotskaya & Cingolani, 2016). Therefore, we interpret these
strong correlations as supporting convergence validity of our measures. Figure E.2 in the Appendix
specification clarifies: “Appointment decisions include hiring, firing and promotion in the state administration. Note that
the question refers to the typical de facto (rather than de jure) situation obtaining in the state administration, excluding
the armed forces. If there are large differences between different branches of the state administration or between top and
lower level state administrators please try to consider the average when answering the question. The Impartiality question
(2clrspct) is “Are public officials rigorous and impartial in the performance of their duties?”. The specification is: “This
question focuses on the extent to which public officials generally abide by the law and treat like cases alike, or conversely,
the extent to which public administration is characterized by arbitrariness and biases (i.e., nepotism, cronyism, or
discrimination). The question covers the public officials that handle the cases of ordinary people. If no functioning public
administration exists, the lowest score (0) applies”. (Coppedge et al., 2020, p. 164, 178)
16illustrates the relationship between Merit, Impartiality and ICRG Bureaucratic Quality.
In sum, our indicators and the measures originated within both the research and practitioners’ worlds,
show a high degree of convergence.
8.3 Construct validity
Construct validation strategies involve demonstrating that the measure in question yields theoreti-
cally expected results. Following two influential studies about the link between merit-based public
bureaucracy and corruption (Dahlström et al., 2012; Evans & Rauch, 1999), we leverage our measure
of meritocratic bureaucracy (Merit) against the World Bank’s Control of corruption, controlling for
levels of economic development (logGDPpc) and democracy (V-Dem’s polyarchy). Figure 6 shows
a scatterplot between Merit and Control of Corruption after netting out the influence of the control
variables.
The coefficient for Merit is statistically significant and is signed as expected, suggesting that higher
Merit is associated with lower corruption (higher Control of corruption). The size of Merit’s coef-
ficient is non-trivial: one unit increase in Merit corresponds to almost .7 unit increase in Control of
corruption.13 We replicate the analysis, using V-Dem’s measure of corruption (Political Corruption
Index) and Freedom House’s measure of democracy to find the results to be substantially the same
(not reported).
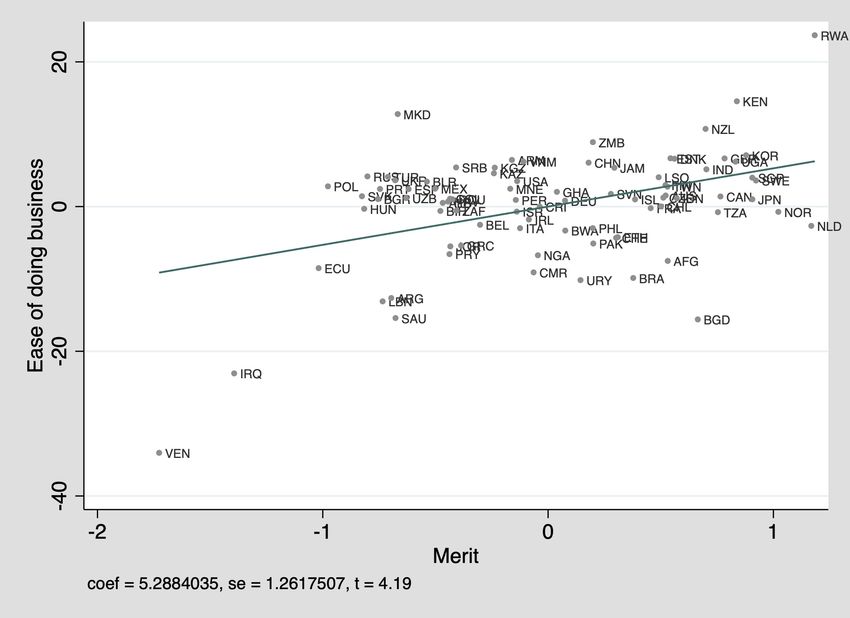
In another analysis, following Nistotskaya & Cingolani (2016), we leverage Merit against the World
Bank’s measures of Regulatory Quality and Ease of Doing Business, controlling for the levels of
economic development and democracy. Figure 7 shows a scatter plot between Merit and Regulatory
quality after netting out the influence of the controls.
The coefficient for Merit is statistically significant and is signed as expected, suggesting that higher
Merit is associated with better regulatory quality. We re-run the analysis, using the World Bank’s
Ease of Doing Business, to find Merit to be strongly associated with better government regulation
regarding entrepreneurship (see Figure E.3 in the Appendix).
13The range of Control of corruption in our sample is [-1.8; 2.2].
17Figure 6: Partial Regression Plot: Merit and Control of Corruption
Note: Data for Control of corruption and Merit are for the year 2019; democracy and logGDPpc are for the
year 2018, N = 82.
Figure 7: Partial Regression Plot: Merit and Regulatory Quality
Note: Data for Regulatory Quality and Merit are for the year 2019; democracy and logGDPpc are for the year
2018, N = 83.
Finally, following the influential publication by Rauch & Evans (2000) and its more recent edition by
Cornell et al. (2020), we examined the relationship between Merit and Impartiality on the one hand,
18and the level of economic development (measured through logGDPpc) on the other. Figure 8 shows
scatterplots between Merit and GDPpc (Left panel) and Impartiality and GDPpc (right panel) after
netting out the impact of the level of democracy in 2018. The coefficients for Merit and Impartiality
are statistically significant and are signed as expected.
Figure 8: Partial Regression Plot: Merit, Impartiality and GDPpc
Note: Left Panel: Merit and (log) GDPpc (year = 2019), Right Panel: Impartiality and (log) GDPpc (year =
2019), control variable is Democracy (year = 2018).
Overall, our construct validity analyses suggest that the examined measures yield theoretically ex-
pected results.14 Across all types of validation exercises — content, convergence and construct — the
QoG Expert Survey data performs consistently, thereby lending confidence to users in the validity of
the QoG Expert Survey data.
9 Point estimates vs simple averages
Are there any meaningful differences between the produced IRT estimated and simple averages? The
correlations between the two are very high (Pearson’s r is at least 0.96***), but we explore this further
by creating two rank ordered variables, based on the values in the raw data and IRT estimates. For
example, for Merit we created two new variables, running from 1 to 86, where 1 stands for the highest
and 86 for the lowest values on simple averages and IRT estimates. We, then, plot these new variables
14Giventhat at the moment of this report’s preparation the data for many dependent variables was available only for
the year 2019, our construct validation exercise is somewhat limited and further analysis should be carried out at a later
point once the data become available.
19against each other.
Figure 9 displays these comparisons for Merit and Impartiality, depicting in red countries that differ in
rank ordering between the two measures by at least two standard deviations. As can be observed, for
the overwhelming majority of the countries rank ordering does not exceed two standard deviations.
The divergence from the “perfect” fit occurs in the region with the observation scoring lower on merit
and impartiality (lower ranking countries).
Figure 9: Simple Averages and IRT Estimates for Merit and Impartiality: Comparison of Rank Orders
Note: Values on the X axis are rank orders based on IRT estimates. Values on the Y axis are rank orders based
on simple averages. Left panel: rank order for Merit (lower value - higher rank). Right panel: rank order for
Impartiality (lower value - higher rank.
Our analysis suggests that although there are some differences in the rank ordering of the countries
across the two scales, for the overwhelming majority of the observations, these differences are not
large. This is in line with previous research that points out that well-run research projects generate
robust raw expert-coded data (Bakker et al., 2020; Marquardt, 2020).
10 QoG Expert Surveys 2011, 2015 and 2020: Comparison
In this section we briefly consider data from the three waves of the QoG Expert Survey: 2011,15 2015
and 2020. Table F.1 in the Appendix reports the questions from the QoG Expert Surveys 2011, 2015
and 2020, representing the concepts of interest. The wording of the questions is either identical (for
15The
survey was conducted over three years, between 2008 and 2011.
20example, for the concepts of merit or impartiality) or substantively similar. The only exception is the
question for Tenure, with the question from 2011 and 2015 only indirectly tapping into the concept
of security of tenure as freedom from arbitrary dismissal.
Table F.2 reports Pearson’s correlation coefficients for the Professionalism and Impartiality traits,
measured as simple averages in 2011, 2015 and as IRT-based estimates in 2020. As one can see, the
strength of the correlation is high for all pairs of indicators (r = [.69; .81] at the 99 percent level),
except for Tenure, for which Pearson’s r ranges between .3*** and .7***.
Table F.3 reports Pearson’s correlation coefficients for the Closedness traits, measured as simple av-
erages in all three waves. While the strength of the association over time for the Examination variable
is high (r = [.66; .72] at the 99 percent level), the Special laws variable is moderately associated over
time (r = [.46; .60] at the 99 percent level). The data for the Entry level variable is only availabe for
the second and third waves, and the association over time is moderate (r = .49***).
We further explore the alignment of the 2015 and 2020 data by creating a set of rank ordered variables,
based on the values of the same variables from 2015 and 2020, and then plotting these new variables
against each other. Figure 10 displays these comparisons for Merit and Impartiality, depicting (in red)
countries that differ in rank ordering between the two measures by at least two standard deviations.
As can be observed, for the overwhelming majority of the countries rank ordering does not exceed
two standard deviations. However, Albania, Ecuador and Poland dropped in the ranking of Merit (left
panel) by more than two standard deviations. When it comes to Impartiality (right panel), while four
countries considerably (that is, by more than two standard deviations) slipped down in the ranking
(China, Jordan, Malta and Turkey), two countries considerably improved their standing (Bosnia-
Herzegovina and Estonia). Figure F.1 of the Appendix depicts the relationship between 2015 and
2020 scores for Patronage.
To gain greater confidence in the validity of the data, researchers may want to assess the alignment
of these changes in the rankings with the true state of affairs through existing or original case studies.
For example, there exists evidence of institutional de-meritocratization of the Polish bureaucracy after
the 2015 presidential and parliamentary elections, when, by the end of 2015, many bureaucratic posts
were already made legally exempt from the procedure of “open and competitive recruitment” (Zybała
21Figure 10: QoG 2015 and 2020: Comparison of Rank Orders of Merit and Impartiality
Note: Values on the X axis are from 2020. Values on the Y axis are from 2015. Left panel: rank order for
Merit (lower value - higher rank). Right panel: rank order for Impartiality (lower value - higher rank).
et al., 2017, p.96).
In summation, the strength of the association between the indicators of Professionalism (except for
Tenure) and Impartiality across the three waves suggests that the data is likely to measure the same
underlying phenomena, yet offering enough variability over time to use these data in time-series
analysis. The areas of low over-time correlation — among the measures of Closedness and Tenure
— may require a more focused validity evaluation exercise.
11 Conclusion
This report documents the design and implementation of the third wave of the QoG Expert Survey,
and initial analysis of the new data. The QoG Expert Survey is concerned with generating reputable
data on bureaucratic structures and bureaucratic behavior in countries around the world.
Beset with the critique that expert estimates may be systematically biased, we decided to employ a
series of anchoring vignettes — a methodological device used to address the problem of differential
item functioning that is at the heart of systematic differences in expert subjective assessments. While
well-functioning anchoring vignettes is a key element of the success of this approach, it is impos-
sible to identify high-performing vignettes before presenting them to experts. Our vignette analysis
22suggested that some vignettes in the main survey continued to exhibit ordering inconsistency across
experts, which led to the exclusion of wrongly ranked vignettes from the calculation of the estimates.
In the next iteration of the survey we will replace the under-performing vignettes with new ones.
Using the information from the vignettes, we built country-level point estimates for five important
concepts: Patronage, Merit, Tenure, Political Interference and Impartiality. The 2020 edition of the
survey collected data on the closedness of public bureaucracies, generating three indicators capturing
different aspects of the Closedness dimension of bureaucratic structure (but without vignettes). In
addition to these, two indices — Professionalism and Closedness — were constructed, using Principal
Component Analysis.
We conducted several thorough exercises to assess the validity of our data. Content validation showed
that the individual elements of the Professionalism dimension of bureaucratic structure is internally
cohesive, but the Closedness dimension is less so, pointing to the need for a careful application of
these data in empirical research. The two indicators of bureaucratic behavior (Political Interference
and Impartiality) showed high internal cohesion. The convergence validity exercise demonstrated that
our country-level estimates for Merit and Impartiality are highly correlated with similar measures
generated by the academic and business communities. Finally, the construct validation analyses
showed that the measures in question yield the theoretically expected results.
We checked the correspondence between the simple averages and point estimates, which demon-
strated that for the overwhelming majority of observations (countries), the data is more similar than
different, lending confidence to users of the raw QoG Expert Survey data.
We also assessed the correspondence between data from all three waves of the QoG Expert Sur- vey.
The revealed strength of the association between the indicators of Professionalism (exclusive of
Tenure) and Impartiality suggests that the data is likely to measure the same underling phenomena,
while offering enough variability over time to use these data in time-series analysis.
23References
Adcock, R. & Collier, D. (2001). Measurement validity: A shared standard for qualitative and quan-
titative research. American political science review, (pp. 529–546).
Agerberg, M. (2017). Failed expectations: Quality of government and support for populist parties in
europe. European Journal of Political Research, 56(3), 578–600.
Ahlerup, P., Baskaran, T., & Bigsten, A. (2016). Government impartiality and sustained growth in
sub-saharan africa. World Development, 83, 54–69.
Aldrich, J. H. & McKelvey, R. D. (1977). A method of scaling with applications to the 1968 and
1972 presidential elections. The American Political Science Review, 71(1), 111–130.
Bakker, R., Jolly, S., & Polk, J. (2020). Analyzing the cross-national comparability of party positions
on the socio-cultural and eu dimensions in europe. Political Science Research and Methods.
Boräng, F., Cornell, A., Grimes, M., & Schuster, C. (2018). Cooking the books: Bureaucratic politi-
cization and policy knowledge. Governance, 31(1), 7–26.
Charron, N., Dahlström, C., Fazekas, M., & Lapuente, V. (2017). Careers, connections, and corrup-
tion risks: Investigating the impact of bureaucratic meritocracy on public procurement processes.
The Journal of Politics, 79(1), 89–104.
Cingolani, L., Thomsson, K., & De Crombrugghe, D. (2015). Minding weber more than ever? the
impacts of state capacity and bureaucratic autonomy on development goals. World Development,
72, 191–207.
Conn, D., Pegg, D., Evans, R., Garside, J., & Lawrence, F. (2020). Chumocracy: How covid revealed
the new shape of the tory establishment. The Guardian, November, 15.
Coppedge, M., Gerring, J., Knutsen, C. H., Lindberg, S. I., Teorell, J., Altman, D., Bernhard, M.,
Fish, M. S., Glynn, A., Hicken, A., et al. (2020). V-dem codebook v10.
Cornell, A., Knutsen, C. H., & Teorell, J. (2020). Bureaucracy and growth. Comparative Political
Studies, 53(14), 2246–2282.
Dahlberg, S., Dahlström, C., Sundin, P., & Teorell (2013). The qog expert survey 2008-2011: Report.
The Quality of Government Institute Working Paper Series, 15.
Dahlström, C., Lapuente, V., & Teorell, J. (2010). Dimensions of bureaucracy. a cross-national
dataset on the structure and behavior of public administration. The Quality of Government Institute
Working Paper Series, 13.
Dahlström, C., Lapuente, V., & Teorell, J. (2012). The merit of meritocratization: Politics, bureau-
cracy, and the institutional deterrents of corruption. Political Research Quarterly, 65(3), 656–668.
Dahlström, C., Teorell, J., Dahlberg, S., Hartmann, F., Lindberg, A., & Nistotskaya, M. (2015). The
qog expert survey dataset ii. University of Gothenburg: The Quality of Government Institute.
Evans, P. & Rauch, J. E. (1999). Bureaucracy and growth: A cross-national analysis of the effects of”
weberian” state structures on economic growth. American sociological review, (pp. 748–765).
Henisz, W. J. (2000). The institutional environment for economic growth. Economics & Politics,
12(1), 1–31.
24Jensen, N. (2008). Political risk, democratic institutions, and foreign direct investment. The Journal
of Politics, 70(4), 1040–1052.
King, G. & Wand, J. (2007). Comparing incomparable survey responses: Evaluating and selecting
anchoring vignettes. Political Analysis, 15(1), 46–66.
Knott, J. H. & Miller, G. J. (2006). Social welfare, corruption and credibility: Public management’s
role in economic development. Public Management Review, 8(2), 227–252.
Krause, G. A., Lewis, D. E., & Douglas, J. W. (2006). Political appointments, civil service systems,
and bureaucratic competence: Organizational balancing and executive branch revenue forecasts in
the american states. American Journal of Political Science, 50(3), 770–787.
Lapuente, V. & Nistotskaya, M. (2009). To the short-sighted victor belong the spoils: Politics and
merit adoption in comparative perspective. Governance, 22(3), 431–458.
Lapuente, V. & Suzuki, K. (2020). Politicization, bureaucratic legalism, and innovative attitudes in
the public sector. Public administration review, 80(3), 454–467.
Lewis, D. E. (2007). Testing pendleton’s premise: Do political appointees make worse bureaucrats?
The Journal of Politics, 69(4), 1073–1088.
Lindstadt, R., Proksch, S.-O., & Slapin, J. B. (2020). When experts disagree: Response aggregation
and its consequences in expert surveys. Political Science Research and Methods, 8(3), 580–588.
Lœgreid, P. & Wise, L. R. (2007). Reforming human resource management in civil service systems:
Recruitment, mobility, and representativeness. In The civil service in the 21st century (pp. 169–
182). Springer.
Marquardt, K. L. (2020). How and how much does expert error matter? implications for quantitative
peace research. Journal of Peace Research, 57(6), 692–700.
Marquardt, K. L. & Pemstein, D. (2018). Irt models for expert-coded panel data. Political Analysis,
26(4), 431–456.
Marquardt, K. L., Pemstein, D., Seim, B., & Wang, Y.-t. (2019). What makes experts reliable? expert
reliability and the estimation of latent traits. Research & Politics, 6(4), 2053168019879561.
Miller, G. (2000). Above politics: Credible commitment and efficiency in the design of public agen-
cies. Journal of Public Administration Research and Theory, 10(2), 289–328.
Miller, G. J. & Whitford, A. B. (2016). Above politics. Cambridge University Press.
Nistotskaya, M., Charron, N., & Lapuente, V. (2015). The wealth of regions: quality of government
and smes in 172 european regions. Environment and Planning C: Government and Policy, 33(5),
1125–1155.
Nistotskaya, M. & Cingolani, L. (2016). Bureaucratic structure, regulatory quality, and entrepreneur-
ship in a comparative perspective: Cross-sectional and panel data evidence. Journal of Public
Administration Research and Theory, 26(3), 519–534.
North, D. C. & Weingast, B. R. (1989). Constitutions and commitment: the evolution of institutions
governing public choice in seventeenth-century england. Journal of economic history, (pp. 803–
832).
25You can also read