Spotlight on Museums 2015 - Report for Museums, Archives and Libraries Division, Welsh Government - GOV.WALES
←
→
Page content transcription
If your browser does not render page correctly, please read the page content below
Spotlight on Museums 2015
Report for Museums,
Archives and Libraries Division,
Welsh Government
Spotlight on Museums 2015

    Research on behalf of Museums, Archives and Libraries
    Division, Welsh Government

    Produced by Tom Newman and the South West Museum Development Programme on behalf of the Museums,
    Archives and Libraries Division, Welsh Government

    Acknowledgements:

    Welsh Government recognises the work involved in
    gathering this data and is grateful to all the museums
    which contributed to this survey.

    Further information and related documents

    Large print, Braille and alternate language versions
    of this document are available on request.

    Contact details

    Museums Development Team
    Museums, Archives and Libraries Division
    Welsh Government
    Rhodfa Padarn
    Llanbadarn Fawr
    Aberystwyth
    SY23 3UR

    E-mail: mald@wales.gsi.gov.uk MALD@wales.gsi.gov.uk
    Telephone: 0300 062 2112
    Website: www.gov.wales/topics/cultureandsport/museums-archives-libraries/?skip=1&lang=en w

    Front cover image supplied by Visit Wales
    © Crown copyright (2016) Visit Wales

            Digital ISBN 978 1 4734 6146 8   © Crown copyright 2016   WG27251

2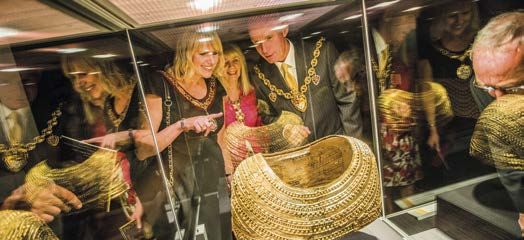
Contents

           Foreword

           1.   Summary

           2.   Overview

           3.   Museums for Everyone

           4.   A Collection for the Nation

           5.   Working Effectively

           6.   Services provided by Amgueddfa Cymru
                – National Museum Wales

                Appendices:

                A. List of museums by size

                B.   Range statements

                C.	Core group of museums which have
                    submitted data for each survey

                                                       3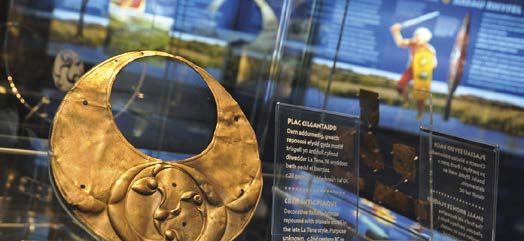
Welcome…
    to this, the third edition of the Welsh           We have now reached the third Spotlight survey,
    Government’s survey of museums                    providing us with a comprehensive overview
    The information provided by museums of            of changes in the museums sector since 2006.
    all types and sizes across Wales provides an      The key issues and challenges that arise from
    important picture of how active museums are       Spotlight 2015 will help inform the 2016-2021
    in caring for our heritage and meeting the        museums strategy.
    needs of their communities. Many museums
    are working to engage different audiences,        The 2015 Expert Review of Museums published
    to address the recommendations in Baroness        a series of recommendations for creating a
    Kay Andrews’ seminal report on how culture        resilient museums sector in Wales. Finding
    can improve the life chances of those in our      innovative ways to deliver museum services is
    most disadvantaged communities. Through our       crucial to the sector’s survival and to do this we
    Fusion programme, we seek to ensure that our      need evidence of the current situation. Spotlight
    museums are not only accessible to all, but are   provides us with the facts – how many qualified
    enjoyed by all.                                   museum staff there are, where funding comes
                                                      from, how many visitors they have and what
    You will see from this report that museums        services they provide to their communities.
    continue, despite increasing challenges, to
    be the heart of communities, running events       The museum landscape in Wales is undoubtedly
    and exhibitions and providing education and       changing. Some local authorities have already
    outreach opportunities. It is clear that much     moved their museums to trusts and others
    of this would be impossible without the           are looking at new ways to deliver services on
    support of thousands of volunteers as well as     reduced budgets. The Spotlight surveys show
    a committed staff and I would like to offer my    the context in which these changes are taking
    personal thanks to them all.                      place.

    In 2010, the Welsh Government published           I really appreciate the time and effort which
    ‘A Museums Strategy for Wales 2010-15’,           museum staff, volunteers and trustees have
    the first such national museums strategy in the   given to completing the survey. I ask them
    UK. The aims and actions it contains were based   to continue to support the survey, and to
    on consultation and the information gathered      encourage others to complete it.
    for the first Spotlight Survey in 2006.

                                                      Ken Skates AM
                                                      Deputy Minister for Culture, Sport and Tourism

4
1. Summary
Last year the fourth museums survey was carried • Since Spotlight began in 2002, policy
out in Wales with previous surveys undertaken in and planning and audience development
2011, 2006 and 2002. This report presents the and marketing have seen the greatest
findings of the 2015 survey and explores trend improvement. The provision of formal
data since 2002. learning is the only area to have fallen overall.
The Museums, Archives and Libraries Division
of the Welsh Government (MALD, formerly Museums for Everyone
CyMAL) estimates that there are some 160 • There were 3.8 million visits to Wales in 2014.
organisations in Wales which could be called Based on the responses from museums that
‘a museum’. 80 museums responded to the provided visit data for all years 2011 to 2014,
survey giving a 50% return which is considerably visit numbers fell by 3.3%.
lower than the 66% that responded in 2011. • Visits to local museums (non-Amgueddfa
The return rate amongst museums in the Cymru and non-National Trust) rose by
Accreditation scheme was 72% with responses 1.3% during the same period.
from 77 museums. Trends are based on
• Children (under-16) account for 21% of visits
responses from a core group of 54 museums
to museums.
which responded to the previous three surveys.
• Museums provided 9,178 learning sessions
Of the respondents, 40% (32) were run by and activities on-site which engaged 500,586
local authorities, 34% (27) were independent participants in 2013/14.
charities, 13% (10) were National Trust • 60 museums (75% of respondents) ran
properties with the rest being Amgueddfa exhibitions, events or activities targeted
Cymru – National Museum Wales (Amgueddfa for different equalities areas including
Cymru) (7), university (2) or military (2) age, sexual orientation, gender, language,
museums. belief and disability.
• Museums delivered 2,419 learning and
Standards of practice outreach sessions and activities which
To measure standards of practice, engaged 124,992 participants outside
museums selected a number of qualitative of the museum.
‘Range Statements’ which most closely matched • The economic impact of visits to museums
their situation. in Wales in 2014 was £82,780,467. This is
• Standards are rising on average and most based on calculations using the Economic
museums exceed the minimum standards Impact Toolkit published by the Association
required by the Accreditation Scheme for of Independent Museums.
museums in the UK.
• Standards in staff and volunteer development A Collection for the Nation
and access (re-display, interpretation and • Museums in Wales care for approximately
bilingual provision etc.) have shown the 5.5 million items (based on results
greatest improvement since 2011. from 2011).
• The provision of formal learning and suitable • 49% of museum stores are already full and
buildings (maintenance and management) a further 21% will be full by 2020.
both fell during the same period while the
• Collections care and management standards
provision of informal learning remains more
had the highest levels of practice with a 4.3
or less the same as in 2011.
average across the related range statements.
• 12,984 items were acquired by museums
either by purchase or gift in 2013 and 2014.
5Working Effectively Conclusion
• 3,496 people work in museums in Wales. • Spotlight on Museums 2015 presents
• Volunteers form 66% of the workforce, a snapshot of the sector in 2014 and
up from 62% in Spotlight 2011. establishes a baseline of financial benchmarks
• 177,815 hours were contributed by from the 2013/14 financial year that can
volunteers in 2013/14 worth £1.37 million. be used by museums going forward.
The report shows that while visit numbers
• There were 1,196 paid staff in museums have experienced recent decline, they have
with 902 Full Time Equivalents. still increased over the last decade. It points
• 10 Accredited museums were entirely to a sector that, despite the financial
volunteer-run with no paid staff. These were challenges of recent years, has reached out
all independent museums. to audiences and delivered extensive learning
• Almost half of the museums in Wales provide and community engagement opportunities
free entry. as well as having a burgeoning volunteer
• Budgets are falling. On average, base. Sector standards are continuing to rise,
local museum budgets fell by 1% between particularly in the areas of staff and volunteer
2011/12 and 2013/14. development and policy and planning,
• The levels of public subsidy received by two highly interrelated areas. Disability
museums varies considerably. For independent access remains a clear area for development
museums, public subsidy accounted for while storage will become an increasingly
around 20% of their income, while for local challenging issue over the next few years.
authority museums it accounted for 76%.
• Of the 53 museums that stated they received
local authority support (whether in-kind or
financial), four reported a rise in support
between 2013 and 2015, 22 said that it had
stayed the same while 27 reported a fall
in support.
Local Museums and Amgueddfa
Cymru
In addition to the key strategic themes of the
survey, Amgueddfa Cymru sought information
about the extent to which local museums used
its services.
• 60% of local museums that responded to
the survey (44) said they accessed a service
provided by Amgueddfa Cymru.
• The most common forms of support accessed
by local museums were collections advice,
conservation advice and object loans.
• Small local authority or independent
museums were most likely to access services
provided by Amgueddfa Cymru.
62. Overview
Spotlight on Museums 2015 is structured ‘Museums enable people to explore
around and relates to issues identified within collections for inspiration, learning and
the three key principles of ‘A Museums Strategy enjoyment. They are institutions that collect,
for Wales 2010-15’1 safeguard and make accessible artefacts
• Museums for Everyone. and specimens, which they hold in trust
• A Collection for the Nation. for society.’3
• Working Effectively.
2.1 Process
This report presents facts, figures and analyses
Spotlight on Museums 2015 builds on data
which museums and museum services
gathered in 2011 and 2006, and on data
can use to demonstrate their social and
gathered by the Council for Museums in Wales
economic contribution to their communities
for the ‘Museum Mapping 2002’ survey and
and benchmark against peers to identify
report. The 2015 survey draws on experience
opportunities to improve performance.
from the West Midlands regional survey of
Following Spotlight on Museums 2015, museums, ‘Fast Forward’4. For the first time
MALD will explore the feasibility of a light a number of the questions were also aligned
touch annual survey of core data to encourage with regional surveys undertaken by Museum
museums to regularly collect this data on an Development providers in England to enable
ongoing basis. It is anticipated this would comparisons across the two nations.5
support museums to evidence their impact more
The questions asked in Spotlight 2011 were
effectively.
reviewed in order to reduce the number
Spotlight on Museums 2015 questions of questions that museums were being
deliberately required museums to consider asked. Much of the detail gathered in the
issues within the revised Accreditation Scheme Spotlight 2011 survey in relation to collections
for museums in the UK2 launched in 2011. now forms part of the Accreditation submission
The Accreditation Scheme sets nationally and was therefore removed to minimise
agreed standards for museums across three duplication in gathering data from museums.
key areas of organisational health, collections
The survey was conducted online and opened
management and users and their experiences.
in mid-March 2015 and ran until the end of
The scheme supports museums to focus on
October 2015 to maximise the opportunity
standards, identify areas for improvement
museums had to respond. Museums were
and develop their resilience through
notified about the survey via direct email and
forward planning.
MALD’s current awareness service6. Monthly
The Accreditation Standard enables reminders were sent to museums, and advice
differentiation between organisations which and support on completing the survey was
merely collect and display artefacts, and genuine available via email.
museums committed to meeting the UK
definition of a museum in full, which states:
1
M useums Strategy for Wales 2010-2015, Welsh Assembly Government, 2010
www.gov.wales/topics/cultureandsport/museums-archives-libraries/museums/strategy/?lang=en
2
T he Accreditation Scheme for Museums in the UK is operated by Arts Council England and is administered in Wales by MALD.
Accreditation is a widely accepted voluntary standard for museums. For full details about the Accreditation scheme please see
the Arts Council England website.
www.artscouncil.org.uk/what-we-do/supporting-museums/
3
M useums Association 1998: www.museumsassociation.org/ethics/code-of-ethics
4
F ast Forward 2010. The Survey of Museums and Galleries in the West Midlands’, Fast Forward 2010 Editorial Board 2011
www.collectionstrust.org.uk/events/item/1144-fast-forward-2010
5
www.southwestmuseums.org.uk/publications-resources/research-and-data/
6
C urrent Awareness Service for Museums www.gov.wales/topics/cultureandsport/museums-archives-libraries/museums/current-
awareness/?lang=en 7Data from Spotlight on Museums 2015 is being • Data relevant to budgets should be viewed
made available in three ways: as approximate or indicative, as different
• Printed report – available as a download from accounting methodologies are used in
the MALD website. different museums and a number of
• Online – via the MALD website. museums operate a different financial
year to April to March.
• Excel spreadsheet – available on application
to MALD. • For multi-site organisations where a museum
service provides central support to a number
of related museums which it may, or may not,
2.2 Understanding the data run directly, their responses where relevant
Information supplied by museums is based on have been aggregated under one ‘parent’
four different types of questions: museum. The resources (staff, materials and
• Yes/No questions, e.g. do you have budgets) they administer are spread across
a website? a number of museums but for the purposes
of this report are only shown against the
• Numerical evidence questions, e.g. budget
‘parent’ museum, National Museum Cardiff
and visit figures for museums.
is one example. Their detailed data needs
• Free text questions to provide additional to be read carefully as their resources may
information. Answers have been used look disproportionate to their direct museum
to illustrate the report. provision when in fact their resources are
• Self-assessment questions (Range Statements) shared across a number of museum venues.
to measure levels of practice across a number
of museum activities. 2.2.2 Categories of museum used for analysis
Three main categories of museum are used
2.2.1 Sample size for analyses throughout the report:
All organisations which regard themselves • Type of museum determined by funding
as museums were invited to participate. source and governance model.
MALD estimates that there are approximately
• Size of museum determined by annual
160 in Wales. 80 museums responded to the
visit figures.
survey giving a return rate of 50% which
is considerably lower than the 66% that • Core group – museums which responded
responded in 2011. There was a higher return to the survey in 2002, 2006 and 2011.
rate amongst museums in the Accreditation A list of museums which constitute the core
scheme with 77 museums responding, group is given in Appendix C. This group has
equating to a 72% return rate. reduced from 73 to 54 since 2006 and is now
comprised only of Accredited museums.
When considering the responses, the following
should be borne in mind:
2.3 Type of museum
• Not all museums answered all the questions.
Of the 160 organisations in Wales, those
• Percentages in the report have been rounded
which responded have been divided into four
to the nearest whole number.
categories of museums, depending upon
• ‘All’ museums is every museum which funding arrangements and governance.
submitted a return in 2015.
• 7 national museums, Amgueddfa Cymru
• The ‘core group’ of museums refers to the (funded by the Welsh Government).
museums that have responded to all four
• 32 local authority museums (funded and
Spotlight surveys.
operated directly by Local Authorities).
• Where differences are small and response
levels low, care must be taken when
interpreting the data.
8• 31 independent museums (funded and 2.4 Size of museum
run independently of local or national
government) – this category includes Museums in Wales range from large national
museums within universities; museums run museums (Amgeuddfa Cymru) to small
for army regiments and charities. These may community organisations. For the purposes
receive some form of public funding through of this report, the size of museums has been
local authority or government support, determined by the average annual number of
e.g. through grants or professional advice. visits they attracted between 2010 and 2014.
If for any reason a museum did not provide visit
• 10 National Trust properties. numbers for one of the years then the average
of the years that they did provide has been used.
Figure 2.3.1: Responses by type of museum
A list of museums by size category is given in
Appendix A.
National Trust Amgueddfa Cymru
Large
10 7 • 18 museums attract, on average, over 50,000
visits per year. Four of the six most visited
museums between 2011 and 2014 were
part of Amgueddfa Cymru. This includes
St Fagans: National History Museum, which is
also one of the largest tourist attractions in
32 Wales with an average of just under 600,000
31 visits annually.
Medium
• 28 medium sized museums attract an average
Local of between 10,000 and 50,000 visits.
Independent
Authority
Small
• 31 small museums attract an average
Figure 2.3.2: Core group museums by type of fewer than 10,000 visits annually.
National Trust
• Of the remaining respondents, one was
Amgueddfa Cymru
closed during the period, one was unstaffed
and therefore visitor numbers were not
5 6 submitted and one museum gave no
explanation for not providing visit figures.
19
24
Local
Independent Authority
9Figure 2.4.1: Responses by size of museum In previous Spotlight reports comparisons have
been made between Accredited and non-
Accredited museums, however, this year only
Large three respondents were not already Accredited
or formally working towards Accreditation
18 and therefore comparisons would not be based
on sufficient data. Museums in Wales which
participate in the Accreditation scheme are listed
Small 31 on the MALD webpages7.
2.6 Levels of practice in museums
Spotlight examines how well museums are doing
across 13 areas of work, using self-assessed
28
Range Statements. The Range Statements
Medium take areas of work which demonstrate how
museums serve their communities, manage their
collections and govern themselves, and break
Figure 2.4.2: Core group museums by size these down into different levels of activity.
Each statement goes from 1 to 6, where 1 is
little or no work undertaken and 6 equals best
Large practice. Range Statements enable museums
11 to identify where they are doing well, and where
they need to develop further. They are an
indication of activity level and are not scores
Small 19 and there is no expectation that all museums
will eventually reach level six in all areas.
Museums should aspire to reach the highest
level most appropriate for the size and scale
of their organisation.
22 Medium Range Statements were used in the Wales
‘Museum Mapping 2002’ survey by the Council
for Museums in Wales. They were updated for
the 2006 Spotlight on Museums survey and new
ranges were introduced. Some slight updating
2.5 Accreditation Status was also applied in 2015. The Range Statements
used to measure service levels in this report are
Accreditation is a free, voluntary scheme based on the Accreditation Standard. Level three
open to any eligible organisation which meets equates to the requirements of Accreditation.
required standards. The Accreditation scheme
sets nationally agreed standards for museums The 2015 Range Statements are published
across three key areas of organisational health, in Appendix B at the end of this report.
collections and users and their experiences.
The scheme supports museums to focus on 2.6.1 Accreditation and Range
standards, identify areas for improvement
and develop their resilience through forward Statements
planning. Organisations which already collect, ‘A Museums Strategy for Wales’ uses the
interpret and claim to preserve artefacts or number of museums achieving level three
specimens for public benefit are encouraged across the Range Statements as an indication
to join the scheme. that museums are continuing to work to the
7
www.gov.wales/topics/cultureandsport/museums-archives-libraries/museums/accreditation/?lang=en
10Accreditation Standard. On average, Accredited scheme that identified themselves as achieving
museums exceed the minimum requirements below level three in at least one area. These will
and consistently achieve higher standards. There be identified as required areas for improvement
were 41 museums within the Accreditation for future Accreditation returns.
Figure 2.6.1-1: Average levels of practice since 2002 across all museums
5.0
4.5
4.0
3.5
3.0
2.5
2.0
Formal Learning
Inormal Learning
Access – Display
Access – Disability
Staff & volunteer
development
Provision of suitable
buildings
Environmental
control
Storage and
Housekeeping
Display and
Hosuekeeping
Documentation
Policy and Planning
Overall average
Environmental
monitoring
Audience Development
and Marketing
1.5
1.0
0.5
0.0
2015 All respondents 2011 All respondents 2006 All respondents 2002 All respondents
Figure 2.6.1-2: Average levels of practice since 2002 across the core group
5.0
4.5
4.0
3.5
3.0
2.5
2.0
Formal Learning
Inormal Learning
Access – Display
Access – Disability
Staff & volunteer
development
Provision of suitable
buildings
Environmental
control
Storage and
Housekeeping
Display and
Hosuekeeping
Documentation
Policy and Planning
Overall average
Environmental
monitoring
Audience Development
and Marketing
1.5
1.0
0.5
0.0
2015 Core group 2011 Core group 2006 Core group 2002 Core group
11Figure 2.6.1-3: Changes to service levels between 2002 and 2015
All museums All museums Core group Core group
Range Statement % difference % difference % difference % difference
2015-2011 2015-2002 2015-2011 2015-2002
Audience Development
0.05 0.41 0.01 0.34
and Marketing
Formal Learning -0.05 -0.05 -0.07 -0.09
Informal Learning 0.02 0.01 0.00 -0.06
Access – Display 0.13 0.13 -0.07 0.05
Access – Disability 0.06 0.10 0.00 0.03
Staff & Volunteer Development 0.21 N/A 0.14 N/A
Provision of Suitable Buildings -0.01 N/A -0.06 N/A
Environmental Monitoring 0.09 0.18 0.04 0.10
Environmental Control 0.09 0.10 0.02 0.02
Storage and Housekeeping 0.06 0.07 -0.02 0.02
Display and Housekeeping 0.06 N/A -0.03 N/A
Documentation 0.08 0.03 0.01 0.04
Policy and Planning 0.12 0.76 0.03 0.52
Overall average 0.07 0.15 0.00 0.08
Figure 2.6.1-4: Number of museums which meet or exceed average levels of service
Environmental Monitoring
Storage and Housekeeping
Display and Housekeeping
Audience Development/
Environmental Control
Provision of Suitable
Policy and Planning
Access – Disability
All museums 2015
Informal Learning
Staff & Volunteer
Access – Display
Formal Learning
Documentation
Development
Marketing
Buildings
2015 Wales
3.78 3.83 3.94 4.11 3.28 4.03 3.97 4.64 4.30 3.75 4.45 4.38 3.97
average
Number of
78 78 77 75 76 73 73 74 74 72 73 74 72
responses
Number of
museums
70 62 68 63 47 60 70 71 71 60 66 73 66
at level 3
or above
Number of
museums
40 39 50 51 32 52 45 62 57 37 57 59 45
at level 4
or above
120.0
0.6
1.2
1.8
2.4
3.0
3.6
4.2
4.8
5.4
6.0
0.00
1.00
2.00
3.00
4.00
5.00
6.00
7.00
Audience Development
Audience Development and Marketing
and Marketing
Formal Learning
Large museums
Formal Learning
Informal Learning
Informal Learning
Amgueddfa Cymru
Access – Display
Access – Display
Access – Disability
Access – Disability
Staff & volunteer Staff & volunteer
development development
National Trust
Provision of suitable Provision of suitable
buildings buildings
Environmental Environmental
monitoring
Medium museums
monitoring
Environmental
Environmental control
Figure 2.6.1-5: Average levels of service by size of museum
Figure 2.6.1-6: Average levels of service by type of museum
control
Storage and
Local Authority
Storage and Housekeeping
Housekeeping
Display and
Display and Hosuekeeping
Hosuekeeping
Documentation
Documentation
Policy and Planning
Independent
Policy and Planning
Overall average
Small museums
Overall average
132.7 Challenge and success Introducing, developing, or simply having
a strong volunteering base were a common
since 2011 feature, both the Egypt Centre, Swansea and
Museums were invited to state what they felt Pontypool Museum received national awards
were their main achievements since 2011 and for their volunteering programmes.
what they felt their future challenges might be.
‘In The Spotlight’ studies throughout the report Narberth Museum was a finalist in the Art
are based on these responses. Fund Museum of the Year Award in 2013
while Tenby Museum and Art Gallery was
Challenges long listed for the Telegraph Family Friendly
Museum of the Year Award in 2014. In 2015,
Funding, budgets and possible cuts remain
the Winding House, New Tredegar received a
the main areas of concern for all museums
Family Friendly Museum Special Commendation
as they were in 2011, followed closely by
for Outstanding Contribution to their Local
maintaining services with fewer staff. Recruiting
Community – the first time any museum has
and retaining volunteers was highlighted by
received such a commendation. This was in
a number of mainly independent museums
recognition of the testimonies local families gave
as a key challenge in ensuring sustainability.
to their museum, saying how much it meant to
A number of museums highlighted the
them. Further successes are highlighted in the
challenges of making the transition from a
‘In the Spotlight’ sections throughout the report.
local authority run museum to a charitable
trust, particularly in relation to the anticipation
of further cuts in local authority funding.
Maintaining and growing visitor numbers was
also identified as a key challenge.
Successes
All types of museums cited exhibitions more
than any other activity amongst their successes,
with many referring to the Welsh Government’s
Sharing Treasures partnership scheme8.
Exhibitions often unlock opportunities for
funding and partnerships with communities and
other organisations and these were highlighted
by museums as some of the key outcomes of
their exhibition programmes.
Engaging with audiences and communities was
an important theme for nearly all museums.
This ranged from simply increasing visit numbers
and holding public events to developing new
community learning programmes and co-curated
exhibitions with young unemployed people.
Museums highlighted achieving full
Accreditation status as a key success.
Accreditation provides recognition for museums
which are committed to collections care and
management, organisational resilience through
forward planning, responding to user needs
and actively working to reach new audiences.
8
F or further information about the Sharing Treasures scheme see: www.gov.wales/topics/cultureandsport/museums-archives-libraries/
funding/sharing-treasures-review/?lang=en
143. Museums for Everyone
Museums need to be accessible, welcoming 3.1 Visits to museums
organisations which understand their users
and are able to provide for the needs of different The number of in-person visits is one of the
users. Reducing barriers to access, working with main indicators of the popularity, and in many
communities, providing for tourists, creating ways, the success of museums. The importance
learning and volunteering opportunities and of visits to museums is however relative to the
being an active part of Wales’ cultural offer are size and scope of any particular museum.
all key aspects of ensuring our museums are Museums are an important part of the tourism
relevant and engaging for everyone. offer in Wales. Research undertaken by Strategic
Spotlight considered the following issues that Marketing for the Welsh Government in 2013
were raised in ‘A Museums Strategy for Wales’: highlighted that museums were among the
top 10 reasons for visiting Wales by UK staying
• Use of the ‘Inspiring Learning for All’ visitors and third most cited reason for UK day
framework9. visitors and overseas visitors10.
• Existence of access audits. • The analysis of visit numbers uses two sets of
• Levels of volunteering. figures. Averages are based on all responses
• Levels of community involvement. received, but totals are based only on
• Levels of provision for young people. museums which supplied visit numbers for
all of the years 2011-2014.
Figure 3: Average overall service levels • Total visits to museums which provided
for museum users: Audience Development numbers for this period fell by 3.3%,
& Marketing; Access – Display; to 3.75 million in 2014. Visits to the core
Formal Learning; Informal Learning; group of Spotlight respondents fell by
Access – Disability 3.9% over 2011 to 2014.
• A small number of museums did not provide
6 data for all years. Including their data for
2014 there were 3.8 million visits to museums
5 in Wales.
3.79 3.79 • This overall result disguises some significant
4
variations between different types of
museum.
3
• Visits to local museums (non-national and
non-National Trust) actually increased by
2
1.3% to 1.53 million. Visits to Amgueddfa
Cymru fell by 3.4% to 1.67 million while visits
1
to National Trust properties fell by 13.3%
0 between 2011 and 2014.
• These figures show a complex picture,
All museums Core group
highlighting in particular that visit numbers
do not always increase year on year and
fluctuations are normal. While visit figures
have fallen over 2011-2014, based on
museums that provided total visit figures
9
Inspiring Learning, An improvement framework for museums, libraries and archives www.inspiringlearning.com/index.html
10
W
ales Visitor Survey 2013: www.gov.wales/statistics-and-research/wales-visitor-survey/?tab=previous&lang=en
15for every year during 2006-2014. Total visit • There were 52 museums that provided actual
figures over the nine year period actually figures for total visits for all years 2011-2014
rose by 3.1%, highlighting the importance of and only 10 museums that provided just
taking a long term view of visit figure trends. estimates. Where museums did not specify,
• Museums with higher visit figures tended to it has been assumed that they provided
deliver higher levels of service. This pattern estimates.
was consistent across all range statements. • In contrast, only 18 museums were able to
This is perhaps unsurprising given that provide an actual breakdown between adult
museums with greater visitor numbers are and child (under 16) visits for all years
likely to have greater levels of staffing and 2011-2014. Whilst it is recognised that this
resources. can be challenging, as it depends on the
museum’s approach to counting visitors,
For the first time in a Spotlight survey, museums museums need to understand who their
were asked to provide a breakdown of the users are.
numbers of adult and child visits (under 16).
• Although only 30 museums provided a Museums were asked to provide details on their
breakdown of adult and child visits for all normal opening hours.
years over the period 2011-2014 the data can • 63% (49) of respondents were open all year.
still provide some useful insight. For instance • 33% (26) of respondents close for part of the
on average children accounted for 21% of year as part of a regular seasonal closure.
total visits to museums during this period. • 2 museums were closed for part of the year
Museums were also asked to state whether for reasons such as repairs or redevelopment.
the visit figures they provided were actuals • 1 museum was open by appointment only all
or estimated. year round.
In the Spotlight
Llyn Cerrig Bach collection at Oriel Ynys Môn
In the summer of 2012 many objects from the Llyn Cerrig Bach collection, including the finest,
were exhibited at Oriel Ynys Môn. It proved to be a rewarding and successful partnership between
Anglesey County Council and Amgueddfa Cymru – National Museum Wales. This collaboration
contributed in enhancing the reputation of the National Museum as borrowers of national
collections as well as extending the reputation of Oriel Ynys Môn beyond Wales as a venue able
to loan significant works from other UK institutions.
© Llyn Cerrig Bach collection at Oriel Ynys Môn
16Figure 3.1.1: Total visits to all museums which supplied figures for all years 2011-2014
4000000
3500000
1472817 1474972 1518524 1492104
3000000
2500000
684647 618800
2000000 588641 593826
1500000
1000000
1728549 1752610 1648790 1670523
500000
0
2011 2012 2013 2014
Local museums National Trust Amgueddfa Cymru
The following charts show total visits to museums by type that supplied figures for all years
2011-2014.
Figure 3.1.2: Amgueddfa Cymru (7 museums) – Overall change 2011 – 2014 -3.4%
1800000
1752610
1750000
1728549
1700000
1670523
1648790
1650000
1600000
1550000
2011 2012 2013 2014
17Figure 3.1.3: National Trust museums (10 museums) – Overall change 2011-2014 -13.3%
700000
684647
680000
660000
640000
618800
620000
600000 593826
588641
580000
560000
540000
2011 2012 2013 2014
Figure 3.1.4: Local museums (54 museums) – Overall change 2011-2014 +1.3%
1530000
1518524
1520000
1510000
1500000
1492104
1490000
1480000 1474972
1472817
1470000
1460000
1450000
1440000
2011 2012 2013 2014
18Figure 3.1.5: Total visits to all museums and core group which supplied visit figures for every
year 2011-2014
3,886,013 3,846,382
4,000,000 3,755,955 3,756,453
3,500,000
3,000,000
2,609,038 2,575,191 2,507,011 2,507,952
2,500,000
2,000,000
1,500,000
1,000,000
500,000
0
2011 2012 2013 2014
Core group All museums
Figure 3.1.6: Total visits to museums since 2006
4,500,000
4,000,000
3,500,000
3,000,000
2,500,000
2,000,000
1,500,000
1,000,000
500,000
0
2006 2007 2008 2009 2010 2011 2012 2013 2014
All museums Core group
19Figure 3.1.7: Average visits by type of museum which provided data for all years 2011-2014
300000
246396
250000
219327
206457 209214
200000
150000
100000
68465
56288 53557 54018
50000 37875 37316 38965 37349
14977 15712 15541 16360
0
2011 2012 2013 2014
Amgueddfa Cymru Local Authority Independent National Trust
Figure 3.1.8: Average visits by size of museum which provided data for all years 2011-2014
200000
175055 173828
180000 170584 167706
160000
140000
120000
100000
80000
60000
40000
23495 23535 22525 24236
20000
3872 3156 2972 3207
0
2011 2012 2013 2014
Large Medium Small
20Figure 3.1.9: Levels of service for users by size of museum
Fewer than More than
10,000 visits 50,000 visits
annually annually
(Small)
3.30 (Large)
4.81
3.69
10,000 – 49,999 visits
annually (Medium)
3.2 Economic impact of visits • Using the visitor data provided by museums
it is possible to calculate gross economic value
to museums of visits to museums in Wales at £82,780,467
Museums can make important contributions in 2014.
to the economy helping to attract tourists and • This figure was calculated as follows:
driving visitor spend. This visitor spend has
–– Establish total adult visits to museums
wider benefits to other businesses such as cafes,
in 2014 (3,003,604 based on the adult/
restaurants, accommodation providers as well
child ratio of 79/21); use estimates for
as other visitor attractions.
proportion of local, day and overnight visits
• The Association of Independent Museums provided by DC Research based on the
has published an Economic Impact Toolkit size of museums; multiply these by visitor
which was developed by consultants DC spend assumptions for Wales.
Research to help museums express the gross
–– Actual ratios for local, day and overnight
impact of visits to their museum in terms of
visits were not available from museums so
economic value11. This toolkit can be used
the average ratios provided by DC Research
by individual museums but can also help
were used. No data or average estimates
provide an idea of this economic value at
for overnight visits were available so visits
an aggregate level.
have been divided into local and day visits
• The calculation is relatively straightforward only. This means that the overall economic
taking the number of adult visits to a value of visits is likely to be a conservative
museum, establishing the proportion of local, estimate given the higher levels of visitor
day and overnight visits and multiplying spend associated with overnight visits.
these by average visitor spend assumptions.
Spend assumptions have been developed
by DC research from regional and national
tourism volume and value datasets which
were updated in 201412.
11
www.aim-museums.co.uk/content/research_papers/
12
www.aim-museums.co.uk/downloads/f6e017ac-8f11-11e3-8be4-001999b209eb.pdf
21Figure 3.2.1: Estimated ratio of local visits to day visits by size of museum13
Local visits Day visits
Small museums 47 53
Medium museums 44 56
Large museums 31 69
Figure 3.2.2: Regional visitor spend assumptions14
Average spend Average spend
Welsh Region
(local visitor) (day visitor)
South East £15.30 £30.61
South West £22.49 £44.98
Mid £18.96 £37.92
North £14.39 £28.78
Figure 3.2.3: Economic impact of visits to museum in Wales 201415
Welsh Adult Value of Adult Value of Adult Value of Total value
Region visits visits visits to visits visits visits of visits
to small medium to large
museums museums museums
South East 6,739 £157,789 137,876 £3,291,596 1,387,901 £35,896,533 £39,345,918
South West 32,497 £1,118,212 198,448 £6,962,429 328,333 £12,479,314 £20,559,955
Mid 15,505 £449,781 42,411 £1,254,416 98,958 £3,170,852 £4,875,049
North 30,197 £664,838 155,153 £3,482,937 569,584 £13,851,770 £17,999,545
Total £2,390,620 £14,991,378 £65,398,469 £82,780,467
3.3 Online engagement • An online presence is increasingly important
in engaging with audiences and can be
The rapid advances in digital technology in critical in providing ‘discovery’ information
recent years offer museums great potential for for current and potential users.
new forms of engagement beyond the physical
visit. Spotlight 2015 asked museums about their • The Welsh Government’s ‘Visitor Information
online and social media presence. Needs Survey 2013’ found that websites were
increasingly being used to inform planning16:
• 97% of museums have a website based
on the responses to this survey. This has –– 52% of overseas visitors used a website
increased from 86% reported in the Spotlight for information prior to their trip;
2011 report. Museum websites serve many –– 45% of UK staying visitors used a website
different audiences from tourism to education for information prior to their trip;
and their content can range from basic visitor –– 17% of day visitors used a website for
information to in depth research and entire information prior to their trip;
collections being made available online.
13
www.aim-museums.co.uk/downloads/f6e017ac-8f11-11e3-8be4-001999b209eb.pdf, p.2, op cit
14
www.aim-museums.co.uk/downloads/f6e017ac-8f11-11e3-8be4-001999b209eb.pdf, p.5, op cit
15
P lease note that as these figures are rounded to the nearest whole number, total visit numbers given within this table may not
be equal to total visits overall
16
V isitor Information Needs survey 2013 – www.gov.wales/docs/caecd/research/130901-visitor-information-needs-2013-en.pdf
22• In total, museum websites received Figure 3.3.2: Average number of social
3,871,624 unique visitors in 2013/14, media subscribers in 2013/14
highlighting the importance of websites
in supporting engagement with museums. 8000
• Museums were also asked if they use social 7000
media to engage with audiences. 91% (71)
of respondents said they did, which is a 6000
significant increase on the 45 museums 5000
saying they used social media in the previous
Spotlight survey. In total, museums had 4000
236,293 followers across all social media 3000
platforms. The most popular social media
platforms were Facebook and Twitter. 2000
The survey asked for data for 2013/14, 1000
however a number of museums could not
0
access historical data so provided data that
Small
museums
Medium
museums
Large
museums
was correct at the time of completing the
survey so these figures should be treated
as a guide.
Figure 3.3.1: Average number of website
visitors by museum size in 2013/14 3.4 Museums and learning
250000 Learning and education are important functions
of all museums. ‘Advancement of Education’
is one of the main purposes of museums
200000
established as charities17. Spotlight 2015
explored the quantity and quality of both
150000 formal and informal learning provision through
numerical data and Range statements.
100000 • Museums were asked to provide data on the
number of sessions and participants in both
formal and informal learning activities in
50000
2013/14. In total, museums provided 11,597
learning sessions and engaged 625,578
0 participants. Comparative data is not available
from the previous Spotlight survey as only the
Small
museums
Medium
museums
Large
museums
number of outreach sessions and partnerships
with local communities was captured and the
number of participants was not collected.
• ‘A Museums Strategy for Wales’ encourages
museums to use the ‘Inspiring Learning for
All’ (ILFA) framework to plan and evaluate
learning18. Museums reaching level three
or higher in the learning range statements
are likely to have an understanding of,
and use ILFA.
17
T he Establishment and Maintenance of a Museum and/or Art Gallery’, Charity Commission www.charity-commission.gov.uk/Start_
up_a_charity/default.aspx
18
A Museums Strategy for Wales, Welsh Assembly Government, 2010 p.15, 3.4.2, op cit
23• 79% of museums reach level three or higher qualified staff able to provide formal learning
for formal learning and 88% for informal opportunities highlighted by changes in the
learning. This is an interesting reversal of workforce shown in Figure 5.4.1.
the previous Spotlight survey where 81%
of museums did so for formal learning while In the Spotlight
only 75% did so for informal learning. Joseph Parry’s Ironworker’s Cottage
This change could potentially be explained
In 2013, education staff from Cyfarthfa
by the way responders have defined their
Castle worked in partnership with Brecon
museum’s learning offer.
Road Infants School, Merthyr Tydfil to submit
• The previous Spotlight survey identified a fall an entry to the Welsh Heritage Schools
in the number of museums in the core group Initiative (WHSI). The project resulted in
responding to the learning range statement pupils providing costumed guided tours of
at level three or above. For formal learning the museum, with over 120 people attending
this has continued to fall, dropping from 86% the event. The project won first prize in the
to 79%. However, for informal learning it WHSI’s ‘Infant School’ category.
has risen from 78% to 86%. This fall could
be explained by a reduction in the number of
Figure 3.4: Average service levels of learning provision by type and size of museum
6
5
4
3
2
1
0
Independent LA National National Small Medium Large All
Trust museums
Formal Learning 3.10 4.26 5.86 3.30 3.19 3.68 5.17 3.83
Informal Learning 3.55 4.10 5.00 3.80 3.68 3.67 4.83 3.94
3.5 Museums and local engaged 124,992 participants in learning
activities outside of the museum.
communities
• Learning opportunities are not just provided 3.6 Museums and equalities
inside museums. Outreach work is an
important part of the learning offer from • Museums have an important role in
many museums and an important way of supporting equality in society and this should
involving local communities which might be reflected throughout their audiences,
not use the museum building. Across both collections and their organisation and
formal and informal learning opportunities, workforce as a whole. The importance
museums provided 2,419 sessions and of equality is something that features
24prominently in the recently updated Code
of Ethics for Museums published by the In the Spotlight
Museums Association in November 201519. Hidden Now Heard
• Museums can address equalities in a variety In January 2015 the Hidden Now Heard
of different ways but one of the most visible exhibition launched at Swansea Museum.
is through the exhibitions, events or activities The exhibition tells the stories of patients,
they programme. their relatives and staff of Hensol Hospital,
• 80% of museums ran exhibitions, events or a former institution for people with a
activities that specifically addressed at least learning disability.
one area of equalities in the last two years. The exhibition is part of Mencap Cymru’s
This compares to only 58% of museums Hidden Now Heard project, which received
that had done so at the time of previous a £292,000 grant from the Heritage Lottery
Spotlight 2011 survey. The most common Fund and an £18,000 grant from the
were in relation to age; 48% ran exhibitions, Welsh Government. The three year project
events or activities specifically targeted at will focus on six long-stay hospitals like
young people (16-25) and 39% targeted Hensol with exhibitions happening across
at older people (60+). 31% ran exhibitions, six regional museums. It is the first pan-
events or activities targeted at Welsh Wales project of its kind and will capture
speakers. These equality areas were also a hidden part of Wales’ history from the
the most commonly provided for in 2011, hospitals which closed in 2006. Working in
while provision for the other equality areas partnership with St Fagans National History
has also remained relatively consistent. Museum, a permanent exhibition will be
created at St Fagans so that information
about Wales’ long-stay hospitals will be
available and accessible to the public,
creating better understanding of a previously
underrepresented part of our society.
Figure 3.6.1: Provision for different equality areas by type of museum, Spotlight 2015
45
Number of exhibitions, events or activities
40
targeted at different equality areas
35
30
25
20
15
10
5
0
Gender/
transgender
Age – General
(60+)
Sexuality
Disability
ethnicicity
people (18–25)
Welsh speakers
Socio-economic
group
or belief
Age – Older
Race or
Age – Young
Religion
National Trust Independent Local authority Amgueddfa Cymru
25Figure 3.6.2 Provision for different equality areas by type of museum, Spotlight 2011
40
Number of exhibitions, events or activities
35
targeted at different equality areas
30
25
20
15
10
5
0
Gender/transgender
Religion or belief
Age – General
Age – Older (60+)
Sexuality
Disability
Race or ethnicicity
(18–25)
Socio-economic
group
Welsh speakers
Age – Young people
Independent Local authority Amgueddfa Cymru
(inc. National Trust)
3.7 Museums and access audits • While the majority had undertaken full access
audits, only 40% had undertaken one in the
• The Museums Strategy for Wales encourages past three years, with some museums last
all museums to carry out full access audits on undertaking a full audit back in 2005. This is
which to base and prioritise improvements. an unexpected result, given the requirement
Having an access statement that addresses within the Accreditation standard for
physical, intellectual, social, geographical and museums to have ‘conducted an assessment
cultural access is also a requirement of the of access needs within the last five years’.
Accreditation standard and undertaking such
work to address these should be built into
forward planning.
• 67% (52) of museums that responded to
the question had carried out a full access
audit. The remaining respondents stated
that they did not know when the last full
access audit had been undertaken. This is
a considerable increase on the 45% (47) that
had undertaken a full access audit at the time
of the previous Spotlight survey. This increase
may be partly due to the high percentage
of museums being within the Accreditation
scheme and therefore more likely to have
undertaken a full access audit.
26Figure 3.7: Year of museum’s last full access audit
20
15
10
5
0
Before 2011 2012 2013 2014 2015
2011
274. A Collection for the Nation
Collections of artefacts are a core purpose of Figure 4.1: Average levels of collections
museums. Spotlight 2015 asked questions about care and management: Environmental
levels of care and management of collections Monitoring; Environmental Control;
as well as acquisitions and disposals and stored Storage and Housekeeping; Display and
collections to provide a sense of how museums Housekeeping; Documentation
are addressing issues of sustainable collecting.
The ‘Museums Strategy for Wales’ encourages 5
active, sustainable management of collections 4.30 4.28
and an indication of current activity is needed
4
to enable monitoring of trends.
For Spotlight 2015 the decision was taken not 3
to survey on the types and size of collections
to reduce the volume of information requested
from museums. This was partly in recognition 2
of the fact that museum collection sizes and
types tend to remain relatively static over short 1
periods of time.
0
At the last count in the 2011 survey there
All museums Core Group
were approximately 5.5 million items held
by museums in Wales. The vast majority
(4.5 million) were held by Amgueddfa Cymru,
with slightly more than 1 million held by local 4.2 Recent acquisitions
museums and National Trust properties. and disposals
Museums were asked to report how many items
4.1 Levels of collections care they had acquired and disposed of in the past
and management two years (2013 and 2014) by gift, purchase
and in the case of disposal, by destruction.
• Levels of collections care and management
have remained relatively steady since the last • There has been a significant drop in the
Spotlight survey, with very little actual change number of acquisitions in the last two years.
in the average ratings for museums across In total, 12,984 items were acquired by
the range statements. museums either by purchase or gift in 2013
and 2014. By comparison, in the previous
• For museums that responded in 2015 and in
two years at the time of the last Spotlight
2011, the average levels of collections care
survey (2009 and 2010) there were 249,597
and management remained at 4.3. The only
acquisitions. While these numbers are not
changes of note were a slight fall in the rating
comparable given the significantly smaller
for display and housekeeping which fell from
sample size in 2015, the downward trend
an average of 4.56 to 4.41 amongst the core
is equally present across the core group of
group of respondents.
museums which fell by 96% from 240,933 to
• As in 2011, storage presents the greatest 9,921. It should also be noted that changes in
collections care challenge with levels falling the number of acquisitions do not necessarily
from 3.81 down to 3.75 for both the core reflect changes in the level of acquisitions
group and those that responded to both the activity or in the significance of acquisitions.
2015 and 2011 surveys. Levels of standards
of storage were rated the second lowest
of all the Range Statements in 2015.
28• The number of items leaving museum museums identified items as having been sold
collections was also low. 89% of museums while six museums identified items that had
that responded to the question said that no been destroyed. The survey did not explore
items had been sold or destroyed. Only two the motivations behind these disposals.
In the Spotlight
Wrexham Museum Mold Cape
In 2013, Wrexham Museum borrowed the Gold Mold Cape from the British Museum as part of
their Capes, Beads & Burials – The Mold Cape: A New Perspective exhibition. The Mold Cape, a
ceremonial Bronze Age gold cape discovered in Flintshire 180 years ago and one of the British
Museums’ most prized artefacts attracted over 16,500 visitors over 6 weeks.
Copyright Anglesey County Council
Figure 4.2: Total acquisitions by museums in 2013 and 2014
596
27
306
Amgueddfa Cymru –
purchases
Amgueddfa Cymru –
gifts
Non-national –
purchases
Non-national –
gifts
1,2055
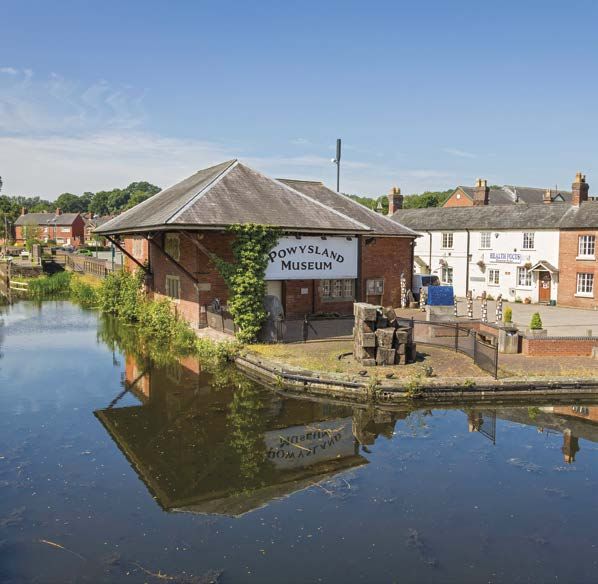
294.3 Storage In the Spotlight
As the response to the storage and In 2011/12 Newport Museum and Art Gallery
housekeeping range statement suggests, was supported by the Museums, Archives
appropriate storage poses a major challenge and Libraries Division through a Welsh
to many museums. Government Innovation & Development
• In 2006, 42% of museums said their grant to undertake a storage rationalisation
stores were already full, and a further 25% project. More than 1,200 framed works on
said they would be full by 2011. In 2011, paper were removed from their frames and
41% reported their stores were already full, boxed; this has improved storage conditions
and 25% would be full by 2016. and freed up hanging space for paintings.
• The results from Spotlight 2015 continue The museum also received an Innovation
to follow this trend with 49% of the & Development grant in 2014 to digitise
67 museums that responded to the question watercolour paintings in their collection.
stating their stores are already overcrowded. More than 2,000 works were digitised and
This represents increase of 8%. half of those were uploaded to the People’s
• The previous Spotlight report highlighted Collection Wales website.
a link between museums achieving levels
four to six in the policy and planning range
statement and those same museums being
less likely to have overcrowded stores.
The results of the 2015 survey suggest that
this is no longer the case with museums
reporting their stores were either full or
would be in 5 years more or less even across
all levels achieved for policy and planning,
suggesting the problem over overcrowding
is now a universal issue.
Unknown artist, Newport Castle after a watercolour
drawing by JMW Turner, c.1800
Figure 4.3 Time estimated for stores to become overcrowded
More than
10 years
12%
5–10 years
18%
49%
21%
Already
Up to 5 years overcrowded
305. Working Effectively
This section focuses on how museums are run, 5.1 Policy and planning
looking at their workforce, their policy and
planning, buildings provision and their financial • Levels achieved for standards of policy and
operations. The way in which museums are planning have increased considerably since
managed has major implications for their ability the last Spotlight survey with 92% (66) of
to care for their collections and to provide high respondents to the question achieving a level
standards of service for their communities and three or above in the Range Statement.
audiences. Spotlight 2015 asked questions • 63% (45) of respondents achieved a level
about numbers, employment and development four or higher, which compares to just under
opportunities for staff and volunteers. half in 2011. This is a significant step towards
• Museums were asked to self-assess levels meeting action 5.1 of ‘A Museums Strategy
of performance in policy and planning, for Wales’20.
workforce development and buildings • Museums that reach a higher level for the
provision. The low levels achieved in 2006 policy and planning range statement also
prompted the inclusion of improvements tend to reach higher levels for other Range
in policy and planning as an action within Statements as the table below demonstrates.
’A Museums Strategy for Wales’. • Museums recording a level four or above
• In 2011 sources of income were surveyed achieved an average of 4.32 across all areas
for the first time. The 2015 survey took while those recording a level three or below
this further by asking museums to provide achieved 3.54. It is worth noting that only
actual income and expenditure figures across 8% (6) of museums recorded below a
a number of categories including earned level three.
income, public subsidy, contributed income
and grants. This was intended to provide
financial benchmarks which museums could
use to assess their financial health.
Figure 5: Average service levels for
management; Policy and Planning;
Staff & Volunteering Development;
Provision of Suitable Buildings
5
3.99 3.97
4
3
2
1
0
All museums Core Group
20
A
ction 5.1 seeks to improve levels of policy and planning in museums in Wales ‘A Museums Strategy for Wales’, p30, op cit
31You can also read