SOLENT STRATEGIC TRANSPORT INVESTMENT PLAN - May 2016 - Solent LEP
←
→
Page content transcription
If your browser does not render page correctly, please read the page content below
SOLENT STRATEGIC TRANSPORT
INVESTMENT PLAN
May 2016

SOLENT STRATEGIC TRANSPORT INVESTMENT PLAN   CONTENTS

CONTENTS   01            A GROWING
                         ECONOMY                Page 7

           02            TRANSPORT
                         CHANGES                Page 15

           03            COMPARATIVE
                         BENCHMARKING           Page 27

           04
                        TRANSPORT
                        INVESTMENT              Page 31
                        PACKAGES

           05           CONCLUSIONS
                        AND NEXT STEPS          Page 43

           Appendices                           Page 44

                                                             3
SOLENT STRATEGIC TRANSPORT INVESTMENT PLAN FOREWORD SOLENT STRATEGIC TRANSPORT INVESTMENT PLAN FOREWORD
FOREWORD A £151.9M
Since the publication of our Growth Strategy in January SOLENT GROWTH
2015, we have been working hard to help this world- DEAL WITH THE
class area achieve its full potential.
GOVERNMENT HAS
The Solent Strategic Economic Plan
(SEP): Transforming Solent aims to place
We are pleased to see some early
results from this work with the
investment and strategic plans* and at a
central government level, alongside the
Moving forward, with the continued thrust
towards devolution and the agreement
BEEN AGREED
the Solent on a new and transformative announcement by Highways England investment and strategic plans of Network
of devolution deals nationally as well as a
growth trajectory and in order to do this in September 2015 of major upgrades Rail** and Highways England*** as well
devolution deal under negotiation locally,
we have set ourselves ambitious targets to the Strategic Road Network over as the investment plans of both local
there is a unique opportunity to secure
for growth and productivity. Meeting this the next five years, including enhancing public transport operators and regionally
support from government for the local
aspiration requires the area to create capacity on the M3 between Winchester significant private commercial transport
area that underpins the aspirations and
conditions that support growth. We and Southampton, enhancing capacity infrastructure operators including both ambitions of residents and businesses in
have recently published a Productivity on the M27 between Southampton and airport and ports. the Solent. Our strategy remains focussed
and Growth Supplement, which Fareham through SMART Motorways, on securing high growth opportunities
highlights the need for significant a comprehensive improvement to the This plan sets out a clear and bold for the Solent, working with the business
investment to modernise our transport strategic freight route interchange at ambition that in the period to 2040 community, individual businesses, local
system, recognising that transport has Junction 9 of the M3 with the A34, we support and prioritise strategic key partners such as Solent Transport,
a vital role to play by bringing businesses and junction improvements around transport investment in the Solent that as well as central government and
and people closer together and fostering Southampton on the M27 and M271, will underpin the development of the its agencies. This Strategic Transport
the agglomeration economies that make improving access to the Port of Solent so that it can achieve its economic Investment Plan provides a framework
cities work. Transport connects people Southampton. potential. The Plan focusses on those within which we can accelerate the
to jobs and products to markets, it economically transformative and longer delivery of the Solent Strategic Economic
underpins supply chains and logistics This document seeks to provide a term investments necessary to support Plan, increasing productivity in the area
networks, and it is fundamental to strategic investment framework for the and unlock the Solent’s growth potential and enabling the economy and people of
domestic and international trade. The area and it seeks to inform the refresh of over the next 25 years, with a metro-style the Solent to achieve their full potential.
connectivity, condition and capacity of our Solent Strategic Economic Plan (SEP). public transport service connecting our
our transport network is therefore critical It will also inform further dialogue with cities playing a central role, alongside This document has been developed in a
for improving productivity and increasing government, enabling us to build on the improved rail connectivity to London. It is changing environment and will be updated
wealth creation. Key to this will be the investment commitments already made, recognised that alongside this we need to to reflect changes in the local economy,
need to identify intelligent transport with a view to securing a greater level of embrace new and emerging innovations new innovations in technology****, as
solutions to support the area’s ambitions. commitment to collective planning and in transport including the adoption of well as the need to respond to new local
delivery of strategic transport across all autonomous and driverless solutions. growth opportunities that may come
We have already agreed a £151.9m modes in the Solent and connecting the It is our intention that these creative forward under devolution.
Solent Growth Deal with government, Solent to its markets. opportunities underpin the development
funding a number of new infrastructure of our transport investment proposal as
and skills capital projects starting in This document underpins the Solent we move forward.
2015. Furthermore, government has Strategic Economic Plan (SEP) and
worked with Solent LEP and local should be read alongside the SEP and
** Wessex Route Specification: http://www.networkrail.co.uk/
partners to create the Solent Strategic our Productivity and Growth Supplement, Network_specification_Wessex.aspx
Land and Infrastructure Board (SSLIB) as well as alongside, local transport Control Period 5 Delivery Plan: http://www.networkrail.co.uk/
publications/delivery-plans/control-period-5/cp5-delivery-plan/
to take a strategic view of public land
*** Roads Investment Study: https://www.gov.uk/government/
* Transport Delivery Plan: http://documents.hants.gov.uk/transport-
and property in the area, and to support for-south-hampshire/TransportDeliveryPlan.pdf
publications/road-investment-strategy-for-the-2015-to-2020-
road-period. Highways England Delivery Plan: https://www.gov.
the joint planning and delivery of transport. Local Transport Plan 3 Joint Strategy for South Hampshire: http:// uk/government/uploads/system/uploads/attachment_data/ Gary Jeffries
www3.hants.gov.uk/local-transport-plan-strategy-south-hampshire file/424467/DSP2036-184_Highways_England_Delivery_Plan_
Solent LEP Chairman
Island Transport Plan: https://www.iwight.com/azservices/ FINAL_low_res_280415.pdf Image: Britannia Cruise Liner
documents/1190-itp-strategy-v1.pdf **** Including the adoption of driverless vechiles Credit: Associated British Ports
4 5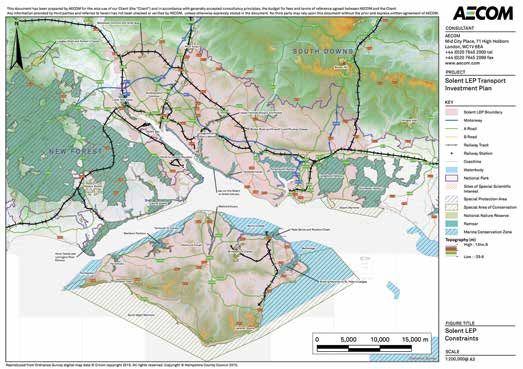
01
SOLENT STRATEGIC TRANSPORT INVESTMENT PLAN INTRODUCTION SOLENT STRATEGIC TRANSPORT INVESTMENT PLAN A GROWING ECONOMY
INTRODUCTION A GROWING ECONOMY
In 2014, as part of the process to agree Solent’s Local Growth Deal with the UK An analysis of the Solent’s historic growth and future
Government, the Solent Local Enterprise Partnership (LEP) produced a Strategic forecasts show that economic, land use and transport
Economic Plan (SEP) to outline a transformative vision for the future growth of the decisions are inextricably linked. The starting point
local economy. for the Strategic Transport Investment Plan is a
consideration of the nature, scale and potential
Central to this vision is the need for a Furthermore, efficient and effective This Strategic Transport Investment of the Solent’s economy.
modern and resilient transport network transport infrastructure and operations Plan outlines the economic potential
that can enable the region to fulfil its are fundamental to attracting and retaining and current performance of the Solent,
economic potential by providing the a highly-skilled labour force which is the likely trends of future growth and A GATEWAY BASED ECONOMIC STRUCTURE
conditions that enable businesses increasingly mobile in an ever more the existing transport challenges the
The Solent is a significant sub-regional presence, as well as natural assets of most notably in the marine and maritime
and people to thrive and productivity globalised economy. If the Solent area area faces. Drawing from available
gateway economy with strengths across green infrastructure and an attractive sector, and also in defence, logistics,
to increase. To this end, the LEP has aims not just to maintain but to grow its evidence, stakeholder dialogue and new
a range of industries in the private sector. quality of life. and advanced manufacturing (including
worked in partnership with AECOM to comparative economic strengths, they comparative benchmarking, the Plan
At £25 billion GVA, the annual economic advanced materials and photonics),
produce a Strategic Transport Investment must act now to produce and deliver proposes an investment framework in
output of the area accounts for one sixth As a consequence of these economic aerospace, and digital (creative and
Plan that can support the area and its a strategy for a transport system that which a series of investment packages
of that of the whole of South East of assets, the three Solent “ports” and cyber security) are some of the principal
two major economic engines, reflects the goals and ambition of have been identified. These packages
England. Key economic strengths include their respective cities contain important industries which along with tourism benefit
Southampton and Portsmouth, the area. could be implemented as the next
high technology clusters, the SME base, clustered sectors and concentrations of from the unique economic environment in
to succeed and grow in a globally steps on the road towards the Solent
a strong higher and further education economic activity and smart specialisation, the Solent.
competitive economic environment. This Plan outlines a series of developing the necessary modern
transformative evidence-based proposals transport network that can enable it
It is essential that the Solent is not which AECOM has produced from wide- to achieve its economic potential. Figure 1.1 Key sectors in the Solent’s Gateway Economy
complacent about achieving a successful ranging consultation, review of research
and sustainable economic future. In and new analysis that have found the Individual and larger versions of the maps
particular, it cannot afford to ignore the need and desire for investment in a provided in this document are available in GATEWAY ASSETS
& CLUSTERS Port of Port of
critical role that transport infrastructure transport system for the Solent which a supplementary document. Southampton Portsmouth
Logistics / Leisure Defence / Advanced
and operations play in connecting can help deliver strong and sustainable Travel Southampton Manufacturing
Airport
key economic inputs – housing, skills, economic growth. It highlights a range Economic Gateway
investment and innovation – to drive of transport solutions that can act as
future economic growth. the focal point of a strategy for ensuring
that the region can continue to attract COMPETITIVE
Marine Creative,
Aviation & Tourism
inward investment, develop business ADVANTAGE & Maritime Aerospace
Cultural
& Visitor
& Digital
clusters, nurture local skills and talent,
and build on existing assets in order for
the area to successfully compete with
Advanced
similarly sized conurbations in the UK Manufacturing Defence
Transport
(materials, composites & Logistics
and abroad, and deliver a transport & photonics)
system befitting of the size, strength
and aspiration of the region.
SUPPORTING Financial & business services, utilities / ICT, property & construction,
SECTORS hospitality & personal services, health & public services
ENABLING Housing delivery, transport, skills development, inward and business
INTERVENTIONS investment, new firms and innovation
6 7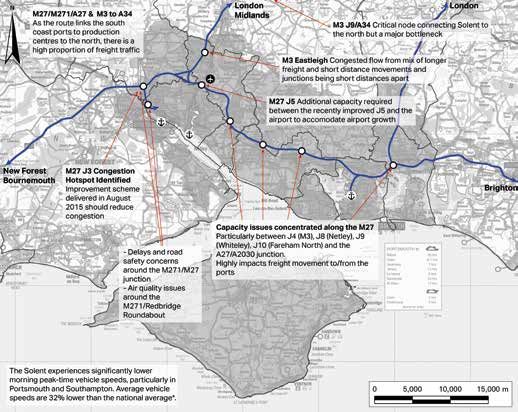
SOLENT STRATEGIC TRANSPORT INVESTMENT PLAN A GROWING ECONOMY SOLENT STRATEGIC TRANSPORT INVESTMENT PLAN A GROWING ECONOMY
As a consequence of these economic comparative advantages across its key Long term population growth has been Figure 1.3 Population change across Solent areas (1981 – 2014)
assets, the three Solent “ports” and sectors to realise economic value. higher in the northern Solent areas.
their respective cities contain important Eastleigh has grown by 39% between
POPULATION CHANGE BY LOCAL AREA 1981 - 2014
clustered sectors and concentrations of 1981 and 2014 adding 36,000 residents.
LONG TERM POLYCENTRIC
economic activity and smart specialisation, Higher than average growth for the period
POPULATION AND Absolute Change % Change
most notably in the marine and maritime was also the case for East Hampshire
HOUSING GROWTH
sector, and also in defence, logistics, (28%), Fareham (28%), Test Valley (30%)
Before we can consider future growth, it is 50,000 45%
and advanced manufacturing (including and Winchester (28%) (Figure 1.3). 39%
45,000 40%
advanced materials and photonics), useful to review past trends in population
40,000 35%
aerospace, and digital (creative and and housing. According to ONS data, 35,000 28% 28% 30%
28%
30%
cyber security) and tourism are some 1.6 million people live across the 12 local 30,000 23%
25%
authority areas that either fully or in part 25,000 18%
of the principal industries which benefit 17% 20%
20,000
from the unique and beneficial economic from the Solent LEP area, whilst 1.3 million 15%
15,000 9%
8%
environment in the Solent. All of these live within the boundaries of the LEP 10,000 6% 10%
26,200
21,000
35,500
27,300
33,700
17,700
25,800
36,000
25,300
6,400
6,500
industries are additionally supported by a itself1. Of the LEP population, more than 5,000 5%
450,000 people (38%) are concentrated 0 0%
wider supply chain that also serves local
re
th
on
y
er
gh
ht
m
nt
st
rt
lle
hi
ou
within the boundaries of Portsmouth and
t
ig
ha
po
pt
lei
re
es
va
ps
population based demand (Figure 1.1).
Va
W
m
m
Fo
st
re
os
ch
Ha
m
rts
st
ha
Ea
of
Fa
G
Ha
in
w
Te
Po
Southampton.
ut
e
W
Ne
Isl
So
st
Ea
Nevertheless, in an era of global Source: ONS, AECOM analysis.
competition, economic assets are only Between 1981 and 2014 the population
ever relative and require continued across all 12 local areas has grown by
investment in order to maintain their 264,000 residents, a total increase of
international attractiveness. Efficient and 20% or 0.6% annually, which is equivalent
to adding around 8,000 people each The long term trend seems to be the Strong but polycentric population growth,
effective transport infrastructure is an
year (Figure 1.2). emergence of an increasingly polycentric combined with evidence of clustered
essential component in the success and
area with population spread more widely economic development, implies that
survival of economic clusters and the
across the area and some decline in the transport infrastructure will play a critical
Solent must act now to strengthen its
proportion of population accommodated function in providing satisfactory links
in Portsmouth and Southampton which between homes and jobs. Ease or
Figure 1.2 Aggregated population in the Solent area (total population (1981 – 2014 only grew by 9% and 17% respectively difficulty of commuting, and thus quality
over the same period. However, in of the transport network, is frequently
absolute terms, the cities have still played highlighted as a key factor in area-based
SOLENT POPULATION 1981 -2014 a significant role in absorbing growth. For economic competitiveness whilst also
example, from a low of 202,000 people in being important to the locational decisions
1988 Southampton had grown by 44,000 of high skilled and highly mobile labour.
1,600,000
people by 2014 (+22%) (Figure 1.4).
1,550,000
1,500,000 More recently, there have been around
1,450,000 4,000 house completions each year
1,400,000 across the whole area. This is consistent
1,350,000 with Solent LEP’s aims to have completed
24,000 houses by 2020, thus
1,300,000
accommodating around 55,000
1,250,000
additional residents.
1,200,000
1,150,000
2011
1981
1982
1983
1984
1985
1986
1987
1988
1989
1990
1991
1992
1993
1994
1995
1996
1997
1998
1999
2000
2001
2002
2003
2004
2005
2006
2007
2008
2009
2010
2012
2013
2014
Source: ONS, AECOM analysis.
1 The Solent LEP area includes the unitary authorities of Isle of Wight Council, Portsmouth City Council and Southampton City Council; Hampshire County Council and Eastleigh Borough Council, Fareham
Borough Council, Gosport Borough Council, Havant Borough Council and parts of East Hants District Council, New Forest District Council, Test Valley Borough Council and Winchester City Council.
8 9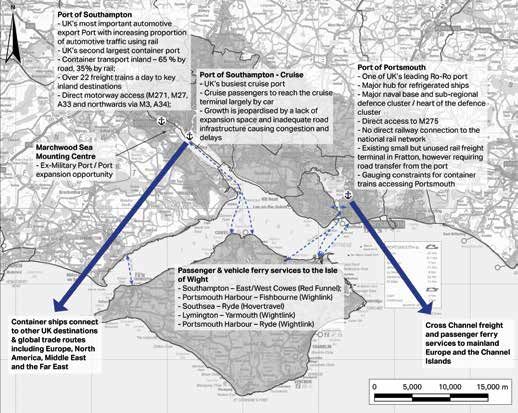
SOLENT STRATEGIC TRANSPORT INVESTMENT PLAN A GROWING ECONOMY SOLENT STRATEGIC TRANSPORT INVESTMENT PLAN A GROWING ECONOMY
CURRENT FORECASTS Figure 1.4 Growth trends by local area (1981 – 2014) RECENT FORECASTS INDICATE THE NEED FOR
6,900
ARE FOR INCREASING ADDITIONAL HOUSING
A MORE POLYCENTRIC AREA 1981 -2014
TRANSPORT DELAYS As well as the existing transport forecasts, As a result, the proportion of local
OCCUPIED
Population % in 1981
The established evidence base (Appendix it is necessary to consider the impacts residents in employment is expected to
Proportion of Growth % 1981 - 2014 Population % in 2014
C) on transport issues in the Solent of more recent independent economic increase, improving the local employment
HOMES
suggests that future growth will affect the 18.0% projections completed for the Solent area. rate and reducing unemployment.
16.0%
economic performance of the transport 14.0%
13.8% 13.6% However, population is also predicted
12.9%
WILL BE
network. Previous analysis (2013) has 12.0%
10.4%
In 2014 alone, employment in the Solent to grow faster than earlier forecasts,
9.9% 9.7% 10.0%
10.0%
forecast that total car trips will grow by 8.0% increased by 3% (+17,800 jobs), the expanding by 11% by 2030 and being
8.0% 6.8%
around 13% by 2026 and that the total strongest annual performance since 2002. driven by increased in-migration. Firms
REQUIRED
6.0%
time lost in delays will increase by more 4.0%
2.4% 2.5% However, recent independent forecasts are forecast to absorb this growth by
2.0%
than 50% compared to current levels. by Oxford Economics (Spring 2015) have employing additional staff as long term
BY 2020
0.0%
Most delays currently occur in the urban been uprated and show that the area productivity growth has not yet returned
e
h
m
rt
t
t
st
h
ton
lley
ter
van
igh
shir
tleig
out
spo
Ha ast
ore
eha
s
t Va
p
of W
che
Ha
areas on radial routes into the city centres, could potentially add 61,500 jobs by 2030 to pre-recession levels in the UK.
rtsm
mp
am
E
wF
Go
Eas
Far
Tes
Win
uth
Ne
Po
Isle
as well as within the city centres. And with GVA growing by 2.7% per annum to
So
Source: ONS, AECOM analysis.
these problems are forecast to worsen in create a £40 billion economy (Figure 1.6). The forecasts therefore suggest that an
the future (Figure 1.5). Employment growth is forecast across a additional 6,900 occupied homes will be
number of sectors including professional, required by 2020 and 16,400 by 2030
As a result, bus speeds into the cities and scientific, technical and support services, over and above earlier forecasts.
Figure 1.5 Forecast future increases in congestion on Solent road network
towns will continue to be low and variable. ICT, cultural and hospitality industries, retail
Furthermore, potential locations for new and construction (Figure 1.7).
housing and population growth are likely
to require longer journeys to work and
could reinforce car dependency unless
Figure 1.6 Total employment forecast in the Solent to 2030, update vs previous (`Oxford Economics)
improvements in alternative modes are
delivered.
TOTAL EMPLPOYMENT, SOLENT UPDATE
VS PREVIOUS 2000 - 2030
CAR TRIPS Update Previous
WILL INCREASE
BY AROUND
700 Forecast
13%
680
660
640
620
600
580
560
540
520
Source: Transport Delivery Plan 2012-2016, Transport for South Hampshire2 , 2013
500
2000 2005 2010 2015 2020 2025 2030
2 Transport for South Hampshire is now named Solent Transport.
10 11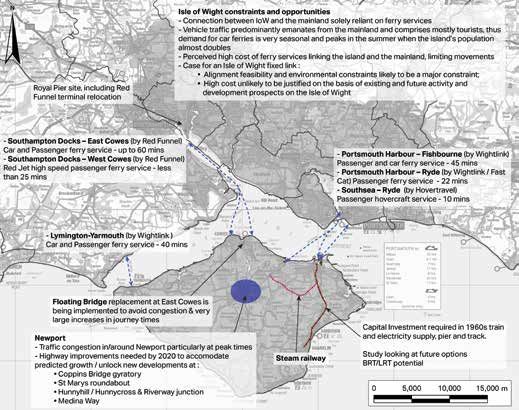
SOLENT STRATEGIC TRANSPORT INVESTMENT PLAN A GROWING ECONOMY SOLENT STRATEGIC TRANSPORT INVESTMENT PLAN A GROWING ECONOMY
Figure 1.7 Percentage change in sectoral employment growth to 2030, update vs previous (Oxford Economics) Figure 1.8 Environmental constraints
SECTORAL EMPLOYMENT GROWTH, SOLENT
UPDATE VS PREVIOUS, 2014 TO 2030
Update Previous
Real estate activities
Professional, scientific and technical activities
Arts, entertainment and recreation
Information and communication
Accommodation and food service activities
Administrative and support service activities
Construction
Other service activities
Transportation and storage
Human health and social work activities
Wholesale and retail trade
Financial and insurance activities
Education
Water supply; sewage and waste management
Agriculture, forestry and fishing
Public adminstration and defence
Manufacturing
Electricity, gas and steam
Mining and quarrying Source: AECOM GIS.
-4.0 -3.0 -2.0 -1.0 0.0 1.0 2.0
Figure 1.9 Development potential on selected major sites
POTENTIAL CUMULATIVE IMPACTS OF 35 KEY
DEVELOPMENT SITES TO EARLY 2030’S
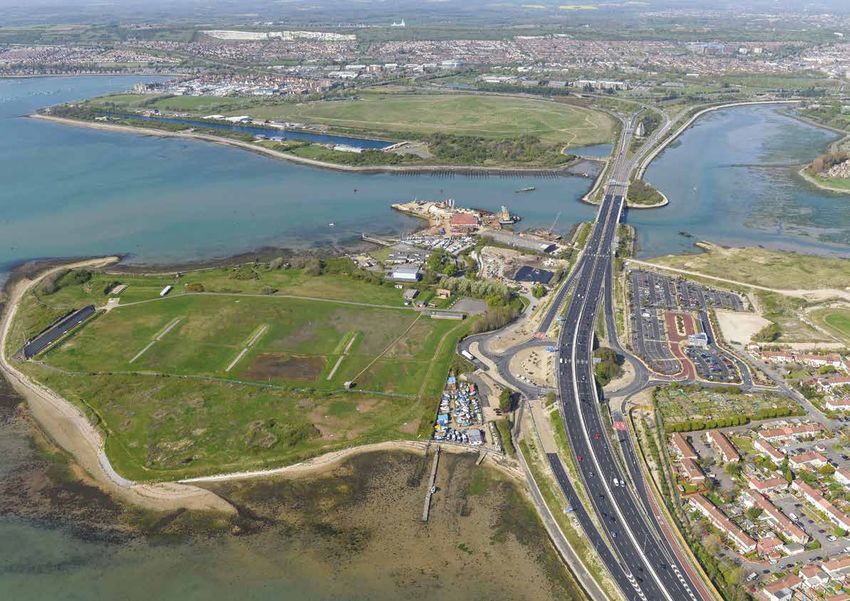
With high quality land and marine The significant growth potential and Working with local partners, AECOM
habitats that form a key element in likely future housing demand sets the has identified selected major potential
Homes Population
the attractiveness of the Solent, a key agenda for what future strategic transport development sites across the Solent LEP
consideration is the potential locations investments must provide to ensure a area. We estimate that together they could 80,000
69,563
69,672
69,781
69,890
69,454
67,652
of new development. The various growing and productive economy. accommodate 30,400 homes, around
65,850
62,009
70,000
ecological and environmental constraints 70,000 new residents and 39,000 jobs
57,498
52,841
such as national parks, water protection As well as population growth – natural and by the early 2030s based on their current 60,000
47,972
areas and topography present in the from in-migration – increasing housing specification (Figure 1.9). There would also
42,976
50,000
area affect the location of growth in the demand arises from the needs of an be additional provision on smaller sites
36,825
40,000
Solent area (Figure 1.8). Current and future ageing population and decreasing across the Solent area.
30,340
30,675
30,387
30,198
30,245
30,292
29,414
28,630
26,961
24,999
urban growth is therefore concentrated
23,524
household size.
22,974
30,000
20,858
18,685
on a corridor between Portsmouth and
16,719
To support economic performance in
16,011
13,337
20,000
10,018
10,228
Southampton and in towns on the Isle the longer term, transport and land use
7,269
4,903
of Wight. planning needs to reflect this potential 10,000 4,356
2,132
1,913
832
growth and consider the effects on
0
the existing transport network.
2016
2017
2018
2019
2020
2021
2022
2023
2025
2026
2027
2028
2029
2030
2031
2032
2033
2024
2034
Source: Hampshire CC, Southampton CC, Eastleigh BC, PUSH, Solent Transport, AECOM analysis.
Excludes small infill sites and the current PUSH Spatial Strategy Review is identifying further strategic locations.
12 13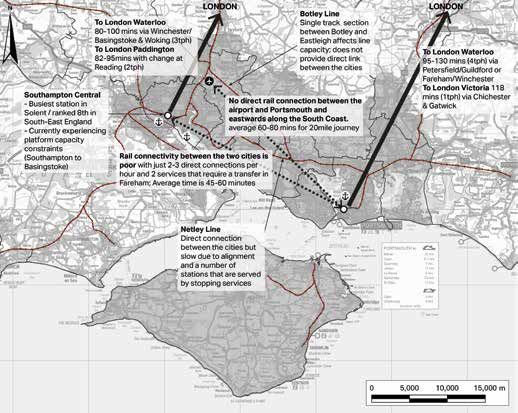
02
SOLENT STRATEGIC TRANSPORT INVESTMENT PLAN A GROWING ECONOMY SOLENT STRATEGIC TRANSPORT INVESTMENT PLAN TRANSPORT CHANGES
THE SOLENT REQUIRES TRANSPORT CHANGES
AN EFFICIENT AND Ensuring the performance of the Solent’s transport
WELL-FUNCTIONING
system and tackling current challenges is central to
improving efficiency, to expanding and integrating
MODERN TRANSPORT
labour and consumer markets and to supporting
national supply chains.
NETWORK • the M3 at Eastleigh : this is congested
due to a mix of longer freight and short
distance movements allied to junctions
that are closely spaced.
• Congestion at M27 J3 although
improvements completed in August
2015 should reduce congestion.
• Delays and road safety concerns
around the M271/M27 junction.
SUMMARY • Capacity required between the recently
improved J5 and the airport and its
The Solent has a clear potential for future Transport is an essential enabler of
environs.
and long term economic and productivity economic dynamism. Successful
growth, with a strong asset base upon transport networks support businesses • Capacity issues along the M27,
which to build. However, transport by facilitating the development of particularly between J4 (M3) and J8
Image: Solent Local Growth Deal Site - St Margaret’s Roundabout
infrastructure is a comparative weakness agglomeration economies, connecting (Netley), J9 (Whiteley) at J10 (Fareham
and already a constraint for the area. supply chains, broadening labour markets The current transport network and its However the performance of the network North), and at the A27/A2030 junction
Given transport’s role as a fundamental and improving productivity for both goods operational performance are central to is weak. Average vehicle speeds are which impacts on local traffic and freight
component of area based economic and labour. the Solent’s economy and its comparative 32% lower than the national average3. movements.
success, the Solent cannot afford to be productivity. The current challenges The Solent experiences significantly
• Capacity constrains along the southern
complacent in the delivery of a transport The Solent requires an efficient and well- for each major transport mode are lower morning peak-time vehicle
section of the M275.
infrastructure network fit for an economy functioning modern transport network considered below. speeds, particularly in Portsmouth and
of its size and potential. that is integrated with an attractive urban Southampton. Over the next 30 years forecasts made
realm and encourages a range of modal by Transport for Southern Hampshire
A competitive transport network is uses. This will be essential for creating an
ROADS AND MOTORWAYS
There are currently a number of points (TfSH)4 show increasing congestion at
required in the Solent to ensure that it can environment that is attractive to the high- The road network is critical for both the of stress on the motorway network which the key pinch points on the strategic road
remain internationally competitive in an skilled labour and high-value industries national and the local economy. impact on the economic performance network and on the key approaches to
increasingly globalised economy. Providing over which regions compete globally of the area. These are: the city centres5.
effective connections between people and to attract and which underpin an area’s The Solent’s motorways and principal
• the M3 J9/A34 : this is a critical node
businesses, their homes and jobs, as well enduring economic strengths. road routes (M27/M271/M275/A27,
connecting Solent (especially freight)
as wider social infrastructure, is the only M3/A34, A3) are key links for freight
to production centres and markets
way that Solent will be able to fully support movements between the south coast
in the north and the midlands but a
and achieve its economic potential. ports, production centres and consumer
major bottleneck.
markets further north as well as providing
road connections to London.
3 LEP Network (2012) - Creating Successful Local Economies.
4 Transport for Southampton Hampshire (TfSH) is now named
Solent Transport.
5 Transport Delivery Plan, Transport for South Hampshire (2013).
14 15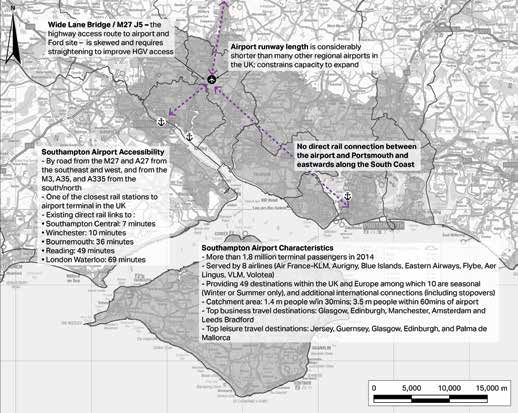
SOLENT STRATEGIC TRANSPORT INVESTMENT PLAN TRANSPORT CHANGES SOLENT STRATEGIC TRANSPORT INVESTMENT PLAN TRANSPORT CHANGES
RAIL
AVERAGE VEHICLE SPEEDS ARE 32%
The Solent has a rail network which covers
much of the current developed area
LOWER THAN THE NATIONAL AVERAGE though there are some key exceptions.
In terms of connectivity, rail journey times
from Portsmouth to Waterloo are between
96 and 109 minutes (via Guildford; 3 trains
Figure 2.1 Strategic road network opportunities and constraints per hour), 129 minutes (via Winchester,
1 tph off peak) and around 118 - 128
minutes to London Victoria (1 tph).
Southampton to Waterloo is between 80
and 100 minutes (3 tph) and services to
London Paddington between 88 and 95
minutes with an interchange at Reading
(2tph). There are a number of specific
factors affecting the Solent’s relative
access to London and the wider south
east economy identified in consultation
Image: Eastleigh Railway Station
and from stakeholders:
• There are relatively poor journey times • There are good regional connections • Future of the Island Line needs to be
from the Solent to London due to track from the area but journey times are slow urgently considered in the context of life
congestion, capacity constraints at compared to similar cities and economic expired rolling stock and infrastructure.6
Waterloo and Clapham Junction and gateways in the UK.
• Rail access to Gosport - One of the
comparatively slow line speeds.
• Rail freight plays a major role to and largest towns in the UK not to be served
• There is no direct rail connection from Southampton but existing and by rail.
between Southampton airport and increased mode share is dependent on
Portsmouth and eastwards along the Strategic infrastructure schemes such
South Coast. as the “Electric Spine”.
• Business regards the journey time • There is no passenger rail access to
between the two main cities as slow: Southampton Waterfront area, which is
the best journey time (1 tph) is 45 expected to see significant growth.
minutes, the other two hourly services
• There is limited interchange in
take 60 minutes (one requiring a
Southampton between existing and
change) for a 20 mile journey. This is
relocated Isle of Wight ferry terminals
in part due to the number of stations
to the wider Solent area by Public
served on the Netley Line.
transport.
Source: Solent LEP / AECOM. • The utilisation of the current rail network
• There is poor public transport access to
is high on a number of rail routes across
Southampton Cruise terminals and the
the Solent area.
Port from wider Solent and the airport.
6 The Island Line forms part of the South Western Franchise, but
operates under a separate Lease Agreement with Network Rail
rather than an Access Agreement. Responsibility for infrastructure
maintenance and renewals is shared between the operator and
Network Rail under this lease, which is due to expire in 2019. In
approaching the re-letting of the South Western franchise, a key
objective of the Rail Executive is to secure an appropriate, financially
sustainable long term future for the Island Line.
16 17
SOLENT STRATEGIC TRANSPORT INVESTMENT PLAN          TRANSPORT CHANGES                                                                SOLENT STRATEGIC TRANSPORT INVESTMENT PLAN             TRANSPORT CHANGES

RAIL JOURNEY TIMES FROM
PORTSMOUTH TO WATERLOO ARE
BETWEEN 96 AND 109 MINUTES

Figure 2.2 Strategic rail network opportunities and constraints

                                                                        Image: Southampton                                                                            Image: Portsmouth

                                                                        PORTS AND FERRIES
                                                                        The Port of Southampton is the UK’s           The Port of Portsmouth is one of the UK’s       • Better integration of modes between
                                                                        second largest container terminal Europe’s    leading Ro-Ro ports and is home to the            ferries and other public transport offer
                                                                        and the most efficient container port in      Royal Navy, including a major naval base          potential and will have an impact on the
                                                                        Europe. It is the UK’s busiest cruise port,   which lies ar the heart of the sub-regional       economies of Southampton and the
                                                                        and the UK’s primary automotive export        defence cluster (with the new QE class            Isle of Wight as well as supporting the
                                                                        hub, providing a critical gateway for our     aircraft carriers arriving in 2017) and a hub     increased use of public transport.
                                                                        resurgent automotive manufacturing            for refrigerated ships.
                                                                                                                                                                      • Greater access options to the cruise
                                                                        industry. From the Port of Southampton
                                                                                                                                                                        line terminals and links to airport would
                                                                        about 65% of containers are moved             Six passenger services and three car
                                                                                                                                                                        improve the offer and reinforce the role
                                                                        onwards by road and 35% by rail with          ferry services provide vital connections
                                                                                                                                                                        of Southampton as the leading cruise
                                                                        over 22 freight trains a day to key inland    to the Isle of Wight from the mainland
                                                                                                                                                                        terminal.
                                                                        destinations. Direct motorway access          Solent area.
                                                                        (M271, M27, A33 and northwards via                                                            • The Port of Portsmouth suffers from
                                                                        M3, A34) accommodates the road freight        Consultation with stakeholders and                no direct connection to the national
                                                                        movements. However cruise passengers          businesses identified the following               rail network.
                                                                        mainly reach the terminal by car and the      opportunities and challenges:
                                                                        port’s growth is constrained by limited
                                                                                                                      • The continued growth and expansion of
                                                                        expansion space and road capacity.
                                                                                                                        the port of Southampton is dependent
                                                                                                                        on the capacity and availability of road
                                                                                                                        and rail space and effective connections
                                                                                                                        to the strategic networks (e.g. freight
                                                                                                                        northwards).
Source: Solent LEP / AECOM.

 18                                                                                                                                                                                                            19
SOLENT STRATEGIC TRANSPORT INVESTMENT PLAN TRANSPORT CHANGES SOLENT STRATEGIC TRANSPORT INVESTMENT PLAN TRANSPORT CHANGES
SIX PASSENGER SERVICES AND THREE
CAR FERRY SERVICES PROVIDE VITAL
CONNECTIONS TO THE ISLE OF WIGHT
FROM THE MAINLAND SOLENT AREA.
Figure 2.3 Ports opportunities and constraints
Image: Southampton Airport
AIRPORT
With eight airlines, Southampton Airport • The airport runway length is shorter than
serves up to 49 short haul UK and many other regional airports limiting
European destinations for business the range of aircraft that the airport can
and leisure travellers (e.g. Glasgow, handle.
Manchester, Amsterdam, Jersey and
• Despite quick and direct rail connections
Mallorca). About 1.4 million people live
to Southampton Central (7 min) and
within 30 minutes of the airport and 3.5
Winchester (10 min), there is no direct
million within an hour. The airport has
rail connection between the airport and
one of the closest rail stations to a terminal
Portsmouth (the journey time is 60-80
in the UK and is adjacent to the M27 so
minutes for a journey of 20 miles) and
is increasingly used as a rail park and ride.
eastwards along the South Coast (apart
Yet a number of transport constraints
from one train a day to Brighton).
Source: Solent LEP / AECOM. affect the economic performance of
this asset: • Locally the road network around the
airport and surrounding development
sites (including a major development
opportunity at the former Ford
manufacturing site) is comparatively
constrained with a number of narrow
and/or old bridges.
20 21SOLENT STRATEGIC TRANSPORT INVESTMENT PLAN TRANSPORT CHANGES SOLENT STRATEGIC TRANSPORT INVESTMENT PLAN TRANSPORT CHANGES
SOUTHAMPTON AIRPORT SERVES UP
TO 49 SHORT HAUL UK AND EUROPEAN
DESTINATIONS
Figure 2.4 Southampton airport opportunities and constraints
Image: Wightlink Ferry
Credit: Portsmouth City Council
ISLE OF WIGHT
The connection between the Isle of Within the Isle of Wight there are a number
Wight and the mainland is based on six transport issues affecting its economic
passenger and three car ferry services performance:
from Lymington to Yarmouth (Wightlink),
from Southampton to East and West • Improving cross Solent connections
Cowes (Red Funnel, Red Jet), from through better interchanges on both
Portsmouth to Fishbourne (Wightlink), sides.
Ryde (Fast Cat) and from Southsea to
• The floating bridge in East Cowes is
Ryde (Hovertravel).
scheduled to be replaced, avoiding
forecast increased journey times.
Vehicle traffic predominantly emanates
from the mainland and comprises mostly • Significant traffic congestion in and
tourists, thus demand for car ferries is very around Newport at peak times.
seasonal and peaks in the summer when
• The operational future and viability of the
the island’s population almost doubles.
Island Line rail service6.
Source: Solent LEP / AECOM. • In addition, local traffic issues and
support for active modes schemes form
a key part of local transport initiatives.
6 The Island Line forms part of the South Western Franchise, but
operates under a separate Lease Agreement with Network Rail
rather than an Access Agreement. Responsibility for infrastructure
maintenance and renewals is shared between the operator and
Network Rail under this lease, which is due to expire in 2019. In
approaching the re-letting of the South Western franchise, a key
objective of the Rail Executive is to secure an appropriate, financially
sustainable long term future for the Island Line.
22 23SOLENT STRATEGIC TRANSPORT INVESTMENT PLAN TRANSPORT CHANGES SOLENT STRATEGIC TRANSPORT INVESTMENT PLAN TRANSPORT CHANGES
Figure 2.5 Isle of Wight opportunities and constraints CURRENT MOVEMENT
PATTERNS
Evidence from the 2001 and 2011 Census
SELF-CONTAINMENT
HAS FALLEN IN
suggests that there are high levels of
movement between the Solent districts
PORTSMOUTH FROM
for work and other journey purposes,
which give rise to significant volumes
of intra-Solent trips, contributing to
traffic issues on the local and strategic
networks. In 2011, 86% of people residing 73% TO 65% AND
in one of the Solent’s twelve constituent
districts also had their workplace in one FROM 66% TO 56%
IN SOUTHAMPTON.
of these districts, showing a high level of
employment self- containment within the
Solent area.
Between 2001 and 2011 the degree of
self-containment (“live and work in the
same place”) has fallen in Portsmouth
from 73% to 65% and from 66% to
56% in Southampton. This decline in
self-containment in the main cities, which
is most likely related to housing market
differentials and the location of new
employment opportunities, suggests
that the transport network will need to
accommodate more inter-node journeys
in the future
Other areas of the Solent LEP feature
Source: Solent LEP / AECOM. relatively low levels of self-containment
such as Fareham (36%), Eastleigh (37%),
Figure 2.6 Travel to work movements in the Solent in 2011 Gosport (39%) or Havant (42%) which are
net exporters in 2011, supplying workers
to main towns and cities across the Solent
area. Unsurprisingly, Fareham, Gosport Image: Solent Local Growth Deal Site – Station Quarter in Southampton
and Havant are supporting Portsmouth’s
job market with respectively 17%, 18%
and 24% of their residents working
in Portsmouth; Eastleigh is feeding
Southampton’s job market with 20%
of its residents working in Southampton.
Source: Solent LEP / AECOM.
24 2503
SOLENT STRATEGIC TRANSPORT INVESTMENT PLAN TRANSPORT CHANGES SOLENT STRATEGIC TRANSPORT INVESTMENT PLAN COMPARATIVE BENCHMARKING
SUMMARY
COMPARATIVE
BENCHMARKING
There is a range of challenges affecting
most modes of transport in the Solent
area which is unsurprising for a growing
area. While the challenges affect the
current performance of key economic
strengths there are opportunities to
Despite being a fast growing economy Solent LEP
ensure these modes can further support has a transport infrastructure deficit compared to
the Solent to fulfil its long term economic many other city regions in the UK.
potential.
The growing number of journeys by “DUAL CITY” BENCHMARKING
car and reduction in comparative self-
An economic-led vision for transport must • Recent population and employment
containment is contributing to the current
consider the potential to improve the growth
congestion levels and poor accessibility
performance of the two main cities in the
for business in the area. The growth of • Growth occurring within city boundaries
Solent area at the same time as enhancing
both housing and employment will be
their local regional connections to reduce • Commuting patterns and mode of
constrained unless better integrated
barriers to trade, widen labour markets transport used
alternatives to car travel exist for both
and secure agglomeration benefits.
short and Solent wide journeys. These • Quantity of transport infrastructure
challenges will require a strategic transport provision by population
To examine comparative performance,
approach that takes account of both local
the Solent area was benchmarked • Relative accessibility to London
and longer distance transport investments.
against other “dual city” areas in the UK
• Local port and airport functions
where two major cities were roughly an
hour apart in journey times. Indicators The other comparator “dual city” areas
assessed included: were Manchester & Liverpool, Sunderland
& Newcastle, Leeds & Sheffield, Derby &
Nottingham, Edinburgh & Glasgow and
Swansea & Cardiff. All detailed tables of
results are available in Appendix B.
Image: Railway Station
26 27SOLENT STRATEGIC TRANSPORT INVESTMENT PLAN COMPARATIVE BENCHMARKING SOLENT STRATEGIC TRANSPORT INVESTMENT PLAN COMPARATIVE BENCHMARKING
“DUAL CITY” Figure 3.2 Comparative accessibility to London by road and rail (AECOM analysis)
BENCHMARKING RESULTS
SOLENT MANCHESTER SUNDERLAND LEEDS & DERBY &
Population growth and economic There is a trend of living in Portsmouth Despite being a similar distance apart
AREA & LIVERPOOL & NEWCASTLE SHEFFIELD NOTTINGHAM
dynamism in the Solent exceeds the UK and Southampton but commuting to jobs the labour market integration between
benchmarks. With a population of 1.6 in the Solent area. The two main cities in Sunderland and Newcastle is much
Average minutes to London by rail 88 138 78 135 90
million, the Portsmouth-Southampton the Solent area are less self-contained higher than between Southampton and
dual area is larger than that of Swansea than some other benchmarks. A relatively Portsmouth. For the former the reciprocal
& Cardiff and could approach the scale high proportion of residents (10%) live labour market flows total around 12,000 Average speed to London by rail (MPH) 53 87 24 82 79
of Sunderland & Newcastle and Derby within the two “main cities” but travel to people. In comparison the labour market
& Nottingham over the next 20 to 30 work outside of them. The average for flows between the Solent cities are just
years. Both population and employment the other benchmarks was 6%. 3,100 (75% lower) showing the potential Average minutes to London by road (mi) 78 217 271 177 125
are growing more rapidly than in all other for market integration benefits.
benchmark areas. Per capita housing The Solent area has a low public transport
Average minutes to London by road 105 210 275 195 140
completions are double many other areas. mode share and less well developed Bus use, tram, metro and road provision
public transport system than benchmarks. all lag comparators indicating a significant
The Solent appears to be an emerging Two thirds of residents travel to work by all-mode transport infrastructure deficit. Average speed to London by road (MPH) 45 62 59 54 54
polycentric area with much population car in the Solent area, in line with other Both public transport and road provision
and jobs growth occurring outside benchmarks, and the average commute seem to lag UK benchmarks. There are
Portsmouth and Southampton, with 40% distance of 10 miles is also broadly significantly lower bus journeys per person
of residents working in a different district comparable. Total commuter travel is per annum – about half the average of In terms of distance the Solent area The Solent area has a large amount of
to where they live. The recent population nearly at the level of Sunderland comparators. There is no local tram or is closer to London than most of the port traffic relative to its size and forecast
growth accommodated within the two & Newcastle and Derby & Nottingham metro network in the Solent and there are comparators, but suffers from lower growth is likely to contribute to further
main cities has been lower than other which have metro or tram systems. At significantly fewer miles of motorway and average speeds by both rail and road. This congestion due to under-provision of
benchmarks. The Solent’s two main cities just 8%, use of public transport to get A-road per person. makes it relatively disadvantaged in terms roads and capacity at peak times. Solent
have accommodated smaller proportions to work is below the average of the other of being able to access markets, supply has relatively few airport passengers for its
of recent employment growth than other benchmarks (13%). A relatively higher Furthermore, population density is the chains and skills within the capital. size (per capita basis) due to its proximity
benchmarks. proportion of people in the Solent work most important indicator of potential to other airports within the London system
from home, cycle or walk to work. public transport use. At 5,141 people per The Solent has a strategic port function and poor connectivity from the east
square kilometre, Portsmouth has the of national importance and potential for
highest UK population density outside of airport expansion.
London. Southampton is not far behind
at 4,858 people per square kilometre. This
indicates significant potential for public
transport take-up.
Figure 3.1 Comparative use and provision of transport infrastructure
(AECOM analysis)
MANCHESTER & SUNDERLAND & LEEDS & DERBY &
SOLENT AREA
LIVERPOOL NEWCASTLE SHEFFIELD NOTTINGHAM
Annual bus journeys per resident 45 80 78 144 58
Miles of tram / metro network per million
0 31 24 6 9
people
Miles of motorway per million people 26 31.6 15.4 45.8 0.1
Miles of A road per million people 14.3 49.4 112.9 65 16.1
28 2904
SOLENT STRATEGIC TRANSPORT INVESTMENT PLAN COMPARATIVE BENCHMARKING SOLENT STRATEGIC TRANSPORT INVESTMENT PLAN TRANSPORT INVESTMENT PACKAGES
EUROPEAN CASE STUDIES TRANSPORT
European case studies for regions of around 2 million people demonstrate what INVESTMENT
is possible with a long term strategic vision based around consistent transport
investments for modal integration and city to city links PACKAGES
Figure 3.1 Randstad Rail plan Figure 3.2 The Oresund rail and road bridge
Local business and stakeholders implementing 25 year
strategic transport investments will support the long
term economic growth of the Solent area.
A FOCUS ON INCREASING Figure 4.1 Strategy of Economic Proximity
ECONOMIC PROXIMITY
High value businesses derive benefits from
being located in close proximity to each
other, their suppliers and their workers.
With 37% of all high skilled employment
in Portsmouth and Southampton, the two
cities are well placed to drive growth in the
RANDSTADRAIL ORESUND SUMMARY private knowledge-intensive industries that
In a city-region of 2.3 million residents Connecting Copenhagen (population 1.3 While the growing Solent area is link to the local competitive advantages
RandstadRail strategically connects million) with Malmo (population 700,000) comparatively dense in terms of and their spatial clusters.
The Hague with Rotterdam in about 30 the Oresund is the largest road and rail urbanisation and has an emerging
minutes with up to 12 trains per hour. bridge in Europe that opened in 2000 at polycentric distribution of housing and We have concluded that in the long term
There are effective interconnections with a cost of €3.5 bn. Journey time from city growth, it has an all modes transport the Solent LEP’s business-led transport
metro, bus and tram in both Rotterdam centre to city centre is just 35 minutes infrastructure deficit, especially for public strategy should aim to “increase economic
and the Hague. With Phase 1 opening with up to six trains per hour. Tolled for transport, lagging behind other UK proximity“ across five spatial areas and
in 2007 and Phase 2 in 2008, additional road traffic will pay for the capital costs comparator areas. The area also suffers along six external strategic corridors. This
bridge and tunnel sections were required by 2037. The trains act as a commuter from relatively slow access to London, strategy (see Figure 4.1) involves a number
as well as a change in the rail franchise. service on the Danish side with stops which erodes its locational advantage. of elements:
Since 1850 the development of the every 4km and as a regional service
• Increase dual city linkages around Source: AECOM.
Randstad railway and station locations in Sweden serving 33 cities including Taken in the round, this suggests that
public transport and business critical
initially followed urbanisation patterns but Goteborg. It is estimated that the bridge there is significant room for enhancing the
movements to integrate labour and
then became a planning tool for locating brings €740 million of labour market Solent’s transport network to support long • Optimise and integrate the transport • A greater focus on Transport Orientated
consumer markets.
and concentrating new development. integration benefits each year and has term economic and productivity growth. network (ticketing, information and Developments (TODs). Increase
helped to “internationalise” Malmo. For example, for inter-city labour market • Support clustering and agglomeration operation) using next generation residential densities around new
For the Solent area, which has similar Commuting levels have increased by a integration this could generate an increase around key local strengths and solutions so travel demand load can be and underutilised transport nodes
topographic issues, the scheme shows factor of seven since opening to reach by a factor of between 4 and 7 compared competitive advantages that other areas spread to improve resilience and peak to accommodate additional housing
the potential to link different modes, use 18,000. The easy access to Kastrup to UK and European examples. cannot replicate (e.g. port functions). capacity accommodated especially development while protecting natural
existing track networks and localise the rail airport has supported new start-up firms in more constrained cities with pinch assets and addressing affordability with
• Develop a corridor of development
franchise operator in the long term. in Malmo. points. the same land take.
nodes based around an improved
public transport offering between the • Secure improved strategic connections
For the Solent area the Oresund shows
cities and across the urban network to to London, the south east (airport
the benefits of a dedicated multi-modal
2040 including easy access to stations passenger market), the UK (especially
link between major cities and the ability
by walking and cycling (active modes). for port freight) and internationally for
to use the service for different functions
airport leisure and business market and
(commuting, regional).
“European” inward investment.
30 31SOLENT STRATEGIC TRANSPORT INVESTMENT PLAN TRANSPORT INVESTMENT PACKAGES SOLENT STRATEGIC TRANSPORT INVESTMENT PLAN TRANSPORT INVESTMENT PACKAGES
TRANSPORT INVESTMENT PACKAGES ALIGNMENT
300,000 TO 400,000
The Solent Strategic Transport Our approach has been to pragmatically • In relation to governance and in the As an economically-led strategic transport
Investment Plan focuses on the more build upon known investments and context of devolution, a new single investment plan, the six elements of
RESIDENTS COULD MAKE
economically transformative and longer directions of travel while seeking to policy and delivery body should be the economic proximity strategy are
term investments8 necessary to support maximise the performance of existing created to determine, manage and aligned with the packages of transport
THE SOLENT AN AREA OF
and unlock the Solent’s growth potential infrastructure. The investments have been deliver transport plans and the delivery investments to be implemented in the
over the next 30 to 40 years. Over this split as follows and offer the opportunity of public transport networks for the short and longer term. These projects
timescale an additional 300,000 to
400,000 residents could make the Solent
an area of 2 million people – equivalent to
to be supported by an evolution of the
local governance and delivery function
drawing from the emerging local
area. This should be based on any
devolution agreement agreed for the
area.
combined would assist the continued
growth of Solent economy over the next
30 years.
2 MILLION PEOPLE
dual cities such as Nottingham/Derby and devolution agenda:
Where applicable, schemes identified,
Newcastle/Sunderland. We have looked at the strategic alignment These packages are detailed in Appendix
• A Solent Transit package which is the developed or promoted by the
of these packages against the six key A which identifies schemes which are
main recommendation and a proposed stakeholders and transport authorities
From a review of the existing evidence indicators identified above. Whilst all have completed, committed/funded and those
step change in the development of a and providers have been reviewed and
base (Appendix C) that has assessed and addressed at least two of the economic which are suggested proposals for future
more extensive and integrated public included as part of the modal packages.
modelled local issues and proposed a proximity indicators, investment in a transit investment rounds.
transport system (including active In some cases strategic opportunities
range of potential schemes for the Solent network for the Solent area, composed of
modes) across the area to preserve have been identified to be developed
area, we have brought together some of different public transport modes, is likely
the attractiveness of the area for skilled further by stakeholders in conjunction
these proposals and other suggestions to have the greatest impact on supporting
workers and growing firms. with the LEP, where they could have
from the stakeholder consultation7 into the economy (Table 4.1).
a potential transformative effect in
initial packages of transformational and • A roads package to ensure the best
connecting new and existing communities
strategic investments that have the performance of the M27, A34 and
to jobs and opportunities within the key
potential to transform the Solent economy. other strategic roads acknowledging Figure 4.1 Strategic alignment of investment packages
corridors identified for growth. In particular
Together these investments can support that additional road capacity is rapidly
the potential to create a local rail based
the long term vision of increasing taken up. The focus is on securing the
Solent Transit network. PROVIDING
economic proximity. committed or funded schemes while PROMOTING
PROMOTING FACILITATING INTEGRATING IMPROVING TRANSIT
SUSTAINABLE
proposing additional schemes for future DUAL CITY CLUSTERING OF THE TRANSPORT STRATEGIC ORIENTATED
DEVELOPMENT
LINKAGES EMPLOYMENT NETWORK CONNECTIONS DEVELOPMENT
The investments are split into an initial Highways England investment phases. NODES
(TOD)
Phase 1 covering five years to 2020
• A strategic rail package to improve Strategic Highway
(short term) and then 20 years over Package (Inc. Ports
connections for passengers and 44 44
Phase 2 (medium term) to give a 25 surface access, local
freight to London, the south east and strategic roads)
year plan to 2040 to align with normal
and nationally working with Network
planning timescales. Strategic Railway
Rail, Train Operating Companies and 4 4 44 44 444 44
Package
other partners. Refranchising gives
the opportunity to improve local Solent Transit (Inc. Rail
service provision. and Bus Rapid Transit 44 44 444 44 444 444
and Fast Ferry Service)
• A range of investments to support Airport Surface Access
the airport’s growth potential including (Inter-city rail and airport 4 44 44 44
adjacent development sites. access)
Source: AECOM/Solent LEP
• A package to improve access to the
nationally strategic port services for both
freight and passengers.
7 See Appendix D for list of consultees.
8 The investments draw on the LEPs existing evidence base
including earlier work considering the potential for transformational
transport investments in the Solent LEP Area (Atkins 2014). This is
supplemented by additional consultation
and research completed by AECOM.
32 33SOLENT STRATEGIC TRANSPORT INVESTMENT PLAN TRANSPORT INVESTMENT PACKAGES SOLENT STRATEGIC TRANSPORT INVESTMENT PLAN TRANSPORT INVESTMENT PACKAGES
STRATEGIC HIGHWAY
SCHEMES
The Gateway economy of the Solent is
highly dependent on its road connectivity.
The two ports and airport in particular
can be affected by unreliability and
delays in the network. Furthermore the
attractiveness of the area for business,
manufacturing and service related
industries will be adversely impacted by
accessibility concerns. Discussions with
businesses have highlighted traffic delays
on the strategic highway network as a key
in their locational decision-making.
The strategic highway network,
comprising sections of the M3, M27 and
Image: Portsmouth Park & Ride Image: M27
the urban motorways of the M271 and Credit: Portsmouth City Council
M275 are the arteries of the LEP area.
Competing demands on the capacity from • M3 at Winchester (Junctions 9-12): • M27 West (Junctions 2-4): The M27 • Development of the Managed Motorway the M275 at Tipner will also assist in well as looking at re-routing and access
local, long distance and gateway related The M3 to the east of Winchester and its connection with the M3 suffer or Smart Motorway concept would help accommodating growth and delivering arrangements for cruise liner traffic.
users make sections of the network highly is influenced by the operation of the same issues as the M3 Junction to manage the impacts of interactions mode shift for trips to the city centre, Clearly development proposals connected
congested. Growth of jobs and housing Junction 9. Reconfiguration of these 13/14. Although major works have of traffic flows and better meet the whilst a new link road has provided a new with the relocation of the ferry terminal
in the future has the potential to further junctions could help prevent queueing been completed to improve capacity on needs of strategic traffic using the route. access to the Naval Base is assisting in and associated development will offer
increase congestion. Lack of competitive traffic impacting the motorway and in the M27 between Junctions 4 and 3, However an integrated approach for the mitigation of the effects of this traffic. challenges to access by all modes and
journey times by public transport are a combination with the Junction 9 works development of the Managed Motorway a future strategy for the M27 corridor these will need to be addressed. It will
key factor meaning that even short hop above alleviate this pinch point in the / Smart Motorway concept for this should focus on the importance of the be imperative that reliable road access
journeys are made on the strategic roads.
STRATEGIC ACCESS TO
network. section of the motorway would help to more strategic movements connecting to the port of Southampton is a primary
SOUTHAMPTON
optimise future traffic flows and help to Portsmouth to Southampton and the consideration, given its economic impact
• M3 at Eastleigh (Junctions 12-14):
The A33 forms the main strategic access
STRATEGIC JUNCTION The M3 around Eastleigh is influenced
alleviate the effects of congestion. M3 whilst working in tandem with and value chain.
route into the city of Southampton and
AND HIGHWAY by multiple users making journeys • M27 East (Junctions 4-12) and A27 to
InterCity and local rail improvements
caters for a mix of traffic generated
IMPROVEMENTS between the Ports of Southampton A3(M) Interchange: This whole section
that will help to offer choice and shift Following Government advice9 on the
short-hop journeys to more sustainable by both the city centre and the port. importance of port access, these road
The following junctions and stretches of and Portsmouth and the north, by of the motorway network is a critical
modes. Development proposals for the City will investments should aim to reduce
the motorway network are identified in traffic accessing Southampton on the component of the Solent strategic
see the city centre expand westwards delays and improve journey reliability
both previous reports by stakeholders A33, and shorter distance journeys network. In addition to strategic
between the Port and Southampton for goods traffic to and from the Port
and in the Highways England investment between Eastleigh and Southampton. movements, the motorway carries large STRATEGIC ACCESS Central station which in turn will increase of Southampton. This will include
priorities 2019/2020: The junctions are short distances apart volumes of more local movements TO PORTSMOUTH traffic demand on the A33 corridor. improvements to M27 Junction 3 and
and this contributes to congestion from between the urban areas. As a result,
• M3 Junction 9: M3 Junction 9 is a In Portsmouth, the principal strategic link Likewise new development around Town potential operation of Managed Motorway
conflicting merging and diverging traffic. the motorway is congested and
vital junction in the regional transport on Portsea island is via the M275. It is Quay and the relocation of the existing along the M271 between this junction and
frequently experiences stop start flows
network. Although the junction is not • The access to the Port of Southampton this corridor that will also accommodate ferry terminal for access to the Isle of the end of the motorway (Figure 4.2).
at peak times.
within the Solent boundary, it is of critical is vital and although some reallocation the bulk of new development and Wight also has access from the A33.
importance to the Solent economy of journeys to port and development • At present, delays are localised at deliver traffic to an enhanced road
because it provides the connection to related activity along the A33 may be M27 Junctions 4, 5, 7, 8, 9 and 10-11 network associated with new city centre The A33 is also the primary route for
the A34 linking the Solent with markets possible, overall the solution to this and at the A27 / A2030 junction east development. Road network changes port traffic, with access to different parts
in the Midlands and North. section may lie in the need to move of Portsmouth. However evidence in the city centre in connection with the of the docks and to the cruise liner
more local movements to public reviewed form Transport for South City Centre Supplementary Planning terminals along the route into the City.
transport thus freeing capacity for longer Hampshire4 and outputs from the Sub- Document will alleviate traffic conditions Improved public transport connections
distance freight and port related traffic. Regional Transport Model predicts that at the southern end of the M275 as well to the city centre and riverside and the 9 Access to ports’, House of Commons Transport Committee:
future congestion is expected to spread as assisting public transport operations. rest of the city would go a long way to Eighth report of Session 2013-14, HC 266 published 26 November
2013, available at http://www.publications.parliament.uk/pa/
to the whole route. Likewise the strategic Park & Ride on helping to alleviate access problems as cm201314/cmselect/cmtran/266/266.pdf
34 35You can also read