Supporting mechanisms for the development of biomethane in transport - CE Delft
←
→
Page content transcription
If your browser does not render page correctly, please read the page content below
Supporting mechanisms for the development of biomethane in transport
Supporting mechanisms
                   for the development of
                   biomethane in transport

                  Authors:
                  Anouk van Grinsven (CE Delft)
                  Cor Leguijt (CE Delft)
                  Jurga Tallat-Kelpsaite (eclareon)

                  Delft, CE Delft, March 2017

                  Publication code: 17.3K49.31

                  Methane / Biogas / Transport / EU / Policy / Government / Measures

                  Client: GRDF.

                  CE publications are available from www.cedelft.eu

                  Further information on this study can be obtained from the contact person, Anouk van Grinsven.

                  © copyright, CE Delft, Delft

                   CE Delft
                   Committed to the Environment

                   Through its independent research and consultancy work CE Delft is helping build a sustainable
                   world. In the fields of energy, transport and resources our expertise is leading-edge. With our
                   wealth of know-how on technologies, policies and economic issues we support government
                   agencies, NGOs and industries in pursuit of structural change. For 35 years now, the skills and
                   enthusiasm of CE Delft’s staff have been devoted to achieving this mission.

1   March 2017   3.K49 – Supporting mechanisms for the development of biomethane in transport
Content
Abbreviations 4
Summary 5
1 Introduction 8
1.5 Outline of this report 10
2 Biomethane use within the case study countries 11
2.1 Introduction 11
2.2 Policy context 11
2.3 Biogas production 12
2.4 Biomethane production 15
2.5 Natural gas and biomethane consumption 16
2.6 Natural gas vehicle uptake 17
2.7 Filling infrastructure developments 18
2.8 Conclusions 18
3 Supporting measures at the national level 20
3.1 Introduction 20
3.2 Summary of policy strategy per case study country 20
3.3 Overall comparison of policy measures 25
3.4 Fuel uptake 25
3.5 Developments in natural gas vehicle uptake 27
3.6 Infrastructure and filling stations 30
3.7 Aspects related to biogas production 32
4 Transferability to the French context 34
4.1 Introduction 34
4.2 French context 34
4.3 Identified measures 37
4.4 Description of the individual measures 37
4.5 Conclusions 46
5 Conclusions and recommendations 47
6 References 50
2 March 2017 3.K49 – Supporting mechanisms for the development of biomethane in transportAnnex A EU policy context 54
A.1 Introduction 54
A.2 Renewable Energy Directive 54
A.3 ILUC Directive 55
A.4 Fuel Quality Directive 57
A.5 Clean Power for Transport Directive 58
A.6 Clean Vehicle Directive 58
A.7 EU winter package 59
3 March 2017 3.K49 – Supporting mechanisms for the development of biomethane in transportAbbreviations
AT Austria
bioNG biogas/biomethane
CH Switzerland
CNG Compressed Natural Gas
DE Germany
EBA European Biogas Association
EC European Commission
EU European Union
FQD Fuel Quality Directive
FR France
GHG Green House Gas
GRDF Gaz Réseau Distribution France
HDV Heavy Duty Vehicle
ILUC indirect land use change
IT Italy
LCV light commercial vehicles
LDV Light Duty Vehicle
LNG Liquefied Natural Gas
Mtoe Million tonne of oil equivalent
MW MegaWatt (106 Watt)
NG natural gas
NL the Netherlands
PJ PetaJoule (1015 Joule)
PM particulate matter
RED Renewable Energy Directive
SE Sweden
TTW Tank-To-Wheel
TWh TeraWatthour (1012 Watthour)
WTW Well-To-Wheel
UK United Kingdom
4 March 2017 3.K49 – Supporting mechanisms for the development of biomethane in transportSummary
Objective of this study
GRDF would like to gain insight into the supporting measures applied in
European countries to support biomethane in transport. Therefore the main
objective of this study is to provide insight in the support measures taken at
the national level by various European countries and to identify the most
promising measures and to assess their transferability to the French context.
The focus of this study is on the use of biomethane in the transport sector
(vehicle uptake, fuel uptake and filling infrastructure developments), but
biogas production and upgrading of biogas to biomethane is also taken into
account, as they constitute necessary first steps in the supply chain.
Research approach/methodology
Seven countries (Austria, Germany, Italy, the Netherlands, Sweden,
Switzerland and the United Kingdom) are chosen as case study countries,
together with France. These countries have been selected, because of their
high uptake of (natural) gas vehicles, high share of biomethane in the natural
gas share in transport, number of filling stations and strong biogas industries.
Factsheets have been produced based on literature review in order to identify
the most promising policy measures. Additional interviews have been held with
French experts to assess the transferability of policy measures to the French
context.
Current uptake of biomethane in the transport sector
Statistics show that the investigated eight countries cover almost the entire
market of biogas production and biomethane in transport. Regarding biogas
production, the case study countries, including France, represent 81% of EU
biogas production and 99% of all the biomethane produced in the EU. The role
of biomethane in transport is still very limited in most countries, especially in
relation to total fuel sales (including diesel and petrol). Italy has a strong
natural gas market for transport with a large share of natural gas filling
stations (in % of all filling stations) and relatively high uptake of NG vehicles in
the passenger car and truck fleet segments. Probably as a result of the focus
on HDV (Heavy Duty Vehicles), the share of NG buses and trucks is also
relatively high in France (in % of total HDV). In terms of fuel uptake, Sweden
and Switzerland sell a relatively high portion of biomethane compared to
natural gas sales in transport: in Sweden biomethane consumption in transport
even exceeds natural gas consumption in transport.
Case study findings
In Table 1 the most common policy measures are listed including an indication
of which countries these measures are applied in. This way, the differences
between France and the other case studies countries become clear.
The measures in bold have been identified as the most promising measures to
also be implemented in France.
5 March 2017 3.K49 – Supporting mechanisms for the development of biomethane in transportTable 1 Overview of applied individual measures per aspect
FR AT DE IT NL SE CH UK
1
Specific target for bioNG X X X
Lower fuel tax for NG compared to diesel and petrol X X X X X X X X
2
Lower fuel tax for bioNG compared to NG X X X
Fuel uptake BioNG included in the blending obligation X X X X
Specific target for vehicles running on NG X X
Vehicle tax exemption based on CO2/low-carbon X X X
vehicles
Company car taxation/tax reduction for environmental X X X3 X X
investments/tax measured aimed at commercial
Vehicle uptake vehicles
Subsidies for retrofitting/scrapping schemes X X
Climate investment grants for municipal vehicle fleets X
Low-interest loans This measure is applied in Egypt and was
identified during the literature review.
Co-finance projects for the deployment of CNG stations X
and compatible vehicle fleets
Direct link to biogas plants X
Demand for realisation of public infrastructure in X
public procurement
Filling Simplification of procedures X
infrasturcture Subsidy scheme for alternative fuel infrastructure X
Obligation to offer at least one alternative fuel at filling X
stations
Research activities X
Identification of most promising measures and assessment of their
transferability to the French context
The transferability of the identified measures to the French context has been
assessed as follows:
Including biomethane in the blending obligation, as is for example the case
in the Netherlands, does not seem to be feasible on the short term in
France and within the current system, but seems to be important to create
a level playing field between biofuels and biomethane and to make
biomethane part of the decarbonisation strategy for transport. Extending
the scope of the blending obligation might be included in any reforms on
the medium term as part of the new post-2020 EU policy framework.
Fuel tax differentiation, including lower taxes for bioNG compared to NG,
a measure applied in Sweden and Switzerland, seem to be the most
effective way to stimulate the uptake of biomethane in transport. Due to
the shortage of green certificates and in order not to harm the natural gas
market it is recommended to implement this gradually or at least to
pre-emptively announce it before actual implementation.
Providing low-interest loans for vehicles, as is the case in Egypt, seems to
be a risk-free option that can be complementary to other measures. A pilot
project could be started in an area with a high share of public accessible
NG stations, to see whether this measure also works in France.
1
The target also includes biofuels, but Italy has a strong focus on bioNG.
2
Only in case where biomethane is consumed on-site.
3
Provisions have been changed at the end of 2016.
6 March 2017 3.K49 – Supporting mechanisms for the development of biomethane in transportBecause most filling stations are private, actions are required to reach a
higher share of public accessible filling stations at the same time.
Depending on the type and size of tenders, a requirement to build filling
infrastructure in public procurement, as is the case in Italy, seems to be a
good option. However, attention has to be paid to the amount of vehicles
that will make use of this filling infrastructure and the location and
distribution of filling stations in an area. Filling stations need to add value
to the current system in place and therefore any extra station has to be
integrated into a broader system.
Establishing a direct link between filling stations and biogas plants as is the
case in Austria might help to increase awareness and understanding among
consumers and to increase the visibility and public awareness of
biomethane in a municipality.
The extent to which a system such as the Green Gas system in Göteborg
would be helpful to overcome investment risks due to differences in
development time between production and market demand (‘chicken and
egg’ problems) remains undecided: it seems to be more helpful to realise a
better market for green gas certificates and to increase the availability of
these certificates.
Main conclusions and recommendations
Based on the outcomes of the case study and the assessment of the
transferability to the French context the following recommendations have
been identified:
Allow the market of natural gas and biomethane in transport to grow
(because it also took some years in other successful countries).
This requires a long term, coherent and stable policy framework.
Keep a specific eye on the development of NG and bioNG in transport in
Sweden and Italy, since the policies and underlying strategy of these two
countries seems to fit best to the French situation. One has to keep in
mind that the policy measures in these countries form part of a broader
long term strategy build also on national circumstances, on bioNG in
transport (Sweden) and NG in transport (Italy).
Integrate biomethane more in the decarbonisation strategy of the
transport sector and create a level playing field between biofuels and
biomethane; this could be achieved by, for example including biomethane
in the blending obligation (when the current system will be reformed).
Introduce measures gradually to allow companies to adjust and to take
these changes into account in their investment decisions.
Fuel differentiation between NG and biomethane can work as an enabler
for other policy measures.
Improve the system of guarantees of origin and green certificates, because
the current availability of certificates is not sufficient for a higher demand
in case additional policy incentives for the uptake of biomethane will be
implemented.
Strengthen the natural gas market further through low-interest loans for
commercial vehicles.
Maintain the focus on HDV.
Make the link between biogas production and biomethane in transport
more visible to the public.
7 March 2017 3.K49 – Supporting mechanisms for the development of biomethane in transport1 Introduction
1.1 Background
Biogas is a very versatile form of bioenergy, as it can be produced from a
range of feedstocks and valorized in various energy forms: for electricity
production, heating and cooling, and in transport. The current biogas
production level in the EU is 13.4 Mtoe4 (155.8 TWh), of which 9.4% is
produced by wastewater treatment plants, 21.6% is landfill biogas and the
remainder, 69%, is biogas produced by anaerobic digestion of feedstock such as
agricultural, industrial or household waste and energy crops. In comparison:
total natural gas consumption was estimated to be 356.3 Mtoe (4143.8 TWh)
net calorific value, according to 2015 estimates of Eurogas.
Biogas can contribute to the decarbonisation of various sectors, to an
increasing share of renewable energy and to reaching energy security
objectives.
Due to successful policies in various Member States, EU-wide biogas production
increased rapidly in recent years. Germany, the UK and Italy alone are
responsible for more than 77% of the EU’s biogas production 2. Since biogas has
higher production costs than natural gas, the differences in biogas production
between the European countries reflect differences in national energy
strategies and subsequently differences in supporting measures for biogas
production. As some of the existing policies were recently modified and
incentives reduced, it is also expected that this level of growth will not be
sustained in the coming years.
In relation to the transport sector, the Renewable Energy Directive (RED)
(EC, 2009a) and the Fuel Quality Directive (FQD (EC, 2009b) are the main
drivers on the EU level for the share of renewable energy in the transport
sector. The RED obliges Member States to realise a 10% share of renewable
energy in the final energy consumption of the transport sector by 2020.
The Fuel Quality Directive (FQD) obliges fuel suppliers to reduce the average
GHG intensity of their fuels by 6% in 2020 compared to 2010 levels (Article 7a).
Many Member States have introduced a blending obligation at the national
level to ensure the realisation of both targets. To the present day this has
mainly resulted in blending of liquid biofuels in conventional fuels, but
biomethane, renewable electricity in electric vehicles and renewable
hydrogen also count towards the 10% target.
Biomethane has the potential to reduce GHG emissions. The actual GHG
reduction potential depends on the feedstocks, the mode of operation (of the
biogas plant) and the utilisation pathway. In addition, biomethane, like natural
gas, also reduces air polluting emissions, like particulate matter (PM) and NOX.
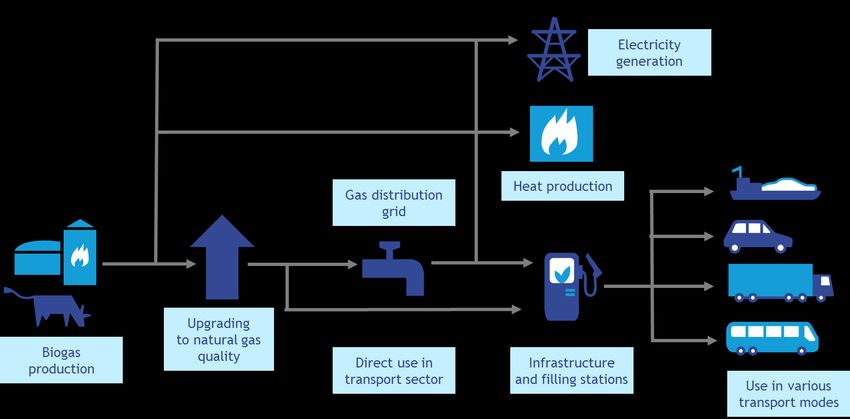
The use of biomethane in transport requires incentives at different levels in
the supply chain of biogas/biomethane. As depicted in Figure 1, the use of
biomethane requires production of biogas, its upgrading to natural gas quality,
distribution through the grid or direct filling on-site, sufficient refuelling
infrastructure and vehicles that are engineered to run on natural
gas/biomethane and are actually filling up their tanks with biomethane.
4
2013 (primary energy) data, EurObserv’ER barometer.
8 March 2017 3.K49 – Supporting mechanisms for the development of biomethane in transportFigure 1 Supply chain of biomethane
1.2 Objective
GRDF would like to gain insight into the supporting measures applied in
European countries and the transferability of these measures to the French
context. Therefore the main objective of this study is to provide insight into
the support measures taken at the national level by various European countries
to stimulate the use of biomethane in the transport sector and to assess the
transferability of successful measures to the French context.
This objective results in the following main research questions:
What supporting measures are applied to stimulate the use of biomethane
in relation to the 10% transport target of the Renewable Energy Directive?
What measures can then be mirrored and applied to the French context?
1.3 Approach/methodology
This study consists of three tasks. In the first two tasks the current uptake of
biomethane in the transport sector and the policy measures applied in the
eight case study countries have been investigated by means of a literature
review and additional requests for information where a gap was identified.
Data has been gathered by the various country experts using a factsheet
format developed for this purpose. Note that in some cases other countries
were also taken into account (only when found during the literature review).
At the end of Task 2 CE Delft analysed the factsheets in order to identify
similarities and differences between the various countries and to identify
future potential measures for the French context. In the third phase interviews
were conducted with French experts to assess the transferability to the French
context. Based on these findings final conclusions and policy recommendations
have been formulated.
9 March 2017 3.K49 – Supporting mechanisms for the development of biomethane in transport1.4 Scope
This study focuses on the national supporting mechanisms in place to stimulate
biogas. This includes both financial measures, such as tax measures, as well as
non-financial measures, such as quota to bring a certain amount of
biomethane on the market.
Concerning the time horizon, this study will focus on the measures currently in
place applied and planned measures (until 2020). Attention will also be paid to
the recent developments in order to account for current shares of biomethane
in transport.
The geographical scope is limited to the EU policy framework (and
Switzerland) and the analysis of supporting measures at the national level will
be limited to France plus the seven selected case study countries:
Austria;
Germany;
Italy;
the Netherlands;
Switzerland;
Sweden;
United Kingdom.
Other applications of renewable energy in transport and the use of biogas in
other sectors, like the electricity or the heat sector, will only be described as
a way to put the use of biomethane into perspective. Biomethane is linked to
natural gas developments as well, because natural gas vehicles are both able
to run on natural gas and biomethane and because the natural gas grid can be
used for the distribution of biomethane as well.
1.5 Outline of this report
This report consists of the following sections:
Section 2 describes the use of biomethane within the context of the 10%
target of the RED and provides an overview of the current levels reached in
the various countries, investigated in this study. This includes both
production and consumption. Shares of NG filling stations and vehicle
uptake in various market segments are also presented.
Section 3 provides an overall comparison of the findings as outcome of the
various case studies. In this way insight will be gained in the differences
and similarities in the supporting measures applied at the national level.
Section 4 aims to assess the transferability of supporting measures
effectively applied in other countries to the French context.
Finally, Section 5 presents the main conclusions and policy
recommendations to French public authorities.
Annex A contains more details about the European legislative framework
briefly outlined in the introduction.
The factsheets for each case study country can be found in the Annexes,
which are included in a separate document. These factsheets contain e.g.
the detailed information about the policy measures of each country.
10 March 2017 3.K49 – Supporting mechanisms for the development of biomethane in transport2 Biomethane use within the case
study countries
2.1 Introduction
As already stated in the introduction section, the use of biomethane is,
because of the additional cost, almost completely driven by policy.
This section aims to provide a short overview of the most important EU policies
that can be seen as the main drivers behind biomethane consumption.
Secondly, this section aims to provide insight into current biomethane use in
the European Union (and Switzerland) and in the case study countries in
particular. From these overviews it will become clear why these countries
have been selected as case studies. In the next section, current biomethane
uptake in the transport sector as described in this section will be linked to the
various policy strategies and individual policy measures. By doing so
conclusions on successfulness of policy strategies can be drawn. For example,
this might lead to the conclusion that the countries with a high uptake of
biomethane in transport all have applied one specific policy measure.
This section is based on data sources as the Biogas report of the European
Biogas Association (EBA) published at the end of 2016, EurObserv’ER and
Eurostat. These last two sources do, however, not contain data on 2015 or
2016. The reports covering this information have not been published yet.
2.2 Policy context
The main EU policies providing an incentive for the uptake of biomethane in
the transport sector are:
Renewable Energy The Renewable Energy Directive (EC, 2009a) of 2009 sets a binding target for
Directive
renewable energy in general (20% by 2020), but also includes a specific target
for the transport sector of at least 10% of renewable energy in transport by
2020. In order to count towards this target, biofuels and bioliquids have to
meet the sustainability criteria as laid down in this Directive and amended by
the ILUC Directive (EU, 2015b). Advanced biofuels produced from waste and
residues are allowed to count double towards the transport target.
Although renewable electricity and hydrogen can also count towards the
transport target, the target will be mainly fulfilled by the consumption of
biofuels. Many Member States have implemented a national blending
obligation for fuel suppliers to reach compliance.
Fuel Quality Directive The Fuel Quality Directive (EC, 2009b), also of 2009, aims to reduce the
average GHG emissions intensity of fuels along the supply side. Therefore the
average GHG intensity should be 6% lower by 2020 compared to 2010 levels.
This can also be realised by upstream reduction measures, but until now the
FQD has mainly resulted in the uptake of biofuels. The same blending
obligation as for the RED can be used to fulfil the FQD target, although the
FQD does not allow double counting.
11 March 2017 3.K49 – Supporting mechanisms for the development of biomethane in transportILUC Directive As result of impacts of indirect land use change, land based biofuels can result
in indirect GHG emissions. If these indirect emissions are taken into account as
well, biofuels might even cause an increase in GHG emissions rather than a
reduction. In order to limit the share of land based biofuels the ILUC Directive
(EU, 2015b) has introduced a cap on land based fuels and has introduced a
sub-target for the most advanced biofuels. Because biogas is mostly produced
from waste and residues, biogas does not fall under this cap (except biogas
from energy crops).
Directive on the The Clean Power for Transport Directive (or the Directive on the deployment
deployment of alternative
fuels infrastructure
of alternative fuels infrastructure (AFI), (EC, 2014) focuses on the build-up of
an EU-wide network of recharging and refuelling points, interoperability (by
means of standards and technical specifications) and clear consumer
information to raise awareness. The Directive contains minimum requirements
to be implemented through Member States’ national policy frameworks.
This includes recharging and refuelling infrastructure for electric vehicles,
natural gas (LNG and CNG) and hydrogen.
Clean Vehicle Directive The Clean Vehicle Directive (EC, 2009c), or the Directive on the Promotion of
Clean and Energy Efficient Road Transport Vehicles aims at the broad market
introduction of environmental-friendly vehicles on the market. This includes
that the energy and environmental impacts over the entire lifetime of a
vehicle should be taken into account in all purchases of road transport vehicles
covered by the Directives regulating public procurement and the public service
Regulation. These impacts can be monetised for inclusion in the purchasing
decision and requires the use of specific calculation rules for calculating the
lifetime costs and are laid down in the Directive. 5
EU Winter Package Above mentioned Directives are all part of the current policy framework.
However, many new investments will be based on the post-2020 policy
framework. At the end of November 2016 the European Commission has
published the so-called Winter Package which includes a proposal for a new
Renewable Energy Directive. The proposal includes a target for renewable
energy in transport of 6.8% for all types of renewable energy in transport,
including advanced biofuels, biogas, renewable electricity etc. by 2030,
abolition of the double counting provision, further strengthening of the cap on
land based biofuels and an increasing sub-target for advanced biofuels.
More detailed information on the policy framework can be found in Annex A.
2.3 Biogas production
Total biogas production
Biomethane is produced by upgrading biogas to required gas quality for
injection into the gas grid or use as Bio-NGV (BioCNG or BioLNG). The total
biogas production in the EU is 625 PJ, based on the most recent data of 2014
from Eurostat (622 PJ according to EurObserv’ER). This is about 172.8 TWh.
It accounted for 7.6% of the total primary energy production from renewable
energy sources in 2014. Germany produces by far the largest amount of biogas,
followed by Italy and the UK; France produced 17.6 PJ biogas in total, which is
about 4.9 TWh.
5
www.ec.europa.eu/transport/themes/urban/vehicles/directive_en
12 March 2017 3.K49 – Supporting mechanisms for the development of biomethane in transportFigure 2 Biogas production per EU member state in 2014 (PJ)
Source: Graph from (CE Delft, DLO and Eclareon, 2016), data from (EurObserv'ER, 2015).
Number of biogas plants
The number of biogas plants and yearly biogas production in the case study
countries and total EU28 is given in Table 2. In France the number of biogas
plants was 717 in 2015, 19 plants less compared to 2014 (EBA, 2016). In terms
of biogas plants and biogas production over 2015 the case study countries
represent 88% of all biogas plants and 86% of total EU biogas production.
Table 2 Number of biogas plants in 2015
Biogas Biogas production
plants # GWh/year
Austria 444 1,584
France 717 5,079
Germany 10,846 61,500
Italy 1,555 26,556
Sweden 282 3,843
Switzerland 638 1,909
the Netherlands 268 1,044
United Kingdom 523 17,791
Total case studies 15,426 119,306
Share presented by case studies 88% 81%
Total 17,376 138,340
Source: (EBA, 2016).
13 March 2017 3.K49 – Supporting mechanisms for the development of biomethane in transportInstalled capacity
The installed capacity in the EU almost doubled in five years time (2010-2015)
from 4,823 MWel to 8,728 MWel, as is depicted in Figure 3 (EBA, 2016).
Figure 3 Development of the number of biogas plants and installed electric capacities in the EU
Source: (EBA, 2016).
Feedstocks used
Figure 4 shows the result of an analysis of the feedstocks used for the
production of biogas in 2014 by CE Delft, DLO and Eclareon (CE Delft, DLO and
Eclareon, 2016). Energy crops (mainly maize) was the main feedstock, used
for about half of the biogas production (318 PJ/88.3 TWh), followed by
landfill (114 PJ/31.7 TWh), organic waste (including municipal waste)
(86 PJ/23.9 TWh), sewage sludge (57 PJ/15.8 TWh) and manure
(46 PJ/12.8 TWh). However, expressed in terms of mass, manure contributes
about 43%, since the biogas/energy yield of manure is relatively low (CE Delft,
DLO and Eclareon, 2016).
Compared to the other case study countries France has a relative low share of
biogas produced from energy crops, while Austria and Germany have a
relatively high share. The latter is less sustainable as result of the indirect
emissions, which are the result of the consumption of energy crops.
In the Netherlands and Italy about 50-60% of biogas is produced from manure.
About 80% of biogas is produced from sewage sludge and organic waste in
Sweden and the United Kingdom.
14 March 2017 3.K49 – Supporting mechanisms for the development of biomethane in transport6
Figure 4 Share of feedstock use for biogas (on energy basis), estimates
Source: Graph from (CE Delft, DLO and Eclareon, 2016).
2.4 Biomethane production
The total production of biomethane in Europe was 12.03 TWh (EBA, 2016).
According to the same report: ‘Germany, Sweden and the UK are leading the
way in terms both of the number of facilities and infrastructure for
biomethane use. In the UK, Germany, Switzerland, Austria and France nearly
all plants are connected to the national gas grids. This was made possible by
policies and support schemes that are in place for both producers and
consumers’.
Biomethane plants are sites where biogas is produced and subsequently
upgraded to biomethane on-site. The number of biomethane plants in the case
study countries are listed in Table 3 and this table shows that the case study
countries almost completely cover all the biomethane plants: only 9% of
biomethane plants are located outside the case study countries. Note that
these biomethane plants cover biomethane production for various uses and not
only for injection into the grid.
6
EurObserv’ER data stated only landfill gas and sewage sludge for Estonia, while EBA data
stated also other feedstock use.
15 March 2017 3.K49 – Supporting mechanisms for the development of biomethane in transportTable 3 Number of biomethane plants (2015)
Country #
Austria 13
France 20
Germany 185
Italy 6
Sweden 61
Switzerland 35
The Netherlands 21
United Kingdom 80
Total case studies 421
Share presented by case studies 91%
Total 459
Source: (EBA, 2016).
On average 12% of the biogas is used to produce biomethane: the other 88% is
used to generate electricity or heat. The case studies represent 99% of all
produced biomethane and 88% of all electricity generated from biogas and 91%
heat used. Note that there are substantial differences between the various
countries: in Sweden 74% of all biogas is dedicated to biomethane production.
In the Netherlands and Switzerland 26% and respectively 19% of biogas is used
to produce biomethane, while this is only 2% in France.
Table 4 Produced biomethane compared to generated electricity and generated heat (GWh/yr), in
2014
Electricity Heat Biomethane Share of
generated used produced produced
annually biomethane
in total
Austria 560 310 82 9%
France 2,738 2,190 85 2%
Germany 31,890 18,069 8,771 15%
Italy 9,368 14,052 n.a. n.a.
The Netherlands 1,148 1,863 704 19%
Sweden 62 387 1,257 74%
Switzerland 316 443 271 26%
United Kingdom 7,280 n.a. 722 9%
Total 60,644 40,804 12,027
Total case studies 53,362 37,313 11,892
Share presented by case studies 88% 91% 99%
Source: (EBA, 2016).
2.5 Natural gas and biomethane consumption
If we look specifically at biomethane consumption, data on biomethane is very
limited and for most countries no volumes are reported at all. This implies
that the biomethane consumption in transport is still very limited and might
also imply that the data collection and reporting has not developed into a
mature system yet. The data that has been collected on natural gas and
biomethane consumption are depicted in Table 5.
16 March 2017 3.K49 – Supporting mechanisms for the development of biomethane in transportTable 5 Fuel uptake
Natural gas Biomethane Total energy % of natural % of biogas
consumption consumption consumption gas in total in total
in transport energy natural gas
consumption (NG +
biomethane)
GWh GWh GWh % %
France 1,163 n.a. 56,9870 0.2% n.a.
Austria 5,554 6 101,483 5.5% 0.1%
Germany 2,300 460 738,121 0.3% 16.7%
Italy 10,025 0.3 466,200 2,2% 0%
Netherlands 417 46 161,831 0.3% 9.9%
Sweden 457 1131 362,890 0.1% 71.2%
Switzerland 386 134 84,800 0.5% 25.8%
UK n.a. 28 594,677 n.a, n.a.
According to EBA (2015) slightly more biomethane ended up in the transport
sector in 2014 compared to 2013 levels: 11.75% compared to 10% in 2013.
This is mainly the result of biomethane consumption in Sweden (78% of all
biomethane is consumed in the transport sector), Switzerland (33%) and
Germany (3%). Besides the case studies, in Finland also 43% of biomethane is
consumed in transport, but the production has been assessed to be too small
to add it as a case study.
2.6 Natural gas vehicle uptake
The uptake of vehicles is very limited compared to the size of overall fleets.
Although this share is very limited, a strong growth (sometimes 4-5 times
higher than five years ago) has occurred in our case studies (except in
Germany, where the sales in new NGV has dropped in 2015 compared to 2014.
In some countries the share of bi-fuelled vehicles is far higher than the share
of natural gas vehicles.
Italy has by far the highest number of NG passenger cars: the 837,470
passenger cars represent a share of over 2% of all passenger cars. Of all the
case study countries Italy also has a large share of NG trucks, but France has
an even higher share with 2.63%. Almost 30% of all buses in France also run on
natural gas.
With almost 17% a considerable amount of buses in Sweden are running on
natural gas as well. Overall the uptake of natural gas in the bus fleets seems
to be more successful compared to passenger cars and trucks. No information
on vehicle statistics could be found for the United Kingdom. Note that the
data presented in Table 6 is compiled using various data sources for the most
recent year available. References can be found in the factsheet report.
17 March 2017 3.K49 – Supporting mechanisms for the development of biomethane in transportTable 6 Share of NG vehicles in vehicle market segments
AT CH DE FR IT NL SE UK
Number of NG 5,087 11,278 80,300 2,549 837,470 7,452 42,675 20
passenger cars
Total number of 4,750,000 4,500,000 45,071,209 32,325,000 37,332,024 8,100,864 4,669,069 3,181,300
passenger cars
% of passenger cars 0.1% 0.3% 0.2% 0.01% 2.2% 0.1% 0.9% 0.0%
Number of NG buses 485 173 1,422 2,172 3,668 674 2,357 37
Total number of buses 9,679 6,779 78,345 7,344 97,910 9,833 14,144 169,000
% of buses 5.0% 2.6% 1.8% 29.6% 3.8% 6.9% 16.7% 0.0%
Number of NG trucks 2,086 129 15,523 364 82,530 623 8,079 621
Total number of trucks 427,515 400,000 2,800,780 13,828 4,460,389 157,562 596,214 4,411,000
% of trucks 0.5% 0.03% 0.6% 2.6% 1.9% 0.4% 1.4% 0.0%
2.7 Filling infrastructure developments
Regarding filling infrastructure developments there are large differences
between the various countries. Italy also has, besides the largest share of NG
passenger cars, the highest share of NG filling stations with almost 24% of all
filling stations in Italy (including multi-use stations). Other countries, like
Austria, Germany and Sweden all three have a share of about 6%. The other
countries, Switzerland, France, the Netherlands and the United Kingdom all
have lower shares.
Table 7 Share of NG filling stations in total filling stations
NG filling stations Total filling stations %
AT 172 2,641 6.5%
CH 140 3,461 4.1%
DE 883 14,531 6.1%
FR 288 11,269 2.6%
IT 1,046 4,420 23.7%
NL 140 4,000 3.5%
SE 162 2,680 6.1%
UK 16 8,490 0.2%
2.8 Conclusions
Based on this section it can be concluded that a few countries are being
responsible for most of the biomethane transport market in Europe. This is
also summarised in Table 8 in which the shares covered by the case study
countries are depicted for the indicators discussed in this section.
Table 8 Shares covered by case study countries for four indicators
Indicator Share covered by case study countries
Biogas plants 88%
Biogas production 86%
Number of biomethane plants 91%
Biomethane production 99%
Biomethane consumed in transport 56%
Natural gas vehicles 68%
Filling stations 98%
18 March 2017 3.K49 – Supporting mechanisms for the development of biomethane in transportIn the next section the indicators discussed in this section will be linked to the
policy strategies and individual policy measures in the countries. In this way
conclusions can be drawn on the effectiveness of these policies.
19 March 2017 3.K49 – Supporting mechanisms for the development of biomethane in transport3 Supporting measures at the
national level
3.1 Introduction
Based on the previous section it can be concluded that the selected case
studies together with France cover almost the entire biomethane and biogas
market in the EU. There are, however, also large differences between
countries in terms of vehicle uptake, share of natural gas filling stations and
share of biomethane.
In this section we aim to analyse the policy strategy and individual measures in
each case study country in order to provide insight in the link between policy
incentives and biomethane uptake in transport.
Because of the focus on the transport sector, natural gas vehicle uptake,
uptake of natural gas and biomethane and infrastructure developments are
discussed in more detail than aspects related to biogas production and grid
injection.
Before zooming in on the individual policy measures a short description of the
overall strategy is presented per case study country. After that an overview of
the measures applied is given followed by a description of the individual
measures according to the following stages in the supply chain:
developments in natural gas vehicle uptake;
uptake of fuel;
infrastructure and filling stations;
link with biogas production and grid injection.
Detailed information per case study can be found in the factsheets in the
Annexes. The Annexes also include all the references used, like strategic
papers and regulatory documents.
3.2 Summary of policy strategy per case study country
The case study outcomes have shown that the uptake of biomethane in
transport is mostly the result of broader policy strategies targeting more than
one element. Therefore, we will start by giving a short summary for each case
study country to describe the overall policy strategy. A graphic overview of the
strategies is also provided.
France
The market for natural gas vehicles and filling stations is not seen as a mature
market yet and the transition towards biomethane is yet to truly take place.
The share of biomethane in the transport sector is expected to strongly
increase in the next years. According to the French energy agency ADEME,
bioNGV represents the best alternative for the use of biomethane production
in the future. In this regard, the multi-annual energy programme (Ministère de
l' Environment, 2016) established by the French government in October 2016,
sets a consumption target for bioNGV of 0.7 TWh by 2018 and 2 TWh by 2023,
in order to achieve 20% of all NGV consumed by 2023. Due to the focus on HDV
20 March 2017 3.K49 – Supporting mechanisms for the development of biomethane in transportand the focus of policy on air quality in urban areas, France has a large share
of NG buses in the national bus fleet and natural gas trucks. The share of
passenger cars is quite low. An explanation for this is that there are less
alternatives available for heavy duty vehicles to meet the requirements of
environmental zones in urban centres. Heavy duty vehicles also have a higher
need to meet the requirements of environmental zones, because their
businesses depend on the access to these areas.
Austria
From all the case study countries, Austria shows a modest share on all
indicators studied. This can be explained by the broader decarbonisation
strategy applied by the country, which is not specifically targeted at
biomethane, but includes all type of renewable options for the transport
sector and even has a strong focus on e-mobility, as is the case in Germany.
Austria has a tax exemption for natural gas in transport. Biomethane is
exempted only in case refuelling occurs on the production site. No information
has been found on support schemes for infrastructure, but Austria has some
filling stations, of which at least 3 are directly linked to biogas plants.
Germany
The German strategy has shifted away from biomethane to electromobility,
both for incentives to stimulate fuel, as well as for vehicles and infrastructure.
Fuel tax exemptions have ceased or will be ceased in the short term. Due to
the focus on e-mobility there are currently no substantial incentives or
measures to stimulate the uptake of natural gas vehicles, because natural
gas vehicles are no longer included within the support schemes for new
low-emission vehicles. However, new incentives might be implemented in the
coming years. Given the slow progress in reducing GHG emissions in the
transport sector, the German Government is set to place an increasing
emphasis on the use of natural gas and biogas as transportation fuels. To that
end, the Ministry of Economy and Energy launched in September 2016 the
Rounde Table Natural Gas Mobility (Runde Tisch Erdgasmobilität) composed of
the representatives of the industry and the government. It declared the
ambitious goal of reaching 4% of natural gas share in fuel consumption by
2020. The proportion of biomethane in natural gas for transportation is
expected to be at 20%. In 2015, the share of natural gas (together with
biomethane) in the final fuel consumption was only 0.38% (Initiative
Erdgasmobilität, 2016).The Ministry for Economic Affairs and Energy also
announced the plans to extend the tax benefits for CNG vehicles beyond 2018.
The sources can be found in the Factsheet report.
Italy
Italy has already a long history in natural gas in transport. Although current
biomethane consumption is negligible, the natural gas market is large and
mature, including high share of natural gas vehicles in the passenger car fleet
and a substantial role for natural gas in the HDV fleet. These large shares in
the vehicle fleet are linked to a well-developed infrastructure network in
which natural gas stations have a substantial share. This is in line with the fact
that policy measures have been focused on vehicle and infrastructure
measures and the large tax advantage of natural gas over diesel and petrol.
The system of certificates (CICs) first needs to be further developed before
biomethane can take off.
21 March 2017 3.K49 – Supporting mechanisms for the development of biomethane in transportThe Netherlands
The Netherlands show a modest growth in both natural gas and biomethane.
In terms of vehicle fleet penetration the share of passenger cars and trucks is
lower compared to most other case study countries. Only, the share of buses is
above average. A subsidy scheme for alternative fuel filling stations has been
in place, but no longer exists. Market actors behind the natural gas stations
have committed themselves to realising a 100% share of biogas in natural gas
by 2015. It is not clear to what extent this has been realized.
Sweden
Sweden is not characterized by the highest share of natural gas in transport,
but by the large share of biomethane. The consumption of biomethane has
exceeded the natural gas consumption in transport, which can be explained by
the lower taxes for biomethane compared to natural gas. Because the tax
exemptions apply to all fuels and all vehicle segments, both the share of NG
passenger cars as well as the share of NG trucks are relatively high. Due its
strong push for natural gas in public procurement by local governments a large
share of the bus fleet also runs on natural gas.
Switzerland
Within its strategy Switzerland, like Sweden, has specific measures to
stimulate the uptake of biomethane in transport by lower fuel taxes (even an
exemption in case the sustainability criteria are met) and biogas in transport is
preferred over use in other sectors. This explains the higher uptake of
biomethane in transport in Switzerland compared to other case studies.
Vehicle measures are comparable to other case study countries by being
targeted at low-emission vehicles in general.
United Kingdom
The United Kingdom has a relatively modest uptake of natural gas and
biomethane. This can probably be explained by the broader scope of the policy
measures, which are focused on low-emission fuels and alternative fuel cars
without having specific incentives for natural gas and biomethane. Incentives
are limited to use biomethane under the blending obligations and some
research activities and pilot projects.
22 March 2017 3.K49 – Supporting mechanisms for the development of biomethane in transportFigure 5 Schematic overview of national strategies and status of the market 23 March 2017 3.K49 – Supporting mechanisms for the development of biomethane in transport
24 March 2017 3.K49 – Supporting mechanisms for the development of biomethane in transport
3.3      Overall comparison of policy measures

                                 The strategies as depicted in Figure 5 are the result of individual policy
                                 measures. Table 9 summarizes the main policy measures as identified in the
                                 case studies and shows in which countries these measures have been applied.

                      Table 9    Overview of applied individual measures per aspect

                                                                                          FR   AT      DE   IT   NL   SE   CH   UK
                                                                                                             7
                           Specific target for bioNG                                      X            X    X
                           Lower fuel tax for NG compared to diesel and petrol            X    X       X    X     X   X    X     X
                                                                                                   8
                           Lower fuel tax for bioNG compared to NG                             X                      X    X
      Fuel uptake          BioNG included in the blending obligation                                   X    X     X              X
                           Specific target for vehicles running on NG                     X    X
                           Vehicle tax exemption based on CO2/low-carbon                  X                                X     X
                           vehicles
                           Company car taxation/tax reduction for environmental           X    X       X9         X   X
                           investments/tax measured aimed at commercial
     Vehicle uptake        vehicles
                           Subsidies for retrofitting/scrapping schemes                        X            X
                           Climate investment grants for municipal vehicle fleets                                     X
                           Low-interest loans                                             This measure is applied in Egypt and was
                                                                                           identified during the literature review.
                           Co-finance projects for the deployment of CNG stations         X
                           and compatible vehicle fleets
                           Direct link to biogas plants                                        X
                           Demand for realisation of public infrastructure in                               X
                           public procurement
         Filling           Simplification of procedures                                                     X
     infrasturcture        Subsidy scheme for alternative fuel infrastructure                                     X
                           Obligation to offer at least one alternative fuel at filling                               X
                           stations
                           Research activities                                                                                   X

                        3.4      Fuel uptake

                                 Below the policy measures aimed at the realisation of fuel uptake are listed
                                 for each country.

France                           The act on energy transition published in 2015 has set an objective of 10%
                                 renewable energy in total energy consumption of transport by 2020 and at
                                 least 15% by 2030. The Multi-annual Energy Programme is the main
                                 implementing tool to be carried out by 2018 and 2023. The specific targets for
                                 bioNGV are 0.7 TWh by 2018 and 2 TWh by 2023. This shall cover 20% of total
                                 NGV consumed in 2023.

                                 7
                                      The target also includes biofuels, but Italy has a strong focus on bioNG.
                                 8
                                      Only in case where biomethane is consumed on-site.
                                 9
                                      Provisions have been changed at the end of 2016.

25           March 2017         3.K49 – Supporting mechanisms for the development of biomethane in transport
Austria Biomethane and natural gas are subject to the same tax. It is forbidden to
increase the tax for natural gas applied in transport. Biogas is exempt from tax
when consumed on the spot.
Germany The use of natural gas as a fuel offers a tax reduction until 2018. At the start
this reduction was envisaged until 2024, but this period has been significantly
reduced. The tax benefits for biomethane have ceased completely in 2015.
Italy 5.5% of total fuel consumption should come from biofuels and biomethane by
2016 through ‘Certificates of Release for Consumption’ (CIC) for biofuels.
(Ministero dello Sviluppo Economico, 2014)). Although this target can also be
met with other biofuels, Italy strongly focuses on the role of biomethane.
No support for biomethane solely for the transport sector has been found.
Natural gas fuel taxes are lower compared to petrol and diesel. The system for
certificates called CICs can be used to fulfil the blending obligation with
biomethane. This system has not yet resulted in significant shares of
biomethane, partly because this system required further development.
The Netherlands Biomethane is part of the blending obligation: biotickets (now changed into
Renewable Fuel Units) could be traded and could help to realise the blending
obligation. The double counting provision helps to improve the business case.
Fuel tax on CNG is considerably lower compared to diesel and petrol.
The Dutch market actors responsible for the natural gas stations have
committed themselves to deliver solely 100% biomethane by 2015. It is not
clear to what extent this has been realised.
Sweden The price at different CNG filling stations might vary due to differences in
distance between the production/upgrading plant and the filling station and
on the availability of distribution options. Increased supply of LNG through LNG
terminals might affect the price in the future. A network fee will also be
included in the gas price. The CO2 and energy tax which both determine the
total fuel tax on biomethane result in a lower fuel tax for biomethane
compared to natural gas, which is also lower compared to diesel and petrol.
Tax exemptions for biogas have been approved by the European Commission.
Switzerland Biogas is exempted from mineral oil tax if biogas meets the sustainability
criteria. The tax on natural gas is also lower compared to petrol. Biogas has a
tax advantage in transport compared to use in other sectors. Tax exemptions
for biogas have been approved by the European Commission.
United Kingdom Biomethane can play a role in the UK blending obligation, called the
Renewable Transport Fuel Obligation (RTFO). Fuel taxes for natural gas are
lower compared to diesel and petrol.
Overall conclusions
France is a frontrunner in setting targets for the consumption of bioNG
(together with Italy and Germany). However, the differentiation in French fuel
taxes does not favour biomethane. A lower fuel tax exists for natural gas,
which is also common in the other countries. Even lower taxes for bioNG are
only applied in Sweden, Switzerland and to some extent Austria. A majority of
the countries also offers the opportunity to let biomethane count towards the
blending obligation. However, this seems to have less impact on biomethane
uptake compared to lower fuel taxes for bioNG according to the statistics as
presented in the previous section.
26 March 2017 3.K49 – Supporting mechanisms for the development of biomethane in transportAs result of the differences between France and case study countries the
following measures have been identified as most promising measures to
incentives fuel uptake:
the lower fuel tax for bioNG;
including biomethane in the blending obligation.
3.5 Developments in natural gas vehicle uptake
Below the policy measures aimed at the realisation of natural gas vehicle
uptake are listed for each country.
France France is one of the few countries with a specific target for the share of
natural gas vehicles: the Multi-annual Energy Programme strongly focuses on
HDVs and aims to increase the share of HDVs on natural gas to 3% by 2023 and
10% by 2030. The amount of LDVs (light commercial vehicles and passenger
cars) is expected to increase accordingly. Until recently the use of NGV in
captive fleets was hindered by the legal and fiscal frameworks, but with the
Multi-annual Energy Programme several supporting measures are foreseen for
the coming years, like a tax reduction since 1 January 2016 for vehicles
over 3.5 tons. This is valid for CNG, LNG, bioCNG and bioLNG and companies
may deduct up to 40% of the original value from their taxable income from
1 January 2016 until 31 December 2017. This will cost 0.6 million euros for a
total of 1,500 LCVs, which is very limited compared to total public budget,
while this is a substantial measure to stimulate the uptake of (bio)methane by
company cars.
ADEME also manages a national call for tenders within the framework of Future
Investments Programme ‘Demonstrators of the ecological and energy
transition’. The tender aims to co-finance projects for the deployment of CNG
stations and compatible vehicle fleets. Final submission is scheduled for end of
March 2017. The projects shall foresee at least 5 filling stations and at least
20 vehicles per station. Financial support could be up to € 300,000 (for
1 station and 20 vehicles) of which € 100,000 in grants and € 200,000 in
repayable advances.
The project Equilibre financially supported the acquisition of natural gas
vehicles, while at the same time supporting the realisation of filling stations.
The Paris Town Hall has granted bonuses for small companies to purchase
electric or natural gas vehicles (LCVs, vans or HDVs).
Austria Although the decarbonisation strategy of Austria mainly is targeted at e-
mobility, the scheme ‘klimaaktiv mobil’ of the Austrian Federal Ministry of
Agriculture, Forestry, Environment and Water Management (BMLFUW, ongoing)
offers a total budget of 18.25 million euros to for example the environmental
friendly refurbishment of vehicle fleets of companies. Grants could be € 500 or
€ 1,000 per vehicle and is limited to 50% of the eligible cost for enterprises
and 30% of the eligible cost for local authorities. Projects can receive support
in case at least a minimum share of 50% is deployed.
There has also been a tender for cabs and car-sharing on a federal level.
The acquisition or retrofitting of up to ten passenger cars is promoted by
offering a lump sum of € 1,500 for CNG vehicles. Various electric vehicles are
also promoted. The premium is doubled in case green electricity is used.
The tender closed on 15 October 2016.
27 March 2017 3.K49 – Supporting mechanisms for the development of biomethane in transportGermany Due to the focus on e-mobility there are currently no substantial incentives or
measures to stimulate the uptake of natural gas vehicles.
The KfW Environmental Programme (KfW, 2017) supports environment
protective measures in the commercial business sector, such as low-interest
loans for the commercial purchase of new emission-low vehicles. While these
new emission-low vehicles addressed also the one powered by biogas and
biomethane, the provisions have been changed at the end of 2016.
Currently, under the same programme, only hybrid, electrical cars and such
vehicles fuelled by hydrogen are eligible.
Italy Since 2009 Italy has been offering incentive for the conversion of vehicles on
gasoline to LPG and CNG vehicles. The fund has been renamed several times to
ICBI incentive (Low Impact Fuel Initiative). For 2016 the fund was 1.8 million
euros. Incentives are 500 euro for LPG vehicles and 650 euro for CNG vehicles.
150 euro is from the installer and the rest is dispensed by the ICBI.
In addition to this, subsidies have also been granted for the acquisition of new
low-emission vehicles (enacted by Law 134/2012) between 2013-2015.
Low-emission vehicles include CNG, LNG, higher blends of biofuels, hydrogen,
hybrid and electric cars. The height of the subsidy is a share of the purchase
price and depends on the period in which the vehicle is acquired and the
CO2 emissions in g/km. Total budget was 120 million euros. The old used
vehicle should be supplied to a wrecker.
The Netherlands In the Netherlands several local governments offer vehicle subsidies to
natural gas vehicles. At the national level tax reduction is possible, because a
NGV is seen as environmental investment. In 2014 there has also been a
subsidy scheme for LNG trucks.
Sweden Sweden applies an income tax reduction for companies for the use of natural
gas vehicles (incl. biomethane), plug-in hybrid vehicles and electric cars.
Although the maximum amount of funding has been reduced from 1,714 euro
to 1,029 euro, the support scheme has been extended until the end of 2019.
Under the climate investment grant for municipalities local authorities can
receive support for various biogas projects, including projects targeted at the
municipal vehicle fleet. The main aim of all projects should be GHG reduction.
In 2015 total granted aid was 12,8 million euro and another 61,6 million euro is
available for 2016-2018.
In 2015 a draft of the national biogas strategy has been published by a group
of main stakeholders in the biogas industry (gas user trade association
Energigas Sverige, gas network owner/operator Swedegas, and the
municipality of Region Skåne). In this draft the following measures are
proposed, but this roadmap has not been implemented:
a policy instrument to promote ‘environmental trucks’;
a premium for electric buses has already been proposed by the
government, the draft biogas strategy gas-powered buses should also be
included in this premium, especially in relation to outlying areas where
electric buses are not an option;
a bonus-malus system for LDVs (based on gCO2/km of a vehicle) should also
cover gas-powered vehicles;
maintaining the benefits for company cars (see first point).
28 March 2017 3.K49 – Supporting mechanisms for the development of biomethane in transportSwitzerland More and more cantons grant a reduction on the motor vehicle tax for
low-emission vehicles (such as electric, hybrid, fuel cell or energy efficient
cars, but also for natural gas, biogas and hydrogen.
United Kingdom In the UK vehicle tax rates for cars (registered after 2001) are based on fuel
type and CO2 emissions. The lower the emissions, the lower the tax.
This also applies for alternative fuel cars.
Regarding HDVs, the Low-Carbon Truck Trial, funded by the Department for
Transport, the Office for Low-Emission Vehicles and Innovate UK, budget was
provided to invest prime procurement of low-emission heavy goods vehicles
(HGV) technologies and supporting infrastructure. The aim is to raise
awareness and to enable low-carbon vehicle producers to develop products in
a new way. The publically-accessible gas refuelling infrastructure should help
with the monitoring of data to emission reductions, fuel savings and
operational benefits. By the end of 2014 317 trucks were on the road
(91 additional dual fuel LNG and 51 CNG additional vehicles) compared to the
end of 2013.
Overall conclusions
Overall, France is the only country with a specific target for the share of
natural gas vehicles. France also strongly focuses on heavy duty vehicles.
The measures aimed to increase the vehicle uptake of natural gas vehicles at
the national level are focused on low-carbon vehicles in general, which include
natural gas vehicles, electric vehicles, but also vehicles on hydrogen or higher
blend of biofuels. Because many measures are technology neutral, natural gas
vehicles compete with for example electric vehicles. On the one hand, this
competition can be seen as an unwanted effect, but on the other hand, policy
measures formulated in a technology neutral way are more likely to result in
cost-effective results, because the choices are left to the market.
We can distinguish the following measures:
Reduction of motor tax levels (based on fuel type and or gCO 2/km).
In several countries, motor tax levels are based on fuel type and gCO 2/km
in line with the CO2 regulation for light duty vehicles at the EU level.
Because CO2 regulations solely focus on the TTW emissions of vehicles no
difference is made between natural gas and biomethane.
Subsidies for the purchase of new vehicles or retrofitting of existing
vehicles; at the national level or local level, specific vehicle types (for
example LNG trucks).
Income tax deduction for companies/environmental investment.
Climate investment grant for municipalities in for example Sweden and
France.
Pilot project to gain more knowledge on natural gas trucks in the United
Kingdom.
Local measures: environmental zoning, benefits (dedicated lane, parking
policy).
Low-interest loans for commercial vehicles.
The policy measures aimed at vehicle uptake often do not include additional
incentives to stimulate the uptake of biomethane by these vehicles.
29 March 2017 3.K49 – Supporting mechanisms for the development of biomethane in transportYou can also read