INVESTOR PRESENTATION HYBRID TAP - April 7th, 2021 - GlobeNewswire
←
→
Page content transcription
If your browser does not render page correctly, please read the page content below
INVESTOR PRESENTATION
HYBRID TAP
April 7th, 2021
Important information (I/II)
IMPORTANT INFORMATION
Limitations: This investor presentation (this “Presentation”) has been produced by European Energy A/S (the “Issuer” and, together with its subsidiaries, the “Group”) solely for use in connection with investor presentations relating to the contemplated tap offering of
additional capital securities (the “Subsequent Capital Securities”) expected to be issued by the Issuer in April 2021. For the purposes of this notice, references to this Presentation shall include the presentation slides that follow, together with any oral presentations, Q&A
sessions and any other materials distributed in connection therewith.
The bookrunner of the Subsequent Capital Securities is Nordea Bank Abp (”Nordea” or the “Bookrunner”).
THIS PRESENTATION IS FOR INFORMATION PURPOSES ONLY AND DOES NOT IN ITSELF CONSTITUTE, AND SHOULD NOT BE CONSTRUED AS, AN OFFER FOR SALE OR SUBSCRIPTION OF OR SOLICITATION OR INVITATION OF ANY OFFER TO SUBSCRIBE FOR OR PURCHASE
ANY SUBSEQUENT CAPITAL SECURITIES OR OTHER SECURITIES OF THE ISSUER OR ITS AFFILIATES IN ANY JURISDICTION.
By attending a meeting or conference call where this Presentation is presented, or by reading or otherwise being in possession of this Presentation, you (the "Recipient") will be deemed to have agreed to be bound by the above and the following terms, conditions and
limitations.
Confidentiality: This Presentation is strictly confidential and has been prepared exclusively for the benefit and internal use of the Recipient who receives this Presentation directly from the Bookrunner. No part of this Presentation or the information it contains may be
disclosed, reproduced, redistributed or otherwise passed on to any person other than the Recipient unless expressly agreed in writing by the Bookrunner and the Issuer. This Presentation has not been reviewed by or registered with any public authority or stock exchange
and does not constitute a prospectus.
Information Sources and Limitation of Liability: All information provided in this Presentation has been obtained from the Issuer or is publicly available material and has been produced by the Issuer assisted by the Bookrunner exclusively for information purposes.
No formal due diligence investigations have been carried out in connection with this Presentation. Only certain limited investigations in relation to the Issuer and the Subsequent Capital Securities have been carried out. The Recipient acknowledges and accepts the risks
associated with the fact that only limited investigations have been carried out.
Neither the Bookrunner, the Issuer or any other member of the Group nor any of their respective direct or indirect shareholders, parents or subsidiaries or any such company’s directors, officers, employees, advisors or representatives (collectively the “Representatives”)
make any representation or warranty (expressed or implied) whatsoever as to the accuracy, completeness or sufficiency of any information contained in this Presentation, and no reliance should be placed on the fairness, accuracy, completeness or sufficiency of the
information contained in this Presentation.
Neither the Bookrunner, the Issuer or any other member of the Group nor any of their Representatives shall have any liability whatsoever (in negligence or otherwise) arising directly or indirectly from the use of this Presentation and/or any information contained herein.
The information contained in this Presentation has not been independently verified and neither the Bookrunner, the Issuer or any other member of the Group nor any of their Representatives assume any responsibility for, nor do the Bookrunner, the Issuer or any other
member of the Group nor any of their Representatives make any representation or warranty (express or implied) as to the accuracy, completeness or verification of the information contained in this Presentation.
Actuality and No Updates: This Presentation is dated 7 April 2021 and speaks as of such date only. Neither the delivery of this Presentation nor any further discussions of the Issuer or the Bookrunner with any Recipient shall, under any circumstances, create any implication
that there has been no change in the affairs of the Issuer or the Group since such date. The Issuer does not undertake any obligation to review or confirm, or to release publicly or otherwise to investors or any other person, any revisions to the information contained in this
Presentation to reflect events that occur or circumstances that arise after the date of this Presentation.
No Investment Advice: This Presentation is not, and shall not be construed as, investment, financial, legal, business, tax or other professional advice. The Recipient should consult with its own professional advisers for any such matter and advice.
An investment in the Subsequent Capital Securities involves a high level of risk and several factors could cause the actual results or performance of the Group or the Subsequent Capital Securities to be different from what may be expressed or implied by statements
contained in this Presentation. By attending a meeting or conference call where this Presentation is presented, or by reading or otherwise being in possession of this Presentation, you acknowledge that you will be solely responsible for and rely on your own assessment of
the market and the market position of the Group and that you will conduct your own analysis and be solely responsible for forming your own view of the potential future performance of the Group, its business and the Subsequent Capital Securities and other securities.
The content of this Presentation is not to be construed as legal, credit, business, investment or tax advice. The Recipient should consult with its own legal, credit, business, investment and tax advisers to receive legal, credit, business, investment and tax advice. Each
potential investor in the Subsequent Capital Securities must determine the suitability of that investment in light of its own circumstances. In particular, each potential investor should: 1) have sufficient knowledge and experience to make a meaningful evaluation of the
Subsequent Capital Securities, the merits and risks of investing in the Subsequent Capital Securities and the information contained or incorporated by reference in this Presentation; 2) have access to, and knowledge of, appropriate analytical tools to evaluate, in the context
of its particular financial situation, an investment in the Subsequent Capital Securities and the impact other securities will have on its overall investment portfolio; 3) have sufficient financial resources and liquidity to bear all of the risks of an investment in the Subsequent
Capital Securities; 4) understand thoroughly the final terms and conditions for the Subsequent Capital Securities; and 5) be able to evaluate (either alone or with the help of a financial adviser) possible scenarios for economic, interest rate and other factors that may affect
its investment and its ability to bear the relevant risks.
MIFID II Product Governance / Retail Investors, Professional Investors and Eligible Counterparties Target Market: Nordea, in its capacity as manufacturer for the Subsequent Capital Securities (the "manufacturer) and solely for the purposes of the manufacturer’s product
approval process, has made a target market assessment in respect of the Subsequent Capital Securities which has led to the conclusion that: (i) the target market for the Subsequent Capital Securities is eligible counterparties, professional clients and retail clients, each as
defined in Directive 2014/65/EU (as amended, “MiFID II”); (ii) all channels for distribution of the Subsequent Capital Securities to eligible counterparties and professional clients are appropriate; and (iii) the following channels for distribution of the Subsequent Capital
Securities to retail clients are appropriate - investment advice, portfolio management, and non-advised sales or execution with appropriateness test, subject to the distributor’s (as defined below) suitability and appropriateness obligations under MiFID II, as applicable. Any
person subsequently offering, selling or recommending the Subsequent Capital Securities (a “distributor”) should take into consideration the manufacturer’s target market assessment; however, a distributor subject to MiFID II is responsible for undertaking its own target
market assessment in respect of the Subsequent Capital Securities (by either adopting or refining the manufacturer’s target market assessment) and determining appropriate distribution channels, subject to the distributor’s suitability and appropriateness obligations under
MiFID II, as applicable. The target market assessment indicates that Subsequent Capital Securities are incompatible with the needs, characteristic and objectives of clients which are fully risk averse or are seeking on-demand full repayment of the amounts invested.

                                                                                                                                                                                                                                                                                            1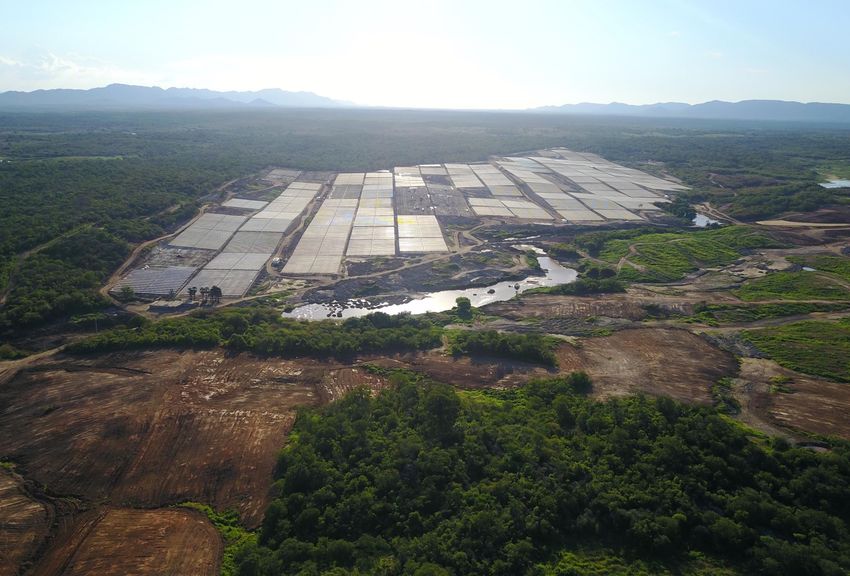
Important information (II/II)
Conflicts of Interest: The Bookrunner and/or its Representatives may hold shares, options or other securities of any issuer referred to in this Presentation and may, as principal or agent, buy or sell such securities. Furthermore, the Bookrunner has engaged in, or may in the
future engage in, investment banking and/or commercial banking or other services for the Issuer in its ordinary course of business. Accordingly, conflicts of interest may exist or may arise as a result of the Bookrunner having previously engaged, or will in the future engage, in
transactions with other parties, having multiple roles or carrying out other transactions for third parties with conflicting interests.
Risk Factors: An investment in the Subsequent Capital Securities involves significant risk, and several factors could adversely affect the business, legal or financial position of the Issuer or the value of its securities. The Recipient should carefully review the section entitled "Risk
Factors" of this Presentation for a description of certain of the risk factors that will apply to the Issuer and an investment in the Subsequent Capital Securities.
Audit Review of Financial Information: Certain financial information contained in this Presentation has not been reviewed by the Group’s auditor or any other auditor or financial expert. Hence, such financial information might not have been produced in accordance with
applicable or recommended accounting principles and may furthermore contain errors and/or miscalculations. The Group is the source of the financial information, and none of the Issuer, the Bookrunner or any other member of the Group nor any of their Representatives
shall have any liability (in negligence or otherwise) for any inaccuracy of the financial information set forth in this Presentation.
Forward Looking Statements: Certain information contained in this Presentation, including any information on the Group’s plans or future financial or operating performance and other statements that express the Group’s management’s expectations or estimates of future
performance, constitute forward-looking statements (when used in this document, the words “anticipate”, “believe”, “estimate” and “expect” and similar expressions, as they relate to the Group or its management, are intended to identify forward-looking statements). Such
statements are based on a number of estimates and assumptions that, while considered reasonable by management at the time, are subject to significant business, economic and competitive uncertainties. The Group cautions that such statements involve known and
unknown risks, uncertainties and other factors that may cause the actual financial results, performance or achievements of the Group to be materially different from the Group’s estimated future results, performance or achievements expressed or implied by those forward-
looking statements.

DISTRIBUTION AND SELLING RESTRICTIONS
Distribution Restrictions: None of the Issuer or the Bookrunner or any of their respective Representatives has taken any actions to allow the distribution of this Presentation in any jurisdiction where action would be required for such purposes. The Presentation has not been
registered with, or approved by, any public authority, stock exchange or regulated market. The distribution of this Presentation, as well as any subscription, purchase, sale or transfer of securities of the Issuer may be restricted by law in certain jurisdictions (including, but not
limited to, Canada, Australia, Hong Kong, Italy, New Zealand, the Republic of South Africa, Japan, the Republic of Cyprus, the United Kingdom or the United States), and the recipient of this Presentation should inform itself about, and observe, any such restriction. Any failure
to comply with such restrictions may constitute a violation of the laws of any such jurisdiction. None of the Issuer or the Bookrunner, or any of their respective Representatives, shall have any responsibility or liability whatsoever (in negligence or otherwise) arising directly or
indirectly from any violations of such restrictions.
Neither the Issuer nor the Bookrunner have authorised any offer of securities to the public, or has undertaken or plans to undertake any action to make an offer of securities to the public, requiring the publication of an offering prospectus in any member state of the
European Economic Area in which the EU Prospectus Regulation (EU) 2017/1129 applies (the “Prospectus Regulation”) and this Presentation is not a prospectus for purposes of the Prospectus Regulation.
In the event that this Presentation is distributed in the United Kingdom, it shall be directed only at persons who are either (a) "investment professionals" for the purposes of Article 19(5) of the UK Financial Services and Markets Act 2000 (Financial Promotion) Order 2005, as
amended (the “Order”); or (b) high net worth companies, unincorporated associations and other persons to whom it may lawfully be communicated in accordance with Article 49(2)(a) to (d) of the Order (all such persons together being referred to as “Relevant Persons”). Any
person in the United Kingdom who is not a Relevant Person must not act or rely on this Presentation or any of its contents. Any investment or investment activity to which this Presentation relates will in the United Kingdom be available only to Relevant Persons and will be
engaged in only with Relevant Persons. This Presentation is not a prospectus for the purposes of Section 85(1) of the UK Financial Services and Markets Act 2000, as amended (“FSMA”). Accordingly, this Presentation has not been approved as a prospectus by the UK Financial
Conduct Authority (the “FCA”) under Section 87A of FSMA and has not been filed with the FCA pursuant to the UK prospectus rules nor has it been approved by a person authorised under FSMA.
This Presentation does not constitute or form part of an offer or solicitation to purchase or subscribe for securities in the United States. The Subsequent Capital Securities have not been and will not be registered under the U.S. Securities Act of 1933, as amended (the
“Securities Act”), or with any securities regulatory authority of any state or other jurisdiction in the United States. Accordingly, the Subsequent Capital Securities may not be offered, sold (directly or indirectly), delivered or otherwise transferred within or into the United
States or to, or for the account or benefit of, U.S. Persons (as defined in Rule 902 of Regulation S under the Securities Act), absent registration or under an exemption from, or in a transaction not subject to, the registration requirements of the Securities Act. The Subsequent
Capital Securities are being offered and sold by the Bookrunner only to non-US persons located outside the United States in reliance upon Regulation S under the Securities Act.
Please note specifically that Nordea Bank Abp’s ability to engage in U.S. securities dealings is limited under the U.S. Bank Holding Company Act and it may not underwrite, offer or sell securities that are offered or sold in the United States. Nordea Bank Abp will only
underwrite, offer and sell the securities that are part of its allotment solely outside the United States.
The Recipient hereby represents and warrants that (i) it is not resident or otherwise located in the United States and is not a U.S. Person (as defined in Rule 902 of Regulation S under the Securities Act) and (ii) if it is a resident of or otherwise located in the United Kingdom, it
is a Relevant Person.

GOVERNING LAW AND JURISDICTION
This Presentation is subject to Danish law (disregarding any conflict-of-laws rules which might refer the dispute to the laws of another jurisdiction), and any dispute arising in respect of this Presentation is subject to the exclusive jurisdiction of Danish courts with the City Court
of Copenhagen (IN Danish: Københavns Byret) as the court of first instance.

ANY POTENTIAL INVESTOR INVESTING IN THE SUBSEQUENT CAPITAL SECURITIES IS BOUND BY THE FINAL TERMS AND CONDITIONS OF THE SUBSEQUENT CAPITAL SECURITIES WHICH THE INVESTOR ACKNOWLEDGES HAVING ACCEPTED BY SUBSCRIBING FOR SUCH SUBSEQUENT
CAPITAL SECURITIES.

                                                                                                                                                                                                                                                                                               2
Indicative key terms of the new hybrid issue
Indicative key terms for the contemplated new hybrid issue

Issuer:                          European Energy A/S

Country:                         Denmark

Rating:                          Unrated

Tap Size:                        Up to an expected EUR 50m

Maturity:                        1,000 years with maturity 22 September 3020 (NC3 from First Issue Date, callable 22 September 2023 (to occur after the maturity of the Company’s Senior Bonds))

Status:                          Deeply subordinated. Senior only to ordinary shares

Call Schedule:                   After First Call Date on 22 September 2023 and every Interest Payment Date thereafter

Step-up:                         500bps after the First Call Date on 22 September 2023

                                 Fixed 6.125%, annually in arrears (act/act). From the First Call Date the interest rate resets every 3 years to the then prevailing 3-year EUR swap rate plus the initial
Interest rate:
                                 credit spread plus step-up

Interest Deferral:               At the issuer’s option on any interest payment date. Cumulative interest deferrals. Deferred coupons can be settled in cash at any time

Change of Control:               Issuer call @ 101% prior to First Call Date and thereafter @ par. If not used, an interest payment step-up of 500 bps applies

                                 •   Tax Event (call @ 101 prior to First Call Date and thereafter @ par)
                                 •   IFRS accounting change (call @ 101 prior to First Call Date and thereafter @ par)
Other call provisions:
                                 •   Replacing Capital Event (call @ 103)
                                 •   If Issuer/Group holds minimum 80% of Total Nominal Amount (call @ par)

Docs:                            Standalone, Danish law

Denomination:                    EUR 100k + 1k

Listing:                         Nasdaq Copenhagen expected on the issue date

Use of Proceeds:                 In accordance with the Green Bond Framework

Joint Bookrunners:               Nordea

                                 Eligible counterparties, professional clients and certain retail investors (contact Bookrunners for full target market assessment). A PRIIPs KID in English and Danish
Target market:
                                 language will be prepared and made available

                                                                                                                                                                                                             3
Agenda
                                                                                                      15
INVESTOR PRESENTATION HYBRID TAP

                                                                                                                                   20
                                                                                                      Market
Introduction to European Energy                         05                                            Overview
Market Overview                                         15
Business Description                                    20
European Energy Financials                              24
Risk Factors                                            30                                                                         Business
Appendices                                              43                                                                         Description

                                                                                                        05
TODAY’S PRESENTERS
                                                                                                        Introduction to
                                                                                                        European
                                                                                                        Energy

                                                                                                                          24
                                                                                                                          European
Jens Peter Zink                                   Jonny T. Jonasson                                                       Energy
                                                                                                                          Financials
Executive Vice President and chairman             Chief Financial Officer

With EE since 2005                                With EE since 2012

Prior experience                                  Prior experience
10 years with KPMG holding different positions,   Extensive experience as Chief Financial Officer &
including Manager M&A                             General Manager

                                                                                                                                                 4
SPROGØ
21 MW
DENMARK

    5
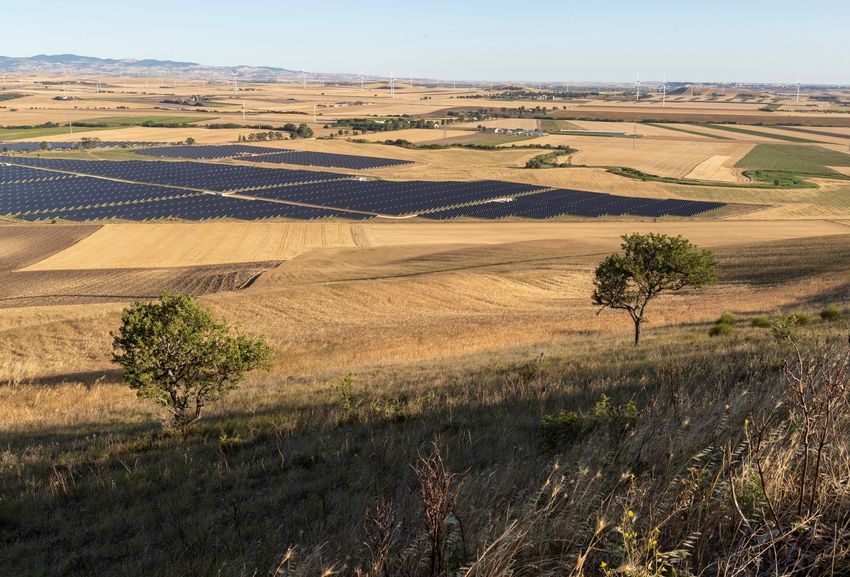
Overview of European Energy
                       European Energy in brief

                       •    European Energy constructs wind and solar farms as well as power-to-x solutions. We are building solutions to
                            climate change
                       •    European Energy was founded in 2004 and has grown to show an EBITDA of EUR 61m in 2020 with 203
                            employees at end of 2020, activities across 16 countries and access to a development portfolio of 19 GW

                              Solar                                     Onshore                                   Offshore                  Power-to-X
                              Power (70%)                               Wind (26%)                                Wind (3%)                 (1%)

                               Active in:                                 Active in:                          Active in Europe (100%)       Active in Europe
                        Europe (84%), Americas                      Europe (96%) and Brazil                                                      (100%)
                        (9%) and Australia (7%)                              (4%)

Note: Percentages indicated measured by MW

                                                                                                                                                               6
19/3/21                                                                         6/4/21

            European Energy                                                                Renewable Investment
            wins EY’s                                                                      Partnership
            Entrepreneur of the
            Year in Denmark

            The jury noted that:
            •   European Energy is a strong
                company with fantastic
                growth.                                                                    Novo Holdings, Sampension and
            •   The company has a                                                          European Energy is creating a new
                compelling narrative with a                                                Renewable Investment Partnership to
                strong focus on sustainability                                             buy land areas with the intention of
                                                                                           establishing renewable energy on land.

Recent
                as well as combatting climate
                change including a strong                                                  The new partnership has been
                focus on supporting UN’s                                                   established with DKK 650 million in

Events of
                Sustainable Development                                                    capital which enables the fund to invest
                Goals                                                                      around up till DKK 1.5 billion.

European                                                                         26/3/21

Energy                                               European Energy signs
                                                     order for 14 Siemens
                                                     Gamesa 5.X onshore
                                                     turbines

                                                     The turbine acquisitions cover
                                                     two sites in Sweden of 86 MW
                                                     in total.
                                                     Both projects has secured
                                                     long term PPAs.

                                                                                                                                 7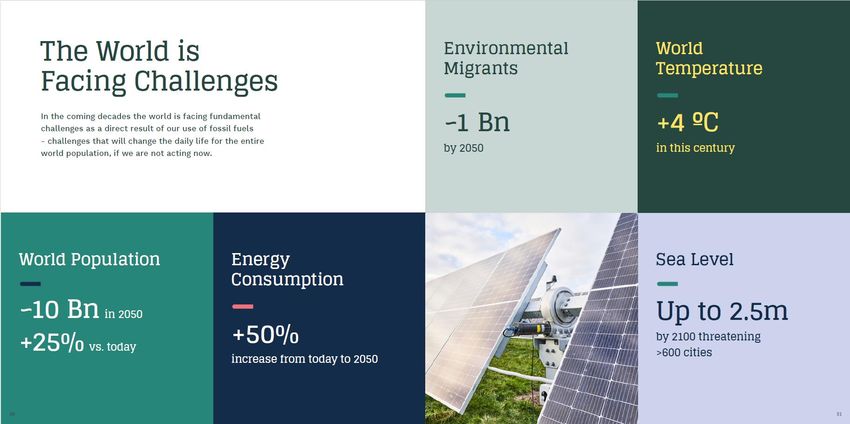
ity nt
                                                ity
                                ity

                                                        tiv e
                                             tiv
                             tiv

                                                      ac opm

                                                                         e
                                                                      fic
                                           ac
                           ac

                                                                    Of
                                       ind

                                                            l
                       lar

                                                         ve
                     So

                                      W

                                                      De
Europe
    Bulgaria                             v
    Denmark             v                v              v           v
    Finland                              v              v
    France                               v              v
    Germany             v                v              v           v
    Greece                               v
    Italy               v                v              v           v
    Lithuania                            v              v           v
    Poland                               v              v           v
    Romania                              v
    Spain               v                               v           v
    Sweden              v                v              v           v
    United Kingdom                       v              v           v

North America
   United States                                        v

South America
   Brazil               v                v              v           v

Australia                                               v

                                                                             8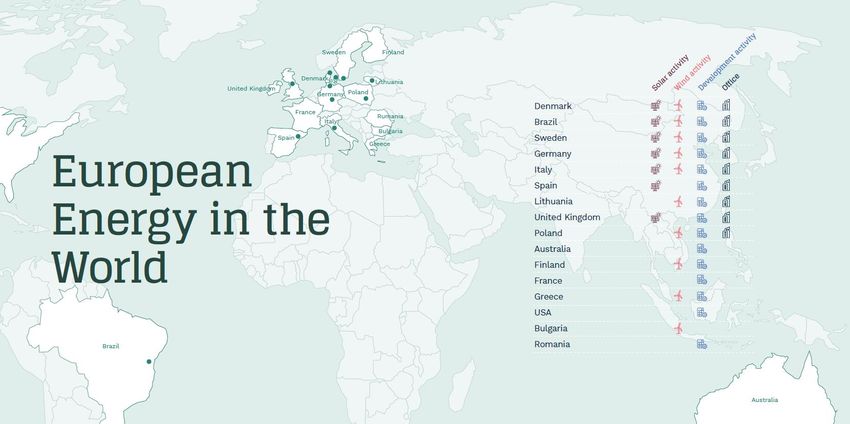
Simplified structure of European Energy
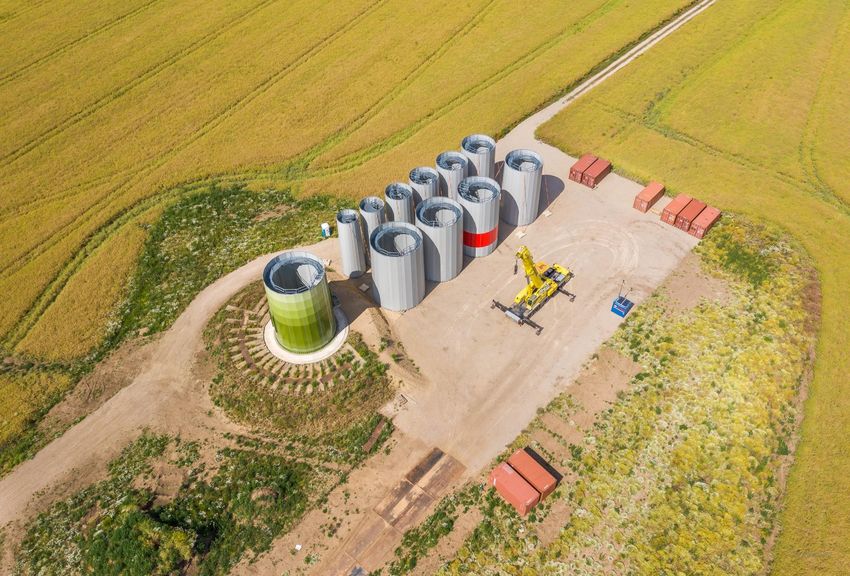
Knud Erik Andersen: ~76% Mikael Dystrup Pedersen: ~14% Jens-Peter Zink: ~10% European Energy Employees:Robust Green Bond framework - ‘pure play’ green operations
European Energy’s green bond framework European Energy’s effort to halt climate change
• Eligible Assets and Projects include
Power production (GWh) 750 MW
− Development and construction of renewable energy projects (i.e. solar and wind)
new green capacity expected to be grid
− Energy storage projects to store renewable energy and surplus heating connected by European Energy in 2021
− R&D projects related to solar and wind power (e.g. Risø Test Centre) 2020 European Energy has currently initiated
2019 constructions of approx. 1,000 MW
• To the extent feasible Eligible Assets and Projects will be allocated to new projects. In cases where 2018 458
632
proceeds are allocated to existing projects European Energy will endeavour to target a look-back
period of maximum 3 years
328 251 MW was grid connected in 2020
• Eligible Assets and Projects may cover both capital expenditures and operational expenditures, such
as through labour costs or spending on R&D
The electricity consumption
• Eligible Assets and Projects target specific climate related objectives of reducing greenhouse gas of 158,000 households in 2020
emissions through the production of renewable energy
36 MW 215 MW
European Energy’s investment committee are responsible for
Process
ensuring that only projects aligned with the framework are
selection allocated proceeds from Green Bonds
A Green Bond Register will be created to ensure that proceeds
Mgmt.
are mapped to Eligible Projects and Assets. Projects may be
of proceeds added or removed and will be replaced.
An annual allocation and impact report will be published. Where
Reporting
feasible impact will be reported in GHG avoidance.
632 GWh of
green electricity
External produced in 2020
review
10Transition from a Developer to an
Independent Power Producer (IPP)
EBITDA
As the Company has grown, both in terms of EBITDA excl. sale of projects 61
EBITDA and the asset base, and by entering
44 The Company is well positioned to continuing both
into the bond market enabling European 34
27 30 project divestment and also growing its IPP
Energy to expand further, power sales has since 18 business leg
2018 become the predominant source of
income
2018 2019 2020
European Energy’s power production (GWh p.a.)
632
European Energy’s funding through the bond market
Previously, the EBITDA generated from European 458
made it possible to make the strategic shift to become 328
Energy’s operations was predominantly from the
an IPP, and the power production of the Company has
sale of projects
increased significantly over the last years
2018 2019 2020
11Accumulated installed/purchased Wind capacity, MW
Accumulated installed/purchased Solar capacity, MW
Accumulated Enterprise value, EUR million
• European Energy has demonstrated
strong growth in capacity installed
and cumulative investments from 2020: Active
inception in 2004 to today within power-to-X
EURm 2,559
• The strong growth has been
2018: IPP activity
profitable since EE’s foundation in main EBITDA
2004 driver 2,290
1,695
• EE has constructed more than 150 1,914MW
projects, and all projects was
1,539 1,663MW
completed with positive profit
margin 2014: First issue 725
of a listed bond 1,143 1,209 MW
510
1,112MW 390
• Operational assets owned by
2008: EE constructs its
European Energy has grown to 467 2004: European 863 875MW 258
first solar power plant
Energy was founded
MW as per end of 2020 by Knud Erik Andersen 638
687
681MW 168
and Mikael D. 531
527MW
431 475MW 153 1189
Pedersen 373
414 415 1153
27 995
361MW 23
270 854
224 242MW 272MW 272MW 277MW 19 708
11 11 11 16 500 528
65 453
23 342
211 231 261 261 261
176
18 47
2004 2005 2006 2007 2008 2009 2010 2011 2012 2013 2014 2015 2016 2017 2018 2019 2020 2021 2022
Outlook Expected
12European Energy by the numbers
KEY FINDINGS EBITDA PROFIT BEFORE TAX
• Equity has grown by 2.5 times since 2016 80 +35% CAGR 50 +21% CAGR 2016-
• EBITDA has more than doubled since 2016, and despite 70 2016-2020 2020
the COVID-19 crisis, the EBITDA of 2020 slightly 40
60
exceeded the outlook
EUR million
50
EUR million
30
• Pipeline of 613 MW under construction and 814 MW 40 80 50
ready to build forms a solid basis for our ambition to 20
30 61 37 38
construct 750MW in 2021 which will be about 3 times
20 44 26 26
2020 level 34 34 10
25 18
10
0 0
2016 2017 2018 2019 2020 2021E 2016 2017 2018 2019 2020 2021E
EQUITY UNDER CONSTRUCTION OR READY TO BUILD CONSOLIDATED SALE OF ELECTRICITY
250 1,600 50
+26% CAGR 2016- 1,400
+37% CAGR under 1,427
+48% CAGR
200 2020 in equity excluding 75 construction 2016-2020 40 2016-2020
hybrid 1,200
1,000 814
EUR million
30
EUR million
150 823
MW
800
571 20 43
100 600 501
160 408 606 31
138 400
50 108 613 10 20
91
64 200 9 10
218
0 0 0
2016 2017 2018 2019 2020 2016 2017 2018 2019 2020 2016 2017 2018 2019 2020
Total Hybrid Total Under construction Ready to build
13European Energy key credit highlights
Electrification will drive demand for significant build out of renewable energy – this will ensure that prices of electricity will
1 remain attractive.
Market /
Megatrends
Experts agree that build out of renewable will increase substantially to 80GW p.a. However, in order to keep
2 1.5 ºC temperature target the build out need to further increase with 3-4 times p.a.
Stable and high EBITDA margins due to IPP focus with 467 MW operational assets owned by European
3 Energy
More than 150 projects completed and approx. EUR 2.5bn cumulative investments, all resulting in positive
4 results. Since 2018, European Energy has divested projects with an aggregated enterprise value of more than EUR
500m, of which the total profit margin is +20%
5 Strong and increasing investor appetite for operational assets
Business
6 Short value creation processes from Ready-to-Build to grid connection and divestment
7 Large and diversified construction portfolio will support EE’s growth targets in all major markets
Increased demand for long term PPA’s driven by corporate demand for reduction in CO 2 emissions and
8 cost savings
9 Strong performance through Covid-19 Global pandemic: Financial guidance kept throughout 2020
Financials
10 Solid financial profile with a strong equity story, having grown with a CAGR of 26% p.a. since 2004
14MARKET OVERVIEW
TROIA
123 MW
ITALY
15Our World is
Facing Challenges
16Our Answer:
A Decarbonised and
Electrified World
17Growing global renewable-energy market
Comments Strong global growth
• From 2004 (when the Issuer was founded) until end of 2020, the global
installed capacity of onshore wind and solar PV farms has grown from 50
GW in early 2004 to estimated approx. 1,450 GW at end of 2020 Onshore Wind
2,000
• This growth has been stimulated by significant technological breakthroughs, Estimated period
+9% 1,571
Capacity (GW)
favourable political frameworks and dedicated developers, financiers and 1,500 1,295
1,112
subcontractors +12% 991
1,000 805
679
• Onshore wind and PV power is currently the most economically competitive 470
562
500 360
alternatives to traditional fossil fuel sources 280
• Despite seeing strong growth over the past 10 years, renewable energy 0
2012 13 14 15 16 17 18 19 20 21 22 23 24 25 26 27 28 29 2030
makes up less than 5% of global energy demand. As such, the potential for
future growth in the renewable-energy market continues to be very large
Solar PV
2,500 2,382
Utility-scale PV
Capacity (GW)
Estimated period +13% 1,996
2,000 Small-scale PV
1,651
1,500 1,387
1,087
1,000 +30%
Distribution of global energy mix
772
526
500 319
102 188
2%
Renewables excl. hydro 0
2012 13 14 15 16 17 18 19 20 21 22 23 24 25 26 27 28 29 2030
Other
Offshore Wind
197
200
Estimated period 173
+19%
Capacity (GW)
148
150 128
109
100 89
71
+29% 52 60
36 44
50 30
98% 13 18 22
5 7 8 12
0
Source: IEA (2019) World Energy Balances 2020 for 2018, https://www.iea.org/subscribe-to-data-services/world-energy- 2012 13 14 15 16 17 18 19 20 21 22 23 24 25 26 27 28 29 2030
balances-and-statistics. All rights reserved. Source: BloombergNEF – New Energy Outlook 2020
18Renewables Growth driven by lower costs
Predicted Needed Renewable Capacity
To reach 1.5 ºC
estimate
General
Forecast Forecast 2020
2019 Need for +250 –
~+ 80 GW p.a.1 300 GW p.a.2
~+40 GW
p.a.1
Historic cost (LCOE 2009-2019) Future cost (LCOE in 2030 vs. 2019)
160
140
LCOE (USD/MWh)
120 Onshore Wind 10-year percentage decrease: -70%
Onshore Wind 10-year CAGR: -11%
Onshore
100 -70%
80
60 Wind
-20%
40
20
-
2009 2010 2011 2012 2013 2014 2015 2016 2017 2018 2019
400
350
LCOE (USD/MWh)
300
Solar 10-year percentage decrease: -89%
250 Solar 10-year CAGR: -20%
200 -89% Solar PV
150
-35%
100
50
R
-
2009 2010 2011 2012 2013 2014 2015 2016 2017 2018 2019
Note: LCOE: levelised cost of energy. 1. IHS market forecast in 2019 for 2019-22, and in 2020 for 2021-25. 2. Top-down assessment based on world’s capacity needed to reach net-zero emissions in 2050
Source: Historic LCOE: Lazard and management estimates. Future LCOE: McKinsey, EnergyData & IRENA 2030 Report; OECD Investing in Climate, Investing in Growth Report 2019
19BUSINESS
DESCRIPTION
20Overview of European Energy’s core business model activities
Production and
Development Construction
sale of electricity
1 2 3
• Independent production of electricity, which • Project risk: European Energy’s project • Construction phase based on standardized
has increased by 38% from 2019 to 632 GWh development is based on many small or building process and tier 1 and easy
in 2020 medium sized projects manageable equipment
• Sale of electricity to the grid • Potential wind & solar site assessment • Select optimal technology and park layouts
• Approx. 90% of the sale of electricity has • Environmental studies • Oversee every construction phase from
been secured with long-term PPAs or FiT • Secure land & building permits groundworks to grid connection
Core activity supported by a well tuned back office Supporting functions
Number of employees at end of 2020
203
✓ Internal M&A team
55
✓ Internal Legal team
52
✓ Internal PPA team
16
13
9
✓ Internal Finance team
48 ✓ Internal Asset Management team
10
2004-2006 2015 2016 2017 2018 2019 2020 Total
21Large growing pipeline diverse across geography
and technology
Key highlights Construction portfolio of 1.4 GW EE share of electricity production (632 GWh)
Solar PV = 53%, Wind = 47% Solar PV = 52%, Wind = 48%
• Significant pipeline of 17.5GW (16.1 in the development
1.4 43
pipeline and 1.4 in the construction pipeline)
Ready-to-Build
• EE has increased the late-stage development pipeline by Under Construction
approx. 80% since 2019. EE will continue to increase the
0.8 30
development pipeline in the coming years.
0.8
• During 2020, European Energy was engaged in construction
activities at 14 different sites in five European countries and 20
GW
0.6
Brazil
0.6
• Approx. 800 MW of the construction portfolio was secured
0.5 0.6
by PPA or FiT at the end of 2020
0.2
Development pipeline of 16.1GW, 0.1
excl. construction portfolio 2018 2019 2020 2018 2019 2020
Excl. Early-stage Construction portfolio Electricity Sales geographic breakdown
Unspecified development of 4.3 11.8 Geographical breakdown
GW
PV Brazil
Sweden
Wind
Poland 14% 9%
Denmark
4%
26%
9.2 Germany
6.5
GW
Lithuania 40%
25%
2% 8%
Italy 3% Brazil
76% 0%
2.2 Greece 3%
Germany
Denmark Other 2%
6% 4%
Bulgaria
2.6 Finland Sweden
20%
2018 2019 2020 Italy
22Entering downstream electrification (Power-to-X)
Power-to-X Green Heating
24% ownership in the Danish ca. 43% ownership in the
Danish heat pump company, Victor
e-methanol company, REintegrate
Energy Solutions (Jan. 2021)
European Energy made in 2020 it first investment into
Agreement
the Power-to-X space with a 24% ownership stake in In Q1 2021, we made another investment into in-
the Danish e-methanol company Reintegrate direct electrification with the investment into Viktor –
with Circle K
a Danish heat pump company that transform district
Agreement with Circle K to buyout all e-methanol heating into 100 % renewable energy.
from the first PTX plant by REintegrate
To offtake the entirety of the e-methanol production from
Reintegrate’s first PTX plant
Electricity to Ammonia,
Hydrogen e-fuels, Gas
Direct
Electricity
23EUROPEAN
ENERGY
FINANCIALS
MÅDE
26 MW
DENMARK
24Stable earnings growth
Stable high growth in EBITDA with strong margins 2016-2020 Considerations
EBITDA (EURm) • EBITDA increased by 38% from 2019 to 2020
and has more than doubled from 2016 to
EBITDA margin (%) 34.9% 2020
29.6%
- The majority of the growth stems from
increased profit of power sales
17.7% 18.3% 18.6% • EBITDA remains stable under volatile
revenues due to high margin on increased
80.0 electricity sales and the inclusion of profit
61.2 after tax from equity-accounted investments
44.3
34.2 33.6 • European Energy has a strong visibility on
24.9
future earnings due to a strong pipeline and
maintained its guidance throughout 2020
2016 2017 2018 2019 2020 2021E
• European Energy’s guidance for 2021 is an
Strong EBT growth from 2016-2020 expected EBITDA of EUR 80m or a growth of
31% over 2020
• Profit before tax is expected to be EUR 50m
or a growth of 32% over 2020.
EBT (EURm)
EBT margin (%) 27.0%
18.3%
15.7%
12.7% 13.8%
50.0
37.4 37.8
25.8 25.9
17.9
2016 2017 2018 2019 2020 2021E
25Strong Operational performance
Considerations
EE share of electricity production Sale of electricity
• In 2020, European Energy recorded a record
high in sale of electricity. Compared to the
previous year, the consolidated power sales
632 43 increased by 41% to EUR 42.9m. European
+39% p.a. +47% p.a. Energy’s net share of electricity production
458 has since 2016 grown by 33% p.a.
30
•
EURm
The increase in electricity production is
GWh
328 primarily related to the strategy to move
20
towards becoming an Independent Power
Producer (IPP) with more generating assets
kept in European Energy’s own books. This
brings stability into our profitability.
2018 2019 2020 2018 2019 2020 • Asset Management continues to grow and at
the end of 2020, European Energy managed
1.34 GW of assets divided between 880 MW
Assets under management Energy plants sold, incl. 3rd party share
wind power and 456 MW solar power
production. European Energy owns 402 MW
263
+18% p.a. and the remainder is managed on behalf of
1,3 178
investors
1,2
• European Energy recorded a high level of
162
1,0 sales activities of energy plants throughout
0,9 2020 with divestment of projects in every
148
0,8 142 quarter. In total, European Energy divested
GW
0,8
solar and wind farms with a combined
129 capacity of 129 MW with an enterprise value
of EUR 162m.
12 11
0,4 0,4
5
0,2
2018 2019 2020 2018 2019 2020
MW # of Projects
3rd party share
Enterprise Value, EURm
EE net share
26Strong cash position
Cash flow from operations excl. changes in net working capital, EURm
Considerations
Cash flow from operations before changes in NWC
Change in net working capital • Cash flow from operating activities before
changes in net working capital totaled a solid
EUR 50m in 2020, an increase of EUR 16m
compared with 2019. This is mainly the result of
49.8 increasing profits from sale of plants and
34.1 electricity and improved working capital in
18.2 18.1 21.3
terms of higher payables resulting from higher
activity partly counterbalanced by higher net
(10.9) (172.1) (14.4) (85.4)
financials and taxes paid.
(32.6)
• The negative cash flow from NWC 2015-2020 is
primarily due to the increase in inventories
2016 2017 2018 2019 2020 which in turn is a result of higher activity and an
increased construction portfolio
Positive development in overall cash flow – change in cash flow year-on- • Cash flow from financing activities mainly
year, EURm
reflects the proceeds from the issuance of the
hybrid bond in September 2020 of EUR 75m.
Change in cash and cash equivalents
121.9
113.5
Cash and cash equivalents end of period
58.6
48.2
54.9
15.1 33.1
10.4 8.4
(0.9)
2016 2017 2018 2019 2020
Note: 1) In the 2020 annual report “Dividends” line item in the cash flow statement is reclassified from “cash flow from investing activities” to “cash flow from operating activities”. This change is
reflected throughout the graph 2016-2020 for comparison purposes
27Balance sheet overview
Assets, EURm Considerations
PPE 740 • Total asset and liabilities increased to EUR 740m
Inventory 606 140 or 22% compared with 2019.
Investments and loans in companies
Receivables 447 143 • On the asset-side, the increase shows up in
Cash 325
86 increasing inventories i.e. plants under
288 227
219 50 construction or operating plants for sale
202 78
51 102 65 reflecting the strong growth of our company.
72 61 57 74
45 40
43 42 114 122
37 15 48 59 • On the liability-side, the increase is mainly seen in
2016 2017 2018 2019 2020 total equity reflecting the profit of year as well as
the newly issued hybrid bond of EUR 75m in 2020
Equity and liabilities, EURm (which is recognized as equity).
Total equity 740 • Net interest-bearing debt is stable in EUR but as a
Non-current liabilities 606 result of the increasing EBITDA, leverage goes
Current liabilities 235 down to 5.0x at end of 2020 from 6.8x a year
447 138
before.1 The group holds a significant cash
288 108 position of EUR 122m (EUR 35m as restricted
219 363 425 cash) which will support our growth plans going
91 248
64 into 2021.
116
105
50 81 91 105 80
• Valuation of operational assets is based upon cost
2016 2017 2018 2019 2020 value, and not current market value
Contingent liabilities, EURm • Bond proceeds from earlier bond issues have
accelerated the fast growth of European Energy
Guarantees, warranties and other liabilities related to SPAs
Guarantees related to financing agreements
176
79 94
3 27 21 176
76 6 82
24 3 15 11 0
2016 2017 2018 2019 2020
Note: 1) The hybrid capital is not included in the NIBD
28Overview of debt structure as per end of 2020
Consolidated debt overview, EURm Considerations
Free cash an cash equivalents Lease liability Senior bond incl. IFRS modifications • The recourse part of project financing debt of
Restricted cash and cash equivalents Project Finance EUR 60 million consist mainly of construction
161 10 loans, which will be converted into non-
87
recourse loan when projects are turned into
78
operational projects
35 303
254
83
-122 • EUR 78 million of project financing has been
moved from recourse to non-recourse debt
60
after end of 2020
194
Recourse debt Non-Recourse debt Other Cash NIBD
NIBD / EBITDA Solvency ratio, %
29.3% 31.6% 32.0%
7.1x 24.0% 22.7%
6.8x
5.0x
4.0x
3.0x
2016 2017 2018 2019 2020 2016 2017 2018 2019 2020
NIBD (EURm) Interest Coverage Ratio
45.7x
303 304
239
101 102 10.6x
4.6x 5.1x 6.5x
2016 2017 2018 2019 2020 2016 2017 2018 2019 2020
Note: NIBD / EBITDA = (Interest bearing debt less cash) / EBITDA. Solvency ratio = Equity (Incl. Hybrid) / Total Assets. ICR = EBITDA / (Finance income – Finance expenses)
29RISK FACTORS COREMAS
90 MW
BRAZIL
30Risk factors (1/12)
1. RISK FACTORS
This section presents certain risk factors, which are specific to the Issuer and/or the Capital Securities and which the Issuer deems material for taking an informed decision whether to invest in the Capital Securities.
The risk factors are presented in six categories and within each of these categories, the most material risks, in the assessment of the Issuer, are presented first. The Issuer's assessment of the materiality of each risk
factor is based on the probability of its occurrence and the expected magnitude of its negative impact and is disclosed by rating the relevant risk factor as low, medium or high.
Where a risk factor may be categorised in more than one category, such risk factor appears only once and in the most relevant category for such risk factor.
Unless otherwise defined herein, capitalised terms used in this section have the meaning given to them in the terms and conditions of the Capital Securities (the "Conditions").
Risks Relating to the Issuer
1.1 Risks related to the Issuer's business activities
1.1.1 Construction of renewable energy projects
The Group's business comprises the construction of renewable energy projects, including wind and solar projects. The construction of renewable energy projects (whether initially developed as a greenfield
investment or acquired during the development phase) involves risks relating to costs and timing.
The construction works may thus be subject to cost-overruns and/or delays. Those can stem from a poor performance by the counterparties involved in the construction, such as the construction contractors, their
sub-contractors or manufacturers of key components. This may include performance issues arising from financial difficulties encountered by such counterparties or from the occurrence of unforeseen
circumstances at the relevant project site, which impede the progress of the construction. Additionally, delayed projects may miss out on an attractive feed-in tariff due to their late completion. As a result, the
projects can become less profitable for the Issuer.
Risk rating: Medium.
1.1.2 Relationships with external partners
The Group develops, constructs and operates many of its projects in cooperation with external partners. Such partners may be, for example, companies or individuals who have originally developed a project and
then kept a stake in it or financial investors who provide funding for the development of a project. The collaboration with external partners entail a number of risks. In particular, the Group may be exposed to risks
related to the partner's behaviour and/or liquidity.
If the partner's business behaviour is unlawful, unreliable or otherwise unprofessional, this may affect the Group's reputation as it is associated with this partner. A deterioration of the Group's reputation may
adversely affect future business opportunities as the counterparties might pull out or offer worse conditions for future projects and collaborations. It may also impair the Group's access to financing and its
relationship with private and public stakeholders necessary for the successful development of projects.
In case of the partner's insolvency, or if the partner's business behaviour is unlawful, unreliable or otherwise unprofessional, the partner may need to be replaced and the relevant projects may be confronted with
a new ownership structure and subsequent legal uncertainties. This may adversely affect the access to financing for the projects or the Group's ability to divest the projects. Furthermore, the Group's ability to
successfully develop or operate projects may be affected without the financial contributions by the partner. By consequence, the projects may fail and the Group lose its investments.
In a number of partnerships, the Group does not have a controlling interest or only has a controlling interest with regard to some matters. The partners and the Group may have conflicting priorities and business
interests. This entails the risk of disagreement or deadlock on substantial matters. Disagreement or deadlock may have negative consequences for – inter alia – the development, construction or divestment of the
project or could otherwise lead to the project not being able to achieve its full economical potential, which could have a negative impact on the Issuer's business and results of operations.
Risk rating: Medium.
31Risk factors (2/12)
1.1.3 Key personnel
The Issuer is to a large extent dependent on its management, department heads and other key personnel due to the extensive knowledge and experience these persons possess. If one or more of these key
persons decide to leave the Issuer, this may result in loss of know-how and may delay or prevent the implementation of the Group's projects and business strategy. It is also essential that the Group is able to
recruit qualified staff on a regular basis. Due to the offices location in Denmark and the fact that positions in the company often require specific knowledge of a foreign market and corresponding language skills,
the process of recruiting specific competences can at times persist for a prolonged period of time, which can have a negative impact on the Group's business.
Risk rating: Medium.
1.1.4 Weather conditions and insurances
The production of renewable power projects depends on weather conditions, such as wind or solar conditions. If the actual weather conditions on the Group's project sites are worse than the predicted average
conditions, the production and revenue from the respective projects may be reduced. Extreme weather conditions may also lead to the production being entirely shut down.
The Group's insurance policies may not cover any or all of the losses incurred in connection with unfavourable weather conditions or natural disasters, such as storms, earthquakes, hail storms, floods and other
unforeseen events, which in turn might have a negative impact on the Issuer's results of operations.
Risk rating: Medium.
1.1.5 Development of new renewable energy projects (greenfield projects) and acquisition of new renewable energy projects (projects in development)
The Group is dependent upon the successful development of new wind and solar energy projects, which requires the availability of suitable sites for the projects.
To ensure a successful project development, the project sites need to satisfy a number of criteria, including (i) favourable wind or irradiation conditions, (ii) availability of grid connection possibilities and capacity
and (iii) favourable regulatory environment. In parallel with the expansion of renewable energy in some of the Group's key markets (including Denmark and Germany), such sites are becoming more difficult to find
and/or more expensive to acquire or to secure. This can adversely affect the Group's ability to successfully develop new projects and expand its business, which could have a negative impact on the Issuer's
business and results of operations.
In addition to greenfield projects, the Group acquires projects at different stages of their development. Accordingly, the Issuer is exposed to the risk that suitable projects are not available at reasonable prices.
The acquisition of projects developed by third parties also carry the risk that the projects have hidden deficiencies (such as missing securities, unrealistic production prognoses or hidden liabilities). These
deficiencies might not have been disclosed to the Issuer in a buyer's due diligence and might not be covered by any warranties/indemnities given by the seller. The timing of the acquisition of a project may not
allow for a due diligence process that covers all detailed aspects of the project, which may increase the risk of hidden deficiencies. As a result, the Group's project acquisitions may prove less profitable than
expected or even result in a loss, which could have a negative impact on the Issuer's business and results of operations.
Risk rating: Low.
32Risk factors (3/12)
1.1.6 Divestment of projects
The Group's business concept includes the total or partial divestment of projects. There are a number of risks, which can impede the successful divestment of projects by the Group and thus adversely affect the
Group's cash flow and ability to reinvest in new projects and to seize new business opportunities.
The demand for renewable energy projects may decrease due to, e.g., the general economic situation or to country-specific market developments, such as uncertainties with regards to the continuity of feed-in
tariff schemes. The changes in the subsidy-regimes could impact the profitability of the projects negatively, and thereby lead to further decrease in the demand for renewable energy projects.
Such decrease in demand can affect both the market value of and the availability of divestment opportunities for the Group's projects. Finding creditworthy and reliable buyers can prove to be time and cost
intensive. As a consequence, the divestment of projects can become more difficult and less profitable for the Group.
In the framework of the divestment of a project, the Group may accept to give certain guarantees regarding the project to the buyer that are not fully covered by the back-to-back arrangements with the suppliers.
Such guarantees, which may include fulfilment of permits or meeting project specific criteria for receiving subsidies, can force the Group to allocate human and financial resources to the project after its divestment
and potentially lead to direct payment obligations.
Part of the revenues resulting from a divestment may be held back by the buyer or held in escrow until the fulfilment of certain conditions subsequent. This can force the Group to allocate resources to the project
after its divestment and the Group may not be able to receive the entirety of the revenues, e.g., in a case where the Group is exposed to a credit risk on the buyer.
Based on earn-out mechanisms in the sales contract, the revenues resulting from a divestment may be dependent on the productivity of the projects after their divestment and be lower than expected.
Furthermore, in some instances a part of the consideration that the Group receives for a renewable energy project is deferred (including earn-out payments). Should the buyer of the project not be able to pay the
deferred consideration when it becomes due, this would have a negative impact on the Issuer's results of operations.
Risk rating: Low.
1.1.7 Relationships with suppliers
When constructing wind parks and solar photovoltaic ("Solar PV") plants, the Group concludes agreements concerning delivery of construction services, components and infrastructure, etc. with third party
suppliers. The suppliers often demand that an advance payment is made before delivery takes place. There is a risk that such advance payments may be lost if the suppliers become financially distressed.
Additionally, the suppliers may fail to deliver or deliveries may be delayed. This may negatively impact on the construction process which could also result in the Group not being able to meet its contractual
obligations to a buyer of the project in question.
The Group is also exposed to counterparty risks during the operating phase of its assets if the servicing and/or management of the assets are being carried out by third party suppliers. A defaulting supplier could
result in an interruption to the operations of a plant until a replacement supplier has been found. This could have a negative impact on the Issuer's business and results of operations.
Risk rating: Low.
1.2 Economic and market risks
1.2.1 Fluctuations in the market price of electricity and/or certificates
While part of the income generated by the Group's wind farms and Solar PV plants is covered by fixed prices (due to guaranteed feed-in tariffs or long term power purchase agreements) or fixed price premiums,
part of the income may fluctuate with the market price of electricity and/or certificates. This exposes the Group to a risk of decrease in the price of electricity and/or certificates which could occur due to – inter alia
– a reduction in the demand for electricity, weather conditions, network failures or new capacity being added to the market.
The Group does not operate with a general price hedging strategy, but may from time to time enter into hedging agreements in order to receive a guaranteed fixed price instead of a variable price for the sale of
electricity and/or certificates. Such agreements may require a minimum level of production and should the production not meet the agreed minimum level – for example, due to unforeseen events or unexpected
adverse weather conditions – it may be necessary to purchase electricity or certificates on the spot market in order to meet the obligations under the hedging agreement. If the spot prices at the time of purchase
is higher than the price obtained by virtue of the hedging agreement, this could lead to a loss which may have an adverse effect on the financial position of the Group.
Risk rating: High.
33Risk factors (4/12)
1.2.2 Technological development of renewable energy production
The technology of renewable energy generation, including wind turbine generators and Solar PV plants, advances at a very fast pace. There is a risk that the Group may not be able to keep up-to-date with the
technological development and/or to respond in a timely manner to any changes to the technology employed by the Group in its wind parks and Solar PV plants.
The rapid technological development could also lead to other technological solutions for generating renewable energy surpassing the solutions currently chosen by the Group with regard to efficiency and costs.
Should this occur, it could have a negative impact on the Group's business.
In addition, the adoption of newly developed technologies based on the present scientific knowledge and state-of-the-art engineering involves a risk that the technologies may turn out to be unreliable or
otherwise experience unexpected deficiencies in the future, which may impair the productivity of the affected projects. This could have a negative impact on the Issuer's business and results of operations.
Risk rating: Medium.
1.2.3 Competition
The Group operates in highly competitive markets. With regard to the development and subsequent divestment of renewable energy projects, there is a large number of competitors, ranging from small- and
medium sized developers with a profile similar to that of the Issuer to large state-owned utilities. Also with regard to the sale of electricity and certificates at market prices, the Group is faced with intense
competition from other power generators and operators of renewable energy plants. The competition increases the demand on the Issuer to constantly improve its development and operating activities and cut
costs in order to remain competitive. Any failure to do so could lead to an advantage for the Group's competitors which would negatively impact the Group.
Risk rating: Medium.
1.3 Legal and regulatory risks
1.3.1 Regulatory framework and subsidies
The Group is dependent upon the successful development of new wind and solar energy projects, which in turn can be dependent upon the regulatory framework applicable from time to time. Given the
comparably long development periods, renewable energy projects are particularly vulnerable to changes in this regulatory framework.
Most notably, the Issuer is affected by regulation and policy tools that benefit investments in "green energy", such as attractive feed-in tariff schemes and other subsidies. Any reduction of current actions
favouring "green energy" may have a negative impact on the Issuer's business and results of operations.
Some of the Group's renewable energy markets experience significant peaks of project development activities due to regulatory deadlines for attractive feed-in tariff schemes. These peaks stress the availability
and costs of crucial resources for project development, such as grid connection and capacity, construction companies or technical advisors. The increase in costs for such resources may impair the profitable
development of projects. At the same time, the external deadlines causing peaks in activities also lead to peaks in the Group's internal work load. There is a risk that the necessary human resources cannot be
available in due time. This may prevent the successful and timely development of new projects.
Further, there is a trend towards a decrease in subsidy levels due to successful implementation of competitive auction-processes. This has led to some regimes with none or significantly reduced subsidies for
renewable energy projects, which in turn may reduce the profitability of the Group's projects.
In most of the Group's key markets, there are a multitude of public and private stakeholders involved in the process of approving new green energy projects, including municipalities, governmental authorities,
interest groups or local residents. These stakeholders may delay or stall the successful development of new projects. In particular, the development of new projects may be dependent on the Group's receipt of
approvals and permits from public authorities (such as planning approvals) as well as satisfactory performance of environmental impact assessments. Even where the requisite public approvals and permits have
been granted, they may be subject to complaints or law suits by private stakeholders, which may delay the construction of a project or even lead to its cancellation. Complaints may also be made after the project
has been completed and, if such complaints are successful, the Group could potentially be required to cease operating the relevant project temporarily or even permanently. Together with the vulnerability to
changes in the regulatory framework, these factors increase the risk that the Group finds itself unable to successfully develop new projects and to expand its business.
Risk rating: Medium.
34You can also read