Why is the Hong Kong Housing Market Unaffordable? Some Stylized Facts and Estimations
←
→
Page content transcription
If your browser does not render page correctly, please read the page content below
Why is the Hong Kong Housing
       Market Unaffordable? Some
      Stylized Facts and Estimations

Charles Ka Yui Leung, Joe Cho Yiu Ng and Edward Chi Ho Tang

Globalization Institute Working Paper 380                                                        April 2020
Research Department
https://doi.org/10.24149/gwp380
Working papers from the Federal Reserve Bank of Dallas are preliminary drafts circulated for professional comment.
The views in this paper are those of the authors and do not necessarily reflect the views of the Federal Reserve Bank
of Dallas or the Federal Reserve System. Any errors or omissions are the responsibility of the authors.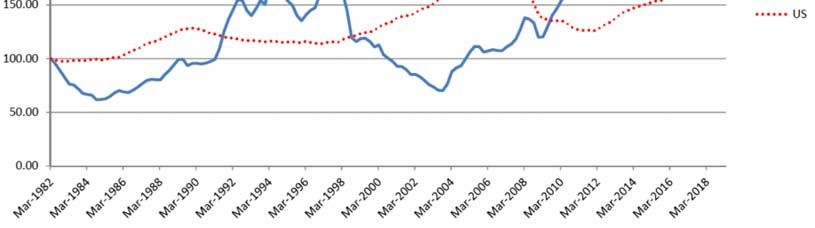
Why is the Hong Kong Housing Market Unaffordable? Some
                 Stylized Facts and Estimations *

             Charles Ka Yui Leung†, Joe Cho Yiu Ng‡ and Edward Chi Ho Tang§

                                                   March 2020

                                                     Abstract

The house price in Hong Kong is well-known to be "unaffordable." This paper argues that
the commonly used house price-to-income ratio may be misleading in an economy with
almost half of the population living in either public rental housing or subsidized ownership.
Moreover, we re-focus on the relationships between economic fundamentals and the
housing market of Hong Kong. While the aggregate GDP, population and longevity
continue to grow, the real wage and household income fall behind. The trend component
of the real GDP growth suffers a permanent downward shift after the first quarter of 1989
(a “political scar”). The trend component of real wage growth is close to zero, and the
counterpart of real consumption and real investment decline steadily. Meanwhile, the trend
component of the real housing rent and price display patterns that decouple from the
macroeconomic variables. We also discuss the directions for future research.

Keywords: housing demand, migration, structural break, time series decomposition,
wage index and household income

JEL Classification Numbers: E20, J01, R00

*Acknowledgment: We are grateful to Alain Bertaud, Nan-Kuang Chen, Bob Edelstein, Eric Hanushek, Fred Kwan, Tommy
Leung, Steve Malpezzi, Shane Su, Byron Tsang, Isabel Yan, Matthew Yiu, anonymous referees, seminar participants of
the National Taiwan University for many helpful discussions, and City University of Hong Kong (through the Internal Grant
No. 7005001) and Hong Kong Shue Yan University for financial support. Part of the research was conducted when Leung
visited the Hoover Institution; Ng is visiting Virginia Tech through a Junior Fulbright Scholarship. The hospitality of these
institutions is gratefully acknowledged. Part of the work described in this paper was supported by a grant from the Research
Grants Council of the Hong Kong Special Administrative Region, China (Project No.: UGC/FDS15/B01/18). The usual
disclaimer applies. The views in this paper are those of the authors and do not necessarily reflect the views of the Federal
Reserve Bank of Dallas or the Federal Reserve System.
†
 Charles Ka Yui Leung, Department of Economics and Finance, City University of Hong Kong, Kowloon Tong, Hong Kong,
kycleung@cityu.edu.hk.
‡
 Joe Cho Yiu Ng, Department of Economics and Finance, City University of Hong Kong, Kowloon Tong, Hong Kong,
joecyng-c@my.cityu.edu.hk.
§
 Edward Chi Ho Tang, Department of Economics and Finance, Hong Kong Shue Yan University, North Point, Hong Kong,
chtang@hksyu.edu.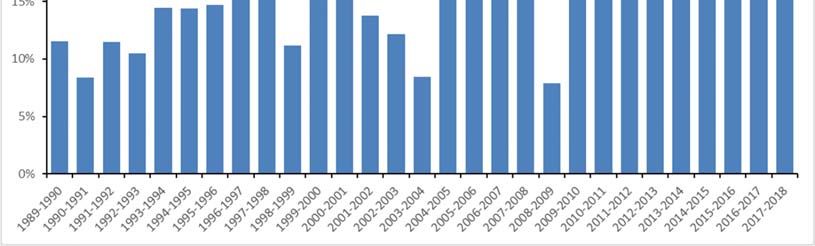
1. Introduction
         Housing affordability has become a global concern. According to McKinsey
(2017), “One feeling unites billions of people in cities around the world: a sense of
sticker shock whenever they attempt to find a new home. From London to Lagos,
housing costs are creating financial stress for a large share of the world’s urban
residents.” Some authors claim that Hong Kong performs worst in providing
affordable housing among the global cities. For instance, according to Demographia
(2019), “The 29 severely unaffordable major housing markets are shown in Table 7.
Hong Kong has a Median Multiple of 20.9, the least affordable Median Multiple yet
recorded. For the ninth year in a row, Hong Kong has the worst housing affordability
in the Demographia International Housing Affordability Survey...”
         Motivated by these observations, this paper addresses the following questions:
Is Hong Kong housing that unaffordable? Why is it so prohibitive? What can other
places learn from the Hong Kong experience? To make this paper as accessible as
possible, we first present some stylized facts graphically. We provide explanations
and interpretations of those graphs. We will also provide some statistical analysis
when necessary.
         This paper builds on several strands of the literature. First, there is an effort to
compare and contrast the institutions and performance across different housing
markets.1 Second, many works of literature have studied how the housing market is
related to the macroeconomy.2 Third, there is relatively small literature that focuses on
the Hong Kong real estate markets.3 Fourth, since most residents in Hong Kong are
ethnic Chinese and at the same time being exposed to the global culture, this paper is
also related to the literature on the Chinese housing market.4 Fifth, the trade conflict

1
  It is beyond the scope of this paper to review the literature. Among others, see Bardhan et al. (2012),
Ben-Shafar et al. (2008), Bertaud (2018), Hårsman and Quigley (1991), Mera and Renaud (2000),
Renaud et al. (2016).
2
  It is beyond the scope of this paper to review the literature. Among others, see Case and Quigley
(2008), Chang et al. (2012, 2013, 2016), Chen and Leung (2008), Favilukis et al. (2017), Garriga et al.
(2017), Jin et al. (2012), Kan et al. (2004), Kiyotaki and Moore (1997), Leung (1999, 2001, 2003),
Leung and Chen (2006), Leung and Teo (2011), Leung and Tse (2017), Lin et al. (2004), Malpezzi
(2017), Tse and Leung (2002). For a review of the literature, see Davis and Van Nieuwerburgh (2014),
Leung (2004, 2017), Leung and Chen (2017), Leung and Ng (2019), Piazzesi and Schneider (2016).
3
  It is beyond the scope of this paper to review the literature. Among others, see Cheung et al. (2017),
Chong and Yiu (2019), Chow et al. (2002), Funke and Paetz (2018), Huang et al. (2018), Kwan et al.
(2015), Leung and So (2004), Leung and Sung (2006), Leung and Tang (2012, 2015a, b), Leung and
Wong (2004), Leung et al. (2013, 2014, 2015, 2019), Oxfam (2018), Sung et al. (2015), Tang (2017,
2019), Wong (1998), Wong et al. (2018), Wu et al. (2017).
4
  It is beyond the scope of this paper to review the literature. Among others, see Chen and Wen (2016),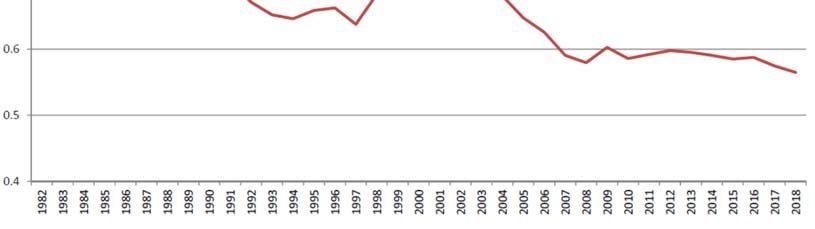
between China and the United States has non-trivial consequences to other countries,
as some authors have found preliminary evidence on that.5 Hong Kong, being a part of
China and intermediates many goods trade as well as financial transactions for China,
is affected. It also sheds light on the “spillover effects” of the China-USA trade conflicts.
And while the Hong Kong housing market has been discussed previously (Leung and
Tang, 2012, 2015a, b, and the reference therein), this paper provides some updated
analysis on the housing affordability and conduct a time-series decomposition of the
key macro variables. This paper intends to be accessible to a broad audience in Asian
and other countries, as economic lessons are typically general. Therefore, we present
our results graphically.
         The structure of this paper is straightforward. We present some stylized facts of
the Hong Kong housing market and the macroeconomy. We then decompose the time
series of the main variables of the housing market and the macroeconomy. The evidence
suggests that the "unaffordability" of the housing market may have its roots in some
long term trend. We provide some simple thoughts in the concluding section.

         2. Hong Kong Housing Market and the Macroeconomy

         As an international financial center, Hong Kong is mentioned in global media
from time to time. With a fixed boundary and a fixed exchange rate with the United
States, Hong Kong has been able to attract much non-local investment in its real estate
sector.6 Therefore, the housing unaffordability concerns by Demographia and other
organizations deserve serious attention. We begin our discussion with the house price.
Unless specified otherwise, our data comes from the Hong Kong government official
website.7 Figure 1a shows that the real house price in 2018, i.e., the house price after
removing the inflation factor, is 400% of the 1979 level. It also shows that the house

Chen et al. (2017), Deng et al. (2017), Huang et al. (2015), Leung and Wang (2007), Leung et al.
(2011), Wu et al. (2012, 2016).
5
  The literature related to this recent trade war is growing. Among others, see Abiad et al. (2018), Amiti
et al. (2019), Guo et al. (2018), Mandelman and Waddle (2019), Tham et al. (2019).
6
  Notice that the United States follows (approximately) a version of the Taylor rule, which is an interest
rate rule (Koenig et al., 2012). Since Hong Kong maintains a fixed exchange rate with the U.S., Hong
Kong nominal interest rate follows the U.S. counterpart. See Chang et al. (2012, 2013, 2016) for more
discussion.
7
  The government official website for data is https://www.censtatd.gov.hk/home.html.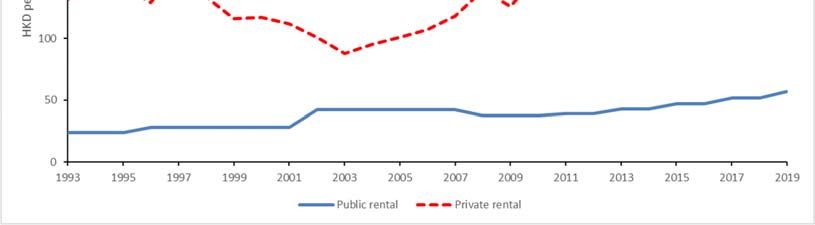
price and stock price, while both have an upward trend, do not always move together.8
Also, some authors suggest that, since the Hong Kong dollar exchange rate is linked
with the U.S., the U.S. monetary policy will dictate the Hong Kong house price. Figure
1b shows that while the U.S. interest rate influences the Hong Kong real housing price
growth rate, it is not the only factor.
        Moreover, Figure 1c suggests that the house price increases faster than the wage,
as the house price-to-wage ratio increases from 100 (1982 level) to about 270 (2018
level). To facilitate the comparison, we also plot the same ratio for the United States.
The U.S. counterpart increases from 100 to 160 during the same period. These figures
confirm the Demographia assertion that the housing affordability in Hong Kong has
indeed deteriorated.
                                           (Figure 1 about here)
        However, those figures overlook an essential feature of the Hong Kong
housing market; namely, a significant number of households live in need-based public
rental housing, and hence they are somehow "protected" from the appreciation of the
house price.9 To illustrate the point that the size of the public rental housing matters,
let us consider an economy with only three agents, A, B, and C. The agents are
labeled in such a way that the income of agent A is lower than agent B, and the
income of agent B is, in turn, more moderate than agent C. In this artificial economy,
the median agent is B. Hence, agent B's house price-to-income ratio is the economy's
median house price-to-income ratio. Now assume that agent A instead lives in public
housing, whose rent is subsidized by the government. The private housing market
consists of only two agents, B, and C. The median house price-to-income ratio of the
economy becomes the average of the house price-to-income ratio of agent B and C. In
other words, the existence of public housing changes the median house price-to-
income ratio in the private housing market.
        Let us consider another economy with five agents, A, B, C, D, and E. As in the
previous example, the agents are arranged so that the income of agent A is lower than
that of agent B, and so on. Agent E has the highest income. In a scenario with no
government intervention, the median agent is agent C. The house price-to-income

8
  For the co-movement between the stock price and housing price, see Leung (2007), Leung and Teo
(2011) for theoretical analysis, Chen and Shen (2005) for the case of Taiwan, and Chang et al. (2013),
Kwan et al. (2015) for the case of Hong Kong.
9
  For more details, see https://www.housingauthority.gov.hk/en/flat-application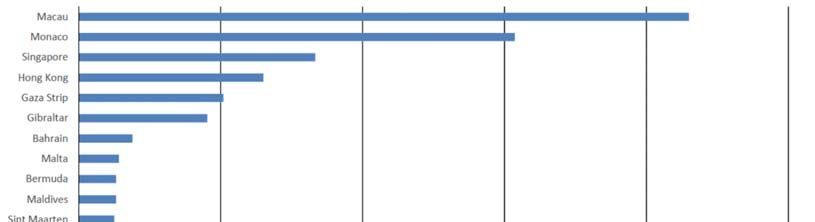
ratio of agent C is the economy's median house price-to-income ratio. Now the
government provides not only public rental housing to agent A but also subsidized
ownership to agent B. In this new scenario, only agents C, D, and E face the private
housing market, and the (new) median agent in the private housing market is agent D.
And if we want to measure the house price-to-income ratio in the private housing
market, we should measure the ratio of agent D, not agent C. In other words, in a
world without any government intervention, the median agent in the income
distribution and the private housing market would be the same person. However,
when the government intervenes through public rental housing or subsidized
ownership, the median agent in the income distribution will no longer coincide with
the median agent in the private housing market. Hence, if the government
participation in the housing market is sizable, we expect the distortion of using the
median house price-to-income ratio would be sizable as well.
In Hong Kong, government involvement in the housing market is indeed
massive. The public rental housing project began in 1953 and since then grows with the
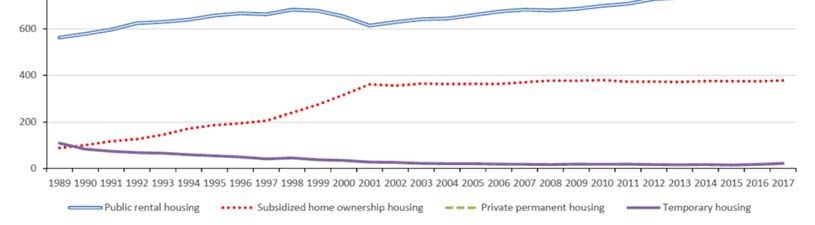
economy (Smart, 2006; Yeung and Wong, 2003). 10 Figure 2a shows the number of
households lives in different types of housing: public rental, subsidized ownership, and
private. Figure 2b shows the number of housing units for each kind of shelter. While
the growth rate of public rental housing and occupants seem to be lower than the private
housing in recent years, the public rental sector still accounts for roughly one-third of
the housing market. The subsidized ownership approximately accounts for another one-
seventh of the housing market. Together, it means that the private housing market
(rental plus ownership) accounts for roughly half of the population.
Furthermore, Figure 2c shows that public housing rent is significantly below the
market counterpart. 11 Since the rent in public housing is significantly below the market
10
Among others, see Gong and Leung (2019), Leung et al. (2012), Leung and Tang (2015) for more
discussion on the public housing allocation.
11
Since the public rental housing is highly subsidized, there is rationing. To be eligible for applying for
public housing, the family should satisfy the income and asset test prescribed by the Housing
Authority. It typically takes several years for a household to receive a public housing unit.
The official account of the rent policy in those public rental units can be downloaded from the
government website: https://www.housingauthority.gov.hk/en/common/pdf/about-us/policy-
focus/policies-on-public-housing/B01/B01.pdf
In October 2017, the Housing Authority tightened “Well-off Tenants Policies.” Households whose
income exceeds five times the current income limits (PRHILS) or whose total household net asset
value exceeds 100 times PRHILs should vacate the flats. For an earlier discussion, see Wong (1998)
and the reference therein.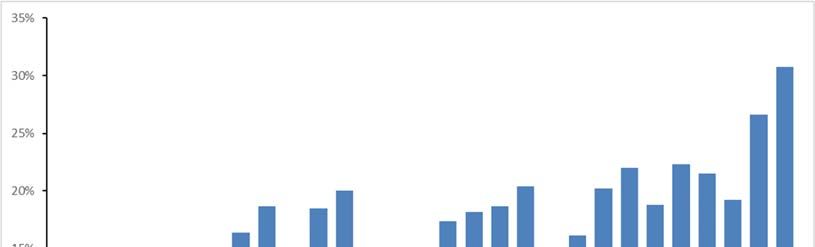
and adjusts slower than the market, it appears to be safe to conclude that up to a third
of the population is shielded from the housing market fluctuations, and they tend to be
the lower-income households. Since public housing shelter in such a scale is absent in
most countries, it may suggest that merely comparing the Hong Kong house price-to-
income ratio, or similar metrics, with other countries, may not be as informative as
previously thought.
                                     (Figure 2 about here)

       Many authors compare the housing market of Hong Kong with Singapore.
While the two economies have many similarities, we caution a direct comparison of the
two housing markets. For instance, while nearly 90% of the population in Singapore
live in “public housing,” most of those public housing units are “subsidized ownership.”
Those Singaporean owner-occupiers would need to bear the capital risk should they
need to re-sell the housing units in the market. The portion of the population living in
pure public rental housing is less than 10% of the whole population (Deng et al., 2014).
It is very different from the case of Hong Kong.

       Besides, a higher level of house price-to-income ratio may be driven by a house
price level which is too high, or an income level which is too low, or both. We present
a series of graphs that may give us some hints. Figure 3a shows that the real GDP per
capita does increase over time. However, the wage in Hong Kong does not grow as fast.
To facilitate the comparison, we plot the ratio of the official wage index relative to the
real GDP per capita and rebase that as unity in 1982. Leung and Tang (2015) show that
if (1) the aggregate production is in a Cobb-Douglas form, as many macroeconomics
textbooks suggest, and (2) both the product markets and input markets are perfectly
competitive, then the ratio of wage relative to GDP per capita should be a constant. This
result holds even when the aggregate productivity fluctuates. This analytical result
gives us a handy benchmark.
       Figure 3b shows that this is not the case. The ratio drops from unity to around
0.6 over the years, which significantly and persistently departs from the theoretical
benchmark. There are different possible interpretations. For instance, some suggest that
alternative contractual arrangements are now available in Hong Kong, and hence the
wage index has ceased to be an informative indicator. OECD (2016) recognizes that in
Europe, at least half of the employees benefit from various kinds of flexible working
arrangements, including working part-time, working at home, etc. The presence of this
arrangement could affect the information contents of the wage index. Also, the wage
index concerns an individual, while in practice, there are many multi-member
households. There is evidence that in multi-member families, some members may
specialize in market production while other members may specialize in household
production (Becker, 1994; Erosa et al. 2017). In that case, household income-based
measures may be more relevant than the individual-based wage index.
Figure 3c presents both the ratio of median household income relative to the
GDP per capita and the ratio of wage index relative to the GDP per capita. Again, we
normalize both ratios as unity at the initial period that we can access the relevant data,
which is 1999. Several patterns are apparent. First, relative to the GDP per capita, both
the median household income and the wage index roughly declines at the same speed
as the wage index between 1999 to 2006. In other words, the median household income
series and the wage index follow the same downward trend during the period 1999 to
2006, and hence our previous result is robust in this sense. After the global financial
crisis (GFC) began, the median household income almost stays constant, while the
wage index continues to decline from roughly 85% to 75% of the per capita GDP. The
difference between the individual-based wage index and the household income is
consistent with the "income insurance" view of marriage. When a husband, for instance,
loses his job in a recession, the labor supply of his wife tends to increase and hence
stabilizes the household income (e.g., Bredtmann et al., 2018; Bryan and Longhi, 2018,
Greenwood et al., 2017, and the reference therein).
There are different possible explanations of the decline of wages relative to the
per capita GDP. Recall that the ratio is supposed to be a constant under perfect
competition. Hence, the observed departure suggests a violation of the perfectly
competitive assumption, which is consistent with some earlier studies. For instance,
Lubik (2012) proposes a search-and-match model to account for the Hong Kong labor
market dynamics, and he structurally estimates his model with the Bayesian method.
He finds that the bargaining power of the employees is minimal.
Alternatively, it is also consistent with emerging literature on the declining labor
share of GDP (Dao et al., 2017; Gutierrez, 2017; Karabarbounis and Neiman, 2013).
Autor et al. (2017) suggest that it is possible that while the labor share of output among
most firms is high, some "superstar firms," which are large and growing, could bring
the aggregate labor share to decline over time. Notice that if the labor share of GDPshrinks over time, the wage may grow slower than the per capita GDP. Since a full
account of this issue will demand another paper, we will return to the housing market
of Hong Kong.
(Figure 3 about here)
Taking the high price of housing as given, we now ask what are the driving
forces behind. Again, we address this question through a series of graphs. We have
already shown that the real GDP per capita of Hong Kong grows over time (Figure
3a). Also, Figure 4a shows that both the population and life expectancy of Hong Kong
increase over time. While the fertility of Hong Kong is below the replacement level,
there is a continuous flow of immigrants coming to Hong Kong, especially from
Mainland China. With more people, and on average longer lives and higher income
per person, it is not surprising that the housing demand increase over time. Besides,
Figure 4b shows the composition of Hong Kong households in terms of the size of the
family. The proportion of one-person and two-person households has increased over
time. It means that even if the total population is constant, there is a higher demand
for housing units. Thus, with growing income, growing population, lengthening the
longevity of life, shrinking the household size, the aggregate housing demand of Hong
Kong increases over time.
(Figure 4 about here)
The housing supply of Hong Kong is affected by different factors and has been
discussed recently by Leung et al. (2020), we provide only a simple overview here.
Figure 4c compares the population densities across countries and regions and
demonstrates that the population density of Hong Kong may indeed be high. If we take
into considerations that Hong Kong is hilly and a substantial amount of land are not
suitable for high-rise building, the population density is even higher. It is not
uncommon to see residential buildings with more than 30 floors. Thus, it is not
surprising that the house price of Hong Kong would be high. Yet the housing supply
does not increase enough to meet the growing demand. Figure 4d shows that the new
housing supply of Hong Kong, adjusted for the existing stock, decreases over time and
is below 2% since 2005, while the real house price displays a clear upward trend. Notice
that the official data provides only the gross new supply, not the net new supply. It
means that while there may be, say, 20,000 new units being supplied in the market in aparticular year, there may be 5,000 units being demolished in the same year for the
urban re-development purposes. Hence, the net new supply could be far less than the
gross counterpart.
Why did not the housing supply increase as the house price increases? A popular
and convincing reason is that the housing supply is artificially constrained by regulation
under different justifications. Many studies have confirmed that as a nearly universal
reason for limited housing supply. 12 In Hong Kong, the density of residential
development is guided by the plot ratio. It compares the gross floor area of a building
and the site's area. 13 While the institution of the plot ratio may enhance the
environmentally friendly dimension of the city, it restricts the gross floor area to be
completed in a project. Hence, it may reduce the incentives for developers to redevelop
some areas, which indirectly limits the new housing supply. Such distortion in housing
supply can lead to severe economic consequences.14
The institutions of Hong Kong may contribute to this housing supply shortage
problem. Unlike many countries with similar income levels per capita, land ownership
in Hong Kong is public. Strictly speaking, the "land sale" in Hong Kong is the sale of
the right of usage of a particular piece of land during a specific period. Thus, the official
name of the "land sale revenue" is "land premium." An alternative way for the
developers to obtain land is to apply for changes in land use. Usually, it involves a shift
of agricultural land to residential land, and the developer needs to pay a mutually agreed
price to the government. The Government can also invoke the Lands Resumption
Ordinance to resume three types of private land for developing public housing and
Starter Homes.15 Hence, the Hong Kong government almost control the land supply of
Hong Kong and influence the land price. Leung and Tang (2015b), among others,
promote the view that the Hong Kong government effectively operates as a durable
goods monopoly with limited supply, dynamically tradeoffs the quantity of land and
revenue that can be generated from the land sale. Figure 5a demonstrates the increasing
tendency for the Hong Kong government to depend on real-estate related tax. Here we
only include the revenue from land sale ("land premium") and property tax ("rate").16
12
Among others, see Glaeser and Gyourko (2018), Green et al. (2005), Saiz (2010), and the reference
therein.
13
For details, see https://www.pland.gov.hk/pland_en/tech_doc/hkpsg/full/pdf/ch2.pdf
14
Among others, see Herkenhoff et al. (2017) for a structural estimation for the U.S. case.
15
For details, please visit https://www.policyaddress.gov.hk/2019/eng/highlights.html
16
The Hong Kong government also collects "stamp duties," which are transaction taxes in the stockBetween 1990 and 1996, the proportion of real estate-related tax constitutes no more
than 15% of the total revenue. The ratio experiences ups and downs since the 1997
handover to China and reaches a historical high of 30% in 2018. Figure 5b provides
another illustration of the Hong Kong government's real estate-dependency. It shows
that both the fiscal-GDP and hypothetical fiscal surplus-GDP ratio of Hong Kong over
time, where the hypothetical fiscal surplus is the official budgetary surplus minus the
land sale revenue. It is clear that if the land sale revenue were zero, the Hong Kong
government has been in deficit since 2008, when the Global Financial Crisis (GFC)
broke out.
Figure 5c shows that, while the Hong Kong government is increasingly
dependent on land sale and other real estate-related revenue on the income side, its
expenditure on housing, include the provision of public housing, has decreased over
time. The share of housing-related spending is about 14% of the total government
expenditure in 1989 and falls since then. It rebounded to its peak around 15% near
2000 and touched down to around 7% since 2004. In light of these graphs, it may not
be surprising that the queue for public housing has extended, and the shelter in Hong
Kong becomes increasingly "unaffordable" in recent years.
(Figure 5 about here)
We should stress that the dependence of real estate tax revenue needs not to be
undesirable. For instance, Henry George argues that the government should use land
tax to replace other forms of taxation. According to George (1879, chapter 22), as
“population grows and technology advances, land values rise. This steady increase
leads to speculation, as future increases are anticipated. Land values are carried beyond
the point at which labor and capital would receive their customary returns. Production,
therefore, begins to stop.”
Furthermore, George (1879, chapter 32) argues that “to formally confiscate all
land would involve a needless shock, and would require a needless extension of
government. Both can be avoided… It is not necessary to confiscate land—only to
confiscate rent…. Land values increase as population grows and progress advances….
market and the real estate market. However, we are unable to identify an official breakdown of the two
markets. Hence, our measure of the "real estate-related tax revenue" is indeed a lower bound.Taxation of rent would increase as we abolish other taxes…. To abolish all taxes—
except on land values.” While this idea seems radical, it has been widely discussed by
economists (e.g., Behrens et al., 2015; Kawano, 2014; Newton, 1971; Stigler, 1974).
On the other hand, we are not aware of any severe calibration work to examine the
optimality or practicality of the Henry George theorem. We recommend future research
to take up this challenge, which may enhance our discussion of the policy design for
Hong Kong or economies in similar conditions.
Another factor that may contribute to the apparent "housing shortage" in Hong
Kong is the change in immigration. Interestingly, the Hong Kong government does not
collect the immigrant data, or they have not made it publicly accessible. We have access
to the data for the so-called "one-way permit," which keeps track of the number of
immigrants from Mainland China to Hong Kong. Also, there is the Admission Scheme
for Mainland Talents and Professionals (ASMTP), which allows Mainland Chinese
with unique talents to migrate to Hong Kong.17 We have no information about how
many people from other places move to Hong Kong, or how many moves from Hong
Kong to other countries.
Several remarks regarding this one-way permit system are in order. First, the
one-way permits are issued by the Mainland China government, and hence the Hong
Kong government cannot select who would be granted access to Hong Kong. Second,
since we do not have access to the out-migrant data, we are unable to distinguish those
Mainland Chinese immigrants permanently stay in Hong Kong and those who
ultimately migrate to other countries through Hong Kong. The daily quota of the one-
way permit has also changed over time. It increases from 75 to 105 in 1994 and further
to 150 in 1995. The age composition of Chinese immigrants to Hong Kong is displayed
in Figure 6. There exhibits a clear trend that the proportion of young Mainland
immigrants decreases while the percentage of senior adult increases, especially in
recent years.
These changes may have significant consequences. First, since the Hong Kong
government cannot select the immigrants, and hence skill-mismatch is likely, meaning
that those who immigrate to Hong Kong might not have the skill set that Hong Kong's
economy demands. Since it is easier to train young people than senior adults, the
17
For details, see https://www.immd.gov.hk/eng/faq/admission-scheme-mainland-talents-
professionals.htmlcomposition change may have implications for the quality of the workforce in Hong
Kong. Second, the literature suggests that other things being equal, immigrant
workers are paid less in the labor market (Chiswick and Miller, 2008, 2009; Ferrer
and Riddell, 2008; Nanos and Schluter, 2014). The early study of Hong Kong is also
consistent with the literature (Lam and Liu, 2002). Hence, although the immigrants to
Hong Kong might have a little overall effect on the general wage (Suen, 2000), the
coming of immigrants contribute to the increase in income inequality in Hong Kong
(Lam and Liu, 1998). While the immigrants affect the labor market in different
dimensions, their very presence would imply a further tightening of the housing
market, because every human being demands a shelter. An increase in the population
imposes additional pressure on the apparent housing shortage. Some social scientists
report that there is a deterioration of attitude against Mainland Chinese immigrants in
Hong Kong (Lee et al., 2016; Lee and Chou, 2018). Some authors seek to investigate
the effect of Mainland Chinese immigrants on the housing price and rent in Hong
Kong. We conjecture that the immigrant issue compounds with the Hong Kong
identity problem, and exerts pressure on the housing market policies in Hong Kong.
We leave the empirical validation to future research.
(Figure 6 about here)
3. More Time Series Analysis
The previous section provides an informal overview of the Hong Kong housing
market and the macroeconomy. In this section, we attempt to provide more stylized
facts with the minimum statistical model. In particular, we show how the time series of
the aggregate data in Hong Kong can be decomposed into different components and the
implications of such a diagnosis. To our knowledge, this is the first time to apply the
unobserved component approach to decompose time series of aggregate data in Hong
Kong. In section 3.1, we explain the justifications and the setup of our econometric
model. Readers who are not interested in such technical issues can go directly to section
3.2, which presents our decomposition results of the Hong Kong aggregate data.
3.1. Econometric Model
We have several considerations. First, for Hong Kong and Mainland China,the aggregate data is non-stationary. There are some "upward trend" or "growth
components" in the data. Hence, statistical moments are not well defined in the raw
data, and we need to appropriately "de-trend" the data. Second, it is well known that
the growth of GDP and other aggregate variables are stochastic (Chu et al., 2012;
Durlauf and Quah, 1999; King et al., 1988; Leung and Quah, 1996; Leung et al.,
2006; Tang et al., 2008). It means that the traditional method of removing a linear
trend would not be appropriate. Third, we try to maintain a "reduced form" approach
and do not impose much "structure" in the statistical model. A merit of this approach
is to establish some stylized facts that would inform the future development of
theoretical modeling (Cooley, 1995). Fourth, the model should help us to visualize the
differences between changes that happen in the "trend" component (i.e., changes that
would have lasting effects) from structural breaks (i.e., dramatic changes that occur
once and for all). Fifth, if possible, we would like to take advantage of the relatively
new development in time series econometrics, which may help us to uncover
overlooked "stylized facts."
Based on these considerations, we consider the following unobserved
component model to be appropriate (Commandeur and Koopman, 2007). It allows us
to decompose a time series into a trend component, a seasonal component, a cyclical
component, an irregular component, and the possible structural breaks. Both the
number and timing of structural breaks are endogenous in the sense that if there is no
structural break in the data, our econometric model would truthfully report there is no
break. On the other hand, if there are multiple structural breaks, the model would also
faithfully reflect those breaks. Formally, our econometric model for the aggregate
quarterly data is as follows,18
, , ~ 0, , 1, … , ,
Where is the raw time series data, is the trend component, is the seasonal
component, is the cyclical component, , are the level breaks, and is the
18
Data for Hong Kong is collected from Census and Statistic Department and Rating and Valuation
Department. Data for China is collected from CEIC. Real variables are obtained directly from the official
sources, except for real housing prices and rents of Hong Kong and the real GDP of China which is
calculated by dividing the nominal variables by CPI. Real GDP per capita of Hong Kong is calculated
by dividing Real GDP by population (interpolated from semi-annual data).irregular component. Following the literature, the trend component is specified as
, ~ 0, ,
, ~ 0,
where is the slope or gradient of the trend. , , and are mutually uncorrelated.
Thus, our formulation allows for a change in the “growth rate,” if any. Some previous
research argues that the seasonal component is important and may bias our estimation
if we neglect it (Beaulieu and Miron, 1992; Brendstrup et al., 2004). We do not ex-ante
conduct seasonal adjustment on the series. Rather, we remove the seasonal component
through the unobserved component model. The time-varying seasonal can be
established in a time-varying dummy seasonal form (see, among others, Koopman and
Oom (2011)):
⋯ , , ~ 0, ,
where is the number of seasonal frequencies in a period (i.e., 4 for quarterly data),
and the disturbance series is serially independent and mutually independent of all
other disturbance series, for 1, . . . , and 2, . . . , 1. The initial variables
γ , … , γ are treated as unknown coefficients that need to be estimated together with
the other coefficients in the model. If the disturbance variance is estimated to be
zero, this stochastic formulation of seasonal component reduces to a deterministic form.
Our specification of the cyclical component is standard,
∗ ∗ ∗ ,
where 0 1 is a damping factor, 0 π is the frequency, in radians. and
∗
are two mutually uncorrelated NID disturbances with zero mean and common
variance . A merit of this specification is to include both regular and irregular cycles.
The structural break terms , , which are also known as “intervention variables,”
take the following forms:
0
for outliers,
1
0
for level breaks
1For detecting level breaks and outliers, a t-test for auxiliary residuals would be
carried out. Table 1 shows different variations of the unobserved component model.
For growth rates, we employ model 1-2 and 5-8 (without a cycle); for level data, we
use 3-4 and 9-12 (with a cycle). Our model selection procedures are as follows. (1) We
estimate a candidate model without any level breaks. (2) We conduct a t-test for the
auxiliary residuals to detect level breaks. (3) We include level breaks detected into the
candidate model and repeat (2). To guard against the possibility of “over-fitting,” we,
therefore, do not add interventions for every level break detected. (4) We use both AIC
and BIC for model selection. Table 2 shows the selected models.
(Table 1 and 2 about here)
Before we present our results of the decomposition, we first justify our
adoption of the unobserved component approach. A merit of using the unobserved
component approach via Kalman filter is that one can control for outliers and breaks
(if any), which may otherwise bias our estimation. To illustrate this, we compare the
Kalman filter approach with the Christiano-Fitzgerald (bandpass) filter and the
Hodrick-Prescott (HP) filter. The latter two do not control for outliers and breaks. We
use the real export of Hong Kong (level data) as an example. First, we follow the
usual practice to adjust for the seasonal pattern by using the Census Bureau's X-13
procedure.19 Then, we employ different filters to decompose the seasonally adjusted
series. Figure 7a shows that the estimated trends of different filters are very similar.
Now, we add an artificial level break to the series by multiplying the data by 1.05
starting from 1996Q1. We then use the three filters to decompose the artificial series.
If the Kalman filter approach works well in controlling for the break, the trend and
non-trend components will look similar before and after adding the fake break.
Indeed, Figure 7b shows that it is the case. For the cases of the Christiano-Fitzgerald
filter and HP filter, a higher trend results from 1996 onwards since the break is not
adequately taken into account. The unobserved component approach via the Kalman
19
Previously, we estimate the seasonal components by formulating in our model. However, the usual
practice before applying the HP filter and the Christiano-Fitzgerald is to conduct seasonal adjustments
on the series since they do not consider seasonal components within their frameworks. Therefore, to be
consistent, we drop in our model for this comparison part and adjust for the seasonal pattern by using
the Census Bureau's X-13 procedure before applying any filters.filter is more robust when facing breaks and outliers.
(Figure 7 about here)
3.2.Decomposition of Hong Kong aggregate data
Now, we present our decomposition results. A few remarks are in order.
Constrained by data availability, some variables may have a more extended time
series than the others. We focus on real variables (i.e., the inflation factor has been
removed). To facilitate the comparison, we present the decomposition of different
variables in the same format. The first panel shows the raw data (solid black line) and
the trend with structural break components (red dotted line). The second panel shows
the seasonal part. The third panel shows the irregular part, which we can interpret as
"noises." Notice that the scales of the three panels may vary.
Figure 8a shows the real GDP growth of Hong Kong over the years. It
captures the economic downturn due to the stock market crash in 1973 and the
subsequent rebound. It also captures the "short recession" in 1985. Interestingly, it
shows that the trend of real GDP growth slows down, starting from the first quarter of
1989. After the Joint Anglo-Chinese Declaration in 1983, some people Hong Kong
consider the possibility of migration. The 4th June event occurred in Beijing 1989,
and the subsequent trade restrictions imposed by the U.S. on China accelerate the
migration.20 According to Skeldon (1990, p. 502), the average emigration from Hong
Kong is around 20,000 people between 1980 and 1986. Starting 1987, the annual
emigration from 1987 to 1991 are 30,000, 45,800, 42,000, 62,000, and 58,000
respectively. Furthermore, Skeldon (1990, p.505-6) reports that “… For example, the
applications for certificates of no criminal conviction, which are required by most
countries in the course of visa applications, averaged around 3,200 a month over the
first half of 1989 but jumped to an average of 6,200 a month for the second half of the
year (there were 7,225 applications in August 1989 alone). The number of visa
petitions to the United States consulate in August 1989 was 85 percent higher than for
the same month in the previous year while the number of petitions for September was
20
Due to the lobby of the U.S. business sector, those trade restrictions were removed soon (Dietrich,
1999; Skidmore and Gates, 1997). For more discussion of the 4th June event, see Zhao (2001), among
others.up by 233 percent.” Since emigrants tend to be well-educated, the sudden increase in
emigration gives pressure to the supply of human capital, and the Hong Kong
government is forced to respond. Wong (1992, p.13) reports that “… Hong Kong
government announced in 1989 an accelerated plan to increase the number of first
year, first degree places from about 7,000 at that time to 15,000 in 1995. This
meant making tertiary places available to 18 per cent of the relevant age group in
1995 as compared to the 7 per cent in 1989. The dramatic move was made after the
shock of the Tiananmen incident in China. The main aims, according to the
government, were to cope with the exodus of talents, to upgrade skills for the future,
and to satisfy parental demands so as to restore public confidence in the territory.”
(Figure 8 about here)
Recent empirical research confirms that human capital is crucial to economic
growth (Hanushek et al., 2017; Hanushek and Woessmann, 2015, 2016). Thus, such
massive emigration would dampen the economic growth in Hong Kong. Our
decomposition confirms such intuition. We identify a structural break in the trend
component of the economic growth rate in 1989Q1 (Figure 8a). While the drop may
appear to be "small," its importance should not be underestimated. We have done
some "back of the envelope" calculation. First, we normalize the real GDP of Hong
Kong in 1988Q4 (i.e., the fourth quarter of 1988) to be 100. Before the structural
break occurs (before 1989Q1), the trend component of the real GDP grows at 2.17%
per quarter. After the structural break (starting from 1989Q1), the average quarterly
growth rate of the trend component becomes 1.03%. The real GDP in 2019Q2 is
349.1. If the structural break never happened, the real GDP in 2019Q2 would be
1372.32, which is almost four times the observed data.
Since this "political scar" in the trend component of the real GDP growth rate
in Hong Kong is new, some "robustness checks" are necessary. The first objection is
that China was also hurt by the trade restrictions imposed by the U.S. at that time. We
should check whether such a political scar is also found in the Chinese GDP data.
Unfortunately, we are unable to access quarterly real GDP data of China with a
comparable sampling period. Figure 8b displays what we can find so far. Both the rawdata and the trend component of the real GDP growth of China behave differently
from Hong Kong. The second possible objection is that the changing population of
Hong Kong over the sampling period, and hence the growth rate of the aggregate
GDP may be affected by the growth rate of the people. Unlike many metropolitans in
the world, Hong Kong has a fixed boundary, and hence the population factor may be
significant. Therefore, we repeat the exercise with per capita real GDP growth and
report the results in Figure 8c. The same permanent downward shift is also observed
in the first quarter of 1989. Hence, the diminished growth trend is not about the
quantity of the population, but rather the quality of the people.
Figure 8d shows the decomposition results of the unemployment rate of Hong
Kong. Interestingly, the trend component of the unemployment rate increases around
1989, which is the same year the permanent downward shift in the real GDP growth
rate occurs. Notice that the unemployment rate is often a lagging indicator (NBER,
2020), and hence the structural break occurs in 1989Q1 would affect the
unemployment rate in subsequent quarters. The unemployment rate experiences a
further upward change around the Asian Financial Crisis. It hits a peak around 2003
and then started to decline. It stabilizes at a relatively low level after 2011. Yet the
trend component of the unemployment rate never restores the low level in the late
1980s. Again, to facilitate comparison, Figure 8e displays the decomposition results
for the counterpart of China. Adjusting for the fact that the sampling period of China
is shorter, the China unemployment rate exhibits a very different pattern. It is not
surprising since China is a vast country and has a more complicated economic
environment.
Since some authors argue that international trade tends to lead the housing
market in Hong Kong (Ho and Wong, 2008; Leung et al., 2006), Figure 8f shows the
growth rate of the real trade volume, which is the sum of import and export (including
re-exports). The trend component displays a downward trend. It means that the trade
volume grows at a decreasing rate over the sampling period. Figures 8g and 8h show
the decomposition of the growth rates of export and import, respectively. They are
qualitatively the same. These graphs are consistent with the observation that Hong
Kong becomes increasingly dependent on the financial sector, and the weight on
international trade diminishes over time.Some authors debate whether we should model the joint dynamics of non-
durable consumption and housing (Davis and Martin, 2009; Kwan et al., 2015; Leung,
2007, 2014; Leung et al., 2011; Piazzesi, 2007). Therefore, we also conduct a
decomposition of the aggregate consumption of Hong Kong and present the results in
Figure 8i. The trend component is downward sloping, suggesting that the aggregate
real consumption of Hong Kong is growing at a decreasing rate. Such a downward
trend may go unnoticed because the seasonal fluctuations of consumption are large.
One possible interpretation is as follows. In contrast to many theoretical models,
housing in practice is not infinitely divisible. Facing continually increasing housing
prices, potential, as well as constrained home-buyers, need to reduce non-durable
consumption to pay for the home mortgage.
We also decompose the aggregate time-series of investment, as some authors
highlight the joint dynamics of residential and commercial investment (Greenwood
and Hercowitz, 1991; Iacoviello and Neri, 2010; Jin et al., 2012; Jin and Zeng, 2004).
Unfortunately, there is only one aggregate investment time series for Hong Kong, and
we are unable to separate residential investment from commercial investment. Figure
8j shows that the trend component of the aggregate real investment in Hong Kong
also displays a downward trend. Again, covered by the volatile seasonal cycles, an
average citizen might not detect such a downward trend. At the same time, as the
aggregate investment is growing at a decreasing rate, and the population is increasing
at the same time, the economy may not be able to generate enough "good jobs."
Figure 8k shows the decomposition results of the real wage in Hong Kong. While the
raw data of the wage growth rate is volatile, the trend component is close to zero. It is
consistent with our previous result that, relative to the per capita GDP, the wage index
and the household income suffers a deterioration over time.
Fiscal Policies impact the housing market (Alpanda and Zubairy, 2017; Jin
and Zeng, 2007). Economists have developed different tools to assess the impact of
various fiscal policies, such as generational accounting (Auerbach et al., 1994).
Unfortunately, we have no access to the needed data. Therefore, we only decompose
the growth rate of real government spending. Figure 8l shows that except for a few
"unusual quarters," the trend component of the real government spending is almost a
constant. Throughout the sampling period, there are many structural reforms in the
government, including the privatization of some shopping malls and parking lotslocated in public rental housing. However, the data we can access is simply an
aggregate sum, and we can only leave a more detailed analysis of future research.
Finally, Figures 8m and 8n present the decomposition results of the real house
price and rent. Several observations are in order. While the trend components of the
real GDP growth, real wage, real trade volume, real consumption, real investment,
etc. are like straight lines, the counterparts of the real house price and rent behave
very differently. In other words, it may not be easy to predict the "trend" of the house
price and rent with merely the trend components of the real variables. Figures 8m and
8n also show that, relative to the trend components, the irregular components of both
house prices and rent are small. The seasonal factors are significant, but by our
construction, they are predictable.
4. Concluding Remarks
Why is the housing in Hong Kong so "unaffordable"? We propose a variety of
reasons. First, there is a measurement issue. Hong Kong has an unusually large public
rental sector, and about one-third of the population is insulated from the market
fluctuations. Another one-seventh live in the housing of subsidized ownership. The
private housing market accounts for roughly half of the people. The usual house price-
to-income ratio may not be an appropriate metric for the housing affordability in Hong
Kong. Second, there seem to be some long term reasons, including persistent GDP
growth, persistent population growth, extended longevity, etc., which tend to drive up
the housing demand.
On the other hand, relative to the GDP per capita, we show that the wage index
and the household income are unable to catch up with the house price. The "competitive
labor market paradigm" is apparently at odds with the data. Besides, we provide time
series decomposition of many time-series data of Hong Kong. We find that since early
1989, the trend component of the real GDP growth suffers a significant drop, which we
label as a "political scar." The trend component of the real wage growth is almost zero,
and the counterpart of real consumption growth and real investment growth declines
steadily. Thus, the unaffordability of Hong Kong housing may reflect the loss of growth
momentum in Hong Kong. At the same time, the trend component of both real house
prices and rent are volatile and do not seem to be in line with the counterparts of thereal variables we have decomposed. In Leung et al. (2020) and other ongoing research, we point to the possibility of restricted housing supply. This issue alone may not explain the whole puzzle, and more research efforts are needed in the future.
Reference

Abiad, A., Baris, K., Bernabe, J. A., Bertulfo, D. J., Camingue-Romance, S., Feliciano, P. N.,
Mariasingham, M. J., and Mercer-Blackman, V., 2018, The impact of trade conflict on
developing Asia, Asian Development Bank, mimeo.

Alpanda, S. and Zubairy, S., 2017, Addressing household indebtedness: Monetary, fiscal or
macroprudential policy?, European Economic Review, 92(C), 47-73.
https://doi.org/10.1016/j.euroecorev.2016.11.004

Amiti, M., Redding, S. J. and Weinstein, D., 2019, The Impact of the 2018 Trade War on U.S.
Prices and Welfare, mimeo.

Auerbach, A. J., Gokhale, J. and Kotlikoff, L. J., 1994, Generational Accounting: A
Meaningful Way to Evaluate Fiscal Policy, Journal of Economic Perspectives, 8(1), 73-94.
https://doi.org/10.1257/jep.8.1.73

Autor, D., Dorn, D., Katz, L. F., Patterson, C., Van Reenen, J., 2017, The Fall of the Labor
Share and the Rise of Superstar Firms, mimeo.

Bardhan, A., Edelstein, R. and Kroll, C. eds, 2012, Global Housing Markets: Crises,
Institutions and Policies, New York: John Wiley & Sons.
https://doi.org/10.1002/9781119200505

Bardhan, A., Edelstein, R. and Leung, C. K. Y., 2004, A Note on Globalization and Urban
Residential Rents, Journal of Urban Economics, 56, 505-513.
https://doi.org/10.1016/j.jue.2004.06.003

Beaulieu, J.K. and Miron, J.A., 1992, Why do countries and industries with large seasonal
cycles also have large business cycles? Quarterly Journal of Economics 107, 621–656.
https://doi.org/10.2307/2118484

Becker, G., 1994. Human Capital: A Theoretical and Empirical Analysis with Special
Reference to Education, Third Edition, National Bureau of Economic Research.

Behrens, K., Kanemoto, Y., and Murata, Y., 2015, The Henry George Theorem in a second-
best world, Journal of Urban Economics, 85(C), 34-51.
https://doi.org/10.1016/j.jue.2014.10.002

Ben-Shafar, D., Leung, C. and Ong, S. E., 2008, Mortgage Market Worldwide, Oxford:
Blackwell.

Bertaud, A., 2018, Order without Design: How Markets Shape Cities, Cambridge: MIT
Press. https://doi.org/10.7551/mitpress/10671.001.0001

Bredtmann, J., Otten, S. and Rulff, C. 2018, Husband’s Unemployment and Wife’s Labor
Supply: The Added Worker Effect across Europe, ILR Review, 71(5), 1201-1231.
https://doi.org/10.1177/0019793917739617

Brendstrup, B., Hylleberg, S., Nielsen, M. R., Skipper, L. and Stentoft, L., 2004, Seasonality
In Economic Models, Macroeconomic Dynamics, 8(3), 362-394.
https://doi.org/10.1017/s1365100504030111

Bryan, M. and Longhi, S., 2018, Couples' Labour Supply Responses to Job Loss: Growth and
Recession Compared, Manchester School, 86(3), 333-357. https://doi.org/10.1111/manc.12186
Case, K. and Quigley, J., 2008, How Housing Booms Unwind: Income Effects, Wealth
Effects, and Feedbacks through Financial Markets, European Journal of Housing Policy,
8(2), 161-180. https://doi.org/10.1080/14616710802037383

Chang, K. L., Chen, N. K. and Leung, C. K. Y., 2012, The Dynamics of Housing Returns in
Singapore: How Important are the International Transmission Mechanisms?, Regional Science
and Urban Economics, 42, 516-530. https://doi.org/10.1016/j.regsciurbeco.2011.03.010
Chang, K. L., Chen, N. K. and Leung, C. K. Y., 2013, In the shadow of the United States: The
International Transmission Effect of Asset Returns, Pacific Economic Review, 18(1), 1-40.
https://doi.org/10.1111/1468-0106.12008
Chang, K. L., Chen, N. K. and Leung, C. K. Y., 2016, Losing Track of The Asset Markets:
The Case of Housing and Stock, International Real Estate Review 19(4): 435-492.

Chen, K. and Wen, Y., 2016, The Great Housing Boom of China, mimeo.

Chen, N. K. and Leung, C. K. Y., 2008, Asset Price Spillover, Collateral and Crises: with an
Application to Property Market Policy, Journal of Real Estate Finance and Economics, 37,
351-385. https://doi.org/10.1007/s11146-007-9095-x

Chen, T., Liu, L. X., Xiong, W. and Zhou, L. A., 2017, Real Estate Boom and Misallocation
of Capital in China, mimeo.

Chen, S. W. and Shen, C. H., 2006, When Wall Street conflicts with Main Street—The
divergent movements of Taiwan’s leading indicators, International Journal of Forecasting,
22, 317– 339. https://doi.org/10.1016/j.ijforecast.2005.09.005

Cheung, Y. W., Chow, K. K. and Yiu, M. S., 2017, Effects of capital flow on the equity and
housing markets in Hong Kong, Pacific Economic Review, 22(3): 332-349.
https://doi.org/10.1111/1468-0106.12233

Chiswick, B. R. and Miller, P. W., 2008, Why is the payoff to schooling smaller for
immigrants?, Labour Economics, 15(6), 1317-1340.
https://doi.org/10.1016/j.labeco.2008.01.001

Chiswick, B. R. and Miller, P. W., 2009, The international transferability of immigrants' human
capital, Economics of Education Review, 28(2), 162-169.
https://doi.org/10.1016/j.econedurev.2008.07.002
Chong, T. T. L. and Yiu, A. W. H., 2019, The Nexus between Visitor Arrivals and Residential
Property Rents in Hong Kong, Pacific Economic Review, forthcoming.
https://doi.org/10.1111/1468-0106.12241
Chow, Y. F., Wong, N., Leung, C. K. Y., Cheng, E. H. F. and Yan, W. H., 2002, Hong Kong
Real Estate Market: Facts and Policies, Hong Kong: Ming Pao Publishing (In Chinese).
Chu, A. C., Leung, C. K.Y. and Tang, E., 2012, Intellectual property rights, technical progress
and the volatility of economic growth, Journal of Macroeconomics, 34(3), 749-756.
https://doi.org/10.1016/j.jmacro.2012.04.002
Commandeur, J.F. and Koopman, S.J., 2007, An Introduction to State Space Time Series
Analysis, Oxford: Oxford University Press
Cooley, T. ed., 1995, Frontiers of Business Cycle Research, Princeton: Princeton University
Press.
Dao, M., Das, M., Koczan, Z., Lian, W., 2017, Why is Labor Receiving a Smaller Share of
Global Income? Theory and Empirical Evidence, mimeo.
You can also read