How frequent is natural cloud seeding from ice cloud layers ( 35 C) over Switzerland?
←
→
Page content transcription
If your browser does not render page correctly, please read the page content below
Atmos. Chem. Phys., 21, 5195–5216, 2021
https://doi.org/10.5194/acp-21-5195-2021
© Author(s) 2021. This work is distributed under
the Creative Commons Attribution 4.0 License.

How frequent is natural cloud seeding from ice cloud layers
(< −35 ◦C) over Switzerland?
Ulrike Proske, Verena Bessenbacher, Zane Dedekind, Ulrike Lohmann, and David Neubauer
Institute for Atmospheric and Climate Science, ETH Zurich, Zurich, Switzerland

Correspondence: Ulrike Proske (ulrike.proske@env.ethz.ch)

Received: 3 November 2020 – Discussion started: 19 November 2020
Revised: 24 February 2021 – Accepted: 24 February 2021 – Published: 1 April 2021

Abstract. Clouds and cloud feedbacks represent one of the        assumed, 10 %, 11 % or 20 % of the crystals, respectively,
largest uncertainties in climate projections. As the ice phase   could provide seeds after sedimenting 2 km.
influences many key cloud properties and their lifetime, its        The high occurrence frequency of seeding situations and
formation needs to be better understood in order to improve      the survival of the ice crystals indicate that the seeder–feeder
climate and weather prediction models. Ice crystals sedi-        process and natural cloud seeding are widespread phenom-
menting out of a cloud do not sublimate immediately but can      ena over Switzerland. This hints at a large potential for nat-
survive certain distances and eventually fall into a cloud be-   ural cloud seeding to influence cloud properties and thereby
low. This natural cloud seeding can trigger glaciation and has   the Earth’s radiative budget and water cycle, which should
been shown to enhance precipitation formation. However, to       be studied globally. Further investigations of the magnitude
date, an estimate of its occurrence frequency is lacking. In     of the seeding ice crystals’ effect on lower-lying clouds are
this study, we estimate the occurrence frequency of natural      necessary to estimate the contribution of natural cloud seed-
cloud seeding over Switzerland from satellite data and subli-    ing to precipitation.
mation calculations.
   We use the DARDAR (radar lidar) satellite product be-
tween April 2006 and October 2017 to estimate the occur-
rence frequency of multi-layer cloud situations, where a cir-    1   Introduction
rus cloud at T < −35 ◦ C can provide seeds to a lower-lying
feeder cloud. These situations are found to occur in 31 % of     Clouds and cloud feedbacks contribute the largest uncer-
the observations. Of these, 42 % have a cirrus cloud above       tainty to projections of climate sensitivity in global climate
another cloud, separated, while in 58 % the cirrus is part of    models (Cess et al., 1990; Soden and Held, 2006; Williams
a thicker cloud, with a potential for in-cloud seeding. Ver-     and Tselioudis, 2007; Boucher et al., 2013). Cloud micro-
tical distances between the cirrus and the lower-lying cloud     physics, and especially cloud ice/water content, determine
are distributed uniformly between 100 m and 10 km. They          key cloud properties, such as their albedo and lifetime, and
are found to not vary with topography. Seasonally, winter        control precipitation formation (Mülmenstädt et al., 2015).
nights have the most multi-layer cloud occurrences, in 38 %      The representation of the ice phase in clouds is therefore
of the measurements. Additionally, in situ and liquid origin     necessary to estimate the Earth’s radiation budget and its re-
cirrus cloud size modes can be identified according to the       sponse to climate change (Sun and Shine, 1995; Tan et al.,
ice crystal mean effective radius in the DARDAR data. Us-        2016; Matus and L’Ecuyer, 2017; Lohmann and Neubauer,
ing sublimation calculations, we show that in a significant      2018) as well as to improve forecasts of precipitation in nu-
number of cases the seeding ice crystals do not sublimate        merical weather prediction models. Natural cloud seeding
before reaching the lower-lying feeder cloud. Depending on       can be a source of ice crystals in clouds, lead to the glaciation
whether bullet rosette, plate-like or spherical crystals were    of clouds and enhance precipitation. Moreover, the seeder–
                                                                 feeder mechanism has been associated with the enhance-
                                                                 ment of extreme precipitation and flooding (Rössler et al.,

Published by Copernicus Publications on behalf of the European Geosciences Union.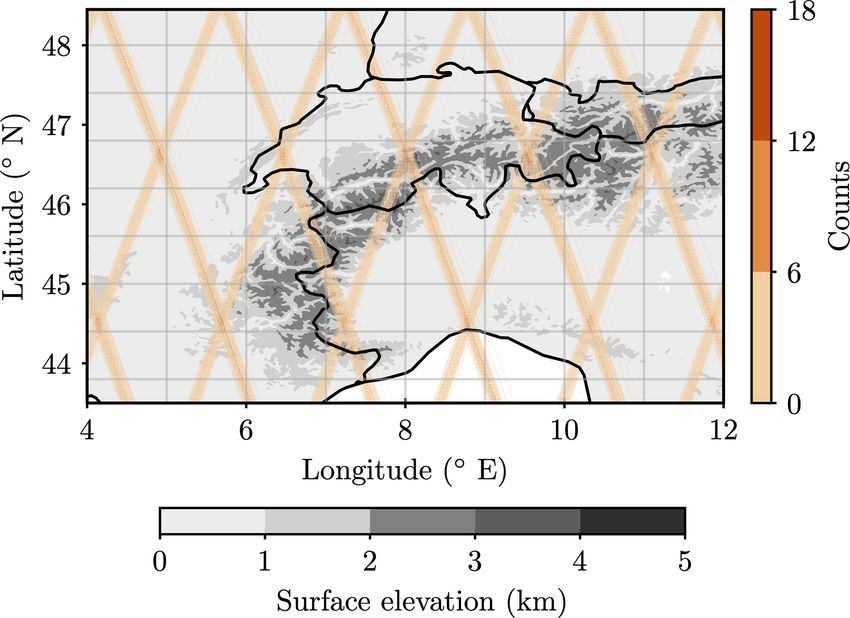
5196                                           U. Proske et al.: How frequent is natural cloud seeding from ice cloud layers?

2014). An understanding of the seeder–feeder mechanism              expense of liquid droplets, when the water vapour saturation
is therefore necessary to improve the representation of the         ratio is subsaturated with respect to water and supersaturated
cloud ice phase in weather and climate models, to improve           with respect to ice; Wegener, 1911; Bergeron, 1935; Find-
weather forecasts of precipitation and ultimately to reduce         eisen, 1938) and can multiply through secondary ice produc-
uncertainty in climate simulations.                                 tion (Korolev and Leisner, 2020, Hallett–Mossop process,
   The seeder–feeder mechanism was originally proposed              Hallett and Mossop, 1974; Mossop and Hallett, 1974, frozen
to explain an observed enhancement of precipitation over            droplet shattering, Lauber et al., 2018 or ice–ice collisional
mountains. In this classical setting, precipitation from an         breakup Sullivan et al., 2018). Thereby, seeding ice crystals
overlying “seeder” cloud falls into an orographic “feeder”          destabilize a cloud, which subsequently could glaciate and/or
cloud. In the lower cloud, the precipitation particles grow         form precipitation. Because of the aforementioned enhance-
by accretion, coalescence or riming, which leads to an en-          ment processes in the ice phase, the seeder–feeder mecha-
hancement of precipitation over the orography (Roe, 2005).          nism with seeding ice crystals is more efficient than the clas-
This classical seeder–feeder mechanism has been observed            sical liquid seeder–feeder mechanism and has been found to
in field studies in various locations (Dore et al., 1999; Purdy     lead to a larger precipitation enhancement (Choularton and
et al., 2005; Hill et al., 2007) and has been reproduced in a       Perry, 1986).
number of idealized modelling studies (e.g. Carruthers and             For natural cloud seeding to take place, the ice crystals’
Choularton, 1983; Robichaud and Austin, 1988).                      survival during the sedimentation through a subsaturated
   Braham (1967) noted the possibility of ice crystals from         layer of air and into the lower cloud layer is crucial. Bra-
cirrus clouds acting as seeds for ice formation in lower-           ham (1967) observed a spectacular case of ice crystals that
lying warmer clouds. In this special case of the seeder–feeder      survived a distance of 5 km in cloud-free air. This demon-
mechanism, the seeding precipitation is specified as ice, but       strated the feasibility of natural cloud seeding (Hitschfeld,
the presence of orography is not a prerequisite for the mecha-      1968; Locatelli et al., 1983). In a first theoretical study, Hall
nism’s occurrence. This natural cloud seeding is the focus of       and Pruppacher (1976) found that “ice particles could sur-
the current study, where hereafter the seeder–feeder mecha-         vive distances of up to 2 km when the relative humidity
nism and natural cloud seeding refer to ice particles falling       with respect to ice was below 70 %”. Natural cloud seed-
from a cirrus cloud into a lower-lying cloud or a lower-lying       ing through sedimenting ice crystals has been observed in
part of the same cloud, which is either liquid, ice or mixed        a multitude of remote sensing and aircraft campaigns (Den-
phase (Fig. 1). In a widened sense, the process of falling          nis, 1954; Hobbs et al., 1980, 1981; Locatelli et al., 1983;
precipitation particles that feed on the hydrometeors in a          Hobbs et al., 2001; Pinto et al., 2001; Fleishauer et al., 2002;
lower part within the same cloud can also be understood as          Ansmann et al., 2008; Creamean et al., 2013) and has been
a seeder–feeder process (in-cloud seeder–feeder mechanism;          studied in mostly idealized model simulations (Rutledge and
Hobbs et al., 1980; see Fig. 1b). This study focuses on cirrus      Hobbs, 1983; Fernández-González et al., 2015; Chen et al.,
clouds as seeding clouds because they can be identified read-       2020), where it has been found to mainly enhance ice and
ily in the DARDAR (radar lidar) satellite data. Of course,          precipitation formation.
other ice-containing clouds such as altocumulus or altostra-           Seifert et al. (2009) and Ansmann et al. (2009) estimated
tus clouds may act as seeding clouds as well and may be the         such an occurrence frequency of natural cloud seeding for
subject of a further study.                                         their lidar field study datasets indirectly when aiming to ex-
   Cirrus clouds, which act as seeder clouds in this study,         clude all seeded clouds. They simply defined all mixed-phase
can form either from freezing of liquid droplets or in situ         clouds that had an ice cloud within 2 km above cloud top as
from homogeneous freezing of solution droplets or heteroge-         a seeded ice cloud. For example, in Leipzig, about 10 % of
neous nucleation. Recent studies have suggested to classify         ice-containing clouds at −20 ◦ C were marked as seeded (ice-
cirrus clouds accordingly, as liquid or in situ origin ice clouds   containing clouds made up 90 % of the observations at that
(Luebke et al., 2013; Krämer et al., 2016; Luebke et al.,           temperature). A more thorough, regional estimate of seeder–
2016; Wernli et al., 2016; Gasparini et al., 2018; Wolf et al.,     feeder occurrence frequency in the Arctic was derived by
2018, 2019). The formation mechanism has been shown to              Vassel et al. (2019). Using radiosonde and radar data from
influence clouds’ microphysical properties (Luebke et al.,          Svalbard, they deduced the frequency of multi-layer clouds
2016; Wolf et al., 2018, 2019).                                     as 29 %. Calculating the sublimation height of hexagonal
   Seeding ice crystals can have a large influence on cloud         plate ice crystals with a radius of 400 µm (radius meaning
properties, because in the atmosphere, at temperatures              here: half of the maximum span across the hexagonal face),
warmer than −38 ◦ C, ice can only be formed via heteroge-           26 % of observations contained a seeding case.
neous nucleation on ice-nucleating particles (e.g. Kanji et al.,       Such field studies have begun to elucidate the frequency
2017, and references therein). Once ice particles are formed        and thereby the importance of natural cloud seeding region-
within the cloud or enter the cloud from outside, they grow         ally, but a thorough estimate is still lacking. With global cov-
by riming or vapour deposition (rapidly via the Wegener–            erage and sensors increasingly capable of resolving clouds
Bergeron–Findeisen process, where ice crystals grow at the          and their vertical distribution, satellite data offer an opportu-

Atmos. Chem. Phys., 21, 5195–5216, 2021                                               https://doi.org/10.5194/acp-21-5195-2021
U. Proske et al.: How frequent is natural cloud seeding from ice cloud layers? 5197
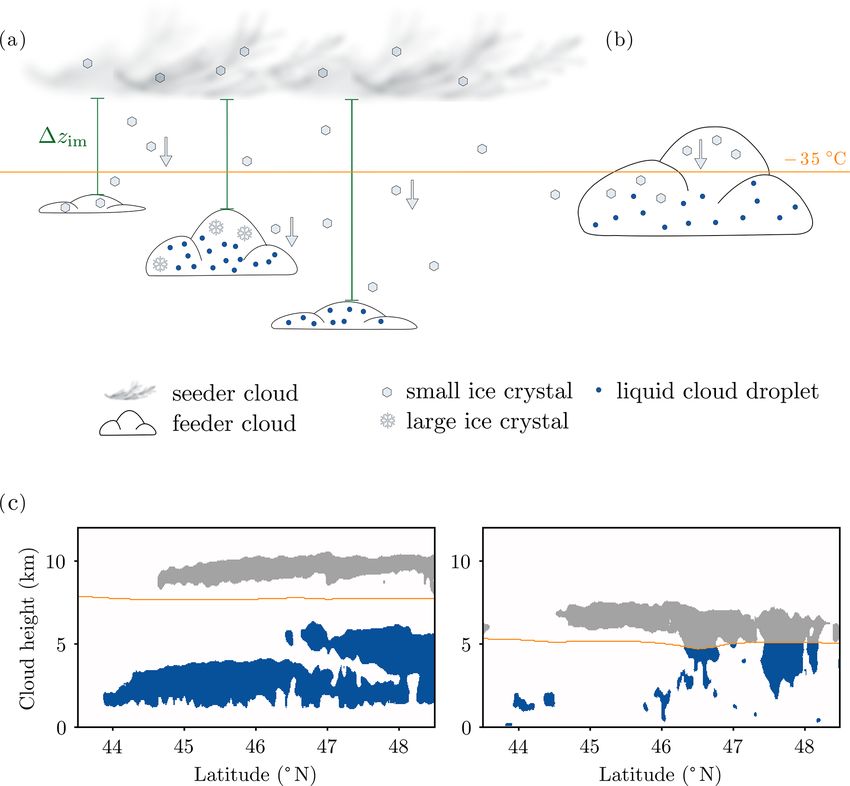
Figure 1. Sketch of the two seeder–feeder situations observed in this study. The orange lines depict the −35 ◦ C isotherm; 1zim is the distance
between the lowest base of the cirrus cloud and the highest top of the cloud below. (a) Classical external seeder–feeder situation: a cirrus
cloud (T < −35 ◦ C) is detected at least 100 m above a cloud at T > −35 ◦ C (1zim > 100 m). The latter cloud is termed a “mixed-phase”
cloud for simplicity but could also be liquid or ice phase. (b) In-cloud seeder–feeder situation: the algorithm detects the cloud part above
the −35 ◦ C isotherm as a cirrus cloud and the cloud part below as a mixed-phase cloud (1zim < 100 m). Ice crystal shapes are depicted
according to Libbrecht (2005, Fig. 2). (c) Seeder–feeder situations as seen in the DARDAR data. Cirrus clouds above the −35 ◦ C isotherm
are depicted in grey; clouds below in blue. Left: exemplary plot of the classical external seeder–feeder situation (data from 29 May 2007);
right: exemplary plot of only a mixed-phase or a cirrus cloud present (latitudes equatorwards of 46◦ N) and the in-cloud seeder–feeder
situation (polewards of 46◦ N, data from 3 December 2010).
nity to fill the gap from single observations to whole-Earth DARDAR satellite product, our analysis and the sublima-
long-time observations to derive such a frequency estimate. tion calculations are described. In Sect. 3.1, findings from the
Multi-layer clouds can be investigated using CloudSat and analysis of the DARDAR data are presented and discussed,
Cloud-Aerosol Lidar and Infrared Pathfinder Satellite Obser- followed by the results from the sublimation calculations in
vation (CALIPSO) data (e.g. Wang et al., 2000; Mace et al., Sect. 3.2. Conclusions and an outlook are given in Sect. 4.
2009; Das et al., 2017; Matus and L’Ecuyer, 2017). To pro-
vide an estimate of the natural cloud seeding frequency, sub-
limation calculations need to be combined with the seeder– 2 Methods and data
feeder situation/multi-layer cloud occurrence frequencies as
done by Vassel et al. (2019). 2.1 Satellite data
In this study, we employ the DARDAR satellite product
The DARDAR-CLOUD satellite data product used in this
that is based on CloudSat and CALIPSO data (Delanoë and
study is based on radar and lidar data from the CloudSat and
Hogan, 2008, 2010b; Ceccaldi et al., 2013) and combine it
CALIPSO satellites. The satellites were launched jointly on
with sublimation calculations to derive a frequency estimate
28 April 2006 into the A-Train or afternoon constellation, a
of seeder–feeder situations over Switzerland. Note that we
coordinated group of satellites in a Sun-synchronous polar
consider as seeder clouds only cirrus clouds to ensure that
orbit (Stephens et al., 2002). CloudSat has a cloud profiling
the they contain ice. In the following section (Sect. 2), the
radar on-board that senses cloud particles and detects precip-
https://doi.org/10.5194/acp-21-5195-2021 Atmos. Chem. Phys., 21, 5195–5216, 2021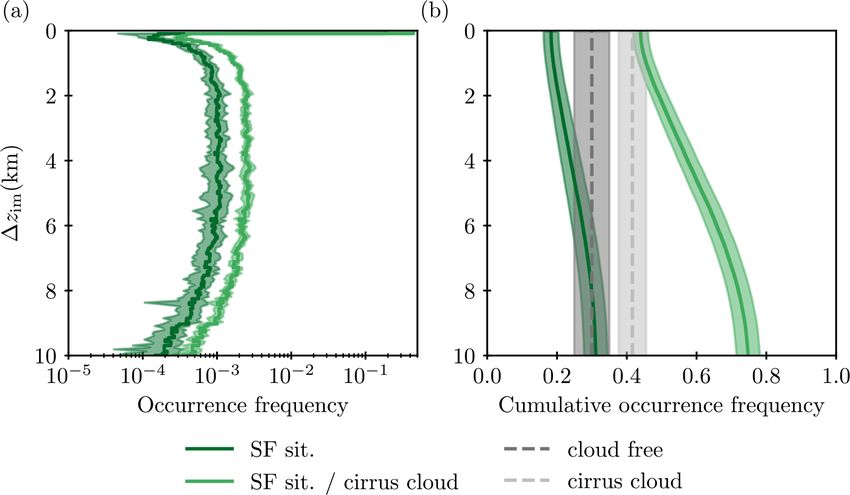
5198                                         U. Proske et al.: How frequent is natural cloud seeding from ice cloud layers?

itation (Stephens et al., 2008). CALIPSO carries the Cloud-
Aerosol Lidar with Orthogonal Polarization (CALIOP) and
two passive sensors, a visible camera and a three-channel
infrared radiometer (Winker et al., 2010). The two satel-
lites are designed for their data to be combined: the lidar
on CALIPSO is able to identify the thin upper layers of cir-
rus clouds that the radar on CloudSat misses (Winker et al.,
2010), while the latter is able to look through thick clouds
where the lidar beam is attenuated. Because of their joint
operations and almost simultaneous time measurements, the
two satellites provide novel ways to look at precipitation,
aerosols and the vertical distribution of clouds (Gao et al.,
2014; Hong and Liu, 2015; Naud et al., 2015; Stephens et al.,
2018; Witkowski et al., 2018).
   From the CloudSat and CALIPSO data, Delanoë and
Hogan (2010b) developed the DARDAR satellite product              Figure 2. Geographical distribution of the satellite observations:
that provides cloud classification and ice cloud properties.      number of tracks through each point within the study domain (43.5
It was developed further into a DARDAR v2 by Ceccaldi             to 48.5◦ N and 4 to 12◦ E ) over the whole time period analysed in
et al. (2013). DARDAR data are retrieved at 60 m vertical         this study (2006–2017).
resolution up to an altitude of 25 km and a horizontal reso-
lution of 1.4 km (Delanoë and Hogan, 2010a). Next to other
cloud properties, it contains a classification of the layer at    All variables were derived from a cloud mask, where DAR-
each grid point with categories like clear sky, ice, liquid or    DAR categories 1, 2, 3 and 4 (ice, ice plus supercooled, liq-
supercooled clouds, aerosols, etc. as well as the retrieved ef-   uid (warm and supercooled)) were combined to simply sig-
fective ice crystal radius.                                       nify the presence of cloud layers. This cloud mask was found
   In this study, DARDAR-CLOUD v2.1.1 data (as de-                to be noisy and was therefore filtered (using a median filter
scribed in Ceccaldi et al., 2013) from April 2006 through         over the surrounding 7 × 7 point plane, in altitude and hori-
October 2017 were used. Due to CloudSat’s battery prob-           zontally along the track). For icebase, 1zim and reff the cloud
lems, there are no data between April 2011 and April 2012         mask were combined with a temperature mask to differenti-
and merely daylight-only operations mode data thereafter          ate between mixed-phase and cirrus clouds. In this study, cir-
(Stephens et al., 2008; Witkowski et al., 2018; CloudSat          rus clouds are defined as clouds at temperatures lower than
radar status, 2020).                                              −35 ◦ C, and mixed-phase clouds are defined as all clouds
                                                                  with temperatures warmer than −35 ◦ C. Depending on their
Analysis method                                                   size, liquid cloud droplets supercool to −35 to −40 ◦ C before
                                                                  freezing homogeneously (e.g. Pruppacher and Klett, 2010;
The study domain surrounds Switzerland (43.5 to 48.5◦ N           Murray et al., 2010; Herbert et al., 2015; Kanji et al., 2017).
and 4 to 12◦ E) and contains most of the Alps. Figure 2           However, in tests preceding this study, a threshold of −38
shows the geographic distribution of all satellite tracks that    instead of −35 ◦ C proved to have no evident impact on the
go through the chosen domain. In order to evaluate the            results. Note that clouds termed “mixed-phase” could in prin-
frequency of seeder–feeder situations four variables were         ciple be in the liquid or ice phases in reality, depending on
created:                                                          their history and the presence of ice-nucleating particles (see
                                                                  Fig. 1a). Similarly, in this study, we denote all ice clouds
 frac_cov (–)    The fraction of sky covered with a
                                                                  at temperatures colder than −35 ◦ C as cirrus clouds, which
                 specific combination of cloud top and
                                                                  could be isolated ice clouds or the upper parts of mixed-phase
                 cloud base temperatures.
                                                                  clouds.
 icebase (m)     The height (altitude above sea level) of
                                                                     The combined cloud and temperature masks were applied
                 the lowest cloud grid point with T <
                                                                  to the altitude and effective ice crystal variable in the DAR-
                 −35 ◦ C (lowest base of a cirrus cloud).
                                                                  DAR data to find the values at the lowest cirrus cloud base
 1zim (m)        The distance between the lowest cir-
                                                                  (for icebase, reff and 1zim ) and at the highest mixed-phase
                 rus cloud base and the highest top of
                                                                  cloud top (for 1zim ). Prior to this, the effective ice crystal
                 the cloud below (in the following called
                                                                  radius was also filtered for consistency. As a filter for the
                 mixed-phase cloud).
                                                                  effective radius, the vertical median with an extent of four
 reff (µm)       The effective radius of ice crystals at
                                                                  pixels up and four pixels down from the one in question was
                 the lowest cirrus cloud base.
                                                                  applied, using only those pixels where the unfiltered cloud
                                                                  mask detected a cloud. For 1zim , the altitude of the highest

Atmos. Chem. Phys., 21, 5195–5216, 2021                                             https://doi.org/10.5194/acp-21-5195-2021
U. Proske et al.: How frequent is natural cloud seeding from ice cloud layers? 5199
mixed-phase cloud top was subtracted from the altitude of the Table 1. Variables used in the sublimation calculations as described
lowest cirrus cloud base. Finally, the dataset was saved on a in the text. For a comprehensive list, see also Table A1.
grid with a resolution of 0.005◦ ×0.005◦ with no quality loss
compared to the original DARDAR data. During regridding, Symbol Long name Units
areas containing no satellite tracks were set to missing data C capacitance of the ice particle m
to be able to derive the total number of observations later on. Dv diffusivity of water vapour in air m2 s−1
G growth factor kg m−1 s−1
2.2 Ice crystal sublimation calculations m mass of the ice particle kg
r effective radius of the ice particle m
Environmental parameters such as the air density, air tem- ρair air density kg m−3
perature and the relative humidity also affect the ice crystal s supersaturation with respect to ice –
sublimation rate and fall velocity. For these parameters, Hall v fall speed of the ice particle m s−1
and Pruppacher (1976) used the NACA (National Advisory z height of the ice particle m
Committee for Aeronautics) standard profile, while Vassel
(2018) and Vassel et al. (2019) used radiosonde profiles that
were averaged for each subsaturated layer in their calcula- For a sphere, the capacitance of the ice particle is simply
tions. Since the environmental conditions are primary deter- equal to the radius at time step i (Lohmann et al., 2016,
minants of the sublimation height, we chose the most de- p. 240):
tailed information available. Relative humidity and temper-
C = r[i]. (2)
ature were therefore taken from ERA5 reanalysis data from
the European Centre for Medium-Range Weather Forecasts Following Lamb and Verlinde (2011), the change in mass is
(ECMWF; Hersbach et al., 2020). From the DARDAR data
icebase, 1zim and reff were used. Prior to calculations, the dm = 4π C[i]ρi G[i]s[i]f [i]dt, (3)
ERA5 data were regridded vertically to match the DARDAR
60 m resolution; horizontally, points closest to the DARDAR which was used to time step mass and radius of the ice crys-
points were chosen. As only hourly ERA5 data were avail- tal:
able, data from the hour closest to the entry time of the satel-
m[i + 1] = m[i] + dm (4)
lites into the study domain were used. The sublimation height s
was calculated individually for every point in every available 3m[i + 1]
track file where there was at least one cirrus cloud above a r[i + 1] = 3 , (5)
4ρi π
mixed-phase cloud present. The algorithm is based on work
by Vassel (2018). It was applied to three different shapes using the ventilation factor f determined from Eq. (A5). The
of ice crystals, namely spheres, hexagonal plates and bul- fall speed is calculated following Seifert and Beheng (2006),
let rosettes. These three were chosen to sample ice crystal with coefficients given in Table 2, and used to time step the
properties, e.g. to span the possible range of terminal veloc- height of the particle:
ities. In particular, bullet rosettes have been found to be one γ
of the most abundant shapes in cirrus clouds (Lawson et al., β ρair,0
v[i + 1] = αm[i + 1] (6)
2019; Heymsfield and Iaquinta, 2000). And ice crystals have ρair
been found to evolve into spherical shape while sublimating z[i + 1] = z[i] − v[i + 1] · dt. (7)
(Nelson, 1998), which makes these ideal shapes to use. Ad-
ditionally, the computations were run for plate-like ice crys- Equations used to generate the values needed in the above
tals, which experience intermediate drag and can also occur equations are given in Appendix A, with additional variables
in cirrus clouds (Libbrecht, 2005), to include an ice crystal and constants in Tables A1 and A2.
type used in Vassel et al. (2019). The equations shown refer In between cloud layers, small up- or downdrafts can be
to the spherical particle. Information for the computations us- expected. For lack of reliable data on such small scales, the
ing hexagonal plates and bullet rosettes is given in Tables A3 updraft velocity was not considered in the sublimation calcu-
and A4 in Appendix A. lations. Also, radiative heat transfer to and from the ice par-
The sublimation algorithm was applied in 0.01 s time steps ticles was ignored since Hall and Pruppacher (1976) found
(dt) as follows, where the initial height of the ice particle that it “is only of secondary importance in determining [an
was icebase. The variables and constants used are given in ice particle’s] survival distance in subsaturated air”. While
Tables 1 and 2. The mass of the ice crystal was calculated the calculations are based on a scheme developed by Vassel
from the radius: (2018), here additional factors such as the ventilation fac-
tor and the temperature dependency in the dynamic viscosity
4 were added. Furthermore, Vassel et al. (2019) used mass–
m[0] = r[0]3 ρi π. (1) diameter relations and fall speed derived in Mitchell (1996),
3
https://doi.org/10.5194/acp-21-5195-2021 Atmos. Chem. Phys., 21, 5195–5216, 20215200 U. Proske et al.: How frequent is natural cloud seeding from ice cloud layers?
Table 2. Constants used in the sublimation calculations for a sphere as described in the text. For a comprehensive list, see also Table A2.
Note that the parameterization for the velocity–mass relation for cloud droplets from Seifert and Beheng (2006) is used for spherical ice
crystals in this study. Constants that differ for a hexagonal plate or rosette crystal are given in Tables A4 and A6.
Symbol Long name Value
α coefficient for the velocity–mass relation for cloud droplets (Seifert and Beheng, 2006, Table 1) 3.75 × 10⁵ m s−1 kg−β
β coefficient for the velocity–mass relation for cloud droplets (Seifert and Beheng, 2006, Table 1) 2/3
γ coefficient for the velocity–mass relation for cloud droplets (Seifert and Beheng, 2006, Table 1) 1
ρair,0 reference density of air 1.225 kg m−3
ρi density of ice 0.92 × 10³ kg m−3
which in this study are taken from Pruppacher and Klett are taken into account, in 75 % of these measurements also a
(2010), Heymsfield and Iaquinta (2000) and Seifert and Be- mixed-phase cloud below them is detected.
heng (2006) due to the differing ice crystal types used here. In 44 % of the cases with a detected cirrus cloud (18 %
The time-stepping script was set to run for a day but was in total), 1zim is smaller than 100 m. This may either be the
stopped when the particle had reached Earth’s surface or sub- case when the cirrus and the mixed-phase cloud are truly sep-
limated (zero mass or a radius less than 10−8 m). The subli- arated by a small distance, or when the two differently classi-
mation height was returned and compared to the height of fied layers are actually part of the same cloud. From the con-
the mixed-phase cloud top, which was derived from icebase struction of the classification algorithm, the latter would be
and 1zim in the DARDAR data. When the sublimation height the case when the −35 ◦ C isotherm intersects the cloud. This
was lower than the height of the mixed-phase cloud top, the case is illustrated in Fig. 1b. In contrast to Mace et al. (2009)
ice crystals at that grid point were marked as seeding. and Vassel et al. (2019), our algorithm does not require a
These calculations present a conservative estimate. In real- cloud-free layer in between the mixed-phase and the cirrus
ity, ice crystals have a size distribution. The large ice crystals cloud, so we also observe a potential for in-cloud seeding.
within a distribution survive longer sedimentation distances However, clouds connected by sedimenting ice would also
than the ones with the effective radius, for which the survival be seen as a cirrus cloud with a very small or no distance to
is calculated. Also, the effective radius of ice crystals is un- the next mixed-phase cloud in our analysis. Ansmann et al.
derestimated in DARDAR v2 compared to the newer version (2009) observed ice virga between the seeder and the feeder
(v3, which is not available yet) by 5 % to as much as 40 % cloud and Mace et al. (2009) also mentioned this as a cause
(Cazenave et al., 2019). of misclassification in their study. Of course, in cases where
the −35 ◦ C isotherm lies within the cirrus cloud, there could
be another mixed-phase cloud underneath. The distance to
3 Results and discussion this second cloud does not appear in our analysis.
The other half of the cases (1zim > 100 m) represents
3.1 DARDAR data the classical external seeder–feeder situation, with a cirrus
cloud clearly separated from a mixed-phase cloud below (see
3.1.1 Distribution of distances between ice and Fig. 1a). The 1zim are distributed equally between 2000 and
mixed-phase cloud layer 6000 m, increase for smaller and decrease for larger 1zim .
The smaller frequencies at 1zim < 2000 m are due to the few
Figure 3 shows the average frequency of 1zim , the distance possibilities for both cirrus and mixed-phase cloud to be lo-
between the cirrus and mixed-phase cloud, within the DAR- cated close to the −35 ◦ C isotherm. Because the cirrus cloud
DAR dataset (as described in Sect. “Analysis method”, any frequency decreases for large heights, the 1zim occurrence
cloud at temperatures > −35 ◦ C is termed “mixed-phase” in frequency decreases as well for 1zim > 6000 m. Generally
this study). It can be understood as the average distribution of speaking, 1zim increases with increasing upper cloud height
1zim within a unit area. Overall, 69 % of all measurements (see Fig. B2).
do not show a cirrus–mixed-phase cloud distance at all. In In this distribution and in the following analysis, the ef-
those cases, either clouds of only one category were present fect of vertical wind shear of the horizontal wind cannot be
or none at all (30 % of the measurements are cloud free). In taken into account, because the satellite retrieval only obtains
total, 31 % of the measurements contain both a cirrus and instantaneous profiles, without any information on their tem-
a mixed-phase cloud simultaneously. This is the percentage poral development. In the time that ice crystals need to sed-
of cases in which a seeding of the lower cloud by ice crys- iment distances of a few kilometres, undoubtedly the clouds
tals falling from the ice cloud above is possible. Tailoring in question move relative to each other when wind shear is
this result to the sedimentation of ice crystals from a cirrus present. However, this movement can go in both ways, either
cloud, when only the measurements that detect a cirrus cloud
Atmos. Chem. Phys., 21, 5195–5216, 2021 https://doi.org/10.5194/acp-21-5195-2021U. Proske et al.: How frequent is natural cloud seeding from ice cloud layers? 5201
tween cirrus and mixed-phase clouds in Mace et al. (2009),
one might use the relative occurrence frequency of low with
high clouds and middle with high clouds from Mace et al.
(2009) (about 70 % and 10 %), relative to their overall multi-
layer occurrence frequency of 24 %. Their resulting absolute
high with low or mid-cloud layer occurrence frequency is
then approximately 20 %. The result for two cloud cases in
this study of 13 % is smaller than the value derived by Mace
et al. (2009), although they used even more restrictive con-
ditions for their classification of multiple layers, requiring
almost 1 km of cloud-free space in between them. As men-
tioned before, the in-cloud seeder–feeder situations provide
no information on the occurrence of mixed-phase layers be-
Figure 3. (a) Occurrence frequency of seeder–feeder situations (SF low, hiding possible two-cloud cases. Cirrus clouds in the
sit.) with respective 1zim as a fraction of measurements (dark tropical tropopause layer and clouds close to the surface are
green) or cirrus cloud measurements (light green). (b) Cumulative
known to be missed by the radar and lidar on CloudSat and
occurrence frequency. For 1zim , a vertical resolution of 60 m is
used. For comparison, the fractions of measurements with at least
CALIPSO (Chan and Comiso, 2011; Liu et al., 2015; Krämer
one cirrus cloud (light grey) and with a cloud-free atmosphere (dark et al., 2020), but these are not relevant for this study.
grey) are given. Here and in the following, data from all tracks in
the study time (2006 to 2017) and within the study domain were 3.1.2 Effect of topography
used (2210 satellite tracks). The total number of measurements is
853 833, with 267 354 measuring 1zim and 355 331 measuring cir-
rus clouds. The shaded areas visualize the standard deviation of
A geographical difference in cloud cover could be expected
interannual variability. Note that 1zim = 0 m is at the base of the from the differing impacts that weather regimes have on dif-
lowest cirrus cloud layer with T < −35 ◦ C. ferent European regions in general (Pasquier et al., 2019;
Grams et al., 2017). The study domain contains locations
with a large range of surface altitudes (see Fig. 2). One could
imagine the 1zim to be smaller in the Alps than over the
removing or creating a multi-layer cloud situation. On aver-
Swiss Plateau, simply because of a thinner troposphere over
age, these two effects are expected to cancel out, so that the
orography. Also the orographic forcing would be expected to
results with and without considering wind shear should be
increase cloud cover. For an analysis of topographical influ-
similar.
ence, we split the dataset by surface altitudes above or be-
Our results for multi-layer cloud occurrence frequency,
low 1 km and analyse the distribution of 1zim , shown in Ta-
13 % (1zim > 100 m), are smaller than the ones given in
ble 3. The difference in the fraction of distances larger than
the following literature. In their analysis of CALIPSO and
100 m between locations with a topography higher or lower
CloudSat data, Mace et al. (2009) estimated the global oc-
than 1 km is less than 1 %. The distribution of total 1zim be-
currence of multiple layers to be 24 %. Wang et al. (2000)
tween mountainous terrain and flat land reproduces the dis-
derived an estimate of 42 % from a radiosonde dataset. Of
tribution of measurements (about 30 % are taken over orog-
course the domain around Switzerland in this study is not
raphy higher than 1000 m and about 70 % over terrain lower
expected to reproduce the global average, but Fig. 17a in
than 1000 m; not shown). Contrary to what we expected, we
Mace et al. (2009) and Fig. 5 in Wang et al. (2000) show
find no topographical effect in the distribution of 1zim (see
average frequencies for Switzerland that are similar to the
also Fig. B1).
global average frequency. Using CloudSat and CALIPSO
data as well, Matus and L’Ecuyer (2017) found an average
multi-layer cloud fraction of about 25 % for the midlatitudes 3.1.3 Effect of season and time of day
of Switzerland. The layers derived from radiosonde data by
Wang et al. (2000) are much thinner than the ones found with Table 3 also contains the results of the seasonal analysis of
remote sensing, possibly because large sedimenting particles 1zim . Winter measurements have more multi-layer clouds
cause multiple thin layers to be identified as one large layer according to our definition than summer measurements. The
by the radar (Mace et al., 2009). One might therefore expect relative increase of the fractions of 1zim is similar for the
that the results from this current satellite study are closer to smaller (1zim < 100 m) and the larger distances (1zim >
the ones from Mace et al. (2009) and Matus and L’Ecuyer 100 m). In particular, winter nights have the highest fraction
(2017). Most importantly, the present study only looks at of multiple layer cloud measurements. Multiple cloud layers
multiple layer occurrence between cirrus and mixed-phase are about 23 % more frequent in winter nights than in sum-
clouds, which is lower than the total multi-layer occurrence mer nights, mostly due to an increase in 1zim larger than
frequency. As a proxy for the multiple layer occurrence be- 100 m. Other than the increase in 1zim during the night in
https://doi.org/10.5194/acp-21-5195-2021 Atmos. Chem. Phys., 21, 5195–5216, 20215202 U. Proske et al.: How frequent is natural cloud seeding from ice cloud layers?
winter, there are no substantial differences in frequencies be-
tween day and night within a seasonal category.
The simplest explanation for the increased frequency of
multi-layer clouds in winter measurements is simply an in-
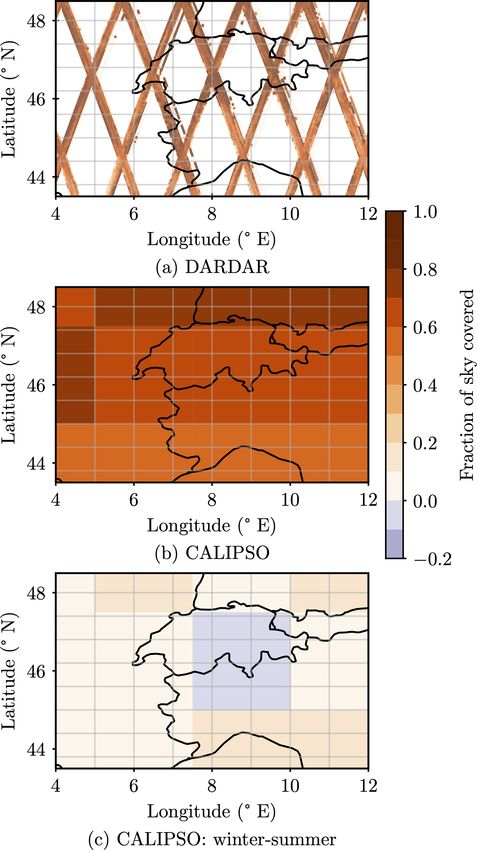
creased cloud cover in winter. To see whether this is a robust
finding, it was tested with the CALIPSO – GCM Oriented
Cloud Calipso Product (GOCCP) dataset (Chepfer et al.,
2010, 2013). With a comparison of frac_cov from DARDAR
vs. CALIPSO cloud cover data (Fig. C1), the two datasets
were found to mostly agree. Therefore, the CALIPSO dataset
can be used to validate the hypothesis of an increased cloud
cover in winter. Indeed, in CALIPSO, total winter cloud
cover is higher over almost the whole domain (Fig. C1c).
The increase of cloud cover in winter is strongest for low
and high clouds (low clouds: pressure > 680 hPa, height
< 3.2 km, high clouds: pressure < 400 hPa, height > 6.5 km
in the CALIPSO data; not shown). This confirms the find-
ing that in winter we see an increase in both small and large
1zim . In addition, icebase is lower in winter (not shown), in
particular for 1zim < 100 m, which also increases the num-
ber of 1zim .
3.1.4 Ice crystal effective radius and cirrus cloud origin
The DARDAR dataset provides the mean effective ice crys-
tal radius, which we use in our sublimation calculations.
In Fig. 4, the size distribution is displayed by the ice crys-
tals’ occurrence height, namely the lowest cirrus cloud base
heights (icebase). The ice crystal size range, between 25 and
60 µm in radius, agrees with the one found in another DAR-
DAR study by Hong and Liu (2015). It is also within the
range from 1 to 100 µm that Krämer et al. (2009, 2020) find
for cirrus clouds in aircraft campaigns.
There is a visible trend for smaller ice crystals at higher
altitudes. This again agrees with Hong and Liu (2015) and
Heymsfield et al. (2013), who find that ice crystal size de-
creases with decreasing temperature. An interesting feature
in Fig. 4a is that while the shape of the distribution is rather
symmetrical around this trend, large ice crystals abruptly
stop appearing at heights larger than about 9.5 km. This hints Figure 4. Distribution of reff. (a) For all multi-layer clouds.
(b) Only those data points with a distance < 100 m to the next
at two modes within the size distribution. These have been
mixed-phase cloud top. (c) Only those data points with a distance
found in earlier studies and have lately been linked to the dif-
> 100 m to the next mixed-phase cloud top.
ferent origins of cirrus clouds by Luebke et al. (2013), Lue-
bke et al. (2016), Krämer et al. (2016), Wernli et al. (2016),
Gasparini et al. (2018) and Wolf et al. (2018, 2019). Liquid
origin clouds form from supercooled water droplets which tal size, with both being larger for liquid origin cirrus clouds
are uplifted to the cirrus temperature range. They freeze ei- (Luebke et al., 2016).
ther heterogeneously at warmer temperatures or predomi- We split the dataset into one part with 1zim > 100 m and
nantly homogeneously at temperatures around −35 ◦ C. In one with 1zim < 100 m as a proxy for the two cloud origins:
the cirrus temperature range, cirrus clouds can also form in situ origin cirrus have large distances to the next under-
by homogeneous nucleation of solution droplets or hetero- lying mixed-phase cloud, while liquid origin cirrus appear
geneous nucleation on ice-nucleating particles. These cirrus close to the −35 ◦ C isotherm. This separation indeed pro-
clouds are termed “in situ origin cirrus clouds”. The two duces two different modes, as can be seen in Fig. 4b and
types mostly differ in their ice water content and the ice crys- c. Figure 4b corresponds to liquid origin cirrus clouds. It
Atmos. Chem. Phys., 21, 5195–5216, 2021 https://doi.org/10.5194/acp-21-5195-2021U. Proske et al.: How frequent is natural cloud seeding from ice cloud layers? 5203
Table 3. 1zim seasonality: fraction (%) of 1zim smaller than 100 m and larger than 100 m in all measurements with the specified surface
height, for summer vs. winter and day vs. night (Julian days ≥ 106 and < 289 are summer, hours ≥ 6 and < 18 are days). In total, 31 % of
the measurements contain both a cirrus and a mixed-phase cloud. 1zim values up to 12 km in length were evaluated.
Season Time of day Whole domain Surface < 1 km Surface > 1 km
1zim 1zim 1zim 1zim 1zim 1zim
< 100 m > 100 m < 100 m > 100 m < 100 m > 100 m
All 18 13 18 13 19 13
All Day 18 13 18 13 19 13
Night 18 14 18 14 18 14
All 17 11 16 12 17 12
Summer Day 17 11 16 12 17 12
Night 16 12 16 12 17 12
All 21 15 21 14 21 15
Winter Day 21 13 20 14 21 14
Night 21 17 21 17 21 17
displays larger ice crystals, from ≈ 35 to ≈ 90 µm at cirrus the −35 ◦ C isotherm hardly ever occurs. Wernli et al. (2016),
cloud base heights from 4500 to 9500 m, with an abrupt de- who investigated the frequency of the formation pathways in
crease in occurrence frequency at cirrus cloud base heights a trajectory-based analysis, noted that ice crystal sedimen-
higher than 9500 m. The decrease at the maximum cirrus tation and cloud turbulence could “potentially alter the lo-
cloud base height is associated with 1zim < 100 m (see cal cirrus characteristics and “confuse” the simple catego-
Fig. B2). The in situ cirrus clouds in Fig. 4c display smaller rization”. However, the distinctively different ice crystal size
crystals, from ≈ 30 to ≈ 60 µm, over a larger cirrus cloud distributions for the two modes in Fig. 4b and c suggest that
height range, from roughly 6 to 13 km. Here, the trend of liquid origin clouds are not altered by sedimentation so much
smaller ice crystals at larger cirrus cloud heights is obvious. that they are confused for in situ clouds. Instead, the data sug-
Figure 4 confirms the distinction between liquid origin and in gest that liquid origin clouds are hardly ever lifted entirely
situ cirrus clouds as proposed, e.g. by Krämer et al. (2016). It above the −35 ◦ C isotherm, which is likely because of their
also confirms the finding from Luebke et al. (2016) that liq- large vertical extent.
uid origin cirrus clouds are composed of larger ice crystals. In a broader context, the results in Fig. 4 show that satellite
There are a few caveats to this result. First, by the con- data, in particular the DARDAR dataset, are valid means to
struction of the classification algorithm, in situ cirrus clouds explore the classification of cirrus clouds into liquid and in
are sampled for the ice crystal radius at their base, while liq- situ origin further, as it has been called for by Wolf et al.
uid origin clouds are sampled in the interior. However, this (2019).
difference is expected to have the opposite effect of what we Note that the ice crystal radii, the cirrus cloud base heights
observed (larger ice crystals for liquid origin clouds). At the and the 1zim values span a wide range of values (see Figs. 3
cloud bases, the ice crystals are expected to be larger than and 4). Therefore, sublimation calculations needed to be ap-
in their core (Miloshevich and Heymsfield, 1997; Heyms- plied to each instance individually, as detailed in the next
field and Iaquinta, 2000), simply because of larger parti- section.
cles sedimenting further down within a cloud. Secondly, the
classification scheme only has liquid origin clouds in the 3.2 Sublimation between cloud layers
1zim < 100 m part, while liquid origin clouds that have been
uplifted entirely to heights above the −35 ◦ C isotherm are As described in Sect. 2.2, the sublimation calculation was
present in the second, in situ origin cirrus part of the dataset applied to each grid point within the DARDAR data that
(1zim > 100 m), if such a lifting occurs. This erroneous clas- had a cirrus cloud present above a mixed-phase cloud layer,
sification has already been noted by Gasparini et al. (2018). using DARDAR and ERA5 data as input. The sublimation
However, Fig. 4c displays only one mode, missing any signal height of the ice crystals was calculated three times, assum-
of the mode present in the 1zim < 100 m part of the dataset ing spherical ice crystals, plates and bullet rosettes. If the
(see Fig. 4b). This suggests that the influence of the liquid sublimation height was lower than the mixed-phase cloud
origin on the microphysical properties of the cirrus clouds is top, the case was marked as a seeder–feeder situation.
lost once the clouds are lifted, for example, because the large
ice crystals sediment out, or that lifting of entire clouds above
https://doi.org/10.5194/acp-21-5195-2021 Atmos. Chem. Phys., 21, 5195–5216, 20215204 U. Proske et al.: How frequent is natural cloud seeding from ice cloud layers?
Figure 5. Environmental conditions at cirrus cloud base. Absolute frequency of temperature as a function of relative humidity with respect
to ice at cirrus cloud bases with 1zim > 100 m and (a) where spherical ice crystals survive the sedimentation and seed the lower cloud,
(b) where spherical ice crystals sublimate before reaching the mixed-phase cloud. The light blue line depicts saturation with respect to water.
Absolute frequency of effective ice crystal radius at cirrus cloud base as a function of cirrus cloud height with 1zim > 100 m and (c) where
spherical ice crystals survive the sedimentation and seed the lower cloud, (d) where spherical ice crystals sublimate before reaching the
mixed-phase cloud. The sum of panels (c) and (d) is displayed in Fig. 4c. For improved readability, the colour-bar label for bin 1 is not
shown.
3.2.1 Variation of survival with environmental not change substantially. However, the relative humidity vari-
parameters ations over the distances travelled by ice crystals in our cal-
culations can exceed 5 % substantially.
Figure 5c shows that ice crystals do not survive the fall
For the evaluation of the survival chance, only cases with
from cirrus cloud base heights above 11 km. We attribute this
1zim > 100 m were taken into account. Distances smaller
to smaller ice crystals at these colder temperatures and to the
than 100 m represent the in-cloud seeder–feeder mechanism,
fact that high cirrus cloud bases correspond to large distances
where ice crystals fall through saturated or supersaturated
to lower-lying mixed-phase clouds that ice crystals are less
cloudy air only before interacting with other hydrometeors.
likely to survive. This also explains why ice crystals starting
Comparing Fig. 5a and b, one can see the effect of tem-
their sedimentation at colder temperatures sublimate more
perature and relative humidity: ice crystals only reach the
often before reaching a lower cloud than those sedimenting
lower cloud if RHi > 90 %. Only those starting at temper-
from warmer cloud bases, as the temperature limit of −65 ◦ C
atures warmer than −65 ◦ C seed. At lower temperatures, the
corresponds to the height limit of 11 km (see Fig. 5). Both
ice crystals sublimate, even if the air was supersaturated at
Hall and Pruppacher (1976) and Vassel et al. (2019) identi-
the start of the sedimentation. Note that due to data storage
fied the ice crystal size as important determinant for ice crys-
constraints, we can only show the impact of the temperature
tal survival. Here, we find that ice crystals with radii smaller
and relative humidity at the starting cirrus cloud base height
than 30 µm usually do not survive the sedimentation. On the
on the falling ice crystals. But height-resolved ERA5 data
other hand, also larger ice crystal sizes, above 50 µm, do not
of temperature and relative humidity were used for the cal-
guarantee a successful seeding. Note that we only evaluate
culations. These starting values can be seen as proxies for
the mean ice crystal size is used in this study so that the large
the values during sedimentation, but for large sedimentation
spread which occurs in ice crystal size distributions is not
distances of up to about 5 km, the starting values are not rep-
represented.
resentative. Vassel et al. (2019) conducted a sensitivity study
For the analysis of both environmental parameters and
with relative humidities varying by ±5 %, but this variation
DARDAR variables on ice crystal survival, the results assum-
is rather small. In this, their resulting seeding fraction does
Atmos. Chem. Phys., 21, 5195–5216, 2021 https://doi.org/10.5194/acp-21-5195-2021U. Proske et al.: How frequent is natural cloud seeding from ice cloud layers? 5205
ing ice crystals to be plates and bullet rosettes are similar to
those presented in here. One marked difference is that crys-
tals starting in a subsaturated environment with respect to ice
sublimate and do not seed when assuming them to be plates
or bullet rosettes (see Fig. B3).
A comparison to literature data is difficult because the as-
sumptions vary greatly between studies. Hall and Pruppacher
(1976) compute sublimation heights for ice particles with an
initial radius of 160 µm, at fixed relative humidities with re-
spect to ice between 30 % and 90 %. Their spherical ice par-
ticles sublimated at distances of 1 to 4 km from the starting
altitude of about 9 km. The relative humidities that we find at Figure 6. (a) Seeding cases per seeder–feeder situation. (b) Cumu-
the starting altitudes are similar to their range, as are our sur- lative occurrence frequency of possible seeder–feeder situations (SF
vival distances. Vassel et al. (2019) did not provide informa- situation, green) and successful seeding assuming plate-like spher-
tion on the distances between the cloud layers they studied. ical and bullet rosette ice crystals. Note that 1zim = 0 m is at the
Preliminary work by Vassel (2018) contained the result of base of the lowest cirrus cloud layer with T < −35 ◦ C.
two exemplary sublimation calculations assuming constant
temperature and relative humidity in the subsaturated layer.
The result is in line with the results presented in Fig. 6, where in the DARDAR data, which also originates from ECMWF.
about 42 %, 47 % or 64 % of cases with 1zim = 500 m lead A reason for this discrepancy could not be found, and it is
to successful seeding (for rosettes, plates and spheres, respec- not thought to change our findings significantly, but the dis-
tively). crepancy between the datasets should be investigated further.
One might correct for this by simply setting the survival frac-
3.2.2 Influence of the ice crystal shape tion to 1 within the 1zim < 100 m bin, i.e. within the cloud.
However, we chose to leave the inconsistency as an estimate
The fraction of 1zim with successful seeding is shown in of the uncertainty associated with the seeding fractions given
Fig. 6 for plates, spherical ice crystals and bullet rosettes. for larger distances.
For 1zim > 5 km, there is a only a slight chance for ice crys- In general, as stated before, the ice crystal radius and hence
tals to survive the fall between the cirrus and the underly- the survival fraction shown in Fig. 6 are conservative es-
ing mixed-phase cloud. For 1zim = 2 km the survival rate of timates. In particular, with the new DARDAR dataset (v3)
spherical ice crystals increases to 20 %. Survival chances in- (Cazenave et al., 2019), survival fractions are expected to be
crease linearly, until 81 % of the spherical ice crystals cause higher than shown here for DARDAR v2, since the effective
seeding at a falling distance of 200 m. Plate-like ice crystals ice crystal radii are larger in the former (see Sect. 2). In their
experience a larger drag force and therefore fall slower than sublimation calculations, Vassel et al. (2019) use larger ice
spheres. As they have more time to sublimate during their crystal radii of 100 µm for cirrus clouds as well. Addition-
slower fall, they are less likely to survive at any of the dis- ally, there is the possibility of seeding by pre-activated parti-
tances. This was also found by Hall and Pruppacher (1976) cles even after the macroscopic ice crystal has sublimated, as
and is even more pronounced for bullet rosettes. Combining described in Marcolli (2017). Some ice in pores or shielded
this with the respective 1zim frequencies, Fig. 6 also displays pockets of these particles could survive the subsaturated air
the fraction of successful seedings in our measurements. In in between cloud layers and initiate new ice crystal formation
14 % of the measurements, we see a seeder–feeder situation once the particle reaches the supersaturated air in the lower
where plate-like ice crystals do not sublimate but can seed cloud layer.
the lower-lying cloud after sedimentation (11 % for rosettes With the results presented here, one can comment on the
and 19 % for spheres). method used in Seifert et al. (2009) to filter out ice clouds
A surprising result for all ice crystal shapes is that the that were seeded. They simply reclassified any cloud with an
survival fraction for 1zim < 100 m is smaller than 1. As ex- ice cloud less than 2 km above as a liquid cloud. Given that
plained before, there is no subsaturated layer in this contin- Fig. 6 shows that only 10 % to 20 % of ice crystals survive
uous cloud, so the sedimenting ice crystals should not sub- 1zim = 2 km, it is likely that Seifert et al. (2009) find too
limate at all. The reason for the discrepancy most likely lies many seeded clouds. Finally, comparing to observations, the
in the usage of two independent datasets in the classification case of a survival of 1zim = 5 km, as the one case evaluated
of cloud layers and the calculation of ice crystal survival: in Braham (1967), is rather unlikely according to our data.
the distance between the two layers and the cloud heights are
taken from the DARDAR dataset, while the relative humidity
was taken from ERA5. For example, the temperature profile
in ERA5 over Switzerland is about 5 ◦ C colder than the one
https://doi.org/10.5194/acp-21-5195-2021 Atmos. Chem. Phys., 21, 5195–5216, 20215206 U. Proske et al.: How frequent is natural cloud seeding from ice cloud layers?
4 Summary and conclusions Taking a broader perspective, this study demonstrates that
satellite data are a viable means to explore cloud distribu-
This study uses satellite data and sublimation calculations tions also in regional settings. It can be combined with time-
to establish the occurrence frequency of seeder–feeder cases stepping calculations to study processes on which the satel-
over Switzerland. The seeder–feeder mechanism here refers lite data, which are merely a snapshot in time, provide no
to ice crystals that fall from a cirrus cloud into a lower cloud, information on their own.
where they initiate the glaciation of clouds. Of course the scope of this work could be broadened in
In the DARDAR data, we distinguish between two situa- the future. This study focuses on natural cloud seeding that
tions: in 13 % of all (including clear-sky) measurement cases, originates from cirrus clouds, but seeding ice crystals can
distances between the two cloud types are distributed uni- also sediment from mixed-phase clouds. Additionally, multi-
formly between 100 m and 10 km. This is the classical ex- layer clouds interact in other ways, for example, via radia-
ternal seeder–feeder situation, where the seeding ice crystals tion (Christensen et al., 2013; Vassel, 2018). Moreover, see-
fall through clear air between two clouds. In-cloud seeder– ing that natural cloud seeding occurs over Switzerland, the
feeder situations are found to occur in 18 % of all measure- global distributions of seeder–feeder cloud situations and the
ments. In total, seeder–feeder cloud situations were found to seeding frequency are an interesting next goal of study. Dif-
occur in 31 % of all measurements. As the estimate only in- ferences in the global distribution of multi-layer clouds have
cludes cases with a cirrus cloud as the seeder cloud, it under- already been demonstrated (Mace et al., 2009), and Ansmann
estimates the total seeder–feeder cloud situation occurrence et al. (2009) observed an increase in in-cloud seeding fre-
frequency. The frequency was found to not vary with the dif- quency in their data from the tropics compared to data from
fering topography in Switzerland. Seasonally, winter nights the midlatitudes (Seifert et al., 2009), so a thorough study of
exhibit the highest frequency of possible seeder–feeder situ- global natural cloud seeding frequency promises to be inter-
ations due to an increased high cloud cover in winter and at esting. The satellite data analysis within this study can easily
night. be extended to a global dataset. Solely, the sublimation cal-
We find two modes for the ice crystals size at the base of culations could not be applied to each measurement point in
cirrus clouds. These correspond to in situ and liquid origin such a large dataset, but instead the seeding situations could
cirrus clouds, which confirms the new classification scheme be classified and sublimation calculations could be applied
for cirrus clouds (Luebke et al., 2013, 2016; Krämer et al., to the classes in a representative fashion. Future work could
2016; Wernli et al., 2016; Gasparini et al., 2018; Wolf et al., sample the whole range in ice crystal size distributions in-
2018, 2019). stead of only using the mean size to represent the distribu-
In sublimation calculations, we found that a significant tion, as done in this study.
number of ice crystals reached the lower cloud layers. In to- We show that natural cloud seeding is a widespread phe-
tal, 20 % of ice crystals survived distances of 2 km when as- nomena over Switzerland. This hints at a large potential for
suming that they were spherically shaped. Assuming plate- natural cloud seeding to alter cloud properties and thereby
like crystals or bullet rosettes in the calculations, only about influence Earth’s radiative budget and water cycle, which
10 % of them survived 2 km distances. On the one hand, should be investigated in future studies.
this clearly shows that natural cloud seeding occurs regularly
over Switzerland. On the other hand, it demonstrates that in
these calculations, the distinction between ice crystal shapes
is critical, in contrast to the small ice crystal shape impact
found in Vassel et al. (2019).
We found that ice crystals only survive the fall between
cloud layers when the relative humidity with respect to ice
at cirrus cloud base is larger than 90 %, while temperature
seems to be of secondary importance. In terms of the ice crys-
tal radius, ice crystals with effective radii smaller than 30 µm
mostly sublimate before reaching the lower cloud layer. On
the other hand, larger ice crystal sizes, above 50 µm, do not
guarantee a survival.
Atmos. Chem. Phys., 21, 5195–5216, 2021 https://doi.org/10.5194/acp-21-5195-2021You can also read