Assessing the effect of lithological setting, block characteristics and slope topography on the runout length of rockfalls in the Alps and on the ...
←
→
Page content transcription
If your browser does not render page correctly, please read the page content below
Nat. Hazards Earth Syst. Sci., 21, 1159–1177, 2021
https://doi.org/10.5194/nhess-21-1159-2021
© Author(s) 2021. This work is distributed under
the Creative Commons Attribution 4.0 License.

Assessing the effect of lithological setting, block characteristics and
slope topography on the runout length of rockfalls in the Alps
and on the island of La Réunion
Kerstin Wegner1 , Florian Haas1 , Tobias Heckmann1 , Anne Mangeney2 , Virginie Durand2,a , Nicolas Villeneuve2,3 ,
Philippe Kowalski2,4 , Aline Peltier2,4 , and Michael Becht1
1 Chairof Physical Geography, Catholic University of Eichstätt-Ingolstadt, 85072 Eichstätt, Germany
2 Institutde Physique du Globe de Paris, Université de Paris, CNRS, 75005 Paris, France
3 Laboratoire GéoSciences Réunion, Université de La Réunion, 97744 Saint-Denis, France
4 Observatoire Volcanologique du Piton de la Fournaise, Institut de Physique du Globe de Paris,

97418 La Plaine des Cafres, France
a now at: Helmholtz Centre Potsdam – German Research Centre for Geosciences, GFZ, 14473 Potsdam, Germany

Correspondence: Kerstin Wegner (kwegner@ku.de) and Florian Haas (florian.haas@ku.de)

Received: 30 September 2020 – Discussion started: 6 October 2020
Revised: 16 February 2021 – Accepted: 25 February 2021 – Published: 31 March 2021

Abstract. In four study areas within different lithological       1   Introduction
settings and rockfall activity, lidar data were applied for a
morphometric analysis of block sizes, block shapes and talus      Rockfall is an important geomorphic process on steep rock
cone characteristics. This information was used to investi-       slopes and thus plays a significant role in geomorphic dy-
gate the dependencies between block size, block shape and         namics especially in high mountainous regions (e.g. Hungr
lithology on the one hand and runout distances on the other       and Evans, 1988; Krautblatter and Dikau, 2007; Bennett,
hand. In our study, we were able to show that lithology seems     et al., 2012; Frattini et al., 2012). Rock fragments are de-
to have an influence on block size and shape and that grav-       tached from cliff faces (primary rockfall) or remobilized
itational sorting did not occur on all of the studied debris      from sediment stores (secondary rockfall) downslope (e.g.
cones but that other parameters apparently control the runout     Rapp, 1960; Krautblatter and Dikau, 2007); move in a combi-
length of boulders. Such a parameter seems to be the block        nation of falling, bouncing, rolling or sliding (e.g. Luckman,
shape, as it plays the role of a moderating parameter in two of   2013a; Crosta et al., 2015); and are subsequently deposited
the four study sites, while we could not confirm this for our     on storage landforms such as talus cones. Even though rock-
other study sites. We also investigated the influence of ter-     falls often take place in remote areas, they can still pose a po-
rain parameters such as slope inclination, profile curvature      tential natural hazard and can cause damage to human lives
and roughness. The derived roughness values show a clear          and local infrastructure facilities (e.g. Pfeiffer and Bowen,
difference between the four study sites and seem to be a good     1989; Dorren, 2003; Ravanel et al., 2010; Volkwein et al.,
proxy for block size distribution on the talus cones and thus     2011; Frattini et al., 2012; Heiser et al., 2017).
could be used in further studies to analyse a larger sample of       The occurrence and magnitude of rockfalls depend on
block size distribution on talus cones with different litholo-    the preconditioning and the preparatory factors (e.g. Meißl,
gies.                                                             1998; Dorren, 2003; Dietze et al., 2017a) as well as on trig-
                                                                  gering events. The preconditioning and preparatory factors
                                                                  are mainly lithology, topography of the slope (aspect, steep-
                                                                  ness, altitude), vegetation (e.g. Meißl, 1998; Jaboyedoff and
                                                                  Derron, 2005), rainfall and weathering, frequency of freeze–
                                                                  thaw cycles, sun exposure, and root growth (e.g. Meißl, 1998;

Published by Copernicus Publications on behalf of the European Geosciences Union.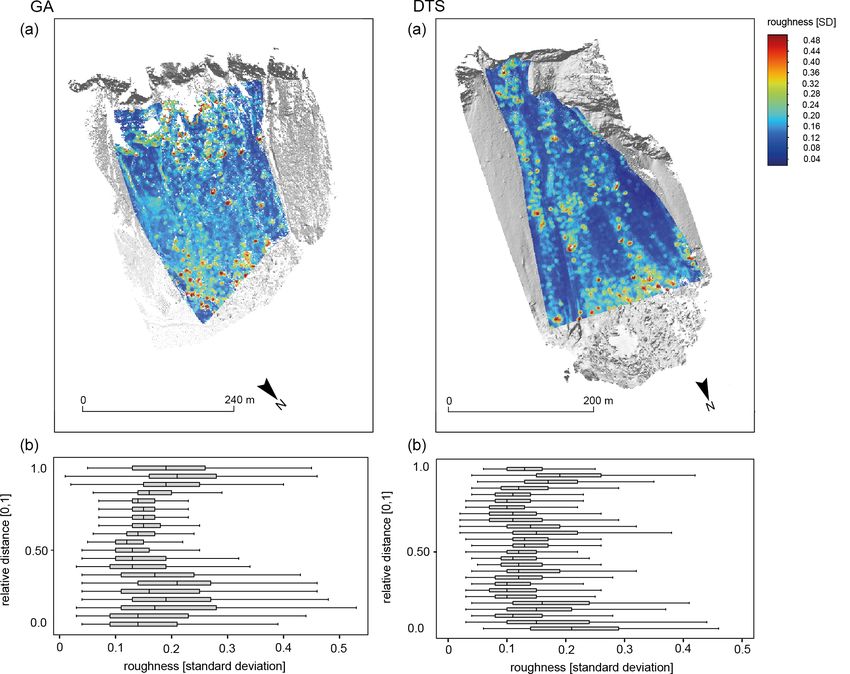
1160 K. Wegner et al.: Assessing the effect of lithological setting, block characteristics and slope topography
Jaboyedoff and Derron, 2005; Krautblatter and Dikau, 2007; and Saeidi, 2019). Haas et al. (2012) already stated in their
Frattini et al., 2012; Crosta et al., 2015). Triggering events case study that the influence of the lithology on block shape
include volcanic or seismic forcing (Hibert et al., 2017; Du- and block size must be investigated with a broader view. This
rand et al., 2018). could be done e.g. in areas with different lithological settings,
Not only due to the change in the settlement structure in as the size and shape of rock fragments are determined by
mountain regions but also in the context of global climate their lithological properties, among other influencing factors
change, many studies exist about rockfall processes, focus- (Haas et al., 2012; Fityus et al., 2013). Some studies have
ing on the modelling of runout trajectories and the prediction described the deposition of boulders on the talus cone as
of rockfall events (e.g. Kirkby and Statham, 1975; Meißl, gravitational sorting, where larger blocks are deposited in the
1998; Agliardi and Crosta, 2003; Dorren, 2003; Copons et distal part and smaller blocks on the upper part of the talus
al., 2009; Jaboyedoff and Labiouse, 2011; Frattini et al., slope (e.g. Statham, 1973; White, 1981; Whitehouse and Mc-
2012; Nappi et al., 2013; Wichmann, 2017; Volkwein et al., Saveney, 1983; Kotarba and Strömquist, 1984; Jomelli and
2018; Caviezel et al., 2019), as well as on the measurement Francou, 2000; Sanders et al., 2009; Messenzehl and Dikau,
of rockfall activity by seismic monitoring (e.g. Vilajosana et 2017; Popescu et al., 2017; Kenner, 2019). The gravitational
al., 2008; Hibert et al., 2011; Farin et al., 2015; Dietze et sorting of the blocks on the slope is a key factor for the rough-
al., 2017a, b; Durand et al., 2018; Feng et al., 2019). Most ness component of talus slopes and thus for the runout length
of these studies use lidar (light detection and ranging) tech- of following rockfall events (Hungr and Evans, 1988), in-
niques such as airborne laser scanning (ALS) as well as ter- dicating a potential feedback loop in the formation of talus
restrial laser scanning (TLS) to improve the understanding of landforms.
this geomorphic process (e.g. Jaboyedoff et al., 2007; Abel- The aim of this study is to carry out a comparative inves-
lán et al., 2011; Haas et al., 2012; Heckmann et al., 2012; tigation of the morphometric properties and runout distances
Royán et al., 2014; Strunden et al., 2015; Sala et al., 2019). of rockfall fragments in mountain regions within different
In recent times structure from motion (SfM) has also been lithological settings. For our analysis we selected four sites
increasingly used for such kinds of studies (e.g. Kromer et with different lithological conditions, different rockfall activ-
al., 2019; Vanneschi et al., 2019; Guerin et al., 2020). ity and existing data with a very high quality. Due to litho-
In the context of hazard assessment and also for geomor- logical differences in the cliffs, we expected different sta-
phological models, not only the transported volumes but also tistical distributions of block sizes and block shapes on the
the analysis of the maximum runout distance of blocks play talus slopes. The study is conducted using high-resolution
an important role especially in populated mountain regions digital terrain models (DTMs) and point clouds created from
(e.g. Jaboyedoff and Labiouse, 2011; Volkwein et al., 2011; TLS surveys. Based on the research of Haas et al. (2012), we
Lambert et al., 2013; Caviezel et al., 2019). Factors influenc- determined different block properties, sizes and shapes and
ing the runout distance and the trajectory of blocks include analysed them in the context of runout distances and talus
topographic conditions, like the slope inclination, height of morphology.
the fall, and curvature conditions (e.g. Meißl, 1998; Frat-
tini et al., 2012; Leine et al., 2014). Other parameters are
the surface properties including protection measures and the 2 Study sites
roughness of the slope (e.g. Meißl, 1998; Leine et al., 2014;
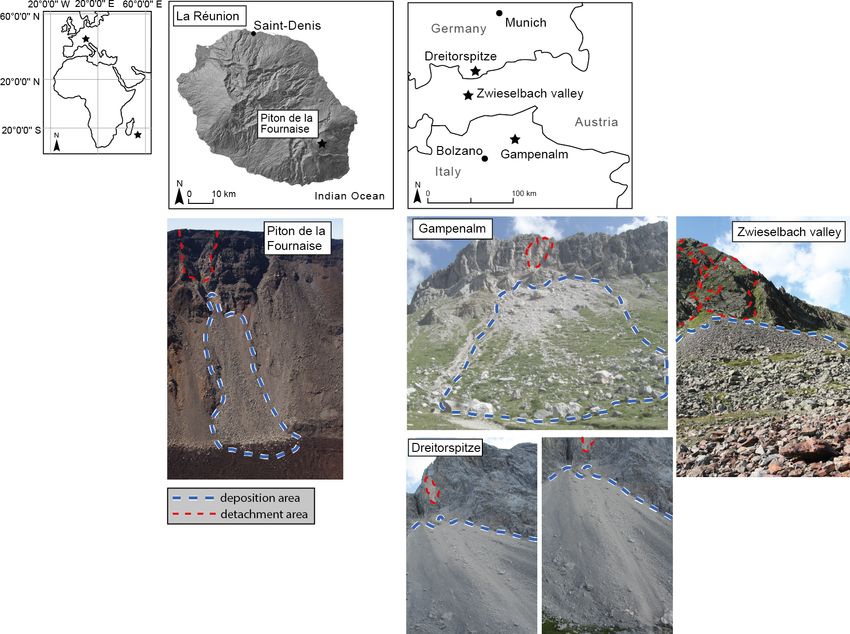
Four areas in high mountainous regions were selected for this
Gratchev and Saeidi, 2019). Some studies show the influence
investigation. Three of these areas are situated in the Alps;
of the properties of the rockfall itself, like the volume, geol-
one area is located on the island of La Réunion (Fig. 1). The
ogy, and size and shape of the blocks, on the runout distances
areas differ mainly with regard to the lithological conditions.
(e.g. Kirkby and Statham, 1975; Meißl, 1998; Leine et al.,
All areas are characterized by recent rockfall activity and
2014). In addition, the kinematical properties of the blocks
a clearly distinguishable rock face with an associated scree
and the restitution parameter influence the depositioning (e.g.
slope. The selected study sites represent different processes
Azzoni and de Freitas, 1995; Jaboyedoff and Labiouse, 2011;
such as rock topples and block fall. For Gampenalm (GA)
Ji et al., 2019; Sandeep et al., 2020). The size and shape of
and Dreitorspitze (DTS), the blocks are assigned to one rock-
blocks and their interaction with slope properties are consid-
fall event. For Piton de la Fournaise (PF) and the Zwieselbach
ered to comprise an important factor for the travel distance
valley (ZBT), the slope is characterized by deposited mate-
(e.g. Pfeiffer and Bowen, 1989; Meißl, 1998; Frattini et al.,
rial from continuous rockfall processes, but also major events
2012; Leine et al., 2014).
cannot be excluded. A further criterion for the selection of
The influence of block shape, block size and slope topog-
the area was that both the rock faces and the talus cones were
raphy on the runout distance has been investigated only by a
clearly and completely visible to ensure complete and dense
small number of studies (Azzoni and de Freitas, 1995; Haas
lidar acquisition.
et al., 2012; Fityus et al., 2013) and mainly in case studies or
tests under laboratory conditions (Okura et al., 2000; Glover
et al., 2015, Cui et al., 2017; Wang et al., 2018; Gratchev
Nat. Hazards Earth Syst. Sci., 21, 1159–1177, 2021 https://doi.org/10.5194/nhess-21-1159-2021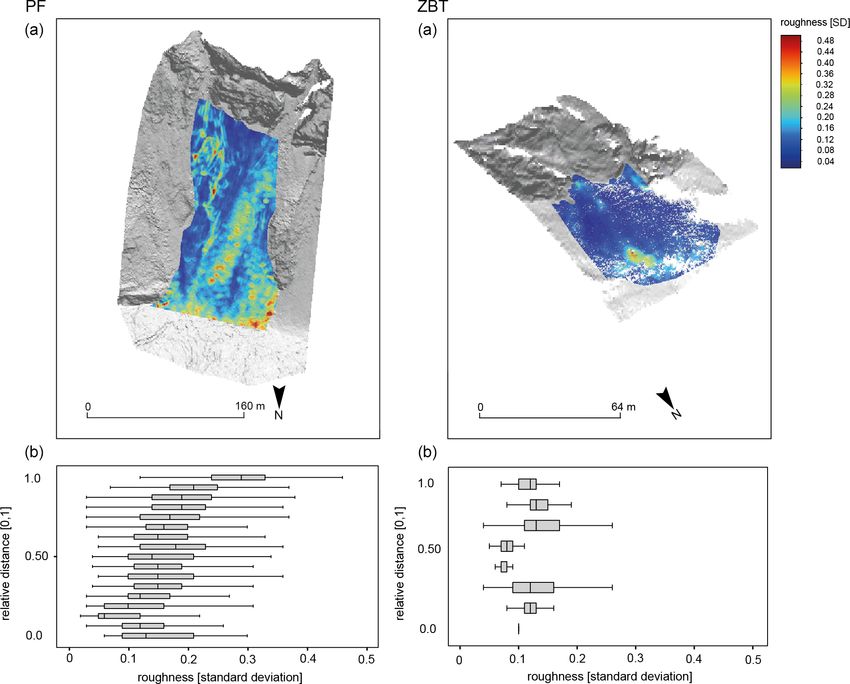
K. Wegner et al.: Assessing the effect of lithological setting, block characteristics and slope topography                             1161

Figure 1. Geographical location of the study sites located on La Réunion and in the European Alps. The stars locate the location of the study
sites. The dashed red lines limit the detachment areas of the rockfall events. The dashed blue and white lines represent the deposition area.
(Source of the overview base map: ESRI, HERE, Garmin, OpenStreetMap contributors and the GIS user community.)

   The GA and DTS areas are located in the southern and                  seas department. PF is one of the most active volcanoes in the
the northern Alps, respectively, and consist of sedimentary              world (e.g. Peltier et al., 2009a). For the period from 1950 to
rocks specifically of different limestone formations (Table 1).          2013, 93 eruptions have been documented (Staudacher et al.,
The GA area is located in the Dolomites and is dominated                 2016). Due to a summit collapse during an eruption in 2007
by the thickly banked Rosengarten massif (cf. Haas et al.,               (e.g. Peltier et al., 2009b) a 340 m deep caldera was formed
2012). DTS is dominated by the thickly banked Wetterstein                (e.g. Staudacher et al., 2016) in an area of 1100 × 800 m (e.g.
limestone. In both areas, major rockfall events occurred in              Urai et al., 2007). On this volcano, the composition of the
recent years.                                                            lava is mainly bimodal with a combination of aphyric basalts
   The ZBT in the Stubai Alps is located in the area of the              and olivine-rich basalts (e.g. Peltier et al., 2009a; Lénat et al.,
crystalline Central Alps and is characterized by slated gneiss           2012). Due to the high tectonic stress (e.g. Merle et al., 2010;
and metamorphic granites. There are not known to have been               Staudacher et al., 2016), the high volcanic activity that gener-
major rockfall events during the last few years, but the de-             ates deformation and seismic activity (e.g. Sens-Schönfelder
posits on the talus cone indicate recent rockfall activity also          et al., 2014; Peltier et al., 2018), and the layering of different
including bigger blocks. For GA, DTS and the ZBT the pre-                lava flows, the rim is very unstable and thus prone to high
condition and preparatory factors cannot be determined ex-               rockfall activity (Hibert et al., 2017; Durand et al., 2018).
actly, but thawing of mountain permafrost can be excluded                This area certainly differs most clearly from all the other
due to the altitude and exposure. As we do not have temper-              studied areas. Besides the volcanic rocks, both the cliff and
ature and precipitation data, we cannot give any information             the talus cones are very young landforms, as the geomorphic
about this.                                                              forming started directly after the emergence of the caldera in
   The PF test site (Dolomieu crater) on La Réunion is the               2007. Further differences are the high deformation and seis-
only area outside the Alps and is located in the Indian Ocean,           mic activity and the extremely high precipitation. Seismicity
east of Africa, but politically it belongs to France as an over-         and rainfall have been show to play a role in rockfall trigger-

https://doi.org/10.5194/nhess-21-1159-2021                                      Nat. Hazards Earth Syst. Sci., 21, 1159–1177, 2021
1162                K. Wegner et al.: Assessing the effect of lithological setting, block characteristics and slope topography

Table 1. Morphological and lithological characteristics of all investigated talus slopes.

       Study area                         PF             ZBT                         GA                         DTS
       Altitude [m a.s.l.]                2632           2278                        2450                       2682
       Lithology                          Basalt         Gneisses, glimmers,         Triassic dolomites,        Triassic limestone,
                                                         metamorphic granites        limestone, psephite        dolomite
       Mean slope inclination [◦ ]
       Talus cone                         36             29                          32                         32
       Cliff                              55             50                          59                         66
       Length [m]
       Talus cone                         250            55                          250                        300
       Cliff                              150            60                          150                        100
       Mean annual precipitation          3000–4250      1000                        862.2                      1500
       [mm yr−1 ]
       Mean annual temperature [◦ C]      13.8           0.9                         7.8                        6.7
       Density [g cm−3 ]                  2.99           gneiss: 2.80                limestone: 2.55            limestone: 2.55
                                                         granite: 2.64               dolomite: 2.70             dolomite: 2.70
       Friction angle ϕ [◦ ]              35–38          gneiss: 26–29               limestone: 31–37           limestone: 31–37
       Tensile strength [MPa]             10–30          gneiss: 5–20                limestone: 5–25            limestone: 5–25
                                                         granite: 7–25               dolomite: 14               dolomite: 14

ing (Hibert et al., 2017; Durand et al., 2018) but should not              Table 2. Technical data of the two terrestrial laser scanning sys-
have any influence on the runout lengths of single blocks,                 tems Riegl LMS-Z420i and VZ-4000 (RIEGL Laser Measurement
so for the present investigations primarily the differences in             Systems GmbH, 2010, 2020). The values of the VZ-4000 refer to
lithology and in the case of PF the age have to be considered.             measurements at a rate of 30 kHz.

                                                                                                        LMS-Z420i         VZ-4000
3     Materials and methods                                                 Max measurement range       1000 m            4000 m
                                                                            Measurement rate            8000 points s−1   23 000 points s−1
3.1    Data acquisition and processing (TLS)                                Accuracy                    10 mm             15 mm
                                                                            Precision                   4–8 mm            10 mm
The data of all study sites have been acquired with a terres-               Laser wavelength            Near infrared     Near infrared
trial 3D long-range laser scanner. Two systems were used:                   Laser beam divergence       0.25 mrad         0.15 mrad
the Riegl LMS-Z420i and the Riegl VZ-4000. Each scan-
ner works on the same principle of time of flight, but due to
laser configurations, the scanning distance of the VZ-4000                 al., 2015; Laserdata Information System, LIS: https://www.
is 4 times longer with 4000 m compared to 1000 m. Both                     laserdata.at, last access: 8 February 2021). We worked on the
systems provide colour information due to integrated cam-                  vegetation-filtered and homogeneously thinned point clouds
era systems in order to colorize the point clouds. The RGB                 and created digital terrain models (DTMs) for all test sites
values of the pictures allow the filtering of vegetation in the            with a raster resolution of 0.75 m using the lowest z value.
pre-processing of the data and simplify the visualization of               Table 3 provides information about each study site including
e.g. individual blocks. All important technical information                the vertical and horizontal scan resolution, the referencing
of both devices is listed in Table 2.                                      precision, number of points in the raw data set, and the point
   Due to the long distance between scanner and target and                 density (points m−2 ).
the poor reflectance of the volcanic material in the Dolomieu
crater, we used the VZ-4000 for this study site. All other                 3.2   Determination of block size, block shape and
test sites were surveyed using the LMS-Z420i. To minimize                        runout length
shadowing effects, several scan positions were necessary at
each site, which had to be referenced using manual adjust-                 As the block size and shape have a great influence on the
ment and ICP algorithms (Table 3). Both tools are imple-                   runout distance of the falling rock material, we measured
mented in the software RiSCAN PRO (v2.2.1, http://www.                     according to the workflow of Haas et al. (2012) the dimen-
riegl.com, last access date: 8 February 2021).                             sions of the three axes (a, b and c) of single boulders for ev-
   After the referencing, the data were exported as ASCII                  ery study area (PF n = 255; GA n = 618; ZBT n = 65; DTS
files containing x, y and z coordinates as well as RGB                     n = 182). We selected blocks that were deposited on the talus
values for further analysis in SAGA GIS LIS (Conrad et                     surface beginning from the upper and going to the lower parts

Nat. Hazards Earth Syst. Sci., 21, 1159–1177, 2021                                           https://doi.org/10.5194/nhess-21-1159-2021
K. Wegner et al.: Assessing the effect of lithological setting, block characteristics and slope topography 1163
Table 3. Information about the TLS surveys for each study area.
TLS system Scan resolution Referencing precision Number of points in Point density
raw data set (points m−2 )
PF VZ-4000 0.02◦ 0.007–0.013 m > 60 × 106 points 55 points m−2
ZBT LMS-Z420i 0.05–0.1◦ 0.018–0.060 m 1.5 × 10⁶ points 50 points m−2
GA LMS-Z420i 0.05–0.1◦ 0.012–0.058 m 8 × 10⁶ points 54 points m−2
DTS LMS-Z420i 0.05–0.2◦ 0.015–0.065 m 3 × 10⁶ points 54 points m−2
the lengths of the axes of the blocks for all study sites. In
order to be able to make an assessment about the overesti-
mation of the calculated block volume, we selected a sample
of 10 blocks with different sizes for each study area (Fig. 3).
Using the TLS point clouds, the block volume was derived in
RiSCAN PRO. The comparison between volume estimation
via the three measured axes and the 3D volume calculation
in RiSCAN PRO in all four areas shows that the volumes of
the blocks are constantly overestimated. It is also visible that
this overestimation appears relatively small in the ZBT area,
which can be explained by the rather angular structure of the
blocks (see Fig. 2). This provides an indication that the over-
estimation can be explained primarily by the fact that the axis
calculation assumes rectangular edges for the volume calcu-
lation, which is certainly not true for all blocks of the other
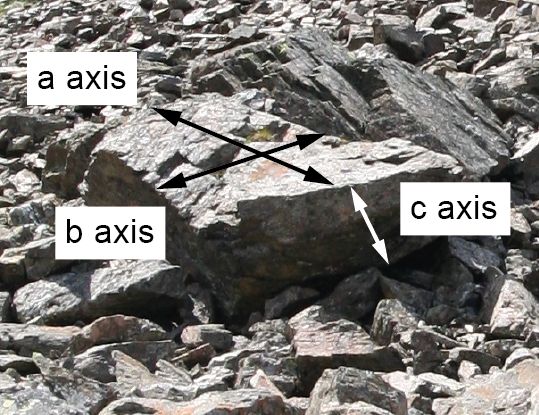
areas. However, in view of the uniform use of the axis method
Figure 2. Deposited block on the ZBT talus cone with the three and the systematic overestimation in all areas, it seems per-
measured dimensions of the axes a, b and c. missible to us to calculate the volume via this simple method
and to use it for the further analyses.
For the study areas of DTS and GA we determined the Eu-
of the talus cones. Based on the coloured lidar point clouds clidean distance from their detachment zones to each mea-
every block larger than approximately ∼ 0.5 m was manually sured boulder to obtain the runout length. Since the exact de-
measured in the software RiSCAN PRO. Figure 2 shows an tachment zone could not be determined at PF and the ZBT,
idealized sketch of a boulder with the three measured axes. we measured the Euclidean distance from the beginning of
We followed the work of Haas et al. (2012), which used the the transition between cliff and talus cone to each boulder in-
formula of Valeton (1955) as an indicator of the block shape. stead. In order to be able to compare the runout distances be-
By using the measured three axes, the volume (Eq. 1) and tween the slopes of the study areas and as they differ greatly
the axial ratio (Eq. 2) were approximated. The derived ax- in length, we normalized the runout lengths for each talus
ial ratio of the measured blocks describes their block shape. cone to the interval [0, 1]. We have assumed that a value of 0
For the calculation of the axial ratio, the parameter of the stands for the detachment area or the area between the rock
b axis must be set to 1 (cf. Valeton, 1955). With this method, face and the slope. The value of 1 stands for the maximum
blocks with an axial ratio of 1 can be described as a cuboid runout length of a block.
or as equant, but the method does not reflect the roundness of
blocks. In the following we will also use the term of a small 3.3 Morphometric slope properties
or low axial ratio. The larger the value of the axial ratio, the
more elongated or irregularly shaped the blocks are. Here we 3.3.1 Slope inclination and curvature
will refer to a high axial ratio. The different lithology of the
study areas determines the shape of the deposited blocks to a Based on the high-resolution DTMs of the study sites we per-
certain degree as predisposition (Glover et al., 2015). formed a spatial analysis of the talus cones including mor-
phometric properties with a presumed influence on the depo-
Block volume = a × b × c (1) sition (e.g. Wang and Lee, 2010; Frattini et al., 2012; Crosta
Axial ratio = a/b/c (2) et al., 2015) and runout distances of rockfall boulders (e.g.
Glover et al., 2015): slope inclination and profile curvature.
Since a 3D approach to measure the blocks would be too The slope inclination was derived based on the DTMs ac-
time-consuming for this number of blocks, we decided to use cording to Zevenbergen and Thorne (1987).
https://doi.org/10.5194/nhess-21-1159-2021 Nat. Hazards Earth Syst. Sci., 21, 1159–1177, 20211164 K. Wegner et al.: Assessing the effect of lithological setting, block characteristics and slope topography
Figure 3. Boxplots of measured and reconstructed block volume. The thick black lines within the boxes show the median bounded by the
first quartile (25th percentile) and the third quartile (75th percentile). The boxes show the interquartile range (IQR). The whiskers of the
boxplots mark the minima and maxima of the data. The circles represent data which exceed the 1.5-fold IQR.
Additionally, we created three longitudinal profiles with a 4 Results and discussion
swath width of 10 m from the highest part of the cone to the
distal boundary in order to characterize slope morphology of 4.1 Morphometric analyses
all four test sites to show changes in slope inclination and
profile concavity (cf. Hergarten et al., 2014). We applied a 4.1.1 Block size and block shapes
kernel density estimation (cf. Cox, 2007) to compare the dis-
tributions of slope inclination between rock faces and talus In Table 4 we have listed mean and median values for block
cones and between the study sites. size and shape for the four study sites. To show the distribu-
tion of the block properties, size and shape, we have visual-
3.3.2 Surface roughness ized the measured blocks with the longest axis greater than
∼ 0.5 m in Fig. 4 using boxplots. With regard to the block
The roughness of the slope can serve as a proxy for the volumes, the four investigated sites differ, in some cases very
particle size distribution on the talus cone. This parameter significantly. The smallest block sizes (Table 4) can be found
could give more information regarding the gravitational sort- in the ZBT area with a median value of 0.08 m3 , and the
ing pattern where it indicates a coarsening towards the foot largest block sizes can be found in the DTS area with a me-
of the slope and/or a concentration of coarse material at the dian value of 13.16 m3 . The median is below 4 m3 in the three
foot of the rock wall. This is to determine and analyse the areas of PF (3.38m3 ), the ZBT (0.08 m3 ) and GA (1.63 m3 ).
sorting of particle sizes beyond the measured block sizes of The data show a very homogeneous distribution and only
the single debris cones. For this purpose, we calculated the small maximum values in PF and the ZBT, whereas in GA
roughness based on the high-resolution TLS point clouds. and DTS a very large dispersion and high maximum values
The algorithm used fits a plane for each point of the point (Table 4) are obvious. This indicates that a correlation be-
cloud in its local neighbourhood with a search radius of 3 m tween the lithological conditions and the block sizes involved
(SAGA surface roughness module (PC); Laserdata Informa- in rockfall processes is very likely, as the largest blocks are
tion System, LIS, 2010; https://www.laserdata.at, last access: mainly found in areas with banked limestones. This is clearly
8 February 2021). Using the plane, the standard deviation of shown in the Wetterstein limestone and to a lesser degree in
the distance to the fitted plane for each point was derived. To the Dolomite area. The extremely small block sizes are par-
obtain the spatial distribution and the change in roughness ticularly striking in the ZBT area, which consists of meta-
along the slope for each study site, we classified the elevation morphic rocks. This can be explained by the rather slated
values of the talus cones (z value) into 10 m classes. In order and thus platy rock structure of the gneisses and by the long
to be able to establish comparability between the study areas, tectonic history of these rocks (see Fig. 2).
we normalized the height values of the point clouds. Further- In contrast to the block sizes, the block shapes (Fig. 4)
more, we classified the block volumes to check whether they in all four areas show a high dispersion between equant and
correspond to the spatially distributed roughness of the de- rather elongated or irregularly shaped blocks. The most elon-
posited blocks on the talus cone. gated blocks can be found in the ZBT area with a median
value of 2.63 (Table 4), which again can be explained by the
slated structure of the gneisses. The limestones of the GA
and DTS areas are very similar in the median, mean block
shape and the dispersion of the data (Table 4, Fig. 4). The
Nat. Hazards Earth Syst. Sci., 21, 1159–1177, 2021 https://doi.org/10.5194/nhess-21-1159-2021K. Wegner et al.: Assessing the effect of lithological setting, block characteristics and slope topography 1165
Table 4. Mean and median values for the parameters block size and cited studies. It must be noted that especially in the ZBT
block shape for each study site. The values for block size and shape the talus cone can be divided into two sectors, which dif-
(axial ratio) were calculated using Eqs. (1) and (2) with b = 1. fer very clearly in terms of slope (Fig. 5d). Thus, in the left
area we find significantly higher slope inclinations with 43◦ ,
Block size Block shape which are higher than the values from the literature, whereas
Mean [m3 ] Median [m3 ] Mean Median in the right area rather significantly lower slope inclinations
are found.
PF 5.07 3.38 2.00 1.73
ZBT 0.29 0.08 2.87 2.63 PF
GA 11.86 1.63 2.58 2.33
DTS 70.19 13.16 2.78 2.40 The highest slope inclinations can be found on PF with 36.0◦
and its basaltic lava material. Yamamoto et al. (2005) con-
clude that basaltic material cannot be deposited on slopes of
lowest values and therefore the most cuboid shaped blocks, more than 33◦ . However, the higher average slope inclination
consisting of volcanic rocks, were found in the PF area with at PF compared to the findings of Yamamoto et al. (2005)
a median value of 1.73. Whether this is due to lithology or to can be explained by the rock surface conditions, which also
tectonic stresses caused by the high seismic activity and the play an important role, since fresh volcanic rocks in partic-
resulting fissures and cracks cannot be finally clarified with ular are characterized by a high micro-roughness, especially
the data of this study. where the lava could cool very quickly. Thus the slope seems
With regard to the block shapes and block size distribu- to be controlled by the friction coefficient of the deposited
tions in the areas, however, it can be concluded that the inves- material. In particular, for PF, analysis of seismic data for
tigated areas show sufficient differences in both block sizes rockfalls suggests a friction coefficient of 35◦ for the talus
and shapes, and that this is very likely a consequence of the slope (Hibert et al., 2011). This is supported by the distribu-
lithological setting. This allows for a more detailed investi- tions of the slope inclinations (see Figs. 5c and 6c), where the
gation of the relationships between block shape, block size data scatter is lowest in the PF area. Here the distribution is
and runout distance. We will also analyse how the different very peaked and differs clearly from the distributions of the
process activities affect the deposition and runout distance. other three areas. The shape of the slope profiles (Figs. 5a
and 6a) also points in a similar direction. The talus cone of
4.1.2 Slopes of the talus cones PF follows a straight line over the entire length of the slope,
whereas the other cones show a slight convexity in the up-
In addition to the block shape and block size, the topography per and middle slope and a basal concavity at the end of the
of the talus cones also plays an important role and has to be slope, which is in good agreement with the works of Kotarba
considered for a runout analysis. Thus, we analysed the fol- and Strömquist (1984), Luckman (2013b), and Popescu et al.
lowing form parameters: slope inclination and slope profiles (2017). Nevertheless, it is very likely that the talus cone of
(curvature) (Figs. 5 and 6). PF represents a pure talus cone and has been reshaped since
The average slope inclinations of the talus cones lie be- the summit collapse in 2007 by persistent rockfalls, whereas
tween 28 and 36◦ and thus within the range for such land- the talus cones of the other areas represent much older forms
forms (e.g. Pérez, 1989, 1998; Francou and Manté, 1990; where different types of geomorphic processes occur (e.g.
Jomelli and Francou, 2000; Sanders et al., 2009; Luckman, debris flows, avalanche deposits).
2013b, Popescu et al., 2017; Volkwein et al., 2018). The
mean slope inclination values for the talus cones of our study DTS and GA
sites are for PF, the ZBT, GA and DTS 29, 32, 36 and 32◦ ,
respectively. This can provide an indication of the depen- The DTS and GA talus cones show quite similar values with
dence between rock material and slope inclination of gravel 31.9 and 31.6◦ . Gerber (1974) measured 32◦ for talus cones
or blocky material and thus supports the findings of other consisting of limestone material, which corresponds to the
studies. study sites of GA and DTS. Serrano et al. (2019) described
in their study slope inclinations for limestone formations of
ZBT 32–36◦ , and Knoblich (1975) gives values of 28–43◦ . The
two slopes are also similar regarding the longitudinal pro-
Kenner (2019) reported in their study on amphibolite sedi- files (Fig. 6a). GA has a slightly basal concave talus cone
ments slope angles of 35◦ , and Messenzehl and Dikau (2017) downslope, while that of DTS is straighter.
described in their survey on metamorphic rocks slope angles
of 34–36◦ and 33–34◦ . Additionally, Gerber (1974) showed
in his study a slope inclination of 33◦ for gneisses and meta-
morphic granites. For the ZBT we found only 28.9◦ for the
metamorphic rocks, which is significantly lower than in the
https://doi.org/10.5194/nhess-21-1159-2021 Nat. Hazards Earth Syst. Sci., 21, 1159–1177, 20211166 K. Wegner et al.: Assessing the effect of lithological setting, block characteristics and slope topography
Figure 4. Boxplots of volume and shapes for the measured blocks. The red-coloured points correspond to each measured block. The thick
black lines within the boxes show the median bounded by the first quartile (25th percentile) and the third quartile (75th percentile). The boxes
show the interquartile range (IQR). The whiskers of the boxplots mark the minima and maxima of the data. The circles represent data which
exceed the 1.5-fold IQR.
Table 5. Analysis of the relationship of block volume and axial ratio against runout length by means of Spearman’s rank correlation for each
study site.
PF ZBT GA DTS
Block volume ρ 0.15 0.33 −0.04 −0.29
Block volume p value 0.02 0.007111 0.39
0.001
Axial ratio ρ 0.06 0.27 −0.35 −0.42
Axial ratio p value 0.36 0.03
0.001
0.001
4.2 Relationship between block size, block shape and as weak correlations between runout length and block shape
runout length for the four test sites, which indicate no monocausal relation-
ship.
4.2.1 Analysis of individual boulders These results are in contrast to other studies, which state
that longitudinal sorting of talus cones shows an increase in
In order to analyse the relationship between block volume, block sizes downslope (Jomelli and Francou, 2000). Popescu
block shape and runout length, we calculated Spearman’s et al. (2017) conclude that there is a gradual increase in boul-
rank correlation (Table 5). The results show only weak cor- der size towards the slope base, which is also stated by Co-
relations between block volume and runout distance as well
Nat. Hazards Earth Syst. Sci., 21, 1159–1177, 2021 https://doi.org/10.5194/nhess-21-1159-2021K. Wegner et al.: Assessing the effect of lithological setting, block characteristics and slope topography 1167 Figure 5. Slope characteristics for the PF and ZBT study sites. Three swath longitudinal profiles from the cliff to the maximum runout distance (a). Statistical distribution of all measured blocks regarding their shapes and volumes on the talus cone. Every single line represents a measured block, and thus the deposition on the slope can be illustrated. For this purpose, we have presented all blocks (1) and the most (2) and least (3) spheroidal blocks, and we have classified the block volume according to 10 m3 (4), 102 m3 (5) and 103 m3 (6) (b). Kernel density estimation of slope inclination distinguished according to the cliff and the talus cone (c). Maps of slope inclination with different classes (d). pons et al. (2009), determining a dependency of rock volume jumping parabolas, the rolling speed, and the timing of the and runout distance. Serrano et al. (2019) showed that the change between jumping and rolling. Meißl (1998) has also distal part of a slope is characterized by the accumulation of observed that larger blocks do not always reach the longest large blocks. In contrast to these studies Caine (1967) found runout distances. A possible cause could be that the blocks a decrease in blocks sizes with distance downslope, but his tend to sink, depending on the slope properties, but also in- results are statistically insignificant. Messenzehl and Dikau teractions between the blocks cannot be excluded. Moreover, (2017) showed that there is a distinct downslope increase in the fracturing of larger blocks can additionally lead to a loss block size and sphericity, which indicates a combination of of kinetic energy, which influences the disposition of blocks these block characteristics govern the runout length. These (Meißl, 1998). contradictory statements are supported by the work of Meißl In order to obtain a broader view on the data and in ac- (1998), who described in her analysis that the shape and size cordance with Haas et al. (2012), we plotted the relative dis- of the blocks mainly influence the width and height of the tance against log10 block volume to show the relationship for https://doi.org/10.5194/nhess-21-1159-2021 Nat. Hazards Earth Syst. Sci., 21, 1159–1177, 2021
1168               K. Wegner et al.: Assessing the effect of lithological setting, block characteristics and slope topography

Figure 6. Slope characteristics for the GA and DTS study sites. Three swath longitudinal profiles from the cliff to the maximum runout
distance (a). Statistical distribution of all measured blocks regarding their shapes and volumes on the talus cone. Every single line represents
a measured block, and thus the deposition on the slope can be illustrated. For this purpose, we have presented all blocks (1) and the most
(2) and least (3) spheroidal blocks, and we have classified the block volume according to 10 m3 (4), 102 m3 (5) and 103 m3 (6) (b). Kernel
density estimation of slope inclination distinguished according to the cliff and the talus cone (c). Maps of slope inclination with different
classes (d).

every single talus cone in more detail (Figs. 7 and 8). We                   Figures 7 and 8 show that we can subdivide our study sites
combined this analysis with the axial ratio of the boulders.              into two classes, regarding the runout length and block size
Figures 7a and 8a show boxplots with six different quan-                  and shape. The first class represents the study sites where the
tile classes (< q10, q10–q25, q25–q50, q50–q75, q75–q90,                  blocks can be reliably assigned to one bigger rockfall event
> q90), which correspond to the 10 %, 25 %, 50 %, 75 % and                (GA and DTS). The second class consists of the PF and ZBT
90 % quantiles of the log10 block volume and log10 axial ra-              sites, where we cannot reliably assign the boulders to one
tio. To analyse the relationship of the parameters in more de-            event and therefore have to assume continuous rockfall ac-
tail, we highlighted the 10 % and the 90 % quantile classes,              tivity.
which indicate blocks with a low (10 %) and high (90 %) ax-                  In the ZBT and PF areas the block sizes seem to have a rec-
ial ratio. These different classes are visualized with different          ognizable influence on the runout length. Although the dis-
symbols and colours in Figs. 7b and 8b.                                   persion of the data and Spearman’s rank correlation show that
                                                                          this correlation is not significant (Table 5), large blocks above

Nat. Hazards Earth Syst. Sci., 21, 1159–1177, 2021                                         https://doi.org/10.5194/nhess-21-1159-2021
K. Wegner et al.: Assessing the effect of lithological setting, block characteristics and slope topography 1169 Figure 7. Boxplots of relative distance versus log10 block volume and log10 block shapes of the measured rocks for the PF and ZBT study sites (a). The red-coloured points correspond to each measured individual block. The thick black lines within the boxes show the median bounded by the first quartile (25th percentile) and the third quartile (75th percentile). The boxes show the interquartile range (IQR). The whiskers of the boxplots mark the minima and maxima of the data. The circles represent data that exceed the 1.5-fold IQR (a). Scatterplot of relative distance versus log10 block volume for all study sites. Blocks with a low axial ratio (< q10) and a high axial ratio (> q90) are highlighted with different colours and symbols (b). a certain size are not present in the short runout lengths. size can therefore not be used as an explanation for the runout However, Fig. 7b also shows that for PF, smaller and larger distance alone, which is in agreement with Spearman’s rank blocks are deposited in all areas of the slope. At the same correlation and supports our thesis above that there is no time the block shape does not seem to play a major role in the monocausal relationship. runout distance, which is also indicated by Spearman’s rank The situation is different regarding the block shapes in the correlation: PF r = 0.06 and ZBT r = 0.27. Cuboid-shaped areas of GA and DTS. Here it is clearly visible that with an and elongated blocks can actually be found over the entire increase in axial ratio, the runout distance decreases. This talus cone without any visible clustering (Fig. 7b). is also quite consistent with the results of Spearman’s rank GA and DTS show that the size of the blocks obviously correlation, because in these two areas a slight correlation does not play a major role in the runout length on the talus between axial ratio and range can be stated (Table 5). This cones, as the median values do not show a significant trend, is also visible in Figs. 7b and 8b, which show the cuboid- but the dispersion of the runout distances clearly increases shaped and longest blocks combined with the ranges: blocks with increasing block size. This is visible in both areas but with a low axial ratio (< q10) reach larger distances than is more pronounced at DTS. Beside this, it is also visible elongated blocks (> q90) (e.g. Pérez, 1998). This can be seen that blocks with larger volumes also have smaller runout dis- in both areas from a relative distance of about 0.7 on the tances (Figs. 7b and 8b). The scatterplots show that the block talus cone. We observed that the parameter axial ratio acts size is scattered strongly over the entire talus cone. The block like a moderating parameter with regard to the deposition of https://doi.org/10.5194/nhess-21-1159-2021 Nat. Hazards Earth Syst. Sci., 21, 1159–1177, 2021
1170              K. Wegner et al.: Assessing the effect of lithological setting, block characteristics and slope topography

Figure 8. Boxplots of relative distance versus log10 block volume and log10 block shapes of the measured rocks for the GA and DTS study
sites (a). The red-coloured points correspond to each measured individual block. The thick black lines within the boxes show the median
bounded by the first quartile (25th percentile) and the third quartile (75th percentile). The boxes show the interquartile range (IQR). The
whiskers of the boxplots mark the minima and maxima of the data. The circles represent data that exceed the 1.5-fold IQR (a). Scatterplot
of relative distance versus log10 block volume for all study sites. Blocks with a low axial ratio (< q10) and a high axial ratio (> q90) are
highlighted with different colours and symbols (b).

blocks. Pérez (1998) and Messenzehl and Dikau (2017) con-               blocks can be found not only at the end of the slope but
clude in their studies that equant blocks are deposited pre-            also on the upper slope (Fig. 8b). This could be explained
dominantly at the talus toe. As already shown by Glover et al.          by the fact that the blocks collide with each other during a
(2015) in their rockfall simulation, uniformly shaped blocks            large rockfall event, thereby dissipating their energy, or per-
followed by elongated blocks achieve the largest runout dis-            haps split into smaller blocks, resulting in the different block
tances. Platy blocks, on the other hand, are known to tend              shapes being deposited in both the lower and the upper area
to achieve long ranges only if they manage to place them-               of the talus cone (Ruiz-Carulla and Corominas, 2020). Al-
selves on the shortest axis as the axis of rotation, which will         though this cannot be definitively confirmed with the present
probably not be the case for all blocks. This probably ex-              study, eyewitness reports speak in favour of the fact that such
plains why such blocks tend to have shorter runout distances            a collision of blocks did indeed take place at least at GA.
(Glover et al., 2015). It is particularly noticeable, however,
that in the DTS area all blocks (< q10) with a low axial ra-            4.2.2    Roughness as indicator for block size distribution
tio achieve very high distances and are not found at all at
the shorter distances (Fig. 8b). This supports the thesis above         To put the sampling analysis into a broader context and to
that platy blocks only achieve high runout distances when               verify if our single-block analysis is representative for all
they are placed on the short axis (wheel effect). This is dif-          talus cones, we attempted to use our high-resolution data
ferent in the GA area. Here the majority of the cuboid-shaped           to calculate roughness on an area-wide scale for all de-

Nat. Hazards Earth Syst. Sci., 21, 1159–1177, 2021                                       https://doi.org/10.5194/nhess-21-1159-2021
K. Wegner et al.: Assessing the effect of lithological setting, block characteristics and slope topography                           1171

Figure 9. Maps of classified slope inclination for the PF and ZBT talus cones (a). Calculated roughness (standard deviation) based on the
TLS point clouds which are classified into 10 m classes of the runout distance. To compare these values, we normalized the runout length to
[0, 1] (b).

bris cones. Here, we understand roughness as an indicator               ume (Fig. 7). It is also visible that the ZBT shows the lowest
of block size, with high roughness corresponding to large               roughness values, which fits very well with the platy struc-
blocks and low roughness corresponding to smaller blocks.               ture of the gneisses, since these blocks are mostly deposited
   The derived roughness based on the TLS point clouds                  with the shortest axis perpendicular to the talus cone. Wang
shows a clear difference between the study sites (Figs. 9               and Lee (2010) and Mikoš et al. (2006) simulate in their stud-
and 10), which we also found in our single-block analysis               ies that the roughness of the slope has an influence on the
in Sect. 4.2.1. The highest roughness values on the GA and              trajectory of the blocks and accordingly influences the de-
DTS talus cones can be found on the upper slope – this pat-             position. In their laboratory experiment, Gratchev and Saeidi
tern is somewhat less pronounced in the ZBT – and then fall             (2019) also come to the conclusion that the surface properties
off and rise again towards the end of the slope. This is in             influence the rebound angle and, accordingly, the trajectory
good agreement with our single-block analysis, where bigger             of rockfall material.
blocks tend to have longer runout distances, but some of the               As our data show the talus cones only for one time step and
bigger blocks show shorter runout distances (Figs. 7 and 8).            we do not have information about the pre-event roughness,
In contrast to the other talus cones the roughness in PF and            we cannot draw any conclusion about how the roughness of
the ZBT seems to be continuously increasing in the downs-               the talus cone acts as a moderating factor for the runout dis-
lope direction with the lowest roughness on the upper slope             tances of our single blocks. But regarding Statham (1976) it
and the highest roughness at the end of the slope (Fig. 9a              is very likely that the roughness can play a major role and
and b). This is also in good agreement with our results of the          thus has influenced the runout distance of blocks in the past
single-block analysis in Sect. 4.2.1, where we found a rec-             and will also do so in the future. However, it must be taken
ognizable influence of the runout distance by the block vol-            into account that the influence of roughness is also likely to

https://doi.org/10.5194/nhess-21-1159-2021                                     Nat. Hazards Earth Syst. Sci., 21, 1159–1177, 2021
1172              K. Wegner et al.: Assessing the effect of lithological setting, block characteristics and slope topography

Figure 10. Maps of classified slope inclination for the GA and DTS talus cones (a). Calculated roughness (standard deviation) based on the
TLS point clouds which are classified into 10 m classes of the runout distance. To compare these values, we normalized the runout length to
[0, 1] (b).

depend on the block size of the rockfall material. It must be           to thick-bedded reef limestones. Just the scatter of the data
considered that the influence of roughness for smaller par-             and the block size force the block volume and the block shape
ticles on the slope is more decisive than for larger particles          to not only be controlled by the banking, which indeed tends
that are not stopped by coarser material (Statham, 1976).               to lead to large block sizes. An additional controlling variable
                                                                        seems to be the clefting of the material. The combination of
                                                                        irregular clefting and thick banks apparently results in blocks
5   Conclusion                                                          with large volumes but different axial ratios. In contrast to
                                                                        the other test sites, the material of PF with its small block
Our investigations show a discernible relationship between              sizes and low axial ratios differs clearly. Here, the thin strat-
the lithology and the characteristics of the rockfall material          ification of the lava material in connection with the strong
within the four test sites. We found larger blocks on the talus         tectonic stress due to frequent earthquakes and the resulting
cones of GA and DTS with their thickly banked limestones                numerous fractures in the material certainly play a signifi-
and dolomites. In contrast smaller blocks were found in ar-             cant role in block size and block shape, resulting in smaller
eas with slated and platy gneisses (ZBT) as well as in thinly           volumes and regularly shaped boulders.
layered basaltic lava material (PF).                                       Our analyses reveal a complex relation between block size
   In addition to block size, lithology also seems to have a            and block shape with respect to the runout distance of de-
significant effect on block shape. Thus, the highest axial ra-          posited blocks with divergences between different litholog-
tios were found in the ZBT area with platy gneisses. The                ical settings. Compared to other studies (Whitehouse and
limestones of DTS and GA show similar mean values and a                 McSaveney, 1983; Jomelli and Francou, 2000; Sanders et
similar scatter of data, indicating that dolomites and Wetter-          al., 2009; Luckman, 2013a; Messenzehl and Dikau, 2017;
stein limestones produce similar block sizes and block shapes           Popescu et al., 2017) and with respect to our results we can

Nat. Hazards Earth Syst. Sci., 21, 1159–1177, 2021                                      https://doi.org/10.5194/nhess-21-1159-2021
K. Wegner et al.: Assessing the effect of lithological setting, block characteristics and slope topography 1173
neither confirm nor reject the theory of gravitational sorting photographs, where point densities are high enough to re-
(Figs. 7b and 8b) as we did not find a clear relationship be- solve blocks of a certain size, which are nowadays available
tween block size and runout distance. for the whole of the Alps and mountain ranges worldwide.
But for PF, GA and DTS we can confirm a tendency to-
wards gravitational sorting to varying degrees, since blocks
with a higher block volume tend to have longer runout dis- Data availability. The data used in this study are accessible upon
tances. But we also find larger blocks with shorter runout request by contacting Kerstin Wegner (KWegner@ku.de).
distances as well as smaller blocks with longer runout dis-
tances. In contrast, almost no gravitational sorting could be
detected for the ZBT area. Author contributions. KW, FH and TH designed the conceptual
Thus and in agreement with other studies (e.g. Meißl, idea of the manuscript. KW and FH collected the terrestrial laser
scanning data on La Réunion. FH collected the TLS data of DTS,
1998; Haas et al., 2012; Glover et al., 2015; Messenzehl and
the ZBT and GA. TH contributed to statistical analysis of data. VD,
Dikau, 2017) we can assume that the block size does not NV and PK acquired the dGPS data on La Réunion. NV, PK and AP
seem to be the only controlling variable. contributed to fieldwork on La Réunion. AM contributed to the fi-
According to our findings, the axial ratio of boulders for nancial support of the travel costs to La Réunion and gave feedback
GA and DTS seems to influence the deposition of rock frag- on the analysis of data, references, results and interpretation. MB
ments on the talus cone such that blocks with increasing axial contributed to the acquisition of the terrestrial laser scanner. KW
ratios have decreasing runout distances (Pérez, 1998; Glover wrote the manuscript with discussions and improvements from all
et al., 2015; Messenzehl and Dikau, 2017; Volkwein et al., co-authors.
2018). It seems that boulders with a low axial ratio roll over
any axis and do not lose momentum, while boulders with a
high axial ratio seem to either not always place themselves Competing interests. The authors declare that they have no conflict
on the favourable axis of rotation or lose energy by tumbling of interest.
due to their unfavourable axial ratio. In our study, blocks of
the DTS study site with a low axial ratio achieve large runout
distances. For the GA study site, blocks with a low axial ra- Acknowledgements. Florian Haas kindly provided the photographs
used for Fig. 1, in particular of La Réunion, Dreitorspitze and
tio are found on the upper and on the lower part of the slope.
Zwieselbach valley. The photo of Gampenalm was taken by an
But in the case of PF and the ZBT we cannot confirm the
installed camera as part of the ERC SLIDEQUAKES project. We
hypothesis of a moderating role of the axial ratio. For both greatly appreciate the constructive comments and detailed feedback
study sites cuboid-shaped blocks as well as elongated blocks by the three anonymous referees that helped to improve the quality
are deposited over all the slopes. Whether this is due to the of this paper.
different lithological setting or the fact that GA as well as
DTS primarily includes blocks of one rockfall event, while
the blocks in PF and the ZBT represent several individual Financial support. Financial support for the fieldwork
and presumably temporally unrelated block falls, cannot fi- on La Réunion was provided by ERC-CG-2013-PE10-
nally be clarified. For this reason, singular rockfalls in differ- 617472SLIDEQUAKES. This is IPGP contribution no. 4204.
ent lithologies should be investigated in further studies. The open-access publication of this article was supported by the
The spatial roughness analysis based on the TLS point Open Access Fund of the Catholic University Eichstätt-Ingolstadt.
clouds shows a good agreement with single-block analy-
sis regarding the dependencies between runout distance and
block volume. Thus we can conclude that roughness can Review statement. This paper was edited by Yves Bühler and re-
viewed by three anonymous referees.
be used for such analysis instead of time-consuming single-
block measurements. By using roughness as a proxy for
block size, it would therefore be possible to investigate a
larger number of test areas with this method and thus to
investigate the implied relationships between lithology and References
block size in more depth in future studies. Such studies
could perhaps be supplemented by a sample analysis of block Abellán, A., Vilaplana, J. M., Calvet, J., García-Sellés, D., and
Asensio, E.: Rockfall monitoring by Terrestrial Laser Scanning
shapes. Furthermore, due to the increasing number of avail-
– case study of the basaltic rock face at Castellfollit de la Roca
able lidar data sets, it seems possible to include roughness as
(Catalonia, Spain), Nat. Hazards Earth Syst. Sci., 11, 829–841,
an additional influencing factor in a runout distance analy- https://doi.org/10.5194/nhess-11-829-2011, 2011.
sis, since information about the relief before an event would Agliardi, F. and Crosta, G. B.: High resolution three-dimensional
already be available for future rockfall events. We are quite numerical modelling of rockfalls, Int. J. Rock Mech. Min.,
sure that such a study can be carried out on the basis of ALS 40, 455–471, https://doi.org/10.1016/S1365-1609(03)00021-2,
data or photogrammetric elevation models based on aerial 2003.
https://doi.org/10.5194/nhess-21-1159-2021 Nat. Hazards Earth Syst. Sci., 21, 1159–1177, 20211174 K. Wegner et al.: Assessing the effect of lithological setting, block characteristics and slope topography Azzoni, A. and de Freitas, M. H.: Experimentally gained parame- Characterization of rockfalls from seismic signal: Insights from ters, decisive for rock fall analysis, Rock Mech. Rock Eng., 28, laboratory experiments, J. Geophys. Res.-Sol. Ea., 120, 7102– 111–124, https://doi.org/10.1007/BF01020064, 1995. 7137, https://doi.org/10.1002/2015JB012331, 2015. Bennett, G. L., Molnar, P., Eisenbeiss, H., and McArdell, B. W.: Feng, L., Pazzi, V., Intrieri, E., Gracchi, T., and Gigli, G.: Erosional power in the Swiss Alps: Characterization of slope Rockfall seismic features analysis based on in situ tests: fre- failure in the Illgraben, Earth Surf. Proc. Land., 37, 1627–1640, quency, amplitude, and duration, J. Mt. Sci., 16, 955–970, https://doi.org/10.1002/esp.3263, 2012. https://doi.org/10.1007/s11629-018-5286-6, 2019. Caine, N.: The texture of talus in Tasmania, J. Sediment. Res., Fityus, S. G., Giacomini, A., and Buzzi, O.: The sig- 37, 796–803, https://doi.org/10.1306/74D717A3-2B21-11D7- nificance of geology for the morphology of po- 8648000102C1865D, 1967. tentially unstable rocks, Eng. Geol., 162, 43–52, Caviezel, A., Demmel, S. E., Ringenbach, A., Bühler, Y., Lu, G., https://doi.org/10.1016/j.enggeo.2013.05.007, 2013. Christen, M., Dinneen, C. E., Eberhard, L. A., von Ricken- Francou, B. and Manté, C.: Analysis of the segmentation in the bach, D., and Bartelt, P.: Reconstruction of four-dimensional profile of alpine talus slopes, Permafrost Periglac., 1, 53–60, rockfall trajectories using remote sensing and rock-based ac- https://doi.org/10.1002/ppp.3430010107, 1990. celerometers and gyroscopes, Earth Surf. Dynam., 7, 199–210, Frattini, P., Crosta, G. B., and Agliardi, F.: Rockfall charac- https://doi.org/10.5194/esurf-7-199-2019, 2019. terization and modeling, in: Landslides, Types, Mechanisms Conrad, O., Bechtel, B., Bock, M., Dietrich, H., Fischer, E., Gerlitz, and Modeling, eds.: Clague, J. J. and Stead, D., Cam- L., Wehberg, J., Wichmann, V., and Böhner, J.: System for Auto- bridge University Press, Cambridge, United Kingdom, 267–281, mated Geoscientific Analyses (SAGA) v. 2.1.4, Geosci. Model https://doi.org/10.1017/CBO9780511740367.023, 2012. Dev., 8, 1991–2007, https://doi.org/10.5194/gmd-8-1991-2015, Gerber, E.: Klassifikation von Schutthalden, Geogr. Helv., 29, 73– 2015. 82, https://doi.org/10.5194/gh-29-73-1974, 1974. Copons, R., Vilaplana, J. M., and Linares, R.: Rockfall travel dis- Glover, J., Bartelt, P., Christen, M., and Gerber, W.: Rockfall- tance analysis by using empirical models (Solà d’Andorra la simulation with irregular rock blocks, in: Engineering Geology Vella, Central Pyrenees), Nat. Hazards Earth Syst. Sci., 9, 2107– for Society and Territory, Volume 2, eds.: Lollino, G., Giordan, 2118, https://doi.org/10.5194/nhess-9-2107-2009, 2009. D., Crosta, G. B., Corominas, J., Azzam, R., Wasowski, J., and Cox, N. J.: Kernel estimation as a basic tool for geomorpho- Sciarra, N., Springer, International Publishing, Cham, Heidel- logical data analysis, Earth Surf. Proc. Land., 32, 1902–1912, berg, New York, Dordrecht, London, Switzerland, 1729–1733, https://doi.org/10.1002/esp.1518, 2007. https://doi.org/10.1007/978-3-319-09057-3_306, 2015. Crosta, G. B., Agliardi, F., Frattini, P., and Lari, S.: Key is- Gratchev, I. and Saeidi, S.: The effect of surface irregularities on sues in rock fall modeling, hazard and risk assessment for a falling rock motion, Geomechanics and Geoengineering, 14, rockfall protection, in: Engineering Geology for Society and 52–58, https://doi.org/10.1080/17486025.2018.1508857, 2019. Territory, 2, Landslide Processes, eds.: Lollino, G., Giordan, Guerin, A., Stock, G. M., Radue, M. J., Jaboyedoff, M., D., Crosta, G., Corominas, J., Azzam, R., Wasowski, J., and Collins, B. D., Matasci, B., Avdievitch, N., and Derron, M.- Sciarra, N., Springer, International Publishing, Cham, Hei- H.: Quantifying 40 years of rockfall activity in Yosemite delberg, New York, Dordrecht, London, Switzerland, 43–58, Valley with historical Structure-from-Motion photogramme- https://doi.org/10.1007/978-3-319-09057-3_4, 2015. try and terrestrial laser scanning, Geomorphology, 356, 1–18, Cui, Sh., Pei, Xj., and Huang, Rq.: Rolling motion behavior of rock- https://doi.org/10.1016/j.geomorph.2020.107069, 2020. fall on gentle slope: an experimental approach, J. Mt. Sci., 14, Haas, F., Heckmann, T., Wichmann, V., and Becht, M.: Runout anal- 1550–1562, https://doi.org/10.1007/s11629-016-4144-7, 2017. ysis of a large rockfall in the Dolomites/Italian Alps using LI- Dietze, M., Mohadjer, S., Turowski, J. M., Ehlers, T. A., and Hov- DAR derived particle sizes and shapes, Earth Surf. Proc. Land., ius, N.: Seismic monitoring of small alpine rockfalls – valid- 37, 1444–1455, https://doi.org/10.1002/esp.3295, 2012. ity, precision and limitations, Earth Surf. Dynam., 5, 653–668, Heckmann, T., Bimböse, M., Krautblatter, M., Haas, F., Becht, M., https://doi.org/10.5194/esurf-5-653-2017, 2017. and Morche, D.: From geotechnical analysis to quantification and Dietze, M., Turowski, J. M., Cook, K. L., and Hovius, N.: modeling using LiDAR data: A study on rockfall in the Reintal Spatiotemporal patterns, triggers and anatomies of seismi- catchment, Bavarian Alps, Germany, Earth Surf. Proc. Land., 37, cally detected rockfalls, Earth Surf. Dynam., 5, 757–779, 119–133, https://doi.org/10.1002/esp.2250, 2012. https://doi.org/10.5194/esurf-5-757-2017, 2017. Heiser, M., Scheidl, C., and Kaitna, R.: Evaluation con- Dorren, L. K. A.: A review of rockfall mechanics and cepts to compare observed and simulated deposition ar- modelling approaches, Prog. Phys. Geog., 27, 69–87, eas of mass movements, Comput. Geosci., 21, 335–343, https://doi.org/10.1191/0309133303pp359ra, 2003. https://doi.org/10.1007/s10596-016-9609-9, 2017. Durand, V., Mangeney, A., Haas, F., Jia, X., Peltier, A., Hib- Hergarten, S., Robl, J., and Stüwe, K.: Extracting topographic swath ert, C., Ferrazzini, V., Kowalski, P., Lauret, F., Brunet, C., profiles across curved geomorphic features, Earth Surf. Dynam., Satriano, C., Wegner, K., Delorme, A., Bonilla, F., and Vil- 2, 97–104, https://doi.org/10.5194/esurf-2-97-2014, 2014. leneuve, N.: On the link between external forcings and slope Hibert, C., Mangeney, A., Grandjean, G., and Shapiro, N. M.: Slope instabilities in the Piton de la Fournaise summit crater, Re- instabilities in Dolomieu crater, Réunion island: From seismic union Island, J Geophys Res: Earth Surface, 123, 2422–2442, signals to rockfall characteristics, J. Geophys. Res., 116, 1–18, https://doi.org/10.1029/2017JF004507, 2018. https://doi.org/10.1029/2011JF002038, 2011. Farin, M., Mangeney, A., Toussaint, R., de Rosny, J., Shapiro, N., Hibert, C., Mangeney, A., Grandjean, G., Peltier, A., DiMuro, A., Dewez, T., Hibert, C., Mathon, C., Sedan, O., and Berger, F.: Shapiro, N. M., Ferrazzini, V., Boissier, P., Durand, V., and Nat. Hazards Earth Syst. Sci., 21, 1159–1177, 2021 https://doi.org/10.5194/nhess-21-1159-2021
You can also read