El Niño-Southern Oscillation and internal sea surface temperature variability in the tropical Indian Ocean since 1675 - CP
←
→
Page content transcription
If your browser does not render page correctly, please read the page content below
Clim. Past, 17, 151–170, 2021
https://doi.org/10.5194/cp-17-151-2021
© Author(s) 2021. This work is distributed under
the Creative Commons Attribution 4.0 License.

El Niño–Southern Oscillation and internal sea surface
temperature variability in the tropical Indian
Ocean since 1675
Maike Leupold1 , Miriam Pfeiffer2 , Takaaki K. Watanabe3 , Lars Reuning2 , Dieter Garbe-Schönberg2 ,
Chuan-Chou Shen4,5,6 , and Geert-Jan A. Brummer7
1 Energy   and Mineral Resources Group (EMR), Geological Institute, RWTH Aachen University,
52062 Aachen, Germany
2 Institute of Geosciences, Kiel University, 24118 Kiel, Germany
3 Department of Natural History Sciences, Faculty of Science, Hokkaido University,

Sapporo 060-0810, Japan
4 High-Precision Mass Spectrometry and Environment Change Laboratory (HISPEC), Department of

Geosciences, National Taiwan University, Taipei 10617, Taiwan
5 Research Center for Future Earth, National Taiwan University, Taipei LC6L73, Taiwan
6 Global Change Research Center, National Taiwan University, Taipei 10617, Taiwan
7 Department of Ocean Systems, Royal Netherlands Institute for Sea Research (NIOZ), and

Utrecht University, 1790 Den Burg, The Netherlands

Correspondence: Maike Leupold (maike.leupold@emr.rwth-aachen.de)

Received: 13 February 2020 – Discussion started: 4 March 2020
Revised: 7 November 2020 – Accepted: 16 November 2020 – Published: 15 January 2021

Abstract. The dominant modes of climate variability on in-     SST teleconnection in the central Indian Ocean has been sta-
terannual timescales in the tropical Indian Ocean are the El   tionary since the 17th century. To determine the symmetry of
Niño–Southern Oscillation (ENSO) and the Indian Ocean          El Niño and La Niña events, we compiled composite records
Dipole. El Niño events have occurred more frequently during    of positive and negative ENSO-driven SST anomaly events.
recent decades, and it has been suggested that an asymmet-     We find similar magnitudes of warm and cold anomalies, in-
ric ENSO teleconnection (warming during El Niño events is      dicating a symmetric ENSO response in the tropical Indian
stronger than cooling during La Niña events) caused the pro-   Ocean. This suggests that ENSO is not the main driver of
nounced warming of the western Indian Ocean. In this study,    central Indian Ocean warming.
we test this hypothesis using coral Sr/Ca records from the
central Indian Ocean (Chagos Archipelago) to reconstruct
past sea surface temperatures (SSTs) in time windows from      1   Introduction
the mid-Little Ice Age (1675–1716) to the present. Three
sub-fossil massive Porites corals were dated to the 17–18th    As the impacts of global climate change increase, paleocli-
century (one coral) and the 19–20th century (two corals).      mate research is more important than ever. The Indian Ocean
Their records were compared with a published modern coral      is of major relevance to global ocean warming as it has been
Sr/Ca record from the same site. All corals were subsampled    warming faster than any other ocean basin during the last
at a monthly resolution for Sr/Ca measurements, which were     century and is the largest contributor to the current rise of
measured using a simultaneous inductively coupled plasma       global mean sea surface temperatures (SSTs; Roxy et al.,
optical emission spectrometer (ICP-OES). Wavelet coher-        2014). Depending on the SST dataset, warming in the Indian
ence analysis shows that interannual variability in the four   Ocean is highest in the Arabian Sea (Roxy et al., 2014) or in
coral records is driven by ENSO, suggesting that the ENSO–     the central Indian Ocean (Roxy et al., 2020).

Published by Copernicus Publications on behalf of the European Geosciences Union.
152                                                  M. Leupold et al.: ENSO and internal sea surface temperature variability

   Tropical corals can be used to reconstruct past changes in      stronger than La Niña events (An and Jin, 2004; Burgers and
environmental parameters, such as SST, by measuring Sr/Ca.         Stevenson, 1999). At teleconnected sites, such as the tropi-
They can help to determine changes in past climate vari-           cal Indian Ocean, the response to respective El Niño and La
ability. Most coral paleoclimate studies covering periods be-      Niña events may also be asymmetric, as suggested by Roxy
fore 1900 conducted in the tropical Indian Ocean have pre-         et al. (2014). However, teleconnected sites may also show
dominantly focused on δ 18 O measurements (e.g., Abram et          a symmetric response to El Niño and La Niña events (e.g.,
al., 2015; Charles et al., 2003; Cole et al., 2000; Nakamura,      Brönniman et al., 2007).
et al., 2011; Pfeiffer et al., 2004). Several studies have in-        As the impact of ENSO on SST in the central Indian Ocean
cluded Sr/Ca measurements for SST reconstructions in the           is recorded by coral Sr/Ca (e.g., Pfeiffer et al., 2006), we test
central tropical Indian Ocean (Pfeiffer et al., 2006, 2009;        the hypothesis of an asymmetric ENSO teleconnection as a
Storz et al., 2013; Zinke et al., 2016), while others have fo-     driver of Indian Ocean warming during the 20th century. We
cused on the western or the eastern Indian Ocean (Abram            develop coral Sr/Ca records from three sub-fossil massive
et al., 2003, 2020; Hennekam et al., 2018; Watanabe et al.,        Porites corals covering periods of the Little Ice Age (1675–
2019) and/or on corals sampled at only bimonthly (Zinke            1716 and 1836–1867) and the mid-19th to early-20th century
et al., 2004, 2008) or annual resolution (Zinke et al., 2014,      (1870–1909) as well as from a 20th century coral core (1880–
2015). The lack of monthly resolved coral Sr/Ca data from          1995) from the central Indian Ocean (Chagos Archipelago)
the central tropical Indian Ocean limits our understanding of      to reconstruct past SST variability. In this study, the con-
its response to transregional interannual climate phenomena,       cept of “asymmetric” and “symmetric” ENSO teleconnec-
as these climate phenomena are phase-locked to the seasonal        tion refers to the magnitudes of warming and cooling during
cycle.                                                             El Niño and La Niña events., i.e., we examine whether In-
   Past El Niño–Southern Oscillation (ENSO) variability on         dian Ocean warming during El Niño events is stronger than
seasonal and interannual timescales has been reconstructed         cooling during La Niña events. First, we determine whether
using corals from different settings in the Pacific Ocean (e.g.,   ENSO variability is recorded in all coral Sr/Ca records from
Cobb et al., 2003, 2013; Freund et al., 2019; Grothe et al.,       Chagos, and we then identify past warm and cold events in
2019; Lawman et al., 2020; Li et al., 2011), where ENSO            each coral record and compile composites of warm and cold
has a strong influence on climate variability. Since the early     events. We next compare the magnitudes of positive and neg-
1980s strong ENSO events have occurred more frequently             ative ENSO-driven SST anomalies in the Chagos coral Sr/Ca
compared with past centuries (Baker et al., 2008; Freund et        records and discuss whether or not they provide evidence for
al., 2019; Sagar et al., 2016). An intensification of future ex-   an asymmetric ENSO teleconnection in the tropical Indian
treme El Niño and La Niña events under global warming is           Ocean.
supported by paleoclimate studies using corals from the cen-
tral tropical Pacific Ocean (Grothe et al., 2019). Although the
                                                                   2     Regional setting
influence of ENSO on climate variability is strongest in the
tropical Pacific Ocean, oceanic and atmospheric parameters         2.1    Location
of the Indian Ocean are also influenced by ENSO, as shown
in coral-based SST reconstructions of ENSO variability (e.g.,      The Chagos Archipelago is located in the tropical Indian
Marshall and McCulloch, 2001; Storz and Gischler, 2011;            Ocean (4–8◦ S, 70–74◦ E), about 500 km south of the Mal-
Zinke et al., 2004). Strong El Niño and La Niña events influ-      dives. It consists of several atolls with islands, submerged
ence the tropical Indian Ocean, and the existence of a stable      and drowned atolls, and other submerged banks, includ-
ENSO–SST teleconnection between the Pacific and the In-            ing the Great Chagos Bank which is the world’s largest
dian Ocean has been demonstrated in previous studies cover-        atoll (Fig. 1). The Great Chagos Bank covers an area of
ing the late 19th century and the 20th century (Charles et al.,    18 000 km2 with eight islands totaling 445 ha of land. Its la-
1997; Cole et al., 2000; Pfeiffer and Dullo, 2006; Wieners         goon has a maximum depth of 84 m and a mean depth of
et al., 2017). El Niño events cause basin-wide warming of          50 m. Due to its large size and submerged islands, water ex-
the Indian Ocean in boreal winter (December–February),             change with the open ocean is substantial. The Salomon Atoll
whereas La Niña events cause cooling (Roxy et al., 2014).          is located about 135 km towards the northeast of Eagle Is-
However, it has been suggested that El Niño events have a          land. Its atoll area is about 38 km2 and has an enclosed la-
stronger influence on the Indian Ocean SST than La Niña            goon and an island area of more than 300 ha. The greatest
events, i.e., the warming during El Niño events is larger than     depth of its lagoon is 33 m, with a mean depth of 25 m.
the cooling during La Niña events (Roxy et al., 2014). Roxy
et al. (2014) suggested that this asymmetric ENSO telecon-         2.2    Climate
nection is one reason for the warming of the western Indian
Ocean since 1900. The positive skewness of the SST in the          Chagos is situated in a region characterized by a monsoon
ENSO region of the tropical Pacific is due to ENSO asym-           climate (Sheppard et al., 2012). The northeast monsoon in
metry, i.e., it reflects the fact that El Niño events are often    austral summer is the wet season, and it lasts from October to

Clim. Past, 17, 151–170, 2021                                                          https://doi.org/10.5194/cp-17-151-2021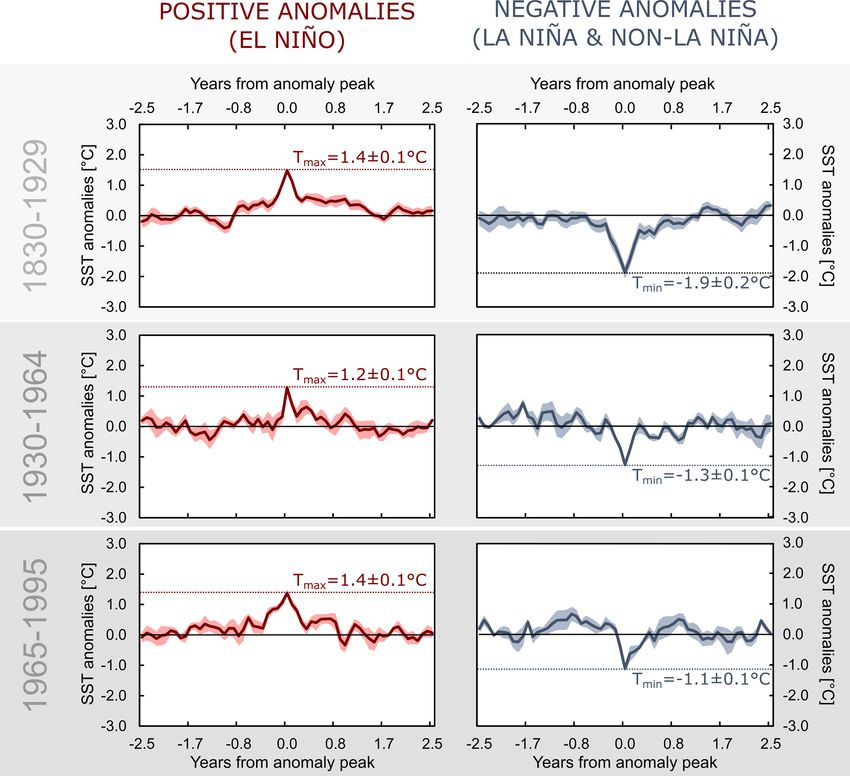
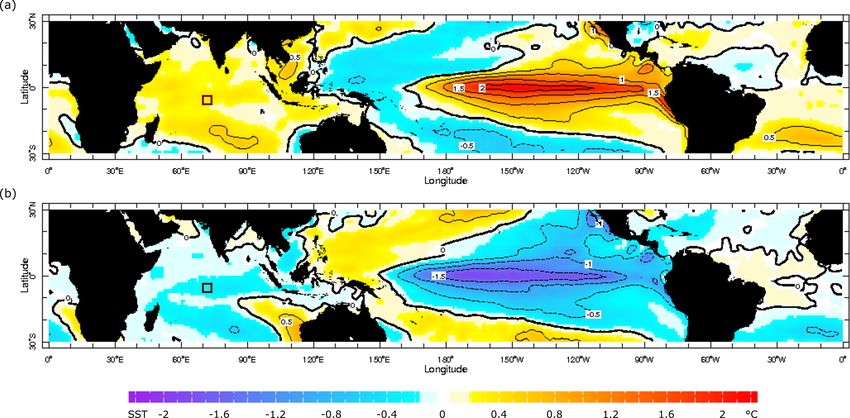
M. Leupold et al.: ENSO and internal sea surface temperature variability                                                               153

Figure 1. Location of study area and coral sample locations. The Chagos Archipelago is located in the central Indian Ocean, about 550 km
south of the Maldives (map upper left). Fossil coral samples were collected on Eagle Island and on Boddam Island (Salomon Atoll; red stars).

February (Pfeiffer et al., 2004). Light to moderate northwest           is displaced towards the east resulting in cooler than nor-
trade winds blow. From April to October, strong winds from              mal SSTs in the western Pacific and basin-wide warming
the southeast dominate (Sheppard et al., 1999).                         of the Indian Ocean (Izumo et al., 2014; Sheppard et al.,
   Chagos lies at the eastern margin of the so-called                   2013). Figure 2 compares the positive SST anomalies dur-
Seychelles–Chagos thermocline ridge (SCTR). In the SCTR,                ing El Niño events with the negative SST anomalies dur-
a shallow thermocline causes open-ocean upwelling of cold               ing La Niña events in the Indian and Pacific oceans between
waters. Upwelling along this region was first identified by             1982 and 2016, as inferred from “Reynolds” OI v2 SST data
McCreary et al. (1993) and is forced by both negative and               (Reynolds et al., 2002; averaged over December–February).
positive wind stress curl (Hermes and Reason, 2009; Mc-                 An ENSO response in the tropical Indian Ocean can be ob-
Creary et al., 1993). Compared with other upwelling regions             served. However, this response is not as strong as it is in the
in the Indian Ocean, the SSTs of the SCTR are relatively high           Pacific Ocean.
(between 28.5 and 30 ◦ C in austral summer). This causes                   Coupled ocean–atmosphere instabilities centered in the
very strong air–sea interactions (e.g., Hermes and Reason,              tropical Indian Ocean result in Indian Ocean Dipole (IOD)
2008; Vialard et al., 2009).                                            events (Saji et al., 1999; Sheppard et al., 2013; Webster et al.,
   On interannual timescales, the dominant mode of climate              1999). A negative (positive) IOD event is defined by warmer
variability in the SCTR is the El Niño–Southern Oscillation             (cooler) than normal SSTs in the eastern part of the Indian
(ENSO). During El Niño events, the West Pacific warm pool               Ocean and cooler (warmer) than normal SSTs in the west-

https://doi.org/10.5194/cp-17-151-2021                                                                  Clim. Past, 17, 151–170, 2021
154                                                    M. Leupold et al.: ENSO and internal sea surface temperature variability

Figure 2. Composite maps of SST anomalies [◦ C] in the Indian and Pacific oceans during El Niño and La Niña events. (a) El Niño SST
anomalies for the period from 1982 to 2016 averaged over December to February. Panel (b) is the same as panel (a) but for La Niña events.
SST anomaly maps were computed with NOAA “Reynolds” OI v2 SST (Reynolds et al., 2002) using the free Data Views web application
from the IRI Data Library (available at: https://iridl.ldeo.columbia.edu/, last access: 17 September 2018; IRI/LDEO, 2018). Red squares
indicate the location of the study area. An overview of all events used for each composite map can be found in Table S1 in the Supplement.

ern Indian Ocean. Several studies showed that the IOD is               cantly different (t value = 0.27; p value = 0.79). Averaged
an inherent mode of variability of the Indian Ocean (e.g.,             over the entire area of the Chagos Archipelago (4–8◦ S, 70–
Ashok et al., 2003; Krishnaswamy et al., 2015; Saji et al.,            74◦ E), SSTs are similar to SSTs measured in the lagoon.
1999; Webster et al., 1999). The instrumental record of past           Long-term monthly SST anomalies (i.e., mean seasonal cy-
IOD events does not go back further than 1960 (Saji and                cle removed) reveal that interannual SST anomalies, such
Yamagata, 2003). Coral-based reconstructions of past IOD               as the El Niño event in 1997/1998 or the La Niña event
events covering the past millennium suggest a recent intensi-          in 2010/2011, have the same magnitude in both lagoon and
fication of the IOD (Abram et al., 2008, 2020). Those corals           open-ocean settings (Fig. 3b). Both anomaly records are not
show few strong IOD events (i.e., 2019, 1997/1998, 1961,               significantly different (t value = 0.34; p value = 0.37). This
1877/1878, and 1675), of which only three events (2019,                suggests that the magnitudes of interannual signals at Chagos
1961, and 1675) occur independently of ENSO. Considering               should be recorded consistently in all coral records analyzed
that an anomaly event recorded by corals can indicate both             in this study.
positive and negative IOD and El Niño and La Niña events,
respectively, and that both phenomena tend to occur together
                                                                       2.4   ENSO indices
(e.g., Luo et al., 2010; Saji and Yamagata, 2003), we decided
to treat positive SST anomaly events found in our records as           The instrumental record of past El Niño and La Niña events
El Niño events even if they could be a result of IOD events            is restricted to the late-19th and early-20th centuries. Re-
independent of or co-occurring with El Niño and La Niña                constructions of past ENSO events differ depending on the
events.                                                                statistics and/or proxies used (see, e.g., Wilson et al., 2010,
                                                                       and Brönnimann et al., 2007, for a discussion). Therefore,
2.3   Instrumental data                                                we compare our coral data with different ENSO indices
                                                                       presented briefly in the following. The study of Wilson et
Analysis of SST determined from the Advanced Very                      al. (2010) reconstructed an annually resolved Niño 3.4 in-
High Resolution Radiometer (AVHRR) satellite SST prod-                 dex of past El Niño and La Niña events back to 1607, be-
uct (Casey et al., 2010) for the varying grid areas in Cha-            yond the instrumental era, using data from the central Pacific
gos – open ocean (7.13–7.63◦ S, 72.13–72.63◦ E) and lagoon             (corals), the Texas–Mexico region of the USA (tree rings)
(5.13–5.63◦ S, 71.63–72.13◦ E) – reveals different SST sea-            and other regions in the tropics (corals and an ice core),
sonality at Chagos depending on the reef setting (Fig. 3; cf.          which we will refer to as the “Wilson Niño index”. We use
Leupold et al., 2019). At the open-ocean reefs, where up-              the Wilson Niño index for comparison with our coral SST
welling occurs, seasonal minima in SSTs are colder than in             records performing wavelet coherence analysis in the time
the lagoon, whereas maximum temperatures are not signifi-              domain (see Sect. 4.4). Data on the occurrence and mag-

Clim. Past, 17, 151–170, 2021                                                               https://doi.org/10.5194/cp-17-151-2021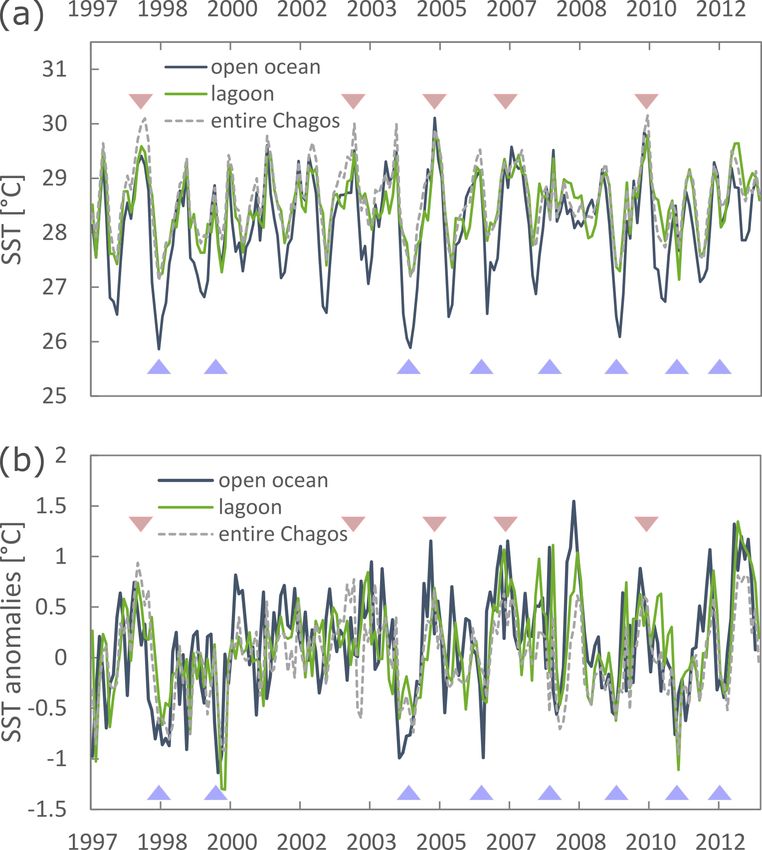
M. Leupold et al.: ENSO and internal sea surface temperature variability                                                         155

                                                                       3     Methods and materials

                                                                       3.1    Coral collection and preparation

                                                                       For this study, three sub-fossil coral samples were collected
                                                                       from boulder beaches and derelict buildings of former set-
                                                                       tlements at Chagos in February 2010 (Fig. S1). The sub-
                                                                       fossil corals record 41 years of a period from the mid-Little
                                                                       Ice Age (1675–1716), which coincides with the Maunder
                                                                       Minimum, a period of reduced sunspots observations (Eddy,
                                                                       1976), 31 years of the late Little Ice Age (1836–1867), and
                                                                       39 years of the mid-19th to early-20th century (1870–1909).
                                                                       Samples E3 (1870–1909) and E5 (1675–1716) were taken
                                                                       from Eagle Island (S 6◦ 11.390 ; E 71◦ 19.580 ), an island lo-
                                                                       cated on the western rim of the Great Chagos Bank (Fig. 1).
                                                                       Sample B8 (1836–1867) was taken from the lagoon-facing
                                                                       sampling site of Boddam Island (S 5◦ 21.560 ; E 72◦ 12.340 ) in
                                                                       the southwestern part of the Salomon Atoll. The samples
                                                                       were cross-sectioned into 0.7–1.0 cm thick slabs and X-rayed
                                                                       with a Faxitron X-ray model 43885 operated at 50 keV for
                                                                       1–2
                                                                       P min and used together with a Konica Minolta Regius
Figure 3. Satellite SSTs for different settings (lagoon: green; open      RC 300 reader. From the slabs of each sub-fossil coral,
ocean: dark blue) and the entire Chagos Archipelago (gray; aver-       powder samples were drilled at 1 mm increments using a
aged over the region from 4 to 8◦ S and from 70 to 74◦ E). (a)         micro-milling machine (type PROXXON FF 500 CNC). This
Monthly satellite SST means and (b) satellite SST anomalies. For       depth resolution can be translated to a monthly temporal res-
the open-ocean and lagoon setting we used the high-resolution satel-   olution with average growth rates of 12 mm yr−1 . The sub-
lite SST product AVHRR (Casey et al., 2010), and for the en-           sampling paths were always set along the optimal growth
tire Chagos Archipelago we used NOAA “Reynolds” OI v2 SST              axis that was determined based on X-ray images (Fig. S2).
(Reynolds et al., 2002). Triangles indicate El Niño (red) and La
                                                                          Core GIM, a modern coral core, was included in the coral
Niña events (blue) based on Brönnimann et al. (2007) and the
                                                                       composite of the SCTR (Pfeiffer et al., 2017). This composite
oceanic Niño index ONI (available at: https://www.ggweather.com/
enso/oni.htm, last access: 18 October 2018; El Niño and La Niña        comprises cores from the Seychelles and Chagos. Addition-
Years and Intensities, 2018).                                          ally, the core top (1950–1995) of the GIM core has been cali-
                                                                       brated with SST (Pfeiffer et al., 2009). Core GIM was drilled
                                                                       underwater in 1995 in the lagoon of Peros Banhos, located
nitude of historical El Niño and La Niña events have been              in the northwest of Chagos, from a living coral colony. The
taken from Brönnimann et al. (2007). They combined several             monthly coral Sr/Ca record of GIM extends from 1880 to
reconstructed ENSO indices, climate field reconstructions,             1995. Analytical procedures have been described in Pfeiffer
and early instrumental data, which were evaluated for consis-          et al. (2009). In this study, we use this core to estimate the
tency. Their reconstruction period extends back to 1500 (La            magnitude of modern El Niño and La Niña events.
Niña events) and 1511 (El Niño events), respectively. We also
include the classical ENSO reconstruction of Quinn (1993)
based on historical observations of various aspects of ENSO,           3.2    Coral Sr/Ca analysis
which extends back until 1500. Both records (Brönnimann et             Sr/Ca measurements were performed at Kiel University us-
al., 2007; Quinn, 1993) cover all our coral time windows, in-          ing a Spectro Ciros CCD SOP (coupled device chips stan-
cluding our 17th century coral record. By including the orig-          dard operating procedure) inductively coupled plasma op-
inal list of Quinn (1993), alongside the updated list of Brön-         tical emission spectrometer (ICP-OES) following a com-
nimann et al. (2007), we aim to evaluate the sensitivity of            bination of techniques described by Schrag (1999) and
our analysis to different ENSO reconstructions. We use both            de Villiers et al. (2002). Elemental emission signals were
indices by Brönnimann et al. (2007) and Quinn (1993) for               simultaneously collected and subsequently drift corrected
identifying past warm and cold events in each coral record             by sample–standard bracketing every six samples. Be-
that we then use to compile composites (see Sect. 4.5).                tween 0.13 and 0.65 mg of coral powder was dissolved in
                                                                       1.00 mL 0.2 M HNO3 . Before analysis, the solution was di-
                                                                       luted with 0.2 M HNO3 to a final concentration of approxi-
                                                                       mately 8 ppm calcium. Strontium and calcium intensity lines
                                                                       used are 421 and 317 nm, respectively. The intensities of

https://doi.org/10.5194/cp-17-151-2021                                                               Clim. Past, 17, 151–170, 2021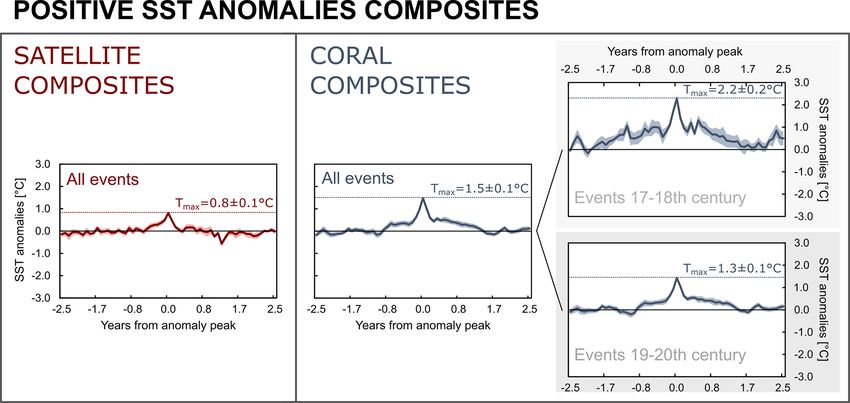
156 M. Leupold et al.: ENSO and internal sea surface temperature variability
strontium and calcium were converted into Sr/Ca ratios in
secular equilibrium, with the crustal 232 Th/238 U value of 3.8. The errors are arbitrarily assumed to be 50 %.
indicated by the [230 Th/232 Th] atomic ratio instead of the activity ratio. e Age corrections, relative to chemistry date, for samples were calculated using an estimated atomic 230 Th/232 Th ratio of 4 ± 2 ppm. Those are the values for a material at
δ 234 Uinitial = δ 234 Umeasured Xeλ234 × T , and T is the corrected age. c [230 Th/238 U]activity = 1 − e−λ230 T + (δ 234 Umeasured /1000)[λ230 /(λ230 − λ234 )](λ − e−(λ230λ234)T ), where T is the age. d The degree of detrital 230 Th contamination is
Analytical errors are 2σ of the mean. a [238 U] = [235 U] × 137.818 (± 0.65 ‰) (Hiess et al., 2012); δ 234 U = ([234 U/238U ]activity − 1) × 1000. b The δ 234 Uinitial corrected value was calculated based on the 230 Th age (T ), i.e.,
2003), and instrumental analyses were carried out on MC-ICP-MS (Thermo Electron Neptune) at NTU (Shen et al., 2012).
1909) measured. Location of measurement numbers are indicated on X-ray images in Fig. S2. Chemical analyses were performed on 11 March 2016 and on 16 July 2017 (Shen et al.,
Table 1. Overview of uranium and thorium isotopic compositions and 230 Th ages and corresponding years for fossil coral samples E5 (1675–1716), B8 (1836–1867), and E3 (1870–
E3 (1870–1909)
B8 (1836–1867)
E5 (1675–1716)
Sample ID
millimole per mole (mmol/mol). Before and after each mea-
surement sequence (n = 448 measurements), a stack of eight
different reference materials, including international refer-
ence materials, JCp-1, and JCt-1 (Hathorne et al., 2013),
were measured and used for calibration. For drift correc-
tion, an in-house coral reference standard (Mayotte coral)
2nd
1st
2nd
1st
2nd
1st
no.
Measurement
was used. The average analytical precision of Sr/Ca de-
terminations is 0.08 % relative standard deviation (RSD) or
0.008 mmol mol−1 (n = 1973), translating into a temperature
of around 0.1 ◦ C. The reproducibility of Sr/Ca ratios from
2551.9 ± 2.5
2386.1 ± 2.1
2212.7 ± 2.5
2293.9 ± 2.2
2265.7 ± 2.3
multiple measurements both on the same day and on consec-
2694 ± 2.8
utive days is 0.08 % RSD (n = 238; 1SD), translating into a
(ppba )
temperature uncertainty of around 0.1 ◦ C.
238 U
3.3 Chronology
515.4 ± 1.4
56.7 ± 3.9
37.1 ± 4.1
16.1 ± 1.3
74.1 ± 3.0
643 ± 2
232 Th
Each sub-fossil coral sample was dated by U–Th in
(ppt)
2016. U–Th isotopic measurements were performed with a
multicollector-inductively coupled plasma mass spectrome-
(measureda )
144.7 ± 1.7
145.4 ± 1.3
146.2 ± 1.3
144.1 ± 1.5
145.0 ± 1.6
146.4 ± 1.3
ter (MC-ICP-MS; Thermo Electron Neptune) in the High-
Precision Mass Spectrometry and Environment Change Lab-
d234 U
oratory (HISPEC) of the Department of Geosciences, Na-
tional Taiwan University (NTU), following techniques de-
0.001194 ± 0.000025
0.001650 ± 0.000029
0.001872 ± 0.000023
0.003594 ± 0.000018
0.003250 ± 0.000019
scribed in Shen et al. (2012). U–Th isotopic compositions
and concentrations are listed in Table 1.
0.0015 ± 0.00002
[230 Th /238 U]
Sample E5 covers the period from 1675 to 1716 and is
hereafter referred to as E5 (1675–1716); sample B8 covers
(activityc )
the period from 1836 to 1867 and is hereafter referred to
as B8 (1836–1867); and E3 covers the period from 1870 to
1909 and is hereafter referred to as E3 (1870–1909). The un-
[230 Th /232 Th]
certainties of the age models are approximately ± 1.9 years
(E5), ± 2.2 years (B8), and ± 2.4 years (E3). All age mod-
1840 ± 203
8458 ± 675
1639 ± 66
886 ± 64
els were verified by a second, independently measured U–Th
106 ± 1
126 ± 2
(ppmd )
age of each sample (measured in 2017 in the HISPEC lab-
oratory of the Department of Geosciences, NTU), following
techniques described in Shen et al. (2012). These age deter-
(uncorrected)
113.8 ± 2.4
157.1 ± 2.8
178.5 ± 2.2
342.8 ± 1.8
309.5 ± 1.9
minations are consistent with our Sr/Ca chronologies.
146 ± 2
The chronology of the samples was developed based on
Age
seasonal cycles of coral Sr/Ca and by analyzing the density
bands visible on X-ray images (Fig. S2). We assigned the
(correctedc,e )
highest Sr/Ca value to the SST minimum of each year and
113.3 ± 2.4
152.1 ± 3.7
178.1 ± 2.2
342.6 ± 1.8
308.8 ± 1.9
141 ± 3.2
interpolated linearly between these anchor points to obtain a
time series with equidistant time steps.
Age
3.4 Diagenesis screening
(correctedb )
145.4 ± 1.3
146.2 ± 1.3
144.2 ± 1.5
145.2 ± 1.6
146.6 ± 1.3
d234 Uinitial
145 ± 1.7
A combination of X-ray diffraction (XRD) and optical as
well as scanning electron microscopy (SEM) was used to
investigate potential diagenetic alteration in the sub-fossil
coral samples from Chagos that may have affected the Sr/Ca
Corresponding
values (Figs. S3–S5). Representative samples for diagenesis
1903 ± 2.4
1865 ± 3.7
1838 ± 2.2
1706 ± 1.9
1876 ± 3.2
1674 ± 1.8
year (BP)
screening were selected from all corals based on the X-ray
images.
Clim. Past, 17, 151–170, 2021 https://doi.org/10.5194/cp-17-151-2021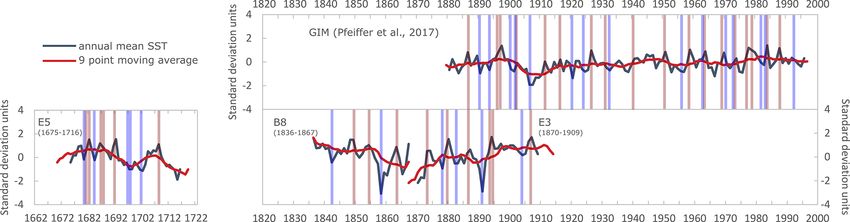
M. Leupold et al.: ENSO and internal sea surface temperature variability                                                     157

   For each coral sample, diagenetic modifications were an-      tributed, thin aragonite cement (Fig. S4). The thin section
alyzed using one thin section, one sample for SEM, one 2-        of E3 (1870–1909) is devoid of diagenetic phases (Fig. S5),
D XRD measurement and one powder XRD measurement.                but the dissolution of centers of calcification can be seen in
The Bruker D8 ADVANCE GADDS 2-D XRD system at the                some areas (Fig. S5c–d). Slight dissolution and microborings
Rheinisch-Westfaelische Technische Hochschule (RWTH),            are also visible with SEM (Fig. S5f). However, microborings
Aachen, was used for non-destructive XRD point measure-          are always open and therefore will not influence the geo-
ments directly on thin-section blocks with a calcite detection   chemistry. In summary, diagenesis screening revealed that
limit of ∼ 0.2 % (Smodej et al., 2015).                          the coral samples are suitable for conducting geochemical
                                                                 analysis, and diagenetic modifications to the Sr/Ca records
3.5    Statistics                                                should be negligible.

All coral Sr/Ca records were centered, i.e., normalized with
                                                                 4.2 Sr/Ca measurements
respect to their mean values (Pfeiffer et al., 2009), and
translated into SSTs using a temperature dependence of           Table 2 gives an overview of the Sr/Ca ratios of each sub-
−0.06 mmol mol−1 per 1 ◦ C for Porites corals at Chagos (Le-     fossil coral core and statistical key figures of the records. The
upold et al., 2019; Pfeiffer et al., 2009).                      monthly Sr/Ca time series are shown in Fig. 4.
   Wavelet coherence plots between the coral Sr/Ca records          A total of 472 subsamples from E5 (1675–1716)
and the Wilson Niño index were generated using the MAT-          were measured for Sr/Ca. The average Sr/Ca value was
LAB (version R2019b) software toolboxes by Grinstedt             8.96 ± 0.07 mmol mol−1 . The minimum Sr/Ca value over
et al. (2004) to assess whether the interannual variability      the 41-year sample span was 8.73 mmol mol−1 , and the max-
recorded in the corals is related to ENSO.                       imum value was 9.14 mmol mol−1 . From B8 (1836–1867),
   Composites of El Niño and La Niña events were generated       Sr/Ca ratios of 375 subsamples were measured. The average
by calculating the mean of positive and negative anomaly         value was 9.02 ± 0.07 mmol mol−1 . The maximum Sr/Ca
events taken from centered monthly coral SST anomaly             value for the 31-year sample span was 9.36 mmol mol−1 ,
records (see Sect. 4.5). By centering the coral records to       and the minimum Sr/Ca value was 8.85 mmol mol−1 .
their mean and focusing on interannual variability, we elim-     For E3 (1870–1909), Sr/Ca measurements were con-
inate the largest uncertainty of single-core Sr/Ca records, as   ducted on 415 subsamples. The average Sr/Ca value was
shown by Sayani et al. (2019).                                   8.95 ± 0.06 mmol mol−1 for the 39-year sample span, with
   The t tests were conducted using the “t test Calculator”      the minimum value being 8.79 mmol mol−1 and the maxi-
free web application (GraphPad QuickCalcs, 2019; available       mum value being 9.17 mmol mol−1 .
at https://www.graphpad.com/quickcalcs/ttest1/, last access:        The maximum ranges among the corals vary: E5 (1675–
9 April 2019). These tests were used to determine if the mean    1716) has the greatest range and E3 (1870–1909) has the
values of two datasets, e.g., mean annual cycles in Sect. 4.3    smallest one. It can be seen that mean and median values are
or mean anomalies of coral composites in Sect. 4.5, are sig-     the same, i.e., these corals are not biased towards one sea-
nificantly different from each other.                            son. Sample B8 (1836–1867) has a different mean than E5
   As the significance of the monthly mean anomalies cal-        (1675–1716) and E3 (1870–1909). This underlines the ne-
culated for the composite records depends on the number of       cessity to center the coral records to their mean to eliminate
events, the standard errors (SEs) for monthly mean anomaly       the uncertainty of single-core Sr/Ca records, as explained in
values were used and calculated as follows:                      Sect. 3.5.
     standard deviation (σ )
SE = √                                                     (1)   4.3   Decadal variability and seasonal cycle
       number of events (n)
                                                                 All coral SST records show variability on decadal scale
4     Results and Interpretation                                 (Fig. 4). This variability with a periodicity of 9–13 years
                                                                 has previously been described in studies of Indian Ocean
4.1    Diagenesis                                                corals (Charles et al., 1997; Cole et al., 2000; Pfeiffer et al.,
                                                                 2006, 2009; Zinke et al., 2008). Within a decadal cool (warm)
Only trace amounts of diagenetic phases were detected in
                                                                 phase, negative (positive) SST anomalies may occur. In par-
the sub-fossil coral samples, which show a good to excel-
                                                                 ticular, high-amplitude, short-term cool events are possible
lent preservation according to the criteria defined in Cobb
                                                                 as Chagos lies in a region where open-ocean upwelling oc-
et al. (2013). Isolated scalenohedral calcite cement crys-
                                                                 curs (see Leupold et al., 2019). To ensure that decadal vari-
tals were observed in the thin section of E5 (1675–1716)
                                                                 ability does not influence the composite records by inflating
(Fig. S3a–d). However, XRD results and SEM analysis con-
                                                                 interannual warm or cool anomalies, decadal variability is
firm that the calcite abundance is below the detection limit
                                                                 removed by detrending the coral records.
of XRD (0.2 %) in this sample (Fig. S3e–f). The thin sec-
tion of B8 (1836–1867) shows trace amounts of patchily dis-

https://doi.org/10.5194/cp-17-151-2021                                                         Clim. Past, 17, 151–170, 2021
158 M. Leupold et al.: ENSO and internal sea surface temperature variability
Table 2. Statistical overview of raw Sr/Ca data.
Sample Number of Sr/Ca [mmol/mol] Median RSD∗
subsamples [%]
Mean Median SD Min. Max. Range
E5 (1675–1716) 472 8.96 8.96 0.07 8.73 9.14 0.410 0.076
B8 (1836–1867) 375 9.02 9.02 0.07 8.85 9.36 0.506 0.075
E3 (1870–1909) 415 8.95 8.95 0.06 8.79 9.17 0.376 0.074
∗ RSD is the relative standard deviation.
Figure 4. Monthly Sr/Ca records (blue lines; converted into coral Sr/Ca–SST in ◦ C) of E5 (1675–1716), B8 (1836–1867), and E3 (1870–
1909) with error bars indicating the standard deviation (± 2σ ) of Sr/Ca ratios from multiple measurements on the same day and on consec-
utive days and mean annual cycles (black lines and corresponding standard errors highlighted in gray, lower plot).
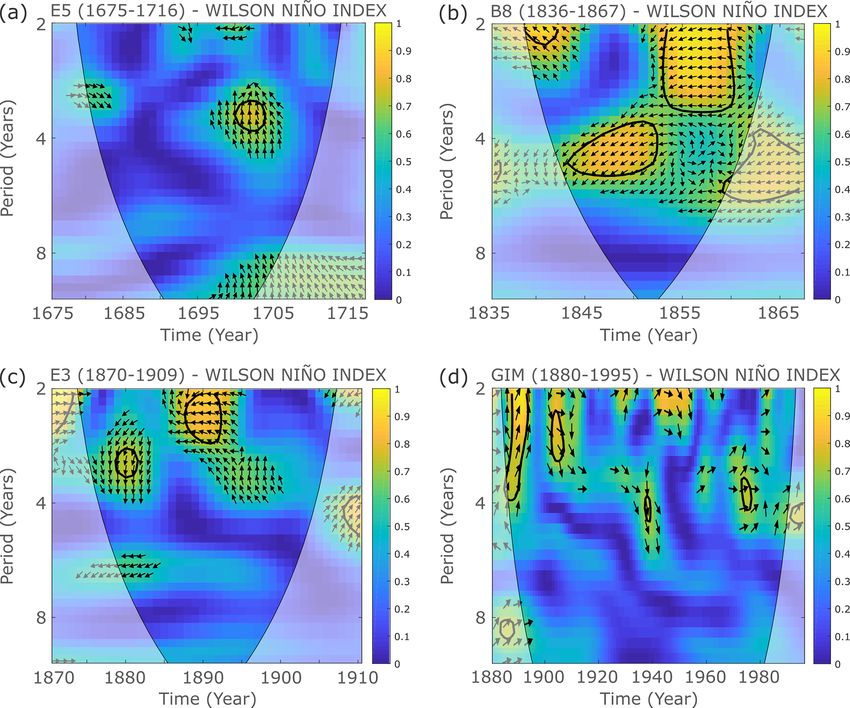
The mean annual cycles of all sub-fossil coral SST records frequency space where the Wilson Niño index and the Cha-
are not significantly different, as indicated by p values of gos coral SST records covary, even if they do not have high
around one in the t tests (Table 3, Fig. 4). The seasonal am- power in those regions (Fig. 6).
plitudes in coral SST (◦ C) are slightly higher in E5 (1675– All WTC plots of the Wilson Niño index and coral SST
1716) (1.99 ◦ C) than in B8 (1836–1867) (1.81 ◦ C) and E3 records reveal time-localized areas of strong coherence oc-
(1870–1909) (1.71 ◦ C). A shift of the seasonal temperature curring in periods that correspond to the characteristic ENSO
maximum from February (E5 and B8) to April (E3) can be cycles of 2 to 8 years. The WTC plots for the Wilson Niño
observed (Fig. 4). Seasonal amplitudes explain 26 %–32 % of index and the 19–20th century coral records show several re-
the coral–SST variance (see in the Supplement and Fig. S6). gions where both time series covary. In contrast, the WTC
plot of the Wilson Niño index and the 17–18th century coral
4.4 ENSO signals in coral SST records SST record shows only one region of covariation at the be-
ginning of the 18th century. The plots show that there is an
The modern and the sub-fossil coral SST records were com- approximate lag of 9 months to 1 year between the 17–18th
pared with the annually resolved Wilson Niño index that ex- century coral SST record and the Wilson Niño index (Fig. 6a)
tends back until 1607 (Wilson et al., 2010). All coral records and a lag of approximate 1 to 3 years between B8 (1836–
show positive and negative SST anomalies, which occur in 1867) and E3 (1870–1909) and the Wilson Niño index, re-
years where El Niño and La Niña events have been reported spectively (Fig. 6b, c). However, the lags between the coral
(Fig. 5) and wavelet power spectra show significant interan- SST and the index time series are in the range of the age
nual variability in the ENSO frequency band (Fig. S7). To model uncertainties of the sub-fossil corals and do not repre-
analyze a possible correlation between the coral SST records sent real time lags. For a further comparison of the coral SST
and ENSO, wavelet coherence (WTC) was conducted on records’ and the Wilson Niño index’s frequencies, singular
all coral records and the Wilson Niño index (Wilson et al.,
2010). WTC plots were generated to find regions in time-
Clim. Past, 17, 151–170, 2021 https://doi.org/10.5194/cp-17-151-2021M. Leupold et al.: ENSO and internal sea surface temperature variability 159
Table 3. Statistical overview for mean annual cycle data of the coral Sr/Ca–SST [◦ C] records.
Sample Max. Min. Amplitude Mean SD∗ p value of (two-tailed) t test
E5 (1675– B8 (1836– E3 (1870–
1716) vs. 1867) vs. 1909) vs.
E5 (1675–1716) 0.70 −1.29 1.99 0.0026 0.5459 0.9979 0.9991
B8 (1836–1867) 0.61 −1.21 1.82 0.0033 0.5450 0.9979 0.9969
E3 (1870–1909) 0.60 −1.11 1.71 0.0024 0.5089 0.9991 0.9969
∗ SD is the standard deviation.
Figure 5. Annual SST anomalies for Chagos corals (this study and core GIM from Pfeiffer et al., 2009, 2017); red indicates El Niño,
blue indicates La Niña, and shaded boxes indicate years used for the composite records (Figs. 7–9). Thick red lines are nine-point moving
averages. See text Sect. 4.5 for how El Niño and La Niña events were picked.
spectrum analysis and power spectra of non-detrended and and every 5 years in Brönnimann et al. (2007; 1965–1995).
detrended time series were computed (see the Supplement). During the 17–18th century, negative SST anomalies oc-
All coral records show anomaly events that can be ex- curred every 6.8 years (coral record) or 10.3 years (Brön-
plained with El Niño and La Niña events listed in Brönni- nimann et al., 2007; Tables 4–6).
mann et al. (2007) or Quinn (1993; Tables 4–6). Our results
show that, compared to the 17–18th century, more El Niño
and La Niña events per period are recorded in coral records 4.5 ENSO composites
of the central Indian Ocean during the late 20th century.
According to the AVHRR satellite data and coral records, Composites of monthly coral SST anomalies were produced
an El Niño event occurs on average every 4 years between for El Niño and La Niña events to assess their magnitudes.
1981 and 2017 (AVHRR) or every 5 years between 1965 Each composite was produced using coral records of several
and 1995 (coral record), respectively (Tables 4–6). This is individual El Niño and La Niña events. An overview of the
supported by the events listed in Quinn (1993) and reflects events used for generating each composite can be found in
a change in ENSO frequency in the tropical Pacific. Over- Tables 4 and 5. An overview of all events found in the coral
all, predominantly strong El Niño events are recorded by the Sr/Ca records and of El Niño and La Niña events listed in
coral records from Chagos, as indicated in the list of events Brönnimann et al. (2007) and Quinn (1993) for the studied
presented in Brönnimann et al. (2007; Table 6). The number time period is given in Table 6. Positive SST anomalies in the
of events listed in Brönnimann et al. (2007) is comparable coral records were interpreted as El Niño events when (1) the
to the number of events recorded in the corals, whereas the year of occurrence was listed as an El Niño event in Brönni-
number of events listed in Quinn (1993) is higher than the mann et al. (2007) and Quinn (1993) within the error of each
number of events recorded in the corals. The same holds for coral age model and (2) when the anomaly exceeded 1.5 stan-
the negative SST anomaly events (La Niña and non-La Niña dard deviations of the mean of each coral record (Fig. S8). In
events): the number of La Niña events listed in Brönnimann addition to the strong La Niña events listed in Brönnimann
et al. (2007) is similar to the number of negative anomaly et al. (2007), we added negative SST anomalies occurring in
events recorded in the coral records. Furthermore, negative years after the El Niño events to the composite.
anomaly events occurred every 2.6 years in the AVHRR data The composite record for El Niño events comprises 35
(1981–2017), every 6 years in the coral record (1965–1995), events, and 31 events are included in the La Niña composite
(Table 4). To investigate changes in the magnitude of ENSO
https://doi.org/10.5194/cp-17-151-2021 Clim. Past, 17, 151–170, 2021160 M. Leupold et al.: ENSO and internal sea surface temperature variability
Figure 6. Wavelet coherence analysis plots for the Wilson Niño index (Wilson et al., 2010) and Chagos coral SST of (a) E5 (1675–1716),
(b) B8 (1836–1867), (c) E3 (1870–1909), and (d) GIM (1980–1995).
anomalies over time, composites for the respective 17–18th La Niña. La Niña and negative anomalies other than La Niña
century and 19–20th century time periods were generated. events were selected based on the months they occurred in,
For the 17–18th century, six events (five events) were used i.e., November–May (La Niña) and June–September (non-La
for the El Niño (La Niña) composite. The composite for the Niña). As such, events are also observed in the satellite era,
19–20th century includes events from the sub-fossil corals and we compared modern (1981–2018) satellite SST com-
and the GIM record. In total, 29 events (26 events) were used posites for El Niño events (nine events), La Niña events (10
for the El Niño (La Niña) composite. These 19–20th century events), and negative anomalies other than La Niña events
composites, in turn, were split into three subperiods: 1830– (four events) with our coral SST composites. We used the
1929 (18 El Niño events, 16 La Niña events), 1930–1964 AVHRR satellite SSTs (Casey et al., 2010) averaged over the
(five El Niño events, five La Niña events; Table 5), and 1965– entire Chagos Archipelago (4–8◦ S, 70–74◦ W).
1995 (six El Niño events, five La Niña events). These subpe-
riods were selected because ENSO activity was reduced be-
tween 1930 and 1965 compared with before 1930 and after 4.5.1 Positive anomalies in coral and satellite SST
1965 (e.g., Cole et al., 1993). composites
Observations indicate that some upwelling events in the
central Indian Ocean are not forced by large-scale ENSO or The central Indian Ocean coral composites of positive SST
IOD variability but are associated with cyclonic wind stress anomalies reveal higher SST anomalies during El Niño
curls in the southern tropical Indian Ocean (Dilmahamod et events than the satellite composites (Fig. 7), which may re-
al., 2016; Hermes and Reason, 2009). Such an upwelling flect the greater sensitivity of the corals to reef-scale tem-
event occurred in August 2002 and was found in both the peratures (Leupold et al., 2019) or the different time peri-
coral and satellite SST records at Chagos (see Leupold et al., ods covered by these records (only two El Niño events in the
2019). AVHRR record overlap with the coral data). The coral com-
To investigate the potential effect of such negative posite of the 17–18th century shows higher anomalies than
anomaly events on the La Niña composites, the 19–20th cen- the coral composite of the 19–20th century (Fig. 7). All pos-
tury composites were split into composites of La Niña events itive SST anomalies identified as El Niño events in the coral
and other negative anomaly events, which were not related to records show an average warming of 1.5 ± 0.1 ◦ C (n = 35;
Fig. 7). The average positive temperature anomaly during El
Clim. Past, 17, 151–170, 2021 https://doi.org/10.5194/cp-17-151-2021M. Leupold et al.: ENSO and internal sea surface temperature variability 161
Table 4. Positive (El Niño events) and negative (La Niña events, LN, shown using bold font; and non-La Niña events, NLN, shown using
italic font) SST anomaly events picked for generating coral and satellite composite records shown in Figs. 7 and 8.
Composite Years with events Number of Records used
events
All events 1679, 1682, 1686, 1687, 1691, 35 E5 (1675–1716),
1708, 1849, 1853, 1863, 1873, B8 (1836–1867),
1879, 1881, 1886 (2 ×), 1889, E3 (1870–1909),
1894, 1895, 1896, 1897, 1902, GIM (1880–1995)
1907, 1911, 1916, 1926, 1932,
1940, 1951, 1958, 1963, 1969,
1973, 1977, 1979, 1983, 1987
Positive SST Coral 17–18th 1679, 1682, 1686, 1687, 1691, 6 E5 (1675–1716)
anomalies composites century 1708
19–20th 1849, 1853, 1863, 1873, 1879, 29 B8 (1836–1867),
century 1881, 1886 (2 ×), 1889, 1894, E3 (1870–1909),
1895, 1896, 1897, 1902, 1907, GIM (1880–1995)
1911, 1916, 1926, 1932, 1940,
1951, 1958, 1963, 1969, 1973,
1977, 1979, 1983, 1987
Satellite All events 1983, 1987, 1988, 1998, 2003, 9 AVHRR SST
composite 2005, 2007, 2015, 2016 (1981–2018)
All events 1680, 1684, 1697, 1698, 1702, 31 (22 LN, E5 (1675–1716),
1846, 1858, 1860, 1865, 1872, 9 NLN) B8 (1836–1867),
1883, 1890, 1891, 1893, 1895, E3 (1870–1909),
1900, 1902, 1903, 1906, 1920, GIM (1880–1995)
1924, 1932, 1947, 1952, 1956,
1964, 1970, 1974, 1982, 1984,
1994
Negative SST Coral 17–18th 1680, 1684, 1697, 1698, 1702 5 E5 (1675–1716)
anomalies composites century
19–20th 1846, 1858, 1860, 1865, 1872, 26 (19 LN, B8 (1836–1867),
century 1883, 1890, 1891, 1893, 1895, 7 NLN) E3 (1870–1909),
1900, 1902, 1903, 1906, 1920, GIM (1880–1995)
1924, 1932, 1947, 1952, 1956,
1964, 1970, 1974, 1982, 1984,
1994
Satellite All events 1984, 1989, 1989, 1992, 1995, 14 (10 LN, AVHRR SST
composite 1996, 1998, 2000, 2004, 2008, 4 NLN) (1981–2018)
2011, 2012, 2014, 2017
Niño events of the 17–18th century was 2.2 ± 0.2 ◦ C (n = 6), 4.5.2 Negative anomalies in coral and satellite SST
which is higher than and significantly different (p
0.01) composites
from the average positive El Niño temperature anomaly dur-
ing the 19–20th century (1.3 ± 0.1 ◦ C; n = 29). The average No statistically significant differences were found between
positive temperature anomaly of El Niño events picked from negative anomalies in coral SST in the central Indian Ocean
the AVHRR satellite SST (covering the period from 1981 during the 17–18th century and the 19–20th century nor be-
to 2018) of 0.8 ± 0.1 ◦ C (n = 9) is also lower than and sig- tween La Niña and non-La Niña events (Fig. 8).
nificantly different (p
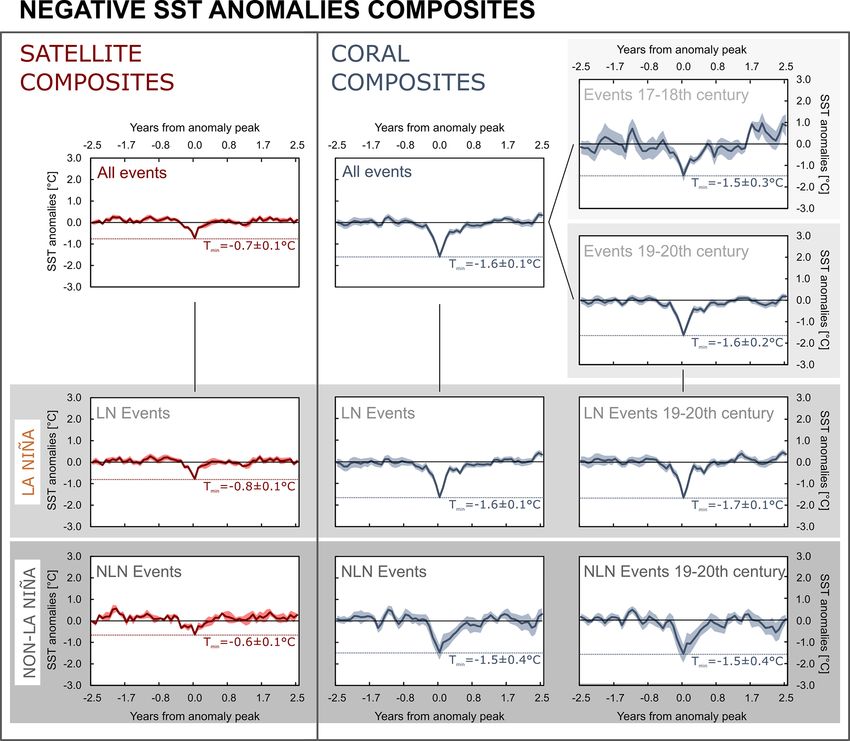
0.01) from the average positive El The composite including all negative SST anomalies iden-
Niño temperature anomaly in the 19–20th century. This sug- tified as La Niña and non-La Niña events in the coral records
gests a greater impact of El Niño events on the Indian Ocean shows an average negative SST anomaly of −1.6 ± 0.1 ◦ C
SST during the 17–18th century compared with the 19–20th (n = 31; Fig. 8). During the 19–20th century, the negative
century and recent decades. temperature anomaly for all La Niña events is −1.6 ± 0.1 ◦ C
https://doi.org/10.5194/cp-17-151-2021 Clim. Past, 17, 151–170, 2021162 M. Leupold et al.: ENSO and internal sea surface temperature variability
Table 5. The 19–20th century (divided into three periods) positive (El Niño events) and negative (La Niña and non-La Niña events) SST
anomaly events picked for generating coral composite records shown in Fig. 9.
The 19–20th century Period Years with Number of Records
coral composite events events used
Positive SST anomalies
1830–1929 1849, 1853, 1863, 1873, 18 B8 (1836–1867),
1879, 1981, 1886 (2 ×), E3 (1870–1909),
1889, 1894, 1895, 1896, GIM (1880–1995)
1897, 1902, 1907, 1911,
1916, 1926
1930–1964 1932, 1940, 1951, 1958, 5 GIM (1880–1995)
1963
1965–1995 1969, 1973, 1977, 1979, 6 GIM (1880–1995)
1983, 1987
Negative SST anomalies
1830–1929 1846, 1858, 1860, 1865, 16 B8 (1836–1867),
1872, 1883, 1890, 1891,
1893, 1895, 1900, 1902, E3 (1870–1909),
1903, 1906, 1920, 1924 GIM (1880–1995)
1930–1964 1932, 1947, 1952, 1956, 5 GIM (1880–1995)
1964
1965–1995 1970, 1974, 1982, 1984, 5 GIM (1880–1995)
1994
Figure 7. Positive SST anomaly (El Niño events) composite records of AVHRR (left; red) and coral SST (right; blue) records. Separate
composites of anomaly events during the 17–18th and 19–20th century were generated from the coral SST records. Shaded areas below and
above the curves show the standard error for the mean values of the composite records. See Table 4 for an overview of the events that were
selected for generating the composites.
(n = 22) and for all non-La Niña events it is −1.5 ± 0.4 ◦ C negative La Niña temperature anomalies are −0.8 ± 0.1 ◦ C
(n = 9) (p = 0.75). La Niña events are slightly colder than (n = 10) and non-La Niña anomalies are −0.6 ± 0.1 ◦ C (n =
non-La Niña events in the coral composites, but they are not 4; p = 0.17).
statistically different (p = 0.60). The same is observed in the The average negative temperature anomalies of La Niña
AVHRR satellite SST anomaly composites, where average and non-La Niña events during the 17–18th century were
Clim. Past, 17, 151–170, 2021 https://doi.org/10.5194/cp-17-151-2021Table 6. Overview of all events found in the coral Sr/Ca records and of El Niño and La Niña events of corresponding time periods listed in publications. Events in coral records were
matched with published events in consideration of age model uncertainties of each coral record.
Positive SST anomalies Negative SST anomalies
Events in records Published ENSO events Events in Records Published ENSO events
Quinn (1993) Brönnimann et al. (2007) Brönnimann et al. (2007)
Years Number Years of very strong (VS), strong (S), Number Years of strong Number Years Number Years of strong Number
of medium (M), and weak (W) events of events of of events of
events events events events events
E5 (1675– 1678/79, 1682/83, 6 1681 (S), 1684 (M+), 1687–88 (S+), 1692– 8 1674, 1675, 1677, 7 1680, 1683/84, 5 1676, 1678, 1698, 4
https://doi.org/10.5194/cp-17-151-2021
1716) 1685/86, 1686/87, 93 (S), 1696–97 (M+), 1701 (S+), 1707–09 1681, 1682, 1691, 1697, 1697/98, 1704
1691/92, 1707/08 (M/S), 1715–16 (S) 1702 1702
B8 (1836– 1848/49, 1853/54, 3 1837 (M+), 1844–46 (M/S+), 1850 (M), 1852 11 1833, 1846, 1852, 5 1845/46, 1858, 4 1842, 1847, 1863 3
1867) 1862/63 (M), 1854 (M), 1857–58 (M), 1860 (M), 1862 1856, 1869 1860/61, 1864/65
(M−), 1864 (S), 1866 (M+), 1867–68 (M+)
E3 (1870– 1872/73, 1879/80, 6 1871 (S+), 1874 (M), 1877–78 (VS), 1880 (M), 12 1869, 1877, 1878, 9 1872, 1882/83, 5 1872, 1887, 1890, 6
1909) 1885/86, 1893/94, 1884 (S+), 1887–89 (M+), 1891 (VS), 1897 1889, 1897, 1900, 1891, 1895/96, 1893, 1904, 1910
1894/95, 1906/07 (M+), 1899–1900 (S), 1902 (M+), 1904–05 1903, 1906, 1912 1903/04
(M−), 1907 (M)
GIM 1880/81, 1885/86, 20 1880 (M), 1884 (S+), 1887–89 (M−/M+), 32 1878, 1889, 1897, 21 1889/90, 1893, 17 1887, 1890, 1893, 17
(1880– 1888/89, 1896/97, 1891 (VS), 1897 (M+), 1899–90 (S), 1902 1900, 1903, 1906, 1899/00, 1901/02, 1904, 1910, 1917,
1995∗ ) 1897, 1902, (M+), 1904–05 (M−), 1907 (M), 1910 (M+), 1912, 1915, 1919, 1906, 1919/20, 1925, 1934, 1943,
1911/12, 1916/17, 1911–12 (S), 1914–15 (M+), 1917 (S), 1923 1926, 1931, 1940, 1924, 1931/32, 1950, 1956, 1968,
1925/26, 1931/32, (M), 1925–26 (VS), 1930–31 (M), 1932 (S), 1941, 1952, 1958, 1947, 1956, 1971, 1974, 1976,
M. Leupold et al.: ENSO and internal sea surface temperature variability
1939/40, 1950/51, 1939 (M+), 1940–41 (S), 1943 (M+), 1951 1966, 1973, 1977, 1951/52, 1964, 1985, 1989
1957/58, 1962/63, (M−), 1953 (M+), 1957–58 (S), 1965 (M+), 1983, 1987, 1992 1970, 1973/74,
1969/70, 1972/73, 1969 (M−), 1972–73 (S), 1976 (M), 1978–79 1982, 1983/84,
1977/78, 1978/79, (W), 1982–83 (VS), 1987 (M), 1991–92 (M), 1993/94
1982/83, 1986/87 1994–95 (M−)
AVHRR∗ 1982/83, 1986/87, 9 1982/83 (VS), 1986/87 (M), 1987/88 (S), 12 / / 1984/85, 1989, 14 1983/84 (W), 1984/85 18
1987/88, 1997/98, 1991/92 (S), 1994/95 (M), 1997/98 (VS), 1989, 1992, 1995, (W), 1988/89 (S), 1992,
2002/03, 2004/05, 2002/03 (M), 2004/05 (W), 2006/07 (W), 1996/97, 1998/99, 1995/96 (M), 1996/97,
2006/07, 2014/15, 2009/10 (M), 2014/15 (W), 2015/16 (VS) 1999/00, 2004, 1998/99 (S), 1999/00
2015/16 2007/08, 2010/11, (S), 2000/01 (W), 2004,
2011/12, 2014, 2005/06 (W), 2007/08
2016/17 (S), 2008/09 (W),
2010/11 (S), 2011/12
(M), 2014, 2016/17
(W), 2017/18 (W)
Recent events (from 1980 onward) were additionally picked using events listed on the following website: https://www.ggweather.com/enso/oni.htm (last access: 18 October 2018; El Niño and La Niña Years and Intensities, 2018)
Clim. Past, 17, 151–170, 2021
163164 M. Leupold et al.: ENSO and internal sea surface temperature variability
Figure 8. Negative SST anomaly (La Niña and non-La Niña events) composite records of AVHRR satellite (left; red) and coral SST (right;
blue) records. Additionally, composites of anomaly events separated by 17–18th and 19–20th century events and by La Niña and non-La
Niña events were generated. Shaded areas below and above the curves show the standard error for the mean values of the composite records.
See Table 4 for an overview of the events that were selected for generating the composites.
slightly less negative (−1.5 ± 0.3 ◦ C; n = 5), but they were tive temperature anomaly is 1.4 ± 0.1 ◦ C (n = 18); between
not significantly different (p = 0.73) from the average 1930 and 1964, the average positive temperature anomaly of
negative temperature anomalies of the 19–20th century 1.2 ± 0.1 ◦ C (n = 5) is slightly lower than in the previous pe-
(−1.6 ± 0.2 ◦ C; n = 26). riod but not significantly different (p = 0.5). For the last pe-
riod of the 20th century, 1965 to 1995, the average positive
temperature anomaly is again 1.4 ± 0.1 ◦ C (n = 6; Fig. 9).
4.5.3 Interannual SST anomalies during the 19th and The magnitude of cooling during La Niña and non-La
20th century Niña events tends to reduce from 1830–1929 to 1965–1995
Dividing the 19–20th century into three subperiods (1830– (Fig. 9). For the period between 1830 and 1929, the av-
1929, 1930–1964, and 1965–1995) and compiling SST erage negative temperature anomaly is −1.9 ± 0.2 ◦ C (n =
anomaly composites allowed us to assess changes in the mag- 16). Between 1930 and 1964 the average negative tempera-
nitude of ENSO-driven warm and cold anomalies over time ture anomaly increases by 0.58 ◦ C to −1.3 ± 0.1 ◦ C (n = 5),
(Fig. 9). The El Niño composites do not show systematic and from 1965 to 1995, the average negative temperature
changes during the 19–20th century in the Indian Ocean. anomaly is −1.1 ± 0.1 ◦ C (n = 5). However, for both El Niño
For the period between 1830 and 1929, the average posi- and La Niña events, the differences between the means of the
Clim. Past, 17, 151–170, 2021 https://doi.org/10.5194/cp-17-151-2021M. Leupold et al.: ENSO and internal sea surface temperature variability 165
Figure 9. Positive (El Niño events; left) and negative SST anomaly (La Niña and non-La Niña events; right) composite records of the 19–
20th century coral SST records separated by the 1830–1929 (top row), 1930–1964 (middle row), and 1965–1995 (bottom row) time intervals.
Shaded areas below and above the curves show the standard error for the mean values of the composite records. See Table 5 for an overview
of the events that were selected for generating the composites.
first period (1830–1929) and the last period (1965–1995) are tion in the tropical Indian Ocean was close to symmetric, be-
not statistically significant (p = 0.93 and p = 0.07, respec- cause magnitudes of El Niño and La Niña events recorded
tively). by the Chagos corals during the past century are generally
comparable (Fig. 9). Only in times of cooler mean climates
(i.e., during the 17–18th century) do the corals seem to in-
5 Discussion
dicate higher amplitude ENSO-induced warm anomalies in
the tropical Indian Ocean, although these differences are not
Previous studies have shown that Indian Ocean SST variabil-
statistically significant. Hence, our results do not support the
ity was influenced by ENSO during the 19th and 20th cen-
notion that an asymmetric ENSO teleconnection with strong
turies (Charles et al., 1997; Cole et al., 2000). During this
warming during El Niño years drives the recent warming of
period there was a stationary ENSO–SST teleconnection, in
the tropical Indian Ocean as suggested by Roxy et al. (2014).
the sense that El Niño warmed the Indian Ocean and La Niña
The modern coral records from the central Indian Ocean
cooled it (Pfeiffer and Dullo, 2006). In this study, we show
all show steady warming during the 20th century, and this
that interannual SST variability recorded in the 17–18th and
warming also continues in the period of reduced ENSO activ-
19–20th century corals is coherent with the Wilson Niño in-
ity between 1930 and 1965 (e.g., Abram et al., 2016; Charles
dex. This demonstrates a stationary ENSO–SST teleconnec-
et al., 1997; Pfeiffer and Dullo, 2006). This suggests that nei-
tion in the central Indian Ocean since 1675.
ther the magnitude nor the frequency of past El Niño events
Our ENSO composites allow us to estimate and compare
explain the centennial-scale warming of the Indian Ocean.
the magnitudes of ENSO-induced warming and cooling in
Previous studies classified El Niño and La Niña events
the central Indian Ocean. This enables us to assess the sym-
(Tables 4 and 5) qualitatively, from “weak” to “very strong”
metry or asymmetry of the ENSO teleconnection, thereby
(Brönnimann et al., 2007; Quinn, 1993; Table 6). All posi-
taking the analysis of the ENSO–SST teleconnection one
tive anomaly events recorded by the coral records presented
step further. The composites suggest the ENSO teleconnec-
https://doi.org/10.5194/cp-17-151-2021 Clim. Past, 17, 151–170, 2021You can also read


