Opal sedimentation shifts in the World Ocean over the last 15 Myr
←
→
Page content transcription
If your browser does not render page correctly, please read the page content below
Earth and Planetary Science Letters 224 (2004) 509 – 527
                                                                                                         www.elsevier.com/locate/epsl

Opal sedimentation shifts in the World Ocean over the last 15 Myr
    Giuseppe Cortese *, Rainer Gersonde, Claus-Dieter Hillenbrand 1, Gerhard Kuhn
    Alfred Wegener Institute for Polar and Marine Research (AWI), Columbusstrasse, P.O. Box 120161-27515 Bremerhaven, Germany

                        Received 22 October 2003; received in revised form 20 May 2004; accepted 25 May 2004
                                                           Available online

Abstract

    Biogenic silica (opal) accumulation records were used to trace mechanisms, consequence, and geographic pattern of shifts in
the main locus of opal deposition of the World Ocean over the last 15 Myr. Over this time interval, the main opal ‘‘sink’’ seems
to have moved from the North Atlantic, to the Pacific, equatorial Pacific, eastern equatorial Pacific, eastern boundary current
upwelling systems (California, Namibia, Peru), and finally to the Southern Ocean. The interplay between opal deposition and a
series of climatic, tectonic, oceanographic, and biologic events has been analyzed and discussed. These events include the
Cenozoic global cooling trend, intensified glaciation in Antarctica, Late Miocene – Early Pliocene biogenic bloom, development
of Northern Hemisphere Glaciation (NHG), closing of the Panama Seaway, transition of the climate system from a monopolar-
to a bipolar-glaciated world, Mid-Pleistocene Revolution (MPR), nutrient availability, evolution of diatoms and C4 plants, and
changes in continental weathering rates. While the observed shifts are mostly traceable to oceanic reorganizations and global
climatic evolution, conditions favorable to opal deposition involve the above-mentioned complex mix of processes. For this
reason, the interpretation of opal deposition records might not always be straightforward. We, however, believe that it can still
provide clear indications of large-scale oceanographic reorganizations in the geological past.
D 2004 Elsevier B.V. All rights reserved.

Keywords: opal; Southern Ocean; Mid-Pleistocene Revolution; upwelling; Neogene; glaciation

1. Introduction                                                            this basin to basin fractionation are both on opal
                                                                           preservation, as Pacific bottom waters are less silica
    Large-scale oceanic circulation has a direct impact                    unsaturated compared to the Atlantic ones, and pro-
on opal deposition (Fig. 1), as the estuarine Pacific                      duction, as Si/N and Si/P ratios increase from the
(exchange of surface, nutrient-poor, for deep, nutrient-                   Atlantic to the Pacific/Southern Ocean, thus favoring
rich, waters) and anti-estuarine Atlantic Ocean circu-                     opal versus carbonate producers [2].
lations are favoring the production/preservation of                           This configuration leads today (Fig. 1) to the
silica and carbonate, respectively [1]. The effects of                     localization of opal burial mostly in the equatorial
                                                                           Pacific, in the eastern boundary current upwelling
                                                                           systems, and in the Southern Ocean. The latter
   * Corresponding author. Tel.: +49-471-48311207; fax: +49-               accounts for 17 –37% of the global opal burial [3], a
471-48311149.
   1
     Present address: British Antarctic Survey, High Cross,                somewhat conservative estimate compared to previ-
Madingley Road, Cambridge CB3 OET, UK.                                     ous studies, which attributed up to two-thirds of the
   E-mail address: gcortese@awi-bremerhaven.de (G. Cortese).               opal burial to the Southern Ocean [4]. This observa-

0012-821X/$ - see front matter D 2004 Elsevier B.V. All rights reserved.
doi:10.1016/j.epsl.2004.05.035
510                             G. Cortese et al. / Earth and Planetary Science Letters 224 (2004) 509–527

Fig. 1. General ocean circulation and opal sinks. (Top) The general circulation between Atlantic and Pacific/Southern Ocean modified after [1].
Deep waters in the Pacific/Southern Ocean are enriched in nutrients, carbon dioxide, and DSi, and at the same time display higher Si/C and Si/N
ratios [2] compared to the Atlantic Ocean. (Bottom) The silica-rich Pacific/Southern Ocean is recognizable in the annually averaged DSi (in AM)
distribution at 250-m depth [31]. Black ellipse = modern opal sink.

tion places a particular stress on the importance of                       through time. For this reason, opal sedimentary
opal deposition on continental margins, which might                        records can be used to recognize past oceanic reor-
account for the difference [5]. Today, large-scale                         ganizations, as they are mainly shaped by circulation
oceanic circulation therefore has the potential to affect                  rearrangements (e.g., opening/closing of gateways,
opal deposition by:                                                        intensification of deep water formation) and global
                                                                           climatic evolution (Cenozoic cooling trend, Antarc-
(1) ‘‘distilling’’ dissolved silica (DSi) into modern                      tica and Northern Hemisphere glaciation (NHG)).
    Pacific-like oceans (increase in opal preservation);                   Similarly, known oceanographic events can help
(2) favoring opal vs. carbonate export (increase in                        shed light on the mechanisms leading to opal depo-
    opal production), as changes in nutrient ratios                        sition and increase our knowledge of the Si and C
    contribute to select diatoms as main producers                         cycles. Climate evolution and oceanic circulation are
    compared to other (e.g., calcifying) organisms,                        moreover closely connected, as the development of
    which in turn have implications on export.                             continental ice sheets, ice shelves, and sea-ice alters
                                                                           the strength and flow direction of the global over-
   This static picture is, however, not representative                     turning circulation, and also affects the meridional
for the last 15 Myr, as conditions favorable to opal                       partitioning in the ocean of nutrients essential to
deposition shift and generate a dynamic picture                            opal-producing organisms. The global cooling trend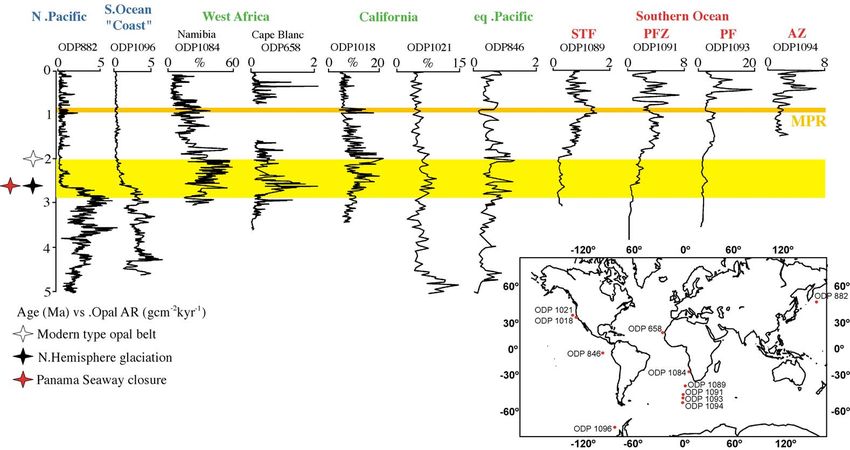
G. Cortese et al. / Earth and Planetary Science Letters 224 (2004) 509–527                                  511

during the Cenozoic [6], and events such as the                   Table 1
development of glaciation in Antarctica [7], the Late             Opal data
Miocene – Early Pliocene biogenic bloom [8], the                  Site                 Location              Method Reference
closing of the Panama Seaway [9], and the Mid-                    DSDP Site 66         Equatorial Pacific    1        Moody et al. [82]
Pleistocene Revolution (MPR [10]), left an imprint                DSDP Site 70         Equatorial Pacific    1        compiled by
                                                                                                                      N. Dittert
on opal deposition records due to the effects they
                                                                  DSDP Site 73         Equatorial Pacific    1        compiled by
had on oceanic processes.                                                                                             N. Dittert
    Diatoms (siliceous primary producers having opal-             DSDP Site 346 North Atlantic               1        compiled by
ine valves) strongly influence the cycling of silicon                                                                 N. Dittert
and carbon in oceanic ecosystems. They are respon-                DSDP Site 572 Equatorial Pacific           1        Moody et al. [82]
                                                                                                             1        compiled by
sible for 43% of the ocean primary production [4] and
                                                                                                                      N. Dittert
may control the export of carbon to the deep ocean.               DSDP Site 574 Equatorial Pacific           1        compiled by
This confers to them the potential to affect changes in                                                               N. Dittert
atmospheric CO2 concentrations on a variety of time               DSDP Site 586 Equatorial Pacific           1        Moody et al. [82]
scales. The effect on CO2 sequestration in the ocean is           ODP Site 642 North Atlantic                2        Bohrmann [83]
                                                                  ODP Site 643 North Atlantic                2        Bohrmann [83]
more direct than for skeletal formation in carbonate
                                                                                                             1        compiled by
biomineralizers, a process that reduces alkalinity and                                                                N. Dittert
results in no net removal of CO2 from the upper ocean             ODP Site 644         North Atlantic        2        Bohrmann [83]
during export [11]. The remains of diatoms and other              ODP Site 658         NW Africa (Cape       2        Tiedemann [85]
silica-utilizing organisms are found, as opal sedi-                                    Blanc)
                                                                  ODP Site 846         East equatorial       4        Farrell et al. [8]
ments, in regions that either play a key role in climate
                                                                                       Pacific
(Southern Ocean) or are very sensitive to climate                 ODP Site 850         East equatorial       4        Farrell et al. [8]
change (Namibia upwelling system). This connection                                     Pacific
between biogenic silica and organic carbon, coupled               ODP    Site   882    North Pacific         2        Maslin et al. [21]
with the one order of magnitude better preservation               ODP    Site   1010   California margin     3        Janecek [84]
                                                                  ODP    Site   1018   California margin     3        Janecek [84]
efficiency of the former compared to the latter, makes
                                                                  ODP    Site   1021   California margin     3        Janecek [84]
opal accumulation records very interesting for paleo-             ODP    Site   1084   SW Africa             4        Pérez et al. [86]
ceanography and paleoclimatology. In this paper, we                                    (Namibia)
will use the opal accumulation history of different               ODP Site 1089        Southern Ocean        5        Kuhn and
oceans to trace mechanisms, consequence, and geo-                                      (Subtropical Front)            Diekman [88]
                                                                  ODP Site 1091        Southern Ocean        6        This paper
graphic pattern of shifts in the main opal ‘‘sinks’’ of
                                                                                       (Polar Front Zone)
the World Ocean caused by major oceanic and cli-                  ODP Site 1092        Southern Ocean        5        Diekmann
matic events.                                                                          (Polar Front)                  et al. [45]
                                                                  ODP Site 1093        Southern Ocean        6        This paper
                                                                                       (Polar Front)
                                                                  ODP Site 1094        Southern Ocean        6        This paper
2. Methods
                                                                                       (Antarctic Zone)
                                                                  ODP Site 1096        Bellingshausen Sea    5        Hillenbrand and
   Most of the opal and stratigraphic data presented                                                                  Futterer[22]
here were obtained from the Deep Sea Drilling Project             The source of the opal data discussed in this paper is indicated, along
(DSDP) and Ocean Drilling Program (ODP) Scientific                with the original reference, geographic area, and opal determination
Results volumes, or from the Pangaea databank                     method, the latter coded as follows: smear slide analysis (1); density
(http://www.pangaea.de). Appropriate references to                separation technique (2); reduction colorimetric technique [14] (3); a
                                                                  modified version of the previous method (4); automated leaching
the original data sources are given both in figure                technique [12] (5); x-ray diffraction technique [87] (6).
captions and Table 1. Additionally, opal data from
ODP Leg 177 (ODP Sites 1091 and 1093) are
presented here for the first time.                                determined using an automated leaching technique
   Opal contents of core samples from ODP Legs                    [12] by analyzing the opal-A content in an aliquot
175, 177 (Sites 1089 and 1092), and 178 were                      of the homogenized dry bulk sediment samples.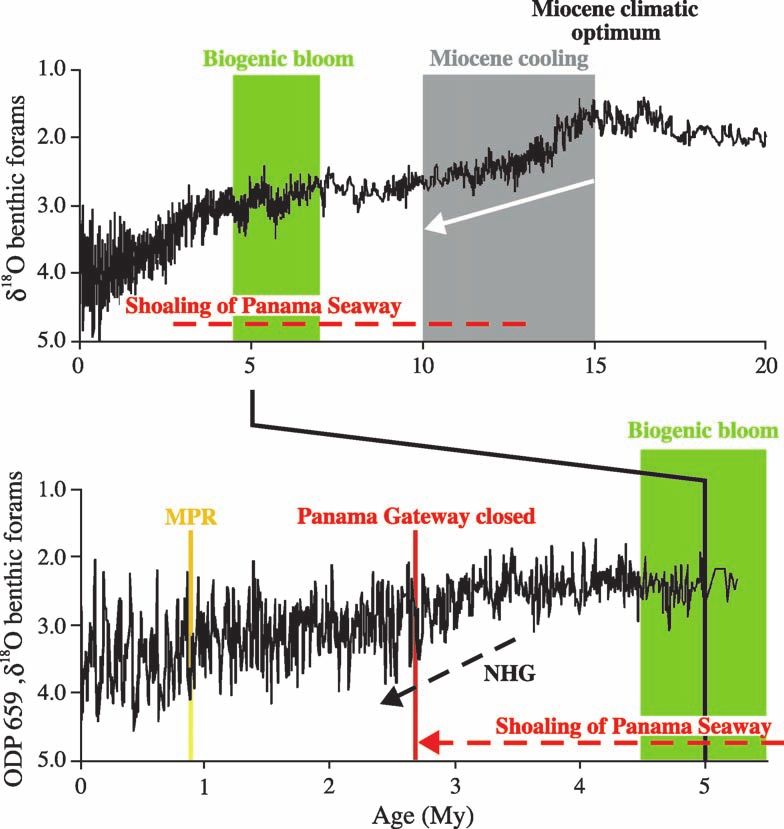
512                       G. Cortese et al. / Earth and Planetary Science Letters 224 (2004) 509–527

Silicon was extracted by wet-chemical means with 1                had over last 15 Myr on the opal deposition in the
M NaOH, and concentrations of DSi were measured                   World Ocean (Fig. 3a –e):
by molybdate-blue spectrophotometry. The proportion
of opal was determined by graphical analysis of the               – The global cooling trend [6] since ca. 14 –16 Ma
absorbance peaks [13]. The reproducibility of the                   (Fig. 2);
method is better than 2% for opal-rich samples and                – Late Miocene – Early Pliocene biogenic bloom
4– 10% for samples with < 10 wt.% opal [12]. The                    event (4.5 –7 Ma);
methods used for the other datasets (Table 1) are wet-            – The progressive shoaling [9] of the Panama Seaway
alkaline digestion, reduction colorimetric technique                (13 – 2.7 Ma);
[14] and its subsequent modifications, density sepa-              – North Pacific opal breakdown (2.7 Ma);
ration, and smear slide analysis. In addition to the              – Opal deposition increases in upwelling systems in
leaching technique, at Leg 177, Sites 1091, 1093 and                response to high latitude cooling (2.5 Ma) and
1094, BSi contents were estimated from the maximal                  switches from 40 to 100 kyr glacial –interglacial
peak height of the broad hump in x-ray diffractograms,              cycles (MPR, at 0.9 Ma).
calibrated with standard samples [87]. There are large
differences in the reproducibility of these methods,              3.1. North Atlantic
and already within wet-alkaline digestion techniques,
interlaboratory calibration studies reveal a spread in                Opal deposition collapses at 14 Ma (Fig. 3a), in
the measured values according to the concentration                connection with the intensification of Antarctic glaci-
and type of solution used in the digestion [15].                  ation and the development of North Atlantic Deep
Different techniques (and their error margin) are not,            Water (NADW), as both events favored the Atlantic-
however, drastically influencing our discussion, which            to-Pacific fractionation of nutrients linked to the
is based on major shifts in sediment composition, and             establishment of a marked anti-estuarine circulation
which does not integrate, in the same record, measure-            in the North Atlantic. The latter hindered upwelling of
ments obtained by different opal determination methods.           silica-rich Antarctic Bottom Water (AABW) in the
Age models were computed by linear interpolation                  North Atlantic, and this water mass, whose formation
between magneto- and biostratigraphic data, while                 rate was also probably increased by the peaking
opal accumulation rates (MAR, in g cm 2 kyr 1)                    glaciation of Antarctica, was instead rerouted to the
were calculated by multiplying linear sedimentation               Indo-Pacific. The opal system in the North Atlantic is
rates with the relative abundance of biogenic silica              only able to partly recover (Fig. 3a) at times when the
and dry bulk densities. Opal percentages, based on                nutrient/DSi pool gets enriched either globally (at ca.
smear slide estimates, and dry bulk densities are given           5 Ma, during the biogenic bloom event, as recorded
in the JOIDES SCREEN database for four of the sites               by a minor rebound at ODP Site 642) or when there is
reported in Table 1. The references to their original             a fractionation that allows nutrient/DSi levels to
opal data are as follows: DSDP Leg 8, Sites 70 and                increase locally (2.7 Ma, Northern Hemisphere Gla-
73 [16]; Leg 38, Site 346 [17]; Leg 85, Site 574 [18].            ciation (NHG) and North Pacific breakdown, as
Opal MAR was calculated by Dittert based on ages                  recorded at ODP Site 644).
assigned to these sites [19]. The resulting opal
MAR data are publicly available on the Pangaea                    3.2. Equatorial Pacific Ocean
databank (data series label: DittertN_2001.13, data-
base ID#: 2157943).                                                   Repeated opal deposition shifts (Fig. 3b) took
                                                                  place in connection with ice buildup in Antarctica
                                                                  and the presence of ‘‘embryonal’’ ice caps in the
3. Results                                                        Northern Hemisphere: the main focus for biogenic
                                                                  silica deposition moves between east-central (DSDP
   Opal sedimentary records from different oceanic                Site 574) and eastern (DSDP Site 572) Pacific. Sites
provinces illustrate the strong impact that several               off this band (DSDP Sites 70 and 73, to the north and
major tectonic, climatic, and biologic events (Fig. 2)            south) do not seem to be affected. The same pattern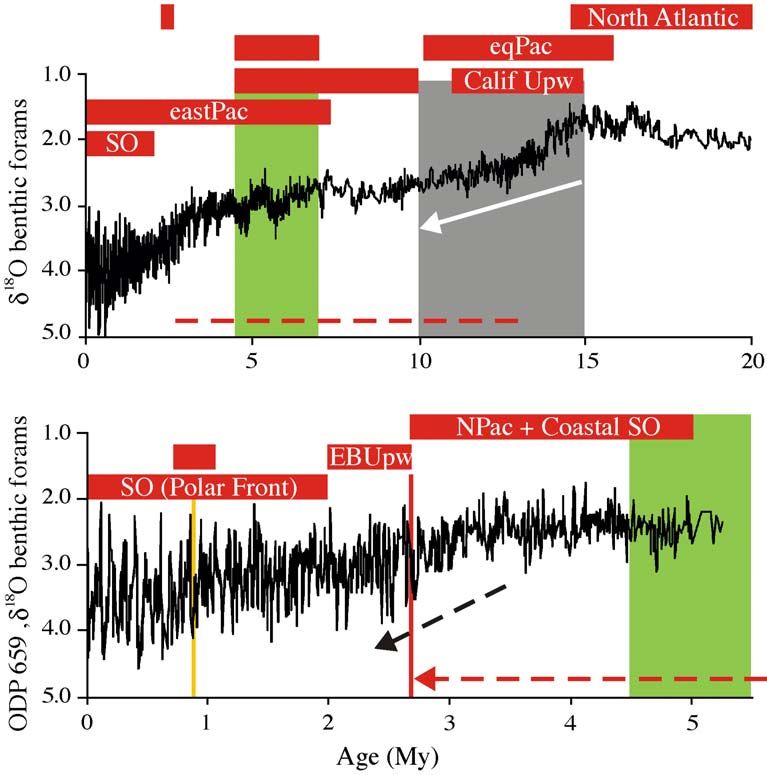
G. Cortese et al. / Earth and Planetary Science Letters 224 (2004) 509–527                                 513

Fig. 2. Neogene climate evolution. General climatic evolution (y18O from benthic foraminifera) over the last 20 Myr [6]. The zoomed in portion
of the record, last 5 Myr, is from ODP Site 659 [81]. The following events and trends, and the time intervals over which they take place are
color-coded as in the ensuing figures (except Fig. 5): Miocene cooling trend, biogenic bloom event, shoaling and closure of the Panama Seaway,
intensification of the Northern Hemisphere Glaciation (NHG), the Mid-Pleistocene Revolution (MPR). The Miocene cooling trend (15 – 10 Ma)
is the steep cooling taking place right after the Middle Miocene climatic optimum and is part of the Cenozoic cooling trend. The closure of the
Panama Seaway is progressive and culminates at ca. 2.7 Ma. The MPR represents the switch from a 40- to a 100-kyr glacial – interglacial cycle
periodicity. The dashed black arrow marked NHG indicates cooling and the onset of major glaciation in the Northern Hemisphere.

repeats itself during the Late Miocene – Early Pliocene                    (Fig. 3c–d), the main opal burial area moves from the
biogenic bloom, when changes are strong in the                             eastern equatorial Pacific to the Galapagos Basin [8].
eastern Pacific, but subdued in the central and western
side (DSDP Sites 66 and 586).                                              3.4. California upwelling system

3.3. East equatorial Pacific                                                  Major displacements of opal depocenters take
                                                                           place during the circulation changes between 10 and
   After the biogenic bloom (Fig. 3c – d, horizontal                       15 Ma (Fig. 3e), similar to the North Atlantic and
bar), opal MAR drops to almost zero at ODP Site 850,                       equatorial Pacific (Fig. 3a –b). Coastal fractionation
equatorial eastern Pacific, while it remains high post-                    (deposition in coastal compared to offshore basins)
bloom at ODP 846, Galapagos Basin, easternmost                             causes the opal percentage lows at 11.5– 10 and 7.6 –
equatorial Pacific, thus resulting in a further opal                       6.5 Ma [20]. The mechanism behind this coastal
fractionation within the eastern Pacific, with opal                        fractionation is as follows: a stronger NADW would
deposition being more and more concentrated toward                         actually contribute a higher amount of nutrients to the
areas affected by eastern boundary currents. At 4.4 Ma                     northeastern Pacific and favor upwelling offshore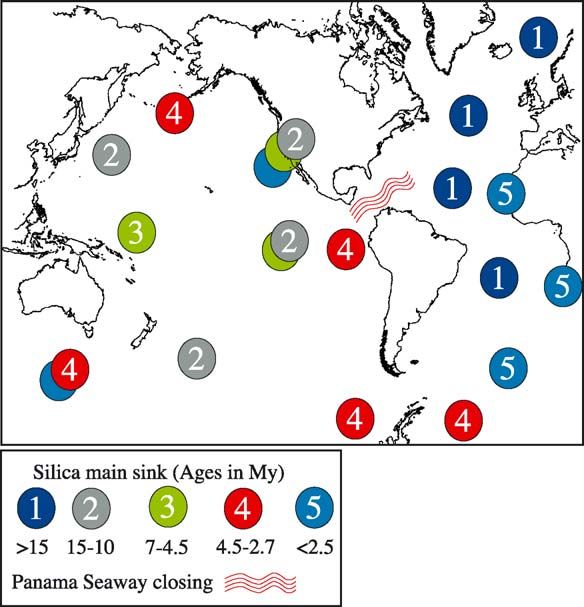
514 G. Cortese et al. / Earth and Planetary Science Letters 224 (2004) 509–527
G. Cortese et al. / Earth and Planetary Science Letters 224 (2004) 509–527                                    515

California. However, the presence of low latitudinal                         3.6. Southern Ocean (Bellingshausen and Riiser –
temperature gradients, a slower California Current,                          Larsen Seas, Atlantic Sector Transect)
and a deep nutricline play against, and more than
compensate, the potentially increased nutrient avail-                           Bellingshausen (ODP Sites 1096, and 1101 [22],
ability to shallow waters and result instead in the                          not shown) and Riiser– Larsen Sea (PS1824-1 [23],
limitation of nutrient availability offshore [20] and the                    not shown) cores display an opal deposition drop at
consequent coastal to offshore fractionation.                                ca. 2.5 –3 Ma (Fig. 4). During the same time interval,
   The ‘‘carbonate crash’’ recognized at 9.5 Ma in the                       a sharp change in sedimentary regime had been
eastern equatorial Pacific [8] is connected to the start                     already recognized in the Weddell Sea and Maud Rise
of the progressive shoaling of the Panama Seaway,                            based on a silica- to carbonate-dominated facies shift
which strongly affects the characteristics of deep                           [24]. Shortly thereafter, at 2 Ma, roughly after the end
waters entering the Pacific (more carbonate-unsaturat-                       of the opal breakdown in the North Pacific, and once
ed bottom waters), and favors the insaturation of                            opal accumulation decreases in upwelling systems, the
NADW and associated interbasin partitioning of                               modern Southern Ocean opal belt is established (Fig. 4)
nutrients. Both processes favor opal, as also seen at                        as seen in ODP Leg 177 cores (Sites 1091 and 1093).
ODP Sites 1010 and 1021, where opal MAR is on a
recovery trend after a minimum at ca. 10 Ma (Fig. 3e).                       3.7. Namibia and Cape Blanc upwelling systems
   The shift of opal deposition to the North Pacific
and ‘‘coastal’’ Southern Ocean probably caused the                               In the upwelling regimes off NW (Cape Blanc,
opal MAR low observed in California between 4.6                              ODP Site 658) and SW (Namibia, ODP Site 1084)
and 2.7 Ma, while the succeeding North Pacific opal                          Africa, intense opal MAR pulses are observed be-
breakdown (2.7 Ma) implied, on the contrary, an opal                         tween 2 and 3 Ma (Fig. 4). Maxima are also recorded
deposition increase along offshore California (Fig. 4).                      at 1 Ma (Namibia) and 750 ka (Cape Blanc), with the
Both the Late Miocene – Early Pliocene biogenic                              latter event being restricted to the coastal upwelling
bloom and the opal pulses at 2.5 and 1 Ma (Fig. 4,                           regime, as it is not present at ODP Site 663 [25],
particularly ODP Site 1018) are well marked and                              located in the equatorial divergence upwelling.
recorded in this upwelling system.

3.5. North Pacific                                                           4. Discussion

   The opal breakdown dated at ca. 2.7 Ma (Fig. 4)                           4.1. The conveyor belt and silica: today
occurs simultaneously with an increase in ice rafted
debris deposition [21], suggesting how the NHG                                  The aged waters typical for the modern Pacific and
caused circulation changes, which probably forced                            Southern Ocean [26] display an increase in the Si/N
an opal deposition shift to other areas (Southern                            ratio at intermediate depths, which results in an
Ocean, partial recover in North Atlantic).                                   increase in opal export [2]. The relationship between

Fig. 3. (a – f) Opal history of different oceanic provinces during the last 15 Myr. The Opal records are grouped geographically, as follows: North
Atlantic (a), equatorial Pacific Ocean (b), East equatorial Pacific (c), Galapagos Basin (d), California upwelling system (e), Southern Ocean (f).
Letters A – D refer to the following events (colors as in Fig. 2): ice buildup in Antarctica and intensified global cooling trend (A), Late
Miocene – Early Pliocene biogenic bloom (B), North Pacific opal breakdown and NHG (C), upwelling intensification in connection to high
latitude cooling (D). In c – d, the green horizontal line marks the opal shift from the eastern equatorial Pacific to the Galapagos Basin [8]. Note
the drop in opal accumulation in the North Atlantic (15 My); the repeated shifts between east – central and eastern Pacific (15 – 10 My); the
repeated coastal-to-offshore fractionations in California (15 – 7 My); the recovery in most records around the biogenic bloom (4.5 – 7 My); the
fractionation to the Galapagos Basin, easternmost Pacific (4.5 My); the opal drop in the North Atlantic during the oceanic reorganizations
connected to NHG (2.7 My); the establishment of opal deposition in the Southern Ocean (2 My). Opal data sources are as follows: DSDP Sites
66, 572, 586 [82]; DSDP Sites 70, 73, 346, 572, 574, ODP Site 643, compiled by Nicholas Dittert, JOIDES SCREEN core data base (http://
www.ngdc.noaa.gov/mgg/geology/dsdp/dsdpcdv2.htm), stratigraphy from [19], made publicly available at http://www.pangaea.de; ODP Sites
642, 643, 644 [83]; ODP Sites 846, 850 [8]; ODP Sites 1010, 1021 [84] ODP Site 1092 [45].
516
G. Cortese et al. / Earth and Planetary Science Letters 224 (2004) 509–527
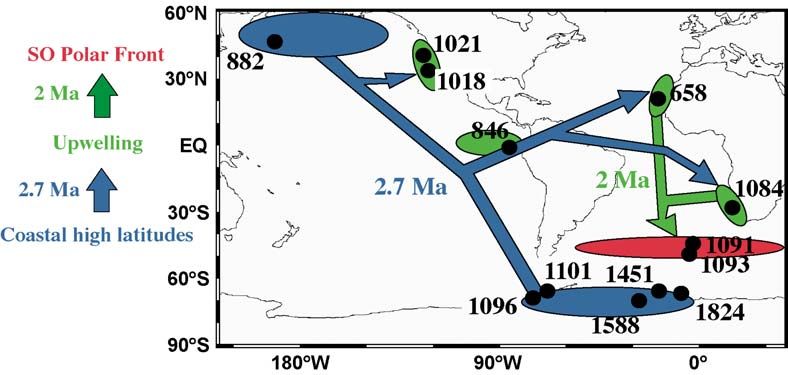
Fig. 4. Shifts of the main opal sink during last 5 My. Opal records from the Southern Ocean (‘‘Coastal’’ and ACC), North and equatorial Pacific, SW (Namibia) and NW (Cape Blanc)
Africa upwelling systems are shown. ‘‘Coastal Southern Ocean’’ includes records from the Bellingshausen and Weddell (not shown) Sea. Additional data sources (not mentioned in
Fig. 3): ODP Sites 658 [85], 882 [21], 1018 [84], 1084 [86], 1089 [88], 1091, 1093, 1094 (this paper) and 1096 [22]. The Panama Seaway closure, NHG, the establishment of the
modern type opal belt, and MPR are also shown. The roughly 1-My interval covering the shift from North Pacific/Southern Ocean ‘‘coast’’ to upwelling systems, to the Southern
Ocean is highlighted in light yellow. STF = SubTropical Front; PFZ = Polar Front Zone; PF = Polar Front; AZ = Antarctic Zone.G. Cortese et al. / Earth and Planetary Science Letters 224 (2004) 509–527 517
opal export and Si/N ratio switches from linear to northwest Africa upwelling systems. The dissolution/
exponential for Si/N ratios >2, such as one observes in production ratio is much higher in the Atlantic up-
the Southern Ocean and North Pacific. This progres- welling [34] than in the Pacific upwelling [35],
sive increase in importance of Si relative to N sets the most probably because the coastal upwelling source
scene for one of the most important biological players waters are much richer in DSi off Peru than off NW
for silica production in the Southern Ocean, as mi- Africa.
crocosm experiments have demonstrated that diatoms Through geological time, the conditions leading to
are DSi supercompetitors and dominate other pro- the development of a major opal sink are affected by
ducers above 2 AM DSi [27]. the interaction of many oceanographic, tectonic, and
The Southern Ocean and the North Pacific also climatic factors that result, at times, in the displace-
display maximum BSi/Corg flux ratios, and are thus ment of the main opal sink from one oceanic province
the end members of a general trend observed along to another. The difficulties in the deconvolution of the
the conveyor belt [2], and consisting in an enrichment influence of global and regional scale processes in
in BSi, compared to Corg export flux. This combined shaping opal accumulation records can almost be seen
increase in opal preservation and export makes the as an inherent characteristic of opal records, as re-
Southern Ocean the most important ‘‘sink’’ for DSi cently illustrated [36]. These authors demonstrate how
today. The use of opal proxy records has been a similar drop in opal MAR in the Southern Ocean
criticized because of a strong decoupling between Si and in the North Pacific may be connected to quite
and C cycles [28,29], and spatial variations in opal different productivity, nutrient utilization, dust input
preservation [30]. Moreover, the structure itself of the conditions, but with the unifying tract of representing
local ecosystem as well as which diatom species a transition to a more stable water column structure. In
represents the main opal carrier, impacts the generated our opinion, the amount of weathering from the
sedimentary signal. However, opal generally accumu- continents sets the primary control on the availability
lates in sediments when diatom production is high, of DSi to the ocean, as river runoff represents the main
and therefore the primary signal (related to opal source of DSi to the present-day ocean [4]. The first
production) is quite relevant in view of the paleocea- nutrient screening occurs at continental margins,
nographic utilization of opal accumulation data, where which are today considered as the site of the missing
emphasis is placed on production rather than on BSi sink, as the importance of the Southern Ocean
preservation processes. In the modern Pacific and opal accumulation has been revised downward [3].
Southern Ocean, intermediate and deep waters are Since the Middle Miocene, the extent of continental
characterized by a higher content in DSi compared to margins has not drastically varied, as the breakup of
the Atlantic Ocean (Fig. 1). On a first analysis, this Pangaea, which probably increased the importance of
suggests that these waters, being less unsaturated in margins in the overall BSi accumulation, was basically
biogenic silica, increase the preservation potential of completed by then (see also Section 4.4). Major
opal. This is not, however, the case, as the DSi changes in the global DSi budget do not therefore play
concentration of these waters (up to ca. 170 AM a role for opal accumulation, even if there are some
[31]) is well below biogenic silica solubility (ca. possible exceptions to this, as the biogenic bloom
1000 AM [32]). The impact of higher DSi content event (discussed in detail in Section 4.2.2). The
on BSi dissolution kinetics (due to nonlinearity be- character of this event is still, however, debated, as
tween dissolution rates and degree of undersaturation it is not clear whether it represents the consequence of
[33]) is also to be ruled out, as its effect is more felt at a global increase of nutrient input to the oceans or a
high temperatures (>15 –20 jC). Another mechanism, change in the distribution of nutrients between basins.
still related to the interbasin differences in DSi, may Our interpretation of opal accumulation records is
be more important in increasing the preservation therefore mainly in terms of oceanic reorganizations,
potential of opal: as Atlantic waters are poor in DSi, which displace a relatively constant DSi pool. We
diatoms tend to be less silicified. This process has a will, in the following paragraph, illustrate several
strong influence on the preservation of their frustules examples of this interplay between opal deposition
as exemplified by a comparison between the Peru and and climatic, tectonic, and biologic events.518 G. Cortese et al. / Earth and Planetary Science Letters 224 (2004) 509–527
4.2. The conveyor belt and silica: examples from the quence of shifting ocean circulation patterns, causing
past nutrient partitioning between the Atlantic and the
Pacific Oceans, and therefore not necessarily be
4.2.1. Event A: ice buildup in Antarctica and global connected to a global increase in productivity, or truly
cooling trend (15 Ma) represent a global biogenic bloom caused by a global
The Cenozoic cooling trend [6] and the cor- increase in nutrient supply to the ocean. The first
responding decrease in atmospheric CO2 content are hypothesis was based on the observation that at
currently interpreted as the cause of Antarctic glacia- 4.6 Ma an increased deep-ocean circulation with today’s
tion [37]. Ice buildup and development of a major pattern (deep water formation in the North Atlantic and
Antarctic ice sheet [38] and ‘‘embryonal’’ ice caps in Southern Ocean) led to stronger interbasin gradients in
the Northern Hemisphere [39] caused strong ocean nutrients, with lower nutrient concentrations in the
circulation rearrangements, with an increase in the flow Atlantic and higher in the North Pacific [42,43].
of Northern Component Water (NCW, the precursor to Recent studies on phosphorus accumulation rates used
modern NADW) at 17– 15 Ma, enhancing basin to as a proxy for biological productivity during the Late
basin nutrient fractionation. Global cooling-related Miocene –Early Pliocene from oligotrophic areas of
nutrient partitioning between Pacific and Atlantic at the Indian and Atlantic Oceans [44] seem to suggest
ca. 10 – 12 Ma is also documented in the divergence of how the biogenic bloom occurred on a global rather
the y13C curves (derived from benthic foraminifera) than a regional scale, and was therefore not linked to a
relative to these two oceans (Fig. 2 in [6]). During this shift of nutrients between oceans, but instead to a
time interval, opal deposition displays fluctuations in worldwide, overall increase in nutrient supply [45].
the North Atlantic, equatorial Pacific, and California Further support for this scenario comes from the
(Fig. 3a – e), and eventually develops into an opal recognition of the Late Miocene –Early Pliocene bio-
deposition collapse in the North Atlantic at ca. 15 Ma genic bloom event in other paleoproductivity proxy
(Fig. 3a), and a silica switch between the Atlantic and records from the Indo-Pacific Ocean [43,46,47], the
Pacific Ocean in the Middle Miocene at ca. 15 Ma [40]. South China Sea [48], based on opal MAR, and the
Predominantly carbonatic and biogenic siliceous sedi- northwest Pacific [49], based on carbonate/organic
ments accumulated since then in the Atlantic and in the carbon MAR. A global Late Miocene– Early Pliocene
Pacific/Indian Ocean, respectively. biogenic bloom is also witnessed in the records we
We interpret the silica switch and the opal deposi- present here by partial recovery of the opal system in
tion shifts occurring between 10 and 15 Ma as a the North Atlantic (minor rebound at ODP Site 642,
consequence of the marked global cooling and the Fig. 3a), strong early increases in the equatorial Pacific
development of a more glaciated globe. The increase Ocean, particularly in its eastern part (DSDP Sites 66
in continental ice had a strong impact on deep water and 572, ODP Sites 846 and 850, Fig. 3b –d), a minor
formation at high latitudes, particularly in the South- recovery of opal abundance in the California upwelling
ern Ocean, and on regional silica budgets. In fact, both system after the main drop at 7 Ma (ODP Sites 1010
the development of NADW (acting against the up- and 1021, Fig. 3e), and variable high opal values in the
welling of silica-rich AABW in the North Atlantic Southern Ocean (ODP Site 1096, Fig. 4). In most of
[41]) and the increased production of AABW (result- the presented opal records, particularly those from the
ing from increased Antarctic glaciation) enriched the Pacific Ocean (Fig. 3b– d), the opal peak is centered
Pacific/Indian Ocean in DSi [40]. between 4.5 and 7 Ma, and may suggest a connection
to the preceding drop in opal accumulation displayed
4.2.2. Event B: Late Miocene– Early Pliocene bio- in California, causing a remobilization of a DSi pool to
genic bloom event (4.5 – 7 Ma) the Pacific Ocean (Fig. 3e). Interestingly, this time
The Late Miocene– Early Pliocene biogenic bloom interval almost coincides with the evolution/spread of
event [8] was originally described from the equatorial C4 plants [50 –52], between 7 and 5 Ma, probably in
Pacific and resulted in widespread biogenic deposition, response to low CO2 concentrations. These plants
resulting from an increase in oceanic biological pro- (mostly weeds) have probably played an important
ductivity. This event could either represent the conse- role in controlling both the continental weathering rateG. Cortese et al. / Earth and Planetary Science Letters 224 (2004) 509–527 519
and the total amount of DSi ending up in the ocean by nutrient pools between different ocean basins. An
continental runoff. In fact, they favor remobilization of additional important player in further increasing the
DSi from the enormous continental/soil reservoir by effectiveness of the conveyor partitioning and estab-
forming siliceous phytoliths that are shedded once the lishing regional differences in nutrient pools’ avail-
plant dies. They are then easily dissolved, and part of ability was a tectonic event: the closure of the Panama
the resulting DSi may move from the continental to the Seaway. In fact, the Neogene tectonic closure of the
oceanic reservoir. Panama Seaway from 13.0 to 2.7 Ma [9,57] induced
Other hypotheses for the biogenic bloom event deep changes in global thermohaline circulation that
invoke a global scale nutrients increase, linked to the might have set the stage for NHG [58,59]. While the
Andean– Himalayan uplift and its impact on stronger link between the closing of the Panama Seaway and
continental weathering, leading to higher discharge of NHG is still debated, the shoaling of the Panama
nutrients in the ocean [53,54]. Moreover, the rising Seaway surely implied major oceanographic changes
mountain chains would have also affected atmospheric between 4.6 and 4.2 Ma [58]. This resulted in the
circulation and precipitation patterns, with the resulting intensification of NADW formation and, most impor-
rainfalls providing positive feedback to the higher tantly, the development of the modern salinity and
nutrient levels in rivers and oceans. Additional factors nutrient Atlantic – Pacific contrast, which is reflected
would be the Himalayas blocking of storm tracks from in a strong increase in Caribbean/Atlantic carbonate
the Indian Ocean at ca. 8 Ma and the consequent preservation and a complementary strong carbonate
intensification of both the Asian monsoon and the dissolution in the Pacific [8,58,60,61]. The different
associated transfer of nutrients from land to oceans [55]. response of carbonate and opal records to large-scale
oceanographic changes may be connected to their
4.2.3. Event C: North Pacific opal breakdown specific water column unsaturation characteristics, as
(2.7 Ma) globally, about half of the BSi redissolves in surface
The North Pacific opal breakdown (at 2.7 Ma) was waters, while dissolution starts below the lysocline for
probably related [21,56] to the inception of NHG carbonate [62]. Opal budgeting studies are in agree-
(2.5 Ma), and it could represent the first step in the ment with this observation and show how half
shift of the main DSi pool from the North Pacific to the (120 Tmol Si yr 1) of the total biogenic silica pro-
pelagic Polar Front area in the Southern Ocean, where duction is redissolved in the surface-mixed layer [4]
it would have led to the development of the ACC opal and therefore kept available for mineralization by
belt (2 Ma). The mechanism invoked for the opal organisms building an opaline silica test. In order for
breakdown [56] is the development, as a consequence the opal cycle to be strongly affected, an almost com-
of increased NHG, of a strong halocline in the plete closure of a passage is therefore necessary, as
subarctic Pacific, separating nutrient-poor surface otherwise this shallow water DSi pool would still be
waters from nutrient-rich subsurface waters. The re- exchanged between two contiguous basins. This is not
duced input of nutrient-rich subsurface waters to the the case for strong impacts on the carbonate cycle,
surface caused reduced productivity. In addition to where already a restricted flow of deep and bottom
this, the preservation efficiency of different diatom waters may play an important role in the partitioning
species plays an important role: the shift from silica to of carbonate sediments. This could explain the differ-
carbonate deposition, already observed in the Weddell ent response of carbonate and opal depositional events
Sea at roughly this time [24], is a consequence of the in connection to the progressive shallowing of the
expansion of sea ice and the lower preservation Panama Seaway: the observed ‘‘Miocene Carbonate
potential of sea-ice adapted diatoms. Crash’’ in the eastern equatorial Pacific [8] is an early
As already described for Event A (from 15 Ma, response triggered by the initial shallowing of the
global cooling trend), opal deposition at 2.7 Ma is Panama Seaway [63] and is a consequence of the
therefore also affected by an increased cooling event, reduced inflow into the Pacific of NADW (substituted
and here too the control is indirect, taking place by more carbonate-undersaturated southern-source
through the large-scale oceanographic changes caused waters), while opal readjustments occur much later,
by the cooling, and their effect on the distribution of when the passage is severely restricted.520 G. Cortese et al. / Earth and Planetary Science Letters 224 (2004) 509–527
4.2.4. Events D – E: upwelling systems responses (2.5 in controlling opal deposition in particularly sensitive
and 0.9 Ma) areas. The expansion of sea ice cover (e.g., during
The switch from a monopolar- to a bipolar-glaci- periods of intensified glaciation, like at the onset of
ated world might be associated with the intensification NHG, 2.7 Ma) probably terminated opal deposition,
of high-latitude cooling taking place at ca. 2.5 Ma and mostly due to light limitation of primary producers,
causing in turn a strengthening of latitudinal temper- and to its association with less well-preserved diatom
ature gradients and a stronger upwelling intensity. The species. This event is traceable to the North Pacific
MPR, itself a switch from the ‘‘40 kyr-’’ to the ‘‘100 (ODP Site 882 [21]), the Riiser– Larsen Sea (core
kyr-glacial cycles’’ world, occurred at ca. 0.9 Ma, as PS1824-1 [23]), the Weddell Sea/Maud Rise (cores
documented by benthic foraminifera y18O records PS1588-1 and PS1451-1 [23], see also [24]), and the
from ODP Sites 677 and 1085 [64,65]. The gradual Bellingshausen Sea (ODP Sites 1096 and 1101 [22]).
global and deep ocean cooling during the Neogene is Moreover, the oceanographic readjustments and cli-
considered as its possible cause and resulted in a shift mate changes connected to NHG led to the environ-
in the character of glacial–interglacial cycles from a mental push-out and replacement, in the North Pacific
symmetric, 41-kyr oscillation to an asymmetric, non- and in the coastal Southern Ocean, of diatom assemb-
linear, 100-kyr oscillation [66]. Past increases in opal lages having good preservation efficiency with sea-
deposition in upwelling systems are observed (Fig. 4) ice-adapted diatom species having a low preservation
in response to both high latitude cooling at ca. 2.5 Ma efficiency (Fig. 5). Under expanded sea ice condi-
and the MPR. Both events might have to do with the tions, this translates to a DSi in the water column at
development or reorganization of the cryosphere and high latitudes, which is neither used up by primary
its increased importance in affecting climate change. producers nor definitively sequestered in sediments,
and thus remains available, and can even be enriched
4.3. A scenario for the Southern Ocean– Namibia by remineralization of opaline skeletal remains. This
upwelling opal shift DSi pool becomes instead directly available for up-
welling at other locations, as there are intermediate
In order for opal sediments to accumulate on the water connections that allow nutrient input to lower
seafloor, some requirements need to be met, including latitude areas. Here, upwelling is actually more in-
the presence of nutrients and light conditions neces- tense due to the larger gradients in both wind strength
sary for primary producers, a relatively persistent and oceanic temperatures under glaciated conditions.
interannual export to the seafloor, and a good preser- The presence of diatom species having high preser-
vation efficiency. Sea ice has the potential to disrupt vation efficiency in the upwelling areas at this time
these conditions, and therefore plays an important role contributes to the realization of the shift, and the
Fig. 5. Establishment of the Southern Ocean Polar Front as the major silica sink. See text (Section 4.3) for explanations and Fig. 4 for data.
Additional data sources (not mentioned in Figs. 3 and 4): ODP Site 1101 [22], R/V Polarstern cores PS1451-1, PS1588-1, PS1824-1 [23].
Regions are color coded as in Fig. 4.G. Cortese et al. / Earth and Planetary Science Letters 224 (2004) 509–527 521
incorporation of its signal in the sediment, as will also and the Southern Ocean is documented by the presence
again occur at 2 Ma, when today’s opal belt gets of diatom mats in both areas, as if not only the DSi pool,
established around the Southern Ocean Polar Front but also an efficient opal export mechanism was
(Fig. 4). The earlier drop in opal deposition recorded inherited by the Southern Ocean from the Benguela
in sediments from the Riiser – Larsen Sea (core upwelling system. Opal accumulation records from the
PS1824-1, not shown) and to a lesser extent the Southern Ocean also display additional strong pulses
Bellingshausen Sea, compared to the North Pacific later than 1 Ma (Fig. 4): these can be related to the
(Fig. 4), would then reflect the higher sensitivity to latitudinal partitioning of opal within the ACC [71], a
sea ice distribution of the Southern Ocean compared consequence of the establishment of the 100-ka glacial/
to the North Pacific. Caution must be taken, however, interglacial cyclicity.
in interpreting the data [23] from the Riiser– Larsen The role of DSi in governing the export of biogenic
Sea (core PS1824-1), as opal percentages and MAR matter to the deep sea has also been discussed on a
records are slightly shifted in time and could probably shorter, glacial – interglacial time scale [72]. Pollock
be considered synchronous to their North Pacific suggests that, during the latest phases of each inter-
equivalents. This concept of a DSi pool is similar to glacial, the accelerated melting of the West Antarctic
what proposed by several recent papers [67 –69], on a ice sheet provides DSi-enriched deep and intermediate
much shorter time scale: during the Last Glacial waters to upwelling areas. The resulting enhanced
Maximum, DSi not exported in a Southern Ocean productivity of diatoms at equatorial divergences
region could be transferred to other Southern Ocean and coastal upwelling systems leads to higher opal
and/or World Ocean regions. The DSi pool remobili- (and carbon) export to the deep sea, causing atmo-
zation in this case was not, however, brought about by spheric CO2 drawdown, which acts as a trigger for
light limitation, or poorer preservation potential, due next glacial. This model (DSi transfer to upwelling
to extended ice cover, but rather by the relief of Fe areas during late interglacials) is not necessarily in
limitation, leading to lower uptake of DSi relative to conflict with the scenario we propose above (DSi
nitrate and export of unused DSi northward. transfer during increased sea-ice cover in Southern
A strong cooling took place between 3 and 2.5 Ma, a Ocean). In fact, the respective boundary conditions
period encompassing the NHG at 2.7 Ma, but also the and time scales are different, as no continental ice
shift from a monopolar- to a bipolar-glaciated world at sheet-related 100-kyr glacial –interglacial cycles were
2.6 Ma. We suggest that, in response to this cooling and present during pre-MPR time, and while Pollock’s
to the expanded sea ice cover, opal deposition in the model explains remobilization of DSi during a gla-
North Pacific and in the ‘‘marginal’’ Southern Ocean cial –interglacial cycle, our explanation deals with a
(areas close to the Antarctic Peninsula in the Belling- long-term sequestration of nutrients away from the
shausen Sea and the Riiser– Larsen Sea) collapsed and Southern Ocean due to its increased, relatively stable,
never recovered since. The enormous amount of DSi sea-ice coverage.
that became available in these two areas ended up
(Fig. 5), via intermediate water connections, to the 4.4. Opal shifts in the World Ocean: a synthesis
eastern boundary upwelling systems of Namibia, Cape
Blanc, and California, where opal deposition bloomed. The sequence of events we propose to explain the
In fact, Antarctic Intermediate Water and Pacific Inter- observed opal depositional history is as follows
mediate Water were routed, the latter via the Indian (Fig. 2): since the Mid-Miocene climatic optimum
Ocean, to the South Atlantic, and gave rise to an interval (16 Ma), a global cooling trend causes latitudinal
of increased opal and diatom deposition: Matuyama gradients to steepen and shift, leading to stronger
Diatom Maximum, MDM [70]. Eventually, at ca. 2 Ma, circulation and upwelling. Large-scale nutrient parti-
the Polar Front became a site of preference for opal tioning is more intense and efficient, and opal
deposition, and in doing so ‘‘starved’’ the Namibia deposition becomes more localized into coastal up-
upwelling system of DSi, establishing the ACC opal welling cells, as originally proposed by [73]. This
belt as we know it today. The existence of similar opal trend might also have a biological explanation, as the
export mechanisms in the Benguela upwelling system evolution of bloom-forming diatom species peaks in522 G. Cortese et al. / Earth and Planetary Science Letters 224 (2004) 509–527
the Oligocene –Miocene, at a time when the breakup eastern equatorial Pacific, where opal MAR remains
of the Pangaea supercontinent expands the availabil- high post-bloom [8]. It gets further fractioned to the
ity and importance of marginal setting habitats, thus eastern boundary current upwelling systems with oc-
increasing opal export efficiency on margins, which casional coastal episodes [20]. The North Pacific opal
is up to five times higher compared to the open breakdown shifts opal deposition mainly to eastern
ocean [74]. Since the Middle Miocene, occasional boundary current upwelling systems, and briefly there-
episodes of increased weathering and/or availability after, at ca. 2 Ma, the modern Southern Ocean opal belt
of nutrients (orogenetic episodes, spreading of ter- gets established.
restrial plants, stronger NADW) cause blooms, pre-
served in the opal record, where diatoms are able to
outcompete other organisms. 5. Perspectives
A major tectonic event (Panama Seaway closing)
contributes to the development of modern opal depo- We presented the large-scale evolution of opal
sition patterns by blocking off less carbonate-unsatu- deposition through the last 15 Myr and demonstrated
rated bottom water inflow to the Pacific and contributing how the main DSi sink in the ocean has changed
to the instauration of NADW. Both processes favor position through time, in response to oceanic condi-
opal export and preservation. The intensification of tions quite different from those prevailing today, and
glaciation in Antarctica and the large-scale oceanic leading to the establishment of the Southern Ocean as
circulation reorganization it ignites cause the main DSi main silica sink.
pool to move (Figs. 6 and 7) from the Atlantic to the There are other factors that should be taken into
Pacific Ocean. This pool gets then focused in the consideration in order to expand the significance and
equatorial Pacific, and post biogenic bloom, it declines applicability of the present study, the two most
in the central equatorial Pacific, compared to the important of which, in our opinion, are the controls
on opal dissolution/preservation and the ‘‘normaliza-
tion’’ of opal MAR in order to correct for sediment
focussing. As for the former, the uptake of Al in
diatoms has been demonstrated by culture experi-
ments [75] to increase the opal lattice stability and to
lead to stronger resistance of opal to dissolution. The
opal MAR maxima observed today in the equatorial
Pacific may represent a zone with higher than
normal aluminum values that would increase the
preservation potential of opal while, moving out of
the equator, opal MAR, Al contents, and opal
preservation potential would decrease [76]. Addition-
al controls of opal dissolution and preservation might
also affect the proposed scenarios. In this sense, this
study can be improved by further investigations of
the cycling of DSi between the deep and surface
water compartments, not only in terms of large-scale
circulation, but also in order to assess the importance
of a series of additional mechanisms for silica
dissolution and preservation. These range from the
impact of temperature changes on silica dissolution
Fig. 6. Schematic summary of the main DSi pool shifts during the kinetics [33], to bacterial activity and the destruction
last 15 My. A tectonic event (the closing of the Panama Seaway) is
also schematically shown. The widespread opal deposition in the of organic coatings [77], to the degree of diatom
Pacific Ocean was most likely caused by the oceanographic changes silicification, and to the coupling between pelagic
following an interval of strengthened glaciation on Antarctica. and benthic foodwebs.G. Cortese et al. / Earth and Planetary Science Letters 224 (2004) 509–527 523 The selective accumulation of sediments in sedi- for example, the observed shifts of opal pools between ment drifts might distort the original signal, as the the North Pacific, the Southern Ocean, and the eastern high linear sedimentation rates typical for this setting boundary upwelling systems observed between 3 and have an embedding effect on opal, increasing its 2 Ma might be connected to the appearance/disap- seabed preservation efficiency [2], i.e., how much of pearance or evolution of different ‘‘opal carriers’’ in the opal reaching the seafloor is accumulated as these areas. sediment. In order to be more accurately interpreted, opal MAR data should therefore be corrected for sediment focussing, in a similar fashion to what is Acknowledgements currently done, for more recent sediments, by the application of Thorium excess-based corrections Funded by the Deutsche Forschungsgemeinschaft [78]. However, the latter method is not applicable to as part of the DFG-Research Center ‘‘Ocean Margins’’ sediments older than 250 – 300 ka, and new methods, of the University of Bremen, No. RCOM0139 and based on the stable isotope 3He content in interplan- through Grant Ku 683/6. We would particularly like to etary dust particles, are being developed [79]. acknowledge both the SINOPS project [80] and the The role of different primary producers species Pangaea databank (http://www.pangaea.de) for making also needs to be analyzed in order to assess whether, a great deal of opal data electronically available to the Fig. 7. Summary of opal deposition shifts and events affecting/causing them. Events, trends, and climate records as in Fig. 2. The red bars represent a generalization and possible interpretation of the data seen in Fig. 3 (top half, last 20 My: shift from Atlantic to equatorial Pacific, easternmost Pacific, and Southern Ocean) and Fig. 4 (bottom half, last 5 My: shift from North Pacific/Bellingshausen/Weddell Seas to upwelling systems, and Southern Ocean, mostly Polar Front). EqPac = equatorial Pacific; Calif Upw = California upwelling system; eastPac = easternmost equatorial Pacific; SO = Southern Ocean; Npac + Coastal SO = North Pacific, Bellingshausen and Weddell Seas; EBUpw = eastern boundary currents upwelling systems.
524                             G. Cortese et al. / Earth and Planetary Science Letters 224 (2004) 509–527

scientific community. Olivier Ragueneau and two                                the determination of opal in sediments and particulate matter,
anonymous reviewers are thanked for their construc-                            Deep-Sea Research 40 (1993) 425 – 444.
                                                                        [13]   D.J. DeMaster, The supply and accumulation of silica in the
tive comments. [BARD]                                                          marine environment, Geochimica et Cosmochimica Acta 45
                                                                               (1981) 1715 – 1732.
                                                                        [14]   R.A. Mortlock, P.N. Froelich, A simple method for the rapid
References                                                                     determination of biogenic opal in pelagic marine sediments,
                                                                               Deep-Sea Research: Part 1. Oceanographic Research Papers
 [1] W.H. Berger, Biogenic deep-sea sediments: fractionation by                36 (1989) 1415 – 1426.
     deep-sea circulation, Geological Society of America Bulletin       [15]   D.J. Conley, An interlaboratory comparison for the measure-
     18 (1970) 1385 – 1402.                                                    ment of biogenic silica in sediments, Marine Chemistry 63
 [2] O. Ragueneau, P. Tréguer, A. Leynaert, R.F. Anderson, M.A.               (1998) 39 – 48.
     Brzezinski, D.J. DeMaster, R.C. Dugdale, J. Dymond, V. Martin-     [16]   J.I. Tracey Jr., G.H. Sutton, W.D. Nesteroff, J. Galehouse,
     Jézéquel, D.M. Nelson, B. Quéguiner, A review of the Si                C.C. von der Borch, T.C. Moore, J.H. Lipps, B.U. Haq, J.P.
     cycle in the modern ocean: recent progress and missing gaps               Beckmann, Initial Reports of the Deep Sea Drilling Project,
     in the application of biogenic opal as a paleoproductivity                Volume VIII, Covering Leg 8 of the Cruises of the Drilling
     proxy, Global and Planetary Change 26 (2000) 317 – 365.                   Vessel ‘‘Glomar Challenger’’, Honolulu, Hawaii to Papeete,
 [3] D.J. DeMaster, The accumulation and cycling of biogenic                   Tahiti, October – December, 1969, U.S. Government Printing
     silica in the Southern Ocean: revisiting the marine silica bud-           Office, Washington, DC, 1971, 1037 pp.
     get, Deep-Sea Research: Part 2. Topical Studies in Oceanog-        [17]   The Shipboard Scientific Party, Sites 346, 347, and 349, in: M.
     raphy 49 (2002) 3155 – 3167.                                               Talwani, G. Udintsev, et al (Eds.), Init. Rep. DSDP XXXVIII,
 [4] P. Treguer, D.M. Nelson, A.J. Van Bennekom, D.J. DeMaster,                (1976) S21 – S94.
     A. Leynaert, B. Quéguiner, The balance of silica in the world     [18]   L.A. Mayer, F. Theyer, J.A. Barron, D.A. Dunn, T. Handyside,
     ocean: a reestimate, Science 268 (1995) 375 – 379.                        S. Hills, I. Jarvis, C.A. Nigrini, N.G. Pisias, A. Pujos, T. Saito,
 [5] D.J. DeMaster, O. Ragueneau, The preservation of biogenic                 P.M. Stout, E. Thomas, N. Weinreich, R.H. Wilkens, M.G.
     silica in marine sediments and the role of continental margin             Bailey, Initial Reports of the Deep Sea Drilling Project Leg
     deposits in the marine silica budget, in: O. Ragueneau,                   85, Covering Cruises of the Drilling Vessel Glomar Challenger,
     A. Leynaert, P. Treguer (Eds.), Opaleo: On the Use of Opal                Los Angeles, California, to Honolulu, Hawaii, March – April
     as a Paleoproductivity Proxy. Minutes of the First Workshop,              1982, U.S. Government Printing Office, Washington, DC,
     Brest, 1996, pp. 68 – 71.                                                 1985, pp. 225 – 329.
 [6] J. Zachos, M. Pagani, L. Sloan, E. Thomas, K. Billups,             [19]    D. Lazarus, C. Spencer-Cervato, M. Pika-Biolzi, J.P.
     Trends, rhythms, and aberrations in global climate 65 Ma to                von Salis, K. von Salis, H. Hilbrecht, H. Thierstein, Revised
     present, Science 292 (2001) 686 – 693.                                     chronology of Neogene DSDP Holes from the World Ocean,
 [7] P.F. Barker, P.J. Barrett, A.K. Cooper, P. Huybrechts, Ant-                Ocean Drilling Program Technical Note 24 (1995), 301 pp.
     arctic glacial history from numerical models and continental       [20]   J.A. Barron, M. Lyle, I. Koizumi, Late Miocene and Early
     margin sediments, Palaeogeography, Palaeoclimatology,                     Pliocene biosiliceous sedimentation along the California mar-
     Palaeoecology 150 (1999) 247 – 267.                                       gin, Revista Mexicana de Ciencias Geológicas 19 (2002)
 [8] J.W. Farrell, I. Raffi, T.R. Janecek, D.W. Murray, M. Levitan,            161 – 169.
     K.A. Dadey, K.-C. Emeis, M. Lyle, J.-A. Flores, S. Hovan,          [21]   M.A. Maslin, G.H. Haug, M. Sarnthein, R. Tiedemann, The
     Late Neogene sedimentation patterns in the eastern equatorial             progressive intensification of northern hemisphere glaciation
     Pacific, in: N.G. Pisias, L.A. Mayer, T.R. Janecek, A. Palmer-            as seen from the North Pacific, Geologische Rundschau 85
     Julson, T.H. vanAndel (Eds.), Proc. ODP, Sci. Results, Ocean              (1996) 452 – 465.
     Drilling Program, College Station, TX, 1995, pp. 717 – 756.        [22]   C.-D. Hillenbrand, D.K. Fütterer, Neogene to Quaternary de-
 [9] L.S. Collins, A.G. Coates, W.A. Berggren, M.-P. Aubry,                    position of opal on the continental rise west of the Antarctic
     J. Zhang, The Late Miocene Panama Isthmian Strait, Geology                Peninsula, ODP Leg 178, Sites 1095, 1096, and 1101, in: P.F.
     24 (1996) 687 – 690.                                                      Barker, A. Camerlenghi, G.D. Acton, A.T.S. Ramsay (Eds.),
[10] W.F. Ruddiman, M. Raymo, A. McIntyre, Matuyama 41,000-                    Proc. ODP, Sci. Results, Ocean Drilling Program, College
     year cycles: North Atlantic Ocean and northern hemisphere                 Station, TX, 2001, pp. 1 – 33, [Online]. Available from World
     ice sheets, Earth and Planetary Science Letters 80 (1986)                 Wide Web: < http://www-odp.tamu.edu/publications/178_SR/
     117 – 129.                                                                VOLUME/CHAPTERS/SR178_023.PDF>.
[11] T. Volk, M.I. Hoffert, Ocean carbon pumps: analysis of rela-       [23]   C.-D. Hillenbrand, W. Ehrmann, Late Neogene to Quaternary
     tive strengths and efficiencies in ocean-driven atmospheric               environmental changes in the Antarctic Peninsula region: Ev-
     CO2 changes, in: E.T. Sundquist, W.S. Broecker (Eds.), The                idence from drift sediments, Global and Planetary Change
     Carbon Cycle and Atmospheric CO2: Natural Variations Ar-                  (submitted for publication).
     chean to Present, AGU, Geophys. Monogr. Ser., Washington,          [24]   A. Abelmann, R. Gersonde, V. Spiess, Pliocene – Pleistocene
     DC, 1985, pp. 99 – 110.                                                   paleoceanography in the Weddell Sea—siliceous microfossil
[12] P.J. Müller, R. Schneider, An automated leaching method for              evidence, in: U. Bleil, J. Thiede (Eds.), Geological History of
You can also read