2021 State of the Ecosystem - Mid-Atlantic - Mid-Atlantic Fishery Management ...
←
→
Page content transcription
If your browser does not render page correctly, please read the page content below
2021 State of the Ecosystem
Mid-Atlantic
2021 STATE OF THE ECOSYSTEM | Mid-Atlantic
Performance Relative to Fishery Management Objectives
Trends and status of indicators related to broad, ecosystem-level fishery management objectives, with implications for
the Mid-Atlantic Fishery Management Council (MAFMC)
Seafood production Commercial profits Recreational
(total and MAFMC (MAFMC managed opportunities
OBJECTIVE
managed landings) revenue) (effort and fleet Trend
diversity)
(INDICATOR)
Effort Fleet diversity
TREND
Increase No trend
Effort Fleet diversity
CURRENT
STATUS
Decrease Mixed trends
Surfclam/ocean quahog Primarily surfclams/ocean Recreational effort is near
landings driving commercial quahogs revenue driving long-term average, but fleet
landings decline; likely market patterns. Recent declines in diversity is decreasing due to a
driven. Recreational harvest is prices contributed to falling shift away from party/charter to
declining due to different drivers. revenue as quantities landed did shore-based fishing, decreasing
not increase enough to the range of recreational fishing
IMPLICATIONS Overfishing does not seem to be overcome declining prices. opportunities. Shore-based
the driver as ecosystem Falling prices were likely due to anglers will have access to
overfishing appears unlikely, market dynamics. different species/sizes of fish
most stocks are not overfished, than vessel-based anglers.
and system biomass trends are Monitor climate risks to
stable. surfclams and ocean quahogs.
Recommend monitoring climate
indicators as they continue
trending toward uncharted
territory, which affects stock
distributions and will generate
other ecosystem changes.
Should also monitor the
declining fishery engagement. Stability Social vulnerability Protected species
(fishery and ecosystem (community fishery (coastwide bycatch,
diversity maintained over engagement, reliance, and population numbers,
OBJECTIVE time) vulnerability) mortalities)
(INDICATOR)
Population
Fishery Ecosystem Fewer highly engaged Bycatch NARW
communities (2020 report)
Current Status
TREND
Population
Fishery Ecosystem Range of individual Bycatch
NARW
community status shown as
baseline
CURRENT
STATUS
Below long term Meeting Fishery: Commercial fleet Highlighted communities may be Bycatch trends are related to
average Objectives diversity metrics suggests stable vulnerable to changes in fishing fishery management, shifts in
capacity to respond to the patterns due to regulations population distribution combined
current range of fishing and/or climate change. When with fishery shifts, and
opportunities. Recreational any of these communities are population increase for seals.
species catch diversity has been also experiencing social
Above long term Near long term IMPLICATIONS maintained by a different set of vulnerability, they may have Population drivers for North
species over time. lower ability to successfully Atlantic Right Whales (NARW)
average average
respond to change. These include combined fishery
Ecosystem: While larval and indicators may also point to
interactions/ship strikes,
adult fish diversity indices are communities that are vulnerable
distribution shifts, and copepod
stable, a few warm-southern to environmental justice issues.
larval species are becoming availability.
more dominant. Increasing
zooplankton diversity is driven Unusual mortality events
by declining dominance of an continue for 3 large whale
important species, which species, harbor and gray seals.
warrants continued monitoring.
1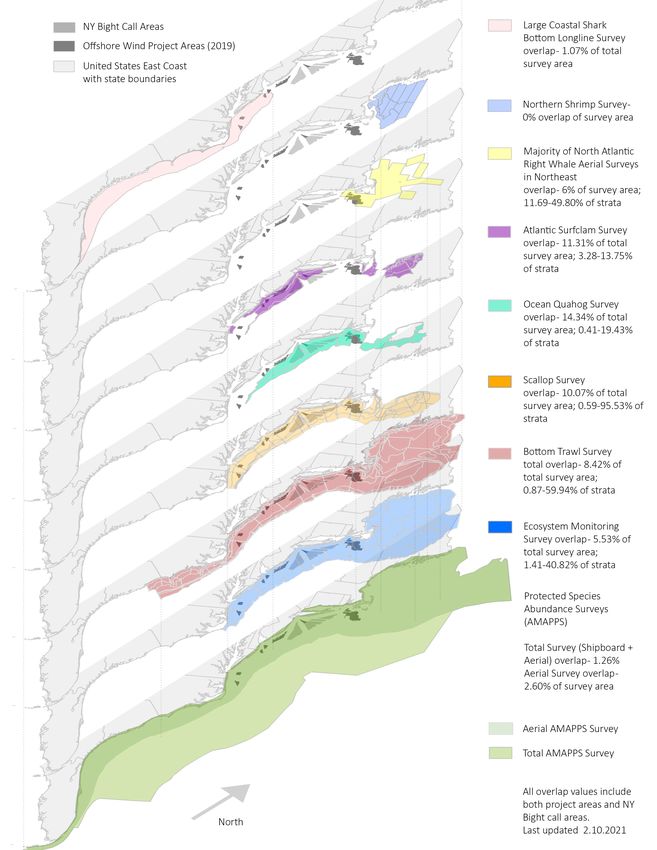
2021 STATE OF THE ECOSYSTEM | Mid-Atlantic
Risks to Meeting Fishery Management • The Mid-Atlantic had frequent ocean heatwaves
in 2020.
Objectives
• Increased primary productivity in summer
Climate and Ecosystem Productivity Risks continues, but is from smaller species that are
less likely to increase fish productivity.
Climate change, most notably ocean warming,
continues in the Mid-Atlantic and is affecting the • Temperature and zooplankton changes impact
ecosystem in various ways: fish condition for different species, impacts to
fisheries and markets are under investigation.
• Surfclams and ocean quahogs drive trends
in Mid-Atlantic commercial revenue, but are • Apex predator populations are stable (sharks) to
vulnerable because of their sensitivity to warming increasing (gray seals).
ocean temperatures and ocean acidification. New
observations show that acidification in surfclam
Other Ocean Uses: Offshore Wind Risks
summer habitat is approaching, but not yet at,
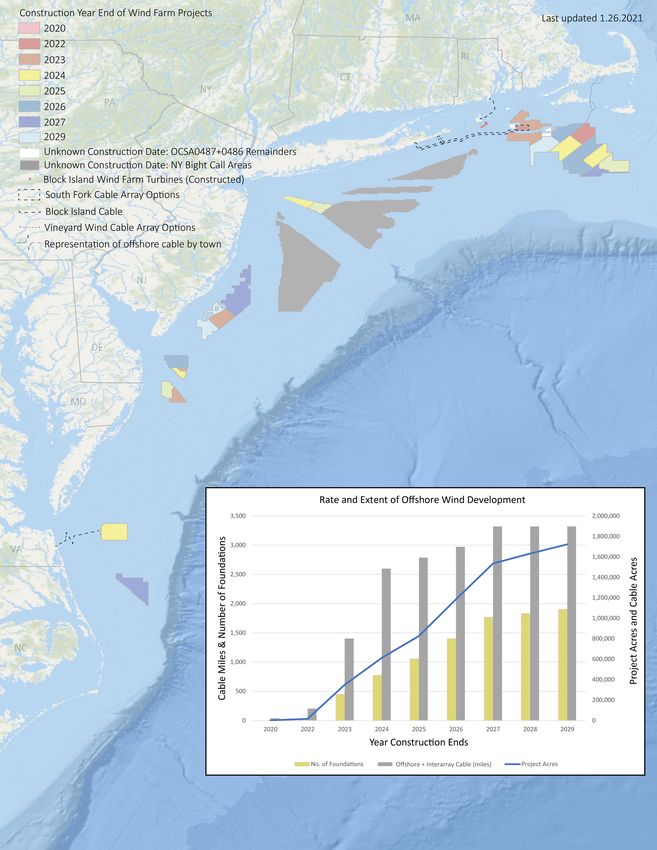
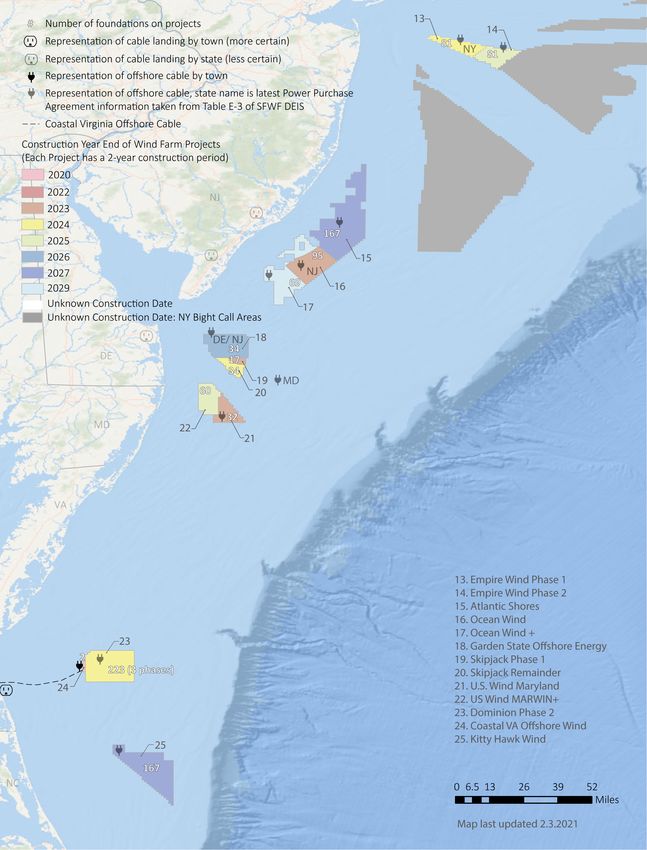
levels affecting surf clam growth. More than 20 offshore wind development projects are
proposed for construction over the next decade in
• Warmer-than-average 2020 winter water
the Northeast, covering more than 1.7 million acres
temperatures in Chesapeake Bay likely helped
by 2030. The development of multiple offshore wind
blue crabs, but hurt striped bass numbers.
sites in the Mid-Atlantic pose a number of risks and
• New habitat climate vulnerability analysis links impacts to fisheries including:
black sea bass, scup, and summer flounder to
• If all sites are developed, 2-24% of total average
several highly vulnerable nearshore habitats from
revenue could be displaced for major Mid-Atlantic
salt marsh through shallow estuarine and marine
species in lease areas.
reefs.
• Displaced fishing effort can alter fishing methods,
which can in turn change habitat, species
(managed and protected), and fleet interactions.
• Right whales may be displaced, and altered local
oceanography could affect distribution of their
zooplankton prey.
• Current plans for rapid buildout in a patchwork
of areas spreads the impacts differentially
throughout the region.
• Scientific surveys collecting data for ocean and
ecosystem conditions, fish, and protected species
will be altered, potentially increasing uncertainty
for management decision-making.
COVID-19 affected both fisheries and data
collection in 2020 (see the NOAA Fisheries
economic assessment of COVID-19 effects on the
U.S. fishing and seafood industry report). We will
continue to evaluate the impacts in the Northeast
for future SOE reports.
2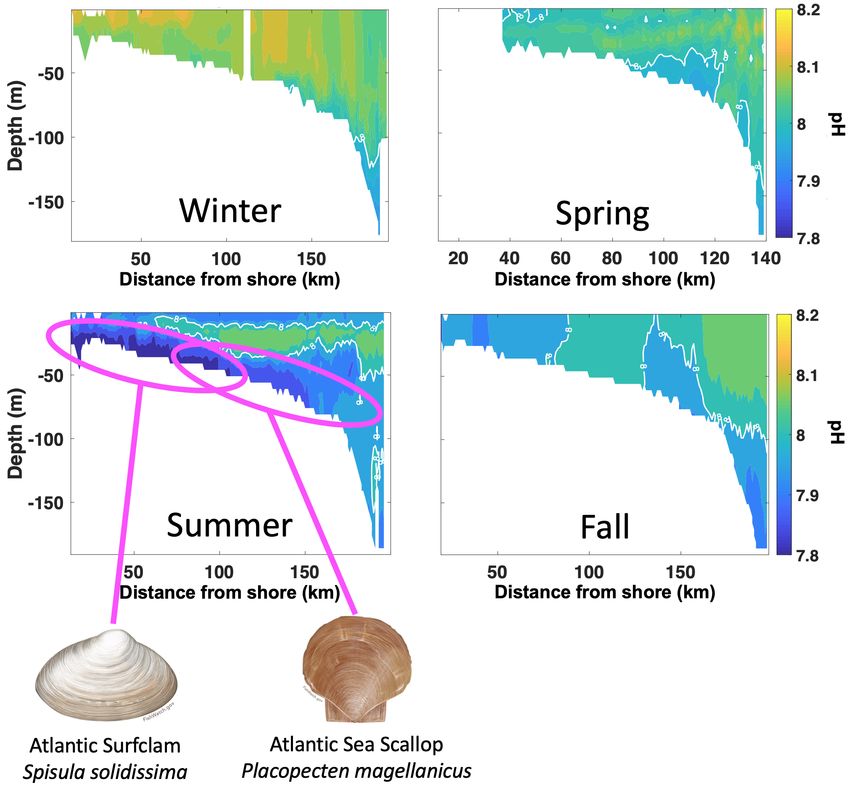
2021 STATE OF THE ECOSYSTEM   | Mid-Atlantic

Characterizing Ecosystem Change

Multiple System Drivers
           The Northeast shelf
     ecosystem is changing,
        which is affecting the
services that the ecosystem
         provides. To illustrate
   how multiple factors are
        driving change in this
complex ecosystem we are
     using three overarching
            concepts: multiple
       system drivers, regime
        shifts, and ecosystem
    reorganization. Societal,
    biological, physical and
 chemical factors comprise
   the multiple system drivers that influence
      marine ecosystems through a variety of
                                                    Regime Shift
                              different pathways.   These drivers affect fishery
                                                    management objectives such as
                                                    seafood production and recreational
                                                               opportunities, as well as
                                                               other ecosystem services
                                                               we derive from the ocean.
                                                               Changes in the multiple
                                                               drivers can lead to regime
                                                               shifts — large, abrupt and
                                                               persistent changes in the
                                                               structure and function of
                                                               an ecosystem. Regime
                                                               shifts and changes in how
                                                               the multiple system drivers
                                                               interact can result in
                                                               ecosystem reorganization
                                                               as species and humans
                                                               respond and adapt to the
                                                               new environment.

                                                                                         3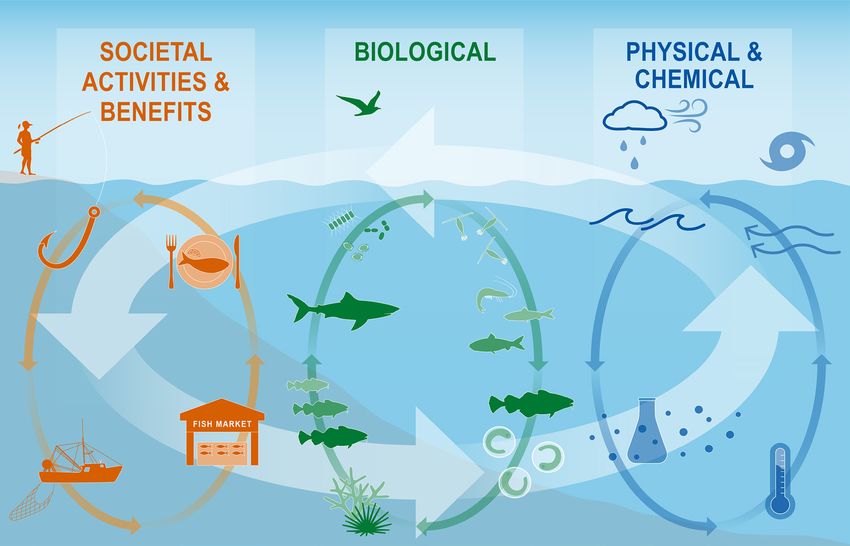
State of the Ecosystem 2021: Mid-Atlantic                                                               March 2, 2021

Introduction
About This Report
The purpose of this report is to synthesize ecosystem information to better meet fishery management objectives,
and to update the MAFMC’s Ecosystem Approach to Fishery Management (EAFM) risk assessment. The major
messages of the report are synthesized on pages 1 and 2, and synthesis themes are illustrated on page 3. The
information in this report is organized into two sections; performance measured against ecosystem-level management
objectives (Table 1), and potential risks to meeting fishery management objectives (climate change and other ocean
uses).

Report structure
The two main sections contain subsections for each management objective or potential risk. Within each subsection,
we first review indicator trends, and the status of the most recent year relative to a threshold (if available) or
relative to the long-term average. Second, we synthesize results of other indicators and information to outline
potential implications for management (i.e., connecting indicator(s) status to management and why an indicator(s)
is important). For example, if there are multiple drivers related to an indicator trend, which drivers may be more or
less supported by current information, and which, if any, can be affected by management action? Similarly, which
risk indicators warrant continued monitoring to evaluate whether regime shifts or ecosystem reorganization are
likely? We emphasize that these implications are intended to represent testable hypotheses at present, rather than
“answers,” because the science behind these indicators and syntheses continues to develop.
A glossary of terms1 , detailed technical methods documentation2 and indicator data3 are available online. The
details of standard figure formatting (Fig. 51a), categorization of fish and invertebrate species into feeding groups
(Table 2), and definitions of ecological production units (EPUs, including the Mid-Atlantic Bight, MAB; Fig. 51b)
are provided at the end of the document.

                    Table 1: Ecosystem-scale fishery management objectives in the Mid-Atlantic Bight

         Objective Categories           Indicators reported here
         Provisioning and Cultural Services
          Seafood Production   Landings; commercial total and by feeding guild; recreational harvest
          Profits              Revenue decomposed to price and volume
          Recreation           Days fished; recreational fleet diversity
          Stability            Diversity indices (fishery and ecosystem)
          Social & Cultural    Community engagement/reliance status
          Protected Species    Bycatch; population (adult and juvenile) numbers, mortalities
         Supporting and Regulating Services
           Biomass            Biomass or abundance by feeding guild from surveys
           Productivity       Condition and recruitment of managed species, Primary productivity
           Trophic structure  Relative biomass of feeding guilds, Zooplankton
           Habitat            Estuarine and offshore habitat conditions

Performance relative to fishery management objectives
In this section, we examine indicators related to broad, ecosystem-level fishery management objectives. We also
provide hypotheses on the implications of these trends—why we are seeing them, what’s driving them, and potential
or observed regime shifts or changes in ecosystem structure. Identifying multiple drivers, regime shifts, and potential
changes to ecosystem structure, as well as identifying the most vulnerable resources, can help managers determine
whether we can do anything differently to meet objectives and how to prioritize for upcoming issues/risks.
  1 https://noaa-edab.github.io/tech-doc/glossary.html
  2 https://NOAA-EDAB.github.io/tech-doc
  3 https://github.com/NOAA-EDAB/ecodata

                                                           4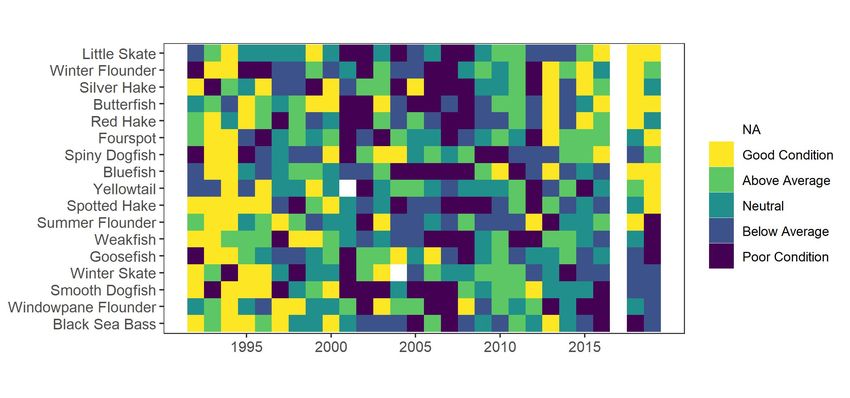
State of the Ecosystem 2021: Mid-Atlantic

Seafood Production
Indicators: Landings; total and by feeding guild
All seafood landed by commercial fisheries (total landings) and MAFMC’s managed species landings (a subset of the
total) continue to trend downward in the MAB (Fig. 1). The downward trend is most significant in the benthos
(clams) group (Fig. 2).

                                                           Total Landings
                                                     250
                          Landings (103mt)

                                                     200
                                                     150
                                                     100
                                                     50
                                                               1990       1995   2000   2005   2010   2015

         Figure 1: Total commercial seafood landings (black) and Mid-Atlantic managed seafood landings (red).

                                                           Piscivores
                                                     80
                                                     60
                                                     40
                                                     20
                                                               1990       1995   2000   2005   2010   2015

                                                           Planktivores
                                                     60

                                                     40
                         Landings (103metric tons)

                                                     20

                                                      0
                                                               1990       1995   2000   2005   2010   2015

                                                           Benthivores

                                                     60
                                                     40
                                                     20
                                                      0
                                                               1990       1995   2000   2005   2010   2015

                                                           Benthos

                                                     60
                                                     50
                                                     40
                                                     30
                                                     20
                                                               1990       1995   2000   2005   2010   2015

       Figure 2: Total commercial landings (black) and MAFMC managed species landings (red) by feeding guild.

                                                                                   5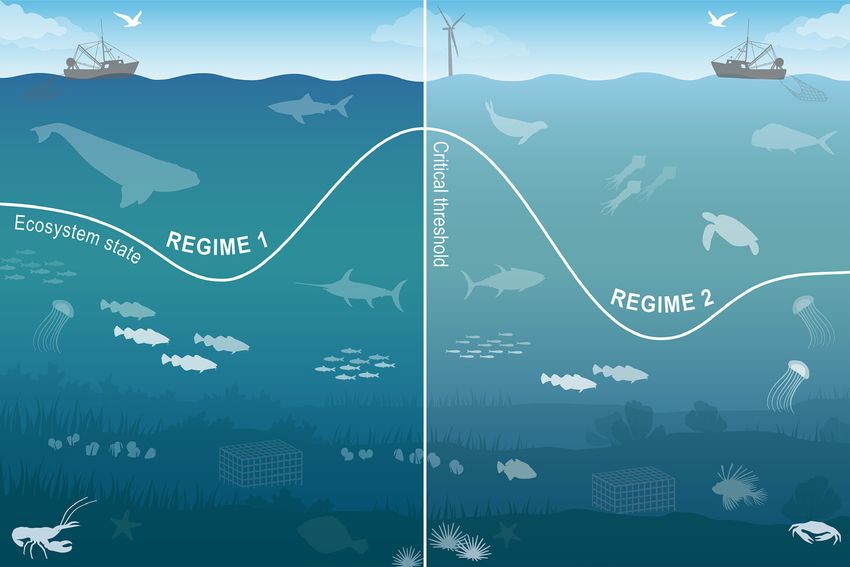
State of the Ecosystem 2021: Mid-Atlantic

Total recreational harvest (retained fish presumed to be eaten) is also down in the MAB (Fig. 3).

                                                          Recreational seafood harvest

                                                    250
                                     Landings (N)   200

                                                    150

                                                    100

                                                            1985   1990   1995   2000    2005   2010    2015

                Figure 3: Total recreational seafood harvest (millions of fish) in the Mid-Atlantic region.

Recreational shark landings show an increase in pelagic sharks over the past decade, with a sharp decrease in 2018
and 2019 (Fig 4). This is likely influenced by regulatory changes implemented in 2018 intended to rebuild shortfin
mako stocks.

                                 200000
                  Landings (N)

                                 150000                                                                        LargeCoastal
                                                                                                               Pelagic
                                 100000
                                                                                                               Prohibited
                                  50000
                                                                                                               SmallCoastal
                                          0
                                           1980                1990       2000       2010        2020

                                            Figure 4: Recreational shark landings from Large Pelagics Survey.

Aquaculture production is not yet included in total seafood landings, but we are working toward including it in
future reports. Available aquaculture production of oysters for a subset of Mid-Atlantic states is trending upward.4

Implications
Declining commercial and recreational landings can be driven by many interacting factors, including combinations of
ecosystem and stock production, management actions, market conditions, and environmental change. While we
cannot evaluate all possible drivers at present, here we evaluate the extent to which ecosystem overfishing (total
landings exceeding ecosystem productive capacity), stock status, and system biomass trends may play a role.

Ecosystem Overfishing Indices Thresholds for ecosystem-level overfishing based on system production characteris-
tics have been proposed [1], and are applied here for the MAB. The proposed ecosystem overfishing thresholds are
calculated based on total catch while our preliminary indicators are based on commercial landings. Therefore, our
current indicators are underestimated compared with the proposed thresholds. In future reports we may be able to
include commercial discards and recreational removals to evaluate total catch.
Based on either the ratio of total landings to total primary production (Fogarty Index, Fig. 5), or total landings per
unit area (Ryther Index, Fig. 6), MAB landings are at or below the proposed thresholds, so ecosystem overfishing is
unlikely to be a major factor driving decreased landings.

  4 https://noaa-edab.github.io/ecodata/human_dimensions_MAB#Commercial;                        “Oyster Aquaculture” tab

                                                                                 6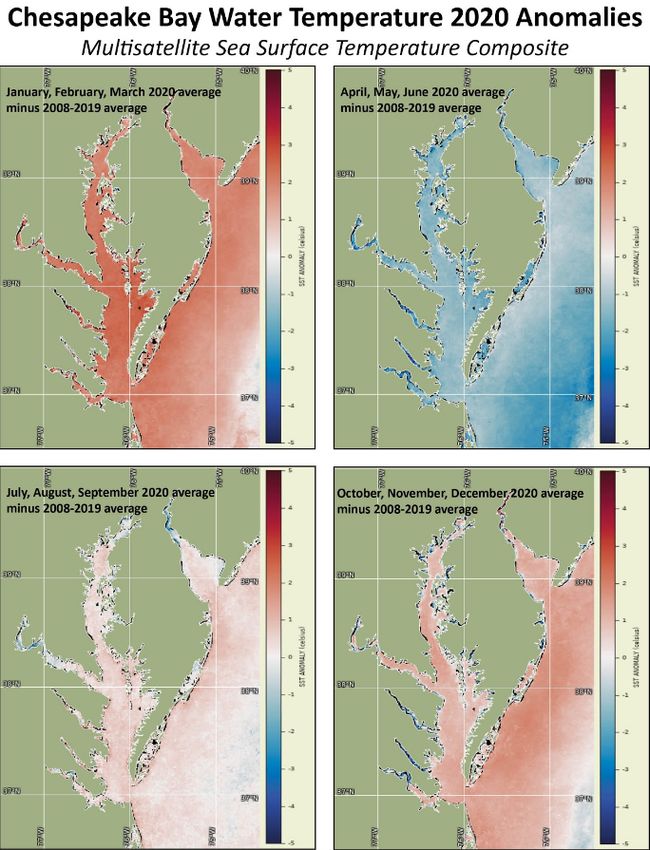
State of the Ecosystem 2021: Mid-Atlantic

                                                          Fogarty Index
                                                    2.5
                                                    2.0
                                                    1.5

                          PPT                       1.0
                                                    0.5
                                                    0.0
                                                       1960               1980          2000   2020

Figure 5: Fogarty Index; the ratio of total landings to total primary production in the MAB. Link and Watson (2019) give an
optimal range (green shading) of the Fogarty ratio of 0.22 to 0.92 parts per thousand (PPT). Previous work suggested that
index values exceeding 1 to 2 PPT (orange shading) led to ecosystem tipping points.

                                                        Ryther Index
                                                    5
                                                    4
                          mt km-2 y-1

                                                    3
                                                    2
                                                    1
                                                    0
                                                     1960                 1980          2000   2020

Figure 6: Ryther index; total landings presented on a unit area basis for the MAB. Theoretical estimates (Link and Watson,
2019) imply the index should range from 0.3 - 1.1 mt per sq km annually (green shading) with a limit of 3 mt per sq km
annually, above which tipping points could occur in fished ecosystems (orange shading). Expected system-wide MSYs can be
in the range of 1 to 3 mt per sq km (unshaded).

The amount of potential yield we can expect from a marine ecosystem depends on the amount of production entering
at the base of the food web, primarily in the form of phytoplankton; the pathways this energy follows to reach
harvested species; the efficiency of transfer of energy at each step in the food web; and the fraction of this production
that is removed by the fisheries. The fraction of production removed by fisheries has declined since the late 1990s
(Fig. 7). The overall trend is largely driven by the decrease in landings with an increase in primary production over
the same period. Current fisheries remove a lower proportion of the ecosystem’s primary production now than in the
1970s, when the Fogarty and Ryther indices suggest that ecosystem overfishing may have occurred.

                                                          Primary Production Required
                          Proportion of Total PPD

                                                    0.2

                                                    0.1

                                                    0.0
                                                       1960               1980          2000   2020

Figure 7: Primary production required to support MAB commercial landings. Included are the top species accounting for 80%
of the landings in each year, with 15% transfer efficiency assumed between trophic levels. PPD is total primary production.
The solid line is based on satellite-derived PPD and the dashed line is based on primary production reconstructed using the
mean of satellite-derived PPD from 1998-2010.

                                                                                 7
State of the Ecosystem 2021: Mid-Atlantic

Stock Status Single species management objectives of maintaining biomass above minimum thresholds and fishing
mortality below limits are being met for all but two MAFMC managed species, though the status of six stocks
is unknown (Fig. 8). Therefore, stock status and associated management constraints are unlikely to be driving
decreased landings. To better address the role of management in future reports, we could examine how the total
allowable catch (TAC) and the percentage of the TAC taken for each species has changed through time.

         2.0
                                                                                 Unknown Status
                   Mackerel                                                          Longfin Squid
                                                                                     Shortfin Squid
         1.5
                                                                                     N. Goosefish
                                                                                     S. Goosefish
                                                                                    Blueline Tilefish
                                                                                                              Council
F Fmsy

         1.0                                                                                                       Both
                              Sp. Dogfish
                                              G Tilefish                                   Bl Sea Bass             MAFMC
                           Bluefish                                              Scup
                                      Fluke
         0.5

                                                        Surfclam
                                 Butterfish Quahog
         0.0

               0                              1                                 2
                                                      B Bmsy

Figure 8: Summary of single species status for MAFMC and jointly federally managed stocks (Goosefish and Spiny dogfish).
Stocks in green are below the biomass threshold (overfished), stocks in orange are above the biomass threshold but below the
biomass target, and stocks in purple are above the biomass target. Only one stock, Atlantic mackerel, has fishing mortality
above the limit (subject to overfishing).

System Biomass Although aggregate biomass trends derived from scientific resource surveys are mostly stable in
the MAB, spring piscivores and fall benthos show long-term increases (Fig. 9). The NEAMAP Fall 2020 survey
was completed and is included here; NEFSC surveys were not completed in 2020. While managed species make up
varying proportions of aggregate biomass, trends in landings are not mirroring shifts in the overall trophic structure
of survey-sampled fish and invertebrates. Therefore, major shifts in feeding guilds or ecosystem trophic structure are
unlikely to be driving the decline in landings.

                                                             8
State of the Ecosystem 2021: Mid-Atlantic

                              Piscivore Spring                                        Piscivore Fall
Biomass (kg tow−1)

                     200

                     100

                          0
                                   1975            1985    1995    2005    2015             1975         1985    1995   2005   2015

                              Benthivore Spring                                       Benthivore Fall
Biomass (kg tow−1)

                     150

                     100

                         50

                          0
                                   1975            1985    1995    2005    2015             1975         1985    1995   2005   2015

                              Planktivore Spring                                      Planktivore Fall
Biomass (kg tow−1)

                     100

                         50

                          0

                                   1975            1985    1995    2005    2015             1975         1985    1995   2005   2015

                          Benthos Spring                                             Benthos Fall
Biomass (kg tow−1)

                     9
                     6
                     3
                     0
                                 1975            1985     1995    2005    2015            1975           1985    1995   2005   2015

Figure 9: Spring (left) and fall (right) surveyed biomass in the Mid-Atlantic Bight. Data from the NEFSC Bottom Trawl
Survey are shown in black, with NEAMAP shown in red. The shaded area around each annual mean represents 2 standard
deviations from the mean.

Effect on Seafood Production Because ecosystem overfishing seems unlikely, stock status is mostly acceptable,
and aggregate biomass trends appear stable, the decline in commercial landings is most likely driven by market
dynamics affecting the landings of surfclams and ocean quahogs, as quotas are not binding for these species.
Climate change also seems to be shifting the distribution of surfclams and ocean quahogs, resulting in areas with
overlapping distributions and increased mixed landings. Given the regulations governing mixed landings, this could
become problematic in the future and is currently being evaluated by the Council.
The decline in recreational seafood landings stems from other drivers. Some of the decline, such as that for
recreational shark landings, is driven by management intended to reduce fishing mortality on mako sharks. However,
NOAA Fisheries’ Marine Recreational Information Program survey methodology was updated in 2018, so it is unclear
whether the record-low landings for species other than sharks in 2018 are driven by changes in fishing behavior or
the change in the survey methodology.
Other environmental changes require monitoring as they may become important drivers of landings in the future:
                     • Climate is trending into uncharted territory. Globally, 2020 was tied with the warmest year on record5 with
                       regional marine heatwaves apparent (see Climate Risks section).

                 5 https://www.nasa.gov/press-release/2020-tied-for-warmest-year-on-record-nasa-analysis-shows

                                                                                 9
State of the Ecosystem 2021: Mid-Atlantic
• Stocks are shifting distribution, moving towards the northeast and into deeper waters throughout the Northeast
US Large Marine Ecosystem (Fig. 10).
Along-shelf distance
920
Distance (km) 880
840
800
760
1970 1980 1990 2000 2010 2020
Depth
-100
Depth (m)
-110
-120
1970 1980 1990 2000 2010 2020
Figure 10: Aggregate species distribution metrics for species in the Northeast Large Marine Ecosystem.
• Some ecosystem composition and production changes have been observed (see Stability section).
• Fishing engagement has declined in some communities (see Social and Cultural section).
Commercial Profits
Indicators: revenue (a proxy for profits), with price and volume components
Total commercial revenue (black) has increased over the long term, but the trend may be reversing, with recent
total revenue below the long-term average (Fig. 11). The MAFMC-managed species revenue (red) has continued its
downward trend, with recent years near a time-series low.
Total revenue
Revenue (106USD)
1000
750
500
250
1990 1995 2000 2005 2010 2015
Figure 11: Total revenue for the region (black) and revenue from MAFMC managed species (red).
Revenue earned by harvesting resources is a function of both the quantity landed of each species and the prices paid
for landings. Beyond monitoring yearly changes in revenue, it is even more valuable to determine what drives these
changes: harvest levels, the mix of species landed, price changes, or a combination of these. The Bennet Indicator
decomposes revenue change into two parts, one driven by changing quantities (volumes), and a second driven by
changing prices.
10State of the Ecosystem 2021: Mid-Atlantic
Total revenue trends, decomposed to price and volume indicators (Fig. 12), mirror price and volume indicator trends
for the benthos (clams and scallops; orange in Fig. 13) group, especially over the past decade.
Bennet Indicator
Value $1,000,000 ($2015)
550 Indicators
450
350 Price
250
150 Volume
50
-50
-150 Revenue Change
-250
-350 $
-450
1985 1990 1995 2000 2005 2010 2015
Figure 12: Revenue change from the 2015 values in dollars (black), Price (PI), and Volume Indicators (VI) for commercial
landings in the Mid-Atlantic Bight.
Bennet Indicator
Guild
Price Volume
Apex
500
Value $1,000,000 ($2015)
400 Piscivore
300 Planktivore
200
Benthivore
100
0 Benthos
-100 Other
-200
-300
-400 Component
1990 2000 2010 2020 1990 2000 2010 2020
$
Figure 13: Total component value in dollars (black) for commercial landings in the Mid-Atlantic Bight.
Implications
The Bennet indicator demonstrates that increasing total revenue early in the time series is due to increasing quantities
landed, which offset declining prices. Recent declines in prices contributed to falling revenue as quantities landed did
not increase enough to counteract declining prices.
Changes in other indicators, particularly those driving landings and those related to climate change, require
monitoring as they may become important drivers of revenue in the future; for example:
• Surfclams and ocean quahogs are sensitive to warming ocean temperatures and ocean acidification.
• Acidification levels in surfclam summer habitat are approaching, but not yet at, levels affecting surfclam
growth (see Climate Risks section).
Recreational Opportunities
Indicators: Angler trips, fleet diversity
Recreational effort (angler trips) has no significant long term trend, with current effort near the long-term average
(Fig. 14). However, recreational fleet diversity has declined over the long term (Fig. 15).
11State of the Ecosystem 2021: Mid-Atlantic
Recreational effort
Days fished (106 N)
70
60
50
40
30
20
1990 2000 2010 2020
Figure 14: Recreational effort in the Mid-Atlantic.
Rec. fleet effort diversity
2.75
Effective Shannon
2.50
2.25
2.00
1.75
1990 2000 2010 2020
Figure 15: Recreational fleet effort diversity in the Mid-Atlantic.
Implications
The absence of a long-term trend in recreational effort suggests relative stability in the overall number of recreational
opportunities in the MAB. However, the decline in recreational fleet diversity suggests a potentially reduced range of
opportunities.
The downward effort diversity trend is driven by party/charter contraction (from a high of 24% of angler trips to 7%
currently), and a shift toward shorebased angling. Effort in private boats remained stable between 36-37% of angler
trips across the entire series.
Changes in recreational fleet diversity can be considered when managers seek options to maintain recreational
opportunities. Shore anglers will have access to different species than vessel-based anglers, and when the same
species, typically smaller fish. Many states have developed shore-based regulations where the minimum size is lower
than in other areas and sectors to maintain opportunities in the shore angling sector.
Stability
Indicators: fishery fleet and catch diversity, ecological component diversity
While there are many potential metrics of stability, we use diversity indices as a first check to evaluate overall
stability in fisheries and ecosystems. In general, diversity that remains constant over time suggests a similar capacity
to respond to change over time. A significant change in diversity over time does not necessarily indicate a problem
or an improvement, but does indicate a need for further investigation. We examine commercial and recreational fleet
and species catch diversity, and diversity in zooplankton, larval, and adult fish.
Fishery Diversity Diversity estimates have been developed for fleets and species landed by commercial vessels with
Mid-Atlantic permits. A fleet is defined here as the combination of gear type (Scallop Dredge, Other Dredge, Gillnet,
Hand Gear, Longline, Bottom Trawl, Midwater Trawl, Pot, Purse Seine, or Clam Dredge) and vessel length category
(Less than 30 ft, 30 to 50 ft, 50 to 75 feet, 75 ft and above). Commercial fishery fleet count and fleet diversity have
12State of the Ecosystem 2021: Mid-Atlantic
been stable over time in the MAB, with current values near the long-term average (Fig. 16). This indicates similar
commercial fleet composition and species targeting opportunities over time.
Fleet count
Count (n) 40
30
20
2000 2005 2010 2015 2020
Fleet diversity
Effective Shannon
10
5
0
2000 2005 2010 2015 2020
Figure 16: Fleet diversity and fleet count in the Mid-Atlantic.
Commercial fisheries are relying on fewer species relative to the mid-90s, but current species revenue diversity has
been consistent since then and is currently near the long term average (Fig. 17).
Permit revenue species diversity
2.4
Effective Shannon
2.3
2.2
2.1
2.0
1.9
2000 2005 2010 2015 2020
Figure 17: Species revenue diversity in the Mid-Atlantic.
As noted above recreational fleet effort diversity is unstable (declining; Fig. 15). However, recreational species catch
diversity is stable and has been at or above the long term average in 7 of the last 10 years (Fig. 18).
13State of the Ecosystem 2021: Mid-Atlantic
Rec. diversity of catch
10.5
Effective Shannon
10.0
9.5
9.0
8.5
8.0
1990 2000 2010 2020
Figure 18: Diversity of recreational catch in the Mid-Atlantic.
Ecological Diversity Ecological diversity indices show mixed trends. Zooplankton diversity is increasing in the
MAB (Fig. 19). Adult fish diversity is measured as the expected number of species in a standard number of
individuals sampled from the NEFSC bottom trawl survey. There is no vessel correction for this metric, so indices
collected aboard the research vessel Albatross IV (up to 2008) and research vessel Bigelow (2009-present) are
calculated separately. Larval fish and adult fish diversity indices are stable over time, with current values near the
long-term average (Figs. 20, 21).
Zooplankton Diversity
Shannon Diversity
2.75
2.50
2.25
2.00
1.75
1980 1990 2000 2010 2020
Figure 19: Zooplankton diversity in the Mid-Atlantic Bight, based on Shannon diversity index.
Mid-Atlantic larval diversity
2.7
Shannon Diversity
2.4
2.1
1.8
2000 2005 2010 2015 2020
Figure 20: Larval fish diversity in the Mid-Atlantic Bight, based on Shannon diversity index.
14State of the Ecosystem 2021: Mid-Atlantic
Expected Number of Species -Fall
n species per 1000 ind 20
15 Albatross
Bigelow
10
5
1965 1975 1985 1995 2005 2015
Figure 21: Adult fish diversity the Mid-Atlantic Bight, based on expected number of species.
Implications
Fleet diversity indices are used by the MAFMC to evaluate stability objectives as well as risks to fishery resilience
and maintaining equity in access to fishery resources [2].
Stability in commercial fleet diversity metrics suggests stable capacity to respond to the current range of fishing
opportunities.
Declining recreational fleet effort diversity, as noted above, indicates that the party/charter boat sector continues to
contract, with shoreside angling becoming more important, as a percentage of recreational days fished.
Stability in recreational species catch diversity has been maintained by a different set of species over time. A recent
increase in Atlantic States Marine Fisheries Commission (ASMFC) and South Atlantic Fishery Management Council
(SAFMC) managed species in recreational catch is helping to maintain diversity in the same range that MAFMC
and New England Fishery Management Council (NEFMC) species supported in the 1990s.
Ecological diversity indices can provide insight into ecosystem structure. Changes in ecological diversity over time
may indicate altered ecosystem structure with implications for fishery productivity and management [3].
Increasing zooplankton diversity is driven by the declining dominance of the calanoid copepod Centropages typicus,
with a similar composition of other zooplankton species.
Stable larval and adult fish diversity indicates the same overall number and evenness over time, but doesn’t rule out
species substitutions (e.g., warm-water replacing cold-water). While larval fish diversity is near the long-term mean,
the dominance of a few warm-water taxa has increased. Stable but variable larval diversity can indicate interannual
changes in a dominant species.
In the MAB, existing diversity indicators suggest overall stability in the fisheries and ecosystem components
examined. However, declining recreational fleet diversity suggests a potential loss in the range of recreational fishing
opportunities, and increasing zooplankton diversity is due to the declining dominance of an important species,
suggesting change in the zooplankton community that warrants continued monitoring to determine if managed
species are affected.
Social Vulnerability
Indicators: Social vulnerability in commercial and recreational fishing communities
Social vulnerability measures social factors that shape a community’s ability to adapt to change and does not
consider gentrification pressure (see detailed definitions). Communities that ranked medium-high or above for one or
more of the following indicators: poverty, population composition, personal disruption, or labor force structure, are
highlighted in red.
Commercial fishery engagement measures the number of permits, dealers, and landings in a community, while
reliance expresses these numbers based on the level of fishing activity relative to the total population of a community.
In 2020, we reported that the number of highly engaged Mid-Atlantic commercial fishing communities had declined
15State of the Ecosystem 2021: Mid-Atlantic
over time, and engagement scores had also declined in medium-highly engaged communities. Here we focus on
the top ten most engaged, and top ten most reliant commercial fishing communities and their associated social
vulnerability (Fig. 22). Barnegat Light and Cape May, NJ, and Reedville, VA are highly engaged and reliant with
medium-high to high social vulnerability.
Social Vulnerability in Top Commercial Fishing Communities
Low High
Barnegat Light, NJ MedHigh to High Social Vulnerability
Other Communities
4
Commercial Reliance Score
Reedville, VA
2 Hobucken, NC
Cape May, NJ
Rodanthe, NC Wanchese, NC Montauk, NY
Beaufort, NC Point Pleasant Beach, NJ
Ocracoke, NC
0 Hampton Bays/ Shinnecock, NY Newport News, VA
Atlantic City, NJ
0 4 8 12
Commercial Engagament Score
Low High
Figure 22: Commercial engagement, reliance, and social vulnerability for the top commercial fishing communities in the
Mid-Atlantic.
Recreational fishery engagement measures shore, private vessel, and for-hire fishing activity while reliance expresses
these numbers based on fishing effort relative to the population of a community. Of the nine recreational communities
that are most engaged and reliant, Avon, Ocracoke and Hatteras, NC and Barnegat Light and Cape May, NJ scored
medium-high or above for social vulnerability (Fig. 23).
Both commercial and recreational fishing are important activities in Montauk, NY; Barnegat Light, Cape May, and
Point Pleasant Beach, NJ; and Ocracoke and Rodanthe, NC, meaning some of these communities may be impacted
simultaneously by commercial and recreational regulatory changes. Of these communities, three scored medium-high
or above for social vulnerability.
16State of the Ecosystem 2021: Mid-Atlantic
Social Vulnerability in Top Recreational Fishing Communities
15 Barnegat Light, NJ
Low High
MedHigh to High Social Vulnerability
Other Communities
Recreation Reliance Score
10
Ocracoke, NC
Avon, NC
5
Rodanthe, NC Topsail Beach, NC Hatteras, NC
Nags Head, NC
Friendship, MD
Atlantic Beach, NC Montauk, NY Cape May, NJ Babylon, NY
Nanticoke, MD
Atlantic Highlands, NJ Point Pleasant Beach, NJ
0
Morehead City, NC Virginia Beach, VA
0 4 8 12
Recreation Engagament Score
Low High
Figure 23: Recreational engagement, reliance, and social vulnerability for the top recreational fishing communities in the
Mid-Atlantic.
Implications
These plots provide a snapshot of the relationship between social vulnerability and the most highly engaged and
most highly reliant commercial and recreational fishing communities in the Mid-Atlantic. Similar plots are used to
inform the annual California Current Ecosystem Status Report. These communities may be vulnerable to changes in
fishing patterns due to regulations and/or climate change. When any of these communities are also experiencing
social vulnerability, they may have lower ability to successfully respond to change. These indicators may also point
to communities that are vulnerable to environmental justice issues. Additional analysis related to ecosystem shifts
and National Standard 8 of the Magnuson-Stevens Act is ongoing.
Protected Species
Protected species include marine mammals protected under the Marine Mammal Protection Act, endangered and
threatened species protected under the Endangered Species Act, and migratory birds protected under the Migratory
Bird Treaty Act. In the Northeast U.S., endangered/threatened species include Atlantic salmon, Atlantic and
shortnose sturgeon, all sea turtle species, and five baleen whales. Fishery management objectives for protected
species generally focus on reducing threats and on habitat conservation/restoration. Here we report on the status of
these actions as well as indicating the potential for future interactions driven by observed and predicted ecosystem
changes in the Northeast U.S. region. Protected species objectives include managing bycatch to remain below
potential biological removal (PBR) thresholds, recovering endangered populations, and monitoring unusual mortality
events (UMEs).
17State of the Ecosystem 2021: Mid-Atlantic
Indicators: bycatch, population (adult and juvenile) numbers, mortalities
Average indices for both harbor porpoise (Fig. 24) and gray seal bycatch (Fig. 25) are below current PBR thresholds,
meeting management objectives. However, the 2019 bycatch estimate for gray seals was highest in the time series.
Harbor Porpoise Bycatch
3000
Estimated Bycatch (n)
5yr rolling mean and confidence interval
2000 Annual estimates
PBR
1000
0
1990 2000 2010 2020
year
Figure 24: Harbor porpoise average bycatch estimate for Mid-Atlantic and New England fisheries (blue) and the potential
biological removal (red). 2019 estimates are preliminary.
Gray Seal Bycatch
2000
5yr rolling mean and confidence interval
Estimated Bycatch (n)
1500 NE Annual estimates
PBR
1000
500
0
1995 2000 2005 2010 2015 2020
Figure 25: Gray Seal average bycatch estimate for New England gillnet fisheries (blue) and and the potential biological
removal (red). 2019 estimates are preliminary.
The North Atlantic right whale population was on a recovery trajectory until 2010, but has since declined (Fig. 26).
Reduced survival rates of adult females and diverging abundance trends between sexes have also been observed. It is
estimated that there are only about 100 adult females remaining in the population.
18State of the Ecosystem 2021: Mid-Atlantic
NARW abundance
Abundance (n)
450
400
350
300
250
1990 2000 2010 2020
Figure 26: Estimated North Atlanic right whale abundance on the Northeast Shelf.
North Atlantic right whale calf counts have also been declining (Fig. 27). In 2018 there were zero observed new
calves, and a drop in annual calves roughly mirrors the abundance decline, however seven new calves were born in
2019. Preliminary 2020 observations of 12 calves have been recorded as of January 2021.
NARW calf abundance
40
Abundance (n)
30
20
10
0
1990 2000 2010 2020
Figure 27: Number of North Atlantic right whale calf births, 1990 - 2019.
This year, four Unusual Mortality Events (UMEs) continued, three for large whales (North Atlantic right whales,
humpback whales, and minke whales) and one for gray and harbor seals.
Since 2017, the total UME right whale mortalities includes 32 dead stranded whales, 11 in the US and 21 in Canada.
When alive but seriously injured whales (14) are taken into account, 46 individual whales are included in the
UME. During 2020, two mortalities were documented, however, recent research suggests that many mortalities go
unobserved and the true number of mortalities are about three times the count of the observed mortalities [4]. The
primary cause of death is “human interaction” from entanglements or vessel strikes.
Coastal bottlenose dolphin stocks off North Carolina and Virginia are listed as depleted, so a take reduction team
met in 2019 and has been evaluating and implementing some of the team’s consensus recommendations.
Also, a UME for both gray and harbor seals was declared in 2018 due to a high number of mortalities thought to be
caused by phocine distemper virus.
Implications
Bycatch management measures have been implemented to maintain bycatch below Potential Biological Removal
(PBR) thresholds. The downward trend in harbor porpoise bycatch can also be due to a decrease in harbor porpoise
abundance in US waters, reducing their overlap with fisheries, and a decrease in gillnet effort. The increasing trend
in gray seal bycatch may be related to an increase in the gray seal population (U.S. pup counts).
The number of gray seals in U.S. waters has risen dramatically in the last three decades. Based on a survey conducted
in 2016, the size of the gray seal population in the U.S. during the breeding season was approximately 27,000 animals,
while in Canada the population,was estimated to be roughly 425,000. A survey conducted in 2021 in both countries
will provide updated estimates of abundance. The population in Canada is increasing at roughly 4% per year, and
19State of the Ecosystem 2021: Mid-Atlantic
contributing to rates of increase in the U.S., where the number of pupping sites has increased from 1 in 1988 to 9 in
2019. Mean rates of increase in the number of pups born at various times since 1988 at four of the more data-rich
pupping sites (Muskeget, Monomoy, Seal, and Green Islands) ranged from no change on Green Island to high rates
increase on the other three islands, with a maximum increase of 26.3% (95%CI: 21.6 - 31.4%; [5] and see Figure in
New England SOE report). These high rates of increase provide further support for the hypothesis that seals from
Canada are continually supplementing the breeding population in U.S. waters.
Strong evidence exists to suggest that interactions between right whales and the offshore lobster gear in the U.S. and
snow crab gear in Canada is contributing substantially to the decline of the species. Further, right whale distribution
has changed since 2010. New research suggests that recent climate driven changes in ocean circulation have resulted
in right whale distribution changes driven by increased warm water influx through the Northeast Channel, which
has reduced the primary right whale prey (Calanus finmarchicus) in the central and eastern portions of the Gulf of
Maine [6–8].
The UMEs are under investigation and are likely the result of multiple drivers. For all three large whale UMEs,
human interaction appears to have contributed to increased mortalities, although investigations are not complete.
An investigation into the cause of the seal UME so far suggests phocine distemper virus as a potential cause.
A marine mammal climate vulnerability assessment is currently underway for Atlantic and Gulf of Mexico populations
and will be reported on in future versions of this report.
Risks to meeting fishery management objectives
Climate and Ecosystem Productivity
Climate Change Indicators: ocean currents, temperature, heatwaves, acidification
Regional ocean current indicators remain at unprecedented levels. In 2019, the Gulf Stream was at its most northern
position since 1993 (Fig. 28). A more northerly Gulf Stream position is associated with warmer ocean temperature
on the Northeast US shelf [9], a higher proportion of Warm Slope Water in the Northeast Channel, and increased
sea surface height along the U.S. east coast [10].
Gulf Stream Index
Gulf Stream position anomaly
1
0
-1
2000 2010 2020
Figure 28: Index representing changes in the location of the Gulf Stream north wall. Positive values represent a more northerly
Gulf Stream position.
In 2019, we also observed the second lowest proportion of Labrador Slope Water entering the Gulf of Maine since
1978 (Fig. 29). The changing proportions of source water affect the temperature, salinity, and nutrient inputs to the
Gulf of Maine ecosystem.
20State of the Ecosystem 2021: Mid-Atlantic
Percent of Total Slopewater
Slopewater Proportions in NE Channel
100
75 Origin
50 WSW
25 LSLW
0
1980 1990 2000 2010
Figure 29: Proportion of Warm Slope Water (WSW) and Labrador Slope Water (LSLW) entering the GOM through the
Northeast Channel.
Ocean temperatures continue to warm at both the bottom (Fig. 30) and the surface (Fig. 31). Warming is not
seasonally uniform, however: spring 2020 was cooler than average on portions of the shelf.
Bottom temperature anomaly
2
Temperature (C)
1
0
-1
1980 1990 2000 2010 2020
Figure 30: Annual bottom temperature in the Mid-Atlantic Bight. (black = in situ observations, red = observations assimilated
by ocean model for comparison)
21State of the Ecosystem 2021: Mid-Atlantic
SST anomaly (2020)
Winter Spring
43°N 2
SST anomaly (C)
SST anomaly (C)
2
1 1
42°N
0 0
41°N
-1 -1
40°N 1990 2000 2010 2020 1990 2000 2010 2020
39°N
38°N
Temp.
37°N
Anomaly (C)
36°N >4
Latitude
2
Summer Fall
43°N 2 0
SST anomaly (C)
SST anomaly (C)
2
1
42°N 1 -2
0 0
41°NState of the Ecosystem 2021: Mid-Atlantic
Chesapeake Bay Temperature
80
Temperature (F)
60
40
Jan 2020 Apr 2020 Jul 2020 Oct 2020 Jan 2021
Time
Daily 2020 Long Term Average 2010-2019
Figure 32: Left panel: Chesapeake Bay sea surface temperature (SST) seasonal spatial anomalies for 2020, from NOAA
multisatellite SST composite. Positive values (red) above 2008-2019 average; negative values (blue) below 2008-2019 average.
A) Jan, Feb, Mar; B) Apr, May, Jun; C) Jul, Aug, Sep; D) Oct, Nov, Dec. Right panel: NOAA Chesapeake Bay Interpretive
Buoy System Gooses Reef bouy sea water temperature; Blue = 2020, red = Long term average 2010-2019.
A marine heatwave is a warming event that lasts for five or more days with sea surface temperatures above the 90th
percentile of the historical daily climatology (1982-2011) [11]. The MAB experienced frequent ocean heatwaves of
moderate intensity in 2020 that extended well into December (Fig. 33), similar to warming observed in Chesapeake
Bay (Fig. 32).
23State of the Ecosystem 2021: Mid-Atlantic
25
Climatology
Temperature
Temperature (C)
20 Threshold
15
10
Jan Feb Mar Apr May Jun Jul Aug Sep Oct Nov Dec
Figure 33: Marine heatwave events (red) in the Mid-Atlantic occuring in 2020.
Changes in ocean temperature and circulation alter habitat features such as the cold pool, a 20–60 m thick band of
cold, relatively uniform near-bottom water that persists from spring to fall over the mid-shelf and outer shelf of the
Middle Atlantic Bight (MAB) and Southern Flank of Georges Bank [12]. The cold pool plays an essential role in the
structuring of the MAB ecosystem. It is a reservoir of nutrients that feeds phytoplankton productivity, is essential
fish spawning and nursery habitat, and affects fish distribution and behavior [12]. The average temperature of the
cold pool has been getting warmer over time [13]). These changes can affect distribution and migration timing for
species that depend on the cold pool habitat. The area of the MAB cold pool was near average in 2018 (Fig. 34),
the last complete year of the dataset. The size of the cold pool varies annually, with the smallest sizes associated
with record-warm years (e.g. 2012). The cold pool temperature shows a similar variation as its extent, both of which
are strongly impacted by each early spring setting in temperature on the shelf.
24State of the Ecosystem 2021: Mid-Atlantic
Figure 34: Map of cold pool area. Time series of cold pool spatial extent from1993-2018. Black = 2018 (Last year in time
series), Red = 2012 Minimum area, Blue = 2005 Maximum area.
New glider-based observations revealed areas of low pH (7.8) during summer in Mid-Atlantic habitats occupied by
Atlantic surfclams and sea scallops (Fig. 35) [14]. This seasonal pH minimum is associated with cold-pool subsurface
and bottom water, which is cut off from mixing with surface water by strong stratification. However, seawater pH
in shelf waters increased during the fall mixing period due to the influence of a slope water mass characterized by
warm, salty, highly alkaline seawater. Lower pH in nearshore waters is likely associated with freshwater input.
25State of the Ecosystem 2021: Mid-Atlantic
Figure 35: Seasonal glider-based pH observations on the Mid-Atlantic Bight shelf (New Jersey cross-shelf transect) in relation
to Atlantic surfclam and Atlantic sea scallop habitats (modified from Wright-Fairbanks et al. 2020).
Ecosystem Productivity Indicators: primary production, zooplankton, forage fish, fish condition
Increased temperatures, as reported above, can increase the rate of photosynthesis by phytoplankton (i.e. primary
productivity). Annual primary production has increased over time, primarily driven by increased productivity in the
summer months (Figs. 36, 37).
26State of the Ecosystem 2021: Mid-Atlantic
Monthly median PPD
Jan Feb Mar Apr May Jun Jul Aug Sep Oct Nov Dec
1.5
PP (gC m−2 d−1)
1.0
0.5
98
08
19 8
98
08
19 8
98
08
19 8
98
08
19 8
98
08
19 8
98
08
19 8
98
08
19 8
98
08
19 8
98
08
19 8
98
08
19 8
98
08
19 8
98
08
18
1
1
1
1
1
1
1
1
1
1
1
19
20
20
20
20
20
20
20
20
20
20
20
20
20
20
20
20
20
20
20
20
20
20
20
20
Figure 36: Monthly primary production trends show the annual cycle (i.e. the peak during the summer months) and the
changes over time for each month.
Larger-than-average phytoplankton blooms were observed from late fall into winter in 2020 (Fig. 37).
Primary production
1.6
PP (gC m−2 d−1)
1.2
0.8
0.4
Jan. Mar. May July Oct. Dec.
Chlorophyll a
2.0
CHL (mg m−3)
1.5
1.0
0.5
Jan. Mar. May July Oct. Dec.
Figure 37: Weekly chlorophyll concentrations and primary productivity in the Mid-Atlantic are shown for by the colored line
for 2020 (dashed portion indicates preliminary data from a new satellite source). The long-term mean is shown in black and
shading indicates +/- 1 sample SD.
Climatology of seasonal phytoplankton size fractions confirms that the phytoplankton community in the summer is
27State of the Ecosystem 2021: Mid-Atlantic
dominated by smaller (pico and nano) size classes (Fig. 38). This implies less efficient transfer of primary production
to higher trophic levels.
Mid-Atlantic Bight Phytoplankton Size Class
Picoplankton Nanoplankton Microplankton
100
75
Percent
50
25
0
n
b
ar
r
ay
n
l
g
p
ct
ov
ec
Ju
Ap
Ja
Fe
Ju
Au
Se
O
M
M
N
D
Figure 38: The annual climatology (1998-2019) percent composition of the phytoplankton size classes in the Mid-Atlantic
bight based on satellite observations.
Trends in gelatinous zooplankton and krill are the same across ecological production units (EPUs) as last year (data
were updated to 2019; Fig. 39). There has been a long term increase in both groups on Georges Bank and for krill
in the Gulf of Maine as well.
Zooplankton abundance
Log Stratified Abundance
Cnidaria Euphausiacea
8.0
7.5
7.0
6.5
6.0
1980 1990 2000 2010 2020 1980 1990 2000 2010 2020
Figure 39: Stratified abundance of cnidarians and euphausiids in Mid-Atlantic Bight.
Larger zooplankton (i.e. Calanus finmarchicus) had above average abundance in 2018-2019, while smaller-bodied
copepods were near or below average (Fig. 40).
Small and large-bodied copepod abundance anomaly
Abundance anomaly
0.5
large
0.0
small
-0.5
1980 1990 2000 2010 2020
Figure 40: Large (red) and small-bodied (blue) copepod abundance in the Mid-Atlantic Bight.
An index of aggregate zooplankton and forage fish fluctuations (forage anomaly) constructed from zooplankton and
28State of the Ecosystem 2021: Mid-Atlantic
ichthyoplankton data has no apparent trend in MAB, but appears to be more variable since 2010 (Fig. 41). Changes
in environmental conditions, lower tropic levels, and diversity of the plankton community are potentially impacting
the prey of zooplankton and ichthyoplankton, which may affect this index.
Forage Anomalies
1.5
Forage Anomaly
1.0
0.5
0.0
-0.5
-1.0
2000 2005 2010 2015 2020
Figure 41: Changes from 2000-2019 average abundance for an aggregate of 13 zooplankton and 16 ichthyoplankton groups
sampled on NEFSC ECOMON surveys.
Nutritional value (energy content) of juvenile and adult forage fishes as prey is related to both environmental
conditions, fish growth and reproductive cycles. Forage energy density measurements from NEFSC trawl surveys
2017-2019 are building toward a time series to evaluate trends (Fig. 42). New 2019 measurements were consistent
with last year’s report: the energy density of Atlantic herring was almost half the value (5.69 +/- 0.07 kJ/g wet
weight) reported in earlier studies (10.6-9.4 kJ/ g wet weight). Silver hake, sandlance, longfin squid (Loligo below)
and shortfin squid (Illex below) were also lower than previous estimates [15,16]. Energy density of alewife, butterfish
and Atlantic mackerel varies seasonally, with seasonal estimates both higher and lower than estimates from previous
decades.
Forage Fish Energy Density
Alewife Atl. Herring Atl. Mackerel Butterfish
9
Mean Energy Density (kJ/g)
7
5 Fall
Spring
Illex squid Loligo squid Sand lance Silver hake
1980s
9
1990s
7
5
17
18
19
17
18
19
17
18
19
17
18
19
20
20
20
20
20
20
20
20
20
20
20
20
Figure 42: Forage fish mean energy density mean and standard deviation by season and year, compared with 1980s (Steimle
and Terranove 1985) and 1990s (Lawson et al. 1998) values.
The health and well being of individual fish can be related to body shape condition indices (i.e. weight at a given
length) such as relative condition index, which is the ratio of observed weight to predicted weight based on length
[17]. Heavier and fatter fish at a given length have higher relative condition which is expected to influence growth,
29State of the Ecosystem 2021: Mid-Atlantic
reproductive output and survival. A pattern of generally good condition was observed across many MAB species
prior to 2000, followed by a period of generally poor condition from 2001-2010, with a mix of good and poor condition
2011-2019 (Fig. 43). While there were no new data to update the condition indicator this year, preliminary results
of synthetic analyses described in the Implications section show that changes in fishing pressure, population size,
temperature, and zooplankton influence the condition of different fish species. Potential links between fish condition,
fisheries, and markets are under investigation.
Figure 43: Condition factor for fish species in the MAB based on fall NEFSC bottom trawl survey data. MAB data are
missing for 2017 due to survey delays, and no survey was conducted in 2020.
Ecosystem Structure Indicators: distribution shifts, diversity, predators
As noted in the Landings Implications section above, stocks are shifting distribution throughout the region. In
aggregate, fish stocks are moving northeast along the shelf and into deeper waters.
Zooplankton diversity is increasing in the MAB, while larval fish and adult fish diversity indices are stable over time
with current values near the long-term average (see Diversity Indicators section, above).
New indicators for shark populations, combined with information on gray seals (see Protected Species Implications
section, above), suggests predator populations range from stable (sharks, Figs. 44, 45) to increasing (seals) in the
MAB. Stable predator populations suggest stable predation pressure on managed species, but increasing predator
populations may reflect increasing predation pressure.
Observed Sharks
0.15 Category
Number per Haul
Lg Coastal
0.10
Pelagic
0.05 Prohibited
Sm Coastal
0.00
2000 2010 2020
Figure 44: Estimated number of sharks per unit effort from Northeast Fisheries Observer Program data.
30State of the Ecosystem 2021: Mid-Atlantic
HMS POP SHARK CPUE
Category
Number per Haul
15
LargeCoastal
10
Pelagic
5 Prohibited
0 SmallCoastal
2000 2010 2020
Year
Figure 45: Estimated number of sharks per unit effort from Highly Migratory Species Pelagic Observer Program data.
As noted in the Protected Species section, gray seal populations are increasing. Harbor and gray seals occupying
New England waters are generalist predators that consume more than 30 different prey species. An evaluation of
hard parts found in seal stomachs showed that harbor and gray seals predominantly exploit abundant demersal fish
species (i.e. red, white and silver hake). Other relatively abundant prey species found in hard-part remains include
sand lance, yellowtail flounder, four-spotted flounder, Gulf-stream flounder, haddock, herring, redfish, and squids.
A recent stable isotope study utilizing gray seal scat samples obtained from Massachusetts habitats showed individual
gray seals can specialize on particular prey. It also found that gray seals vary their diet seasonally, focusing on
demersal inshore species prior to the spring molt, and offshore species such as sand lance after molting. DNA studies
on gray seal diet in Gulf of Maine and Massachusetts waters found spiny dogfish and Jonah crab present in gray seal
scat samples. Skate and crab remains were also found in gray seal stomach remains. In contrast to direct feeding, it
is uncertain if the presence of skates and crabs is due to secondary consumption or scavenging.
Habitat Climate Vulnerability
A recent habitat climate vulnerability analysis links black sea bass, scup, and summer flounder to several highly
vulnerable nearshore habitats from salt marsh through shallow estuarine and marine reefs. Details on highly
vulnerable habitats with linkages to a variety of species, including which life stages have different levels of dependence
on a particular habitat, are available in a detailed table.6
Implications
Links between climate change and managed species Estuarine and nearshore habitats support many life stages
of state and federally-managed species, and are highly vulnerable to climate change. Below we highlight how recently
observed habitat changes affect several key managed species in Chesapeake Bay and in both nearshore and offshore
waters of the MAB. Overall, multiple drivers interact differently for each species, producing a range of population
impacts.
Striped bass and blue crabs The warmer than average winter may have affected key Chesapeake Bay fishery
resources during a critical period. Results of the Maryland juvenile striped bass survey, conducted by the Maryland
Department of Natural Resources (MDNR), showed low recruitment success in 2020, about fivefold below the
long-term average. This low recruitment event may have been caused by a mismatch in striped bass larval and prey
abundance due to the warm winter conditions, resulting in reduced larval survival. Warm winters typically trigger
early phytoplankton and zooplankton blooms, including key copepod prey, which die before striped bass larvae are
present in the tributary [18].
In addition to winter water temperature, survival of early life stages of striped bass in the Chesapeake Bay is strongly
correlated with freshwater flow [18–20]. High-flow regimes push zooplankton prey downstream, where they get
trapped with striped bass larvae in the estuarine turbidity maximum. In low-flow years, such as 2020, zooplankton
prey are less likely to match up with striped bass larvae in space and time, reducing striped bass larval survival and
6 https://noaa-edab.github.io/ecodata/Hab_table
31You can also read