Empowering women in the digital age - HIGH-LEVEL EVENT at the margin of the 62nd session of the UN Commission on the Status of Women - OECD.org
←
→
Page content transcription
If your browser does not render page correctly, please read the page content below
Empowering women in the digital age
                       W H E R E D O W E S TA N D?

HIGH-LEVEL EVENT
at the margin of the 62nd session
of the UN Commission
on the Status of Women

 14 MARCH 2018
 NEW YORK CITY
 UNITED STATES
This brochure summarises the initial findings of the forthcoming OECD report Bridging the Digital Gender Divide. Prepared at the request of the Australian Government, the report will inform the debate of G20 ministers in charge of the Digital Economy under the 2018 Argentinian G20 Presidency, around policy measures to foster the equitable participation of women in the digital economy. This brochure was prepared by the OECD Directorate for Science, Technology and Innovation (STI), under the supervision of Gabriela Ramos, OECD Sherpa and Chief of staff. The brochure was prepared for the high-level event on bridging the digital gender divide, hosted by the Government of Australia, at the margin of the 62nd session of the UN Commission on the Status of Women, in New York City, on 14 March 2018. The work was coordinated by Raffaella Centurelli from the OECD STI Directors Office, headed by Director Andrew Wyckoff and Deputy Director Dirk Pilat. It includes inputs from the OECD Directorate for Education and the OECD Directorate for Employment, Labour and Social Affairs, and draws also on data and analysis from the International Telecommunications Union. Authors and contributions from the OECD Secretariat include, in alphabetical order: Francesca Borgonovi, Josie Brocca, Raffaella Centurelli, Hélène Dernis, Robert Grundke, Stephanie Jamet, Mark Keese, Anna- Sophie Liebender, Luca Marcolin, Carlo Menon, David Rosenfeld and Mariagrazia Squicciarini. Thanks to Angela Gosmann for her valuable help in formatting the report. This brochure is issued under the responsibility of the Secretary-General of the OECD. The opinions expressed and arguments employed herein do not necessarily reflect the official views of OECD Member countries or of the G20. This report and any map included herein are without prejudice to the status of or sovereignty over any territory, to the delimitation of international frontiers and boundaries and to the name of any territory, city or area. © OECD, 2018
EMPOWERING WOMEN IN THE DIGITAL AGE: WHERE DO WE STAND?

                                                      Table of contents

Executive summary ................................................................................................................................. 5
1. The digital gender divide at a glance .................................................................................................. 7
2. Women in science ............................................................................................................................... 9
3. Women inventors: A narrowing gap in patenting activity? .............................................................. 12
4. Software: still mainly about (male) geeks? ....................................................................................... 15
5. The gender gap in start-up activity and venture capital investments ............................................. 17
6. Women at work in the digital era: less training but higher labour market returns?........................ 20
7. The future of work for women: More at risk of automation? .......................................................... 22
8. Leapfrogging opportunities to bridge the digital gender divide ......................................................... 25
9. Bridging the digital gender divide: From national practices to a global effort ................................. 27
Notes ..................................................................................................................................................... 30
References ............................................................................................................................................ 31

Figures
Figure 1. Gender gap in mobile phone ownership, by region ............................................................. 7
Figure 2. Tertiary graduates in ICTs, by gender, 2015 ......................................................................... 9
Figure 3. Proportion of 15-year-olds who expect to work in a science-related occupation
           by the age of 30, by type of science professional, OECD average, 2015 ............................ 10
Figure 4. Share of women within the relevant group of corresponding scientific authors............... 11
Figure 5. Patents featuring woman inventors in G20 countries ........................................................ 12
Figure 6. Share of patents invented by women, G20 countries, 2010-15 ......................................... 13
Figure 7. Composition of inventors’ team by gender, G20 area........................................................ 13
Figure 8. International collaboration of inventors, 2010-15 ............................................................. 14
Figure 9. Gender composition of teams producing R-based software packages .............................. 15
Figure 10. R package authors, by country............................................................................................ 15
Figure 11. Share of females among start-up founders ........................................................................ 17
Figure 12. The gender gap in start-up funding and acquisition ........................................................... 18
Figure 13. Average skill levels for male and female workers, 31 OECD countries
           and partner economies, 2012 or 2015 ............................................................................... 20
Figure 14. Labour market returns to skills by gender across 31 OECD countries
           and partner economies, 2012 or 2015 ............................................................................... 21
Figure 15. The average risk of automation, by industry and by gender .............................................. 22
Figure 16. Change in employment levels, by gender and skill level, 2003-15 ..................................... 23
Figure 17. Countries with installed mobile money services for those without a bank account.......... 25
Figure 18. Projected increase in the G20 labour force if G20 gender target achieved ....................... 29

Boxes
Box 1. Examples of countries’ efforts to reduce the digital gender divide ........................................... 27
Box 2. Progress in achieving the G20 target to reduce the gender gap in labour force participation . 28

© OECD, 2018                                                                                                                                                3
EMPOWERING WOMEN IN THE DIGITAL AGE: WHERE DO WE STAND?
Executive summary
New digital tools are empowering, and can serve to support a new source of inclusive global economic growth.
To seize this opportunity it is essential that no one, and especially no woman, is held back in trying to achieve
their aspirations. Now is the time to step up the efforts and take advantage of the digital transformation to
ensure that it represents a leapfrog opportunity for women and a chance to build a more inclusive digital
world. The G20 efforts are an important and timely step forward towards better policies to close the digital
gender gap. Establishing the evidence base that reveals how women are faring in the digital transformation is
essential for developing and monitoring these policies. This brochure represents a preliminary effort by the
OECD, working with the G20, to broaden the evidence base to better understand the position of women in the
economy and society that is being transformed by digital technologies.
The key findings include:
1. Today, around the world, some 250 million fewer women than men are online. In developing countries,
limited access often concerns women living in Sub-Saharan Africa and in rural parts of Asia. In developed
countries women face a facet of the digital gender divide: the systematic under-representation in information
and communication technology (ICT) jobs, top management and academic careers. For instance, women
worldwide are 20% less likely to hold a senior leadership position in the mobile communication industry,
they make only 8% of the investing partners at the top 100 venture capital (VC) firms and only 17% of the
scientists earning more than USD 105 000 (in 2015).
2. Gender gap in science, technology, engineering and mathematics (STEM) fields grows with age. 15 year-
old girls are two times less likely to aspire to a career as an engineer, a scientist or an architect and three
times more likely than boys to expect to become health professionals. Consequently, there is no surprise if
women account today for only 20% of tertiary graduates in ICT fields. And even when they do study STEM
they face a “glass ceiling” preventing them from holding senior positions: women make up for only 20% of
scientists who are identified as “corresponding authors” (a proxy for leadership in the world of research)
and have little likelihood to be peer reviewers or editorial board members of scientific journals.
3. Software development still seems to be (mostly) a male-dominated club. Over the past five years, almost
90% of downloads packages of one of the most used, “big data”, open-source software packages were
authored by men. This is particularly worrying, given the growing importance of “big data” analytics to the digital
economy, and the possible consequences of unintended bias creeping in due to this marginal role of women.
4. However, women’s inventiveness is finally starting to emerge, holding promise to narrow an historical
gap. While almost 80% of all patents filed at key intellectual property offices worldwide still come from
teams of only men, over the last two decades the number of patents featuring at least one woman in the
team of inventors has increased more rapidly than the average of all patents. This is especially the case for
patents related to ICT, suggesting women are increasingly getting credit for their inventiveness and creativity.
5. Start-ups and venture capital investment point to socio-cultural gender bias in equity financing: today,
90% of innovative start-ups seeking venture capital investments have been founded by men. Women-owned
start-ups receive 23% less funding and are 30% less likely to have a positive exit – i.e. be acquired or to
issue an initial public offering – compared to men-owned businesses. Nevertheless, progress is possible:
VC firms with at least one female partner are more than twice as likely to invest in a company with a
woman in the management team, and three times as likely to invest in female chief executive officers (CEOs).
6. Women at work today: digital skills command higher labour market returns. While women appear less endowed
with some of the skills needed to thrive in the digital era – such as numeracy and STEM quantitative skills – a
window of opportunity is emerging: those women who perform more ICT-intensive tasks in their job
receive a 12% higher pay increase than men. Perhaps a window of opportunity to narrow the wage gap?
© OECD, 2018 5EMPOWERING WOMEN IN THE DIGITAL AGE: WHERE DO WE STAND?
7. Digital tools can be part of the solution and may offer “leapfrog” opportunities for women’s economic
empowerment. The use of digital platforms is providing women with greater access to markets, knowledge
and more flexible working arrangements. These can result in higher female employment rates on platforms
than in traditional industries: in the United States, the proportion of female drivers is higher for Uber
(14%) than for traditional taxis (8%). Furthermore, mobile money – a way to make financial transactions
from SIM card to SIM card using mobile phones and without needing a formal bank account – is proving a
powerful source of inclusion for the 2 billion individuals without a formal financial account.
8. Closing the digital gender gap is not out of reach but we need to accelerate progress. The commitment
of the G20 ministers in charge of the Digital Economy last year in Düsseldorf to foster digital gender
inclusion and the range of measures devised to address the root causes of this divide are important steps into
the right direction. What the future will hold for women depends on what policy does today. The OECD
is proud to be working closely with the G20 towards better policies for bridging the digital gender divide.
6 © OECD, 2018EMPOWERING WOMEN IN THE DIGITAL AGE: WHERE DO WE STAND?
1. The digital gender divide at a glance
Digital technologies have a vast potential to improve many aspects of people’s work and life. Today, nearly half
of the world's population is connected to networks, up from 4% in 1995. ICT enable new businesses and
business model to arise, and help improve firm performance, by ensuring better communication and information
1
flows (OECD, 2017i). However, this unprecedented growth in connectivity has not been enjoyed by everyone
equally. Differences in resources and in the ability to access and effectively utilise ICT within and between
countries, regions, sectors and socio-economic groups have led to a digital gender divide, which sees women
worldwide particularly at disadvantage (UN Women, 2015).
Today, globally, there are some 250 million fewer women online than men (ITU, 2016). This is especially
worrying as the gender gap in terms of Internet penetration has been increasing since 2013. Furthermore,
today 200 million fewer women than men own a mobile phone (GSMA, 2015) (Figure 1) and even those who
own one tend to use it for less complicated tasks than men (Demirguc-Kunt et al., 2015). While the majority of
women who lack access to digital technologies are in developing countries – i.e. the gender gap in mobile
broadband access is 45% in Sub-Saharan Africa and up to 50% in some parts of rural Asia – gaps in usage, for
example, are also observed in OECD countries: Internet usage among women is below that of men in countries such
as Turkey (-16%), Italy (-6%), and Germany (-3%). Gender differences in Internet uptake being more marked for
older generations, a further narrowing of the gender gap can be expected in the future, as the technology
continues to reduce the cost of online access and today’s “digital natives” become adults (OECD, 2017h).
Figure 1. Gender gap in mobile phone ownership, by region
Overall
14% 202m
Middle East and North Africa Europe and Central Asia
8% 8m 4% 4m
East Asia and Pacific
3% 14m
Latin America and Caribbean
5% 9m
Sub-Saharan Africa South Asia
Share of females
Absolute number of females 13% 27m 38% 140m
Note: m = million.
Source: OECD, adapted from GSMA (2015), Connected Women, Bridging the Gender Gap: Mobile Access and Usage in Low- and Middle-
income Countries, https://www.gsma.com/mobilefordevelopment/programmes/connected-women/bridging-gender-gap.
© OECD, 2018 7EMPOWERING WOMEN IN THE DIGITAL AGE: WHERE DO WE STAND?
Together with affordability of the technology, lack of relevant knowledge and skills in using digital tools are
among the main reasons for the digital gender divide worldwide (see Sections 6 and 7). In addition, socio-
cultural perceptions are often reported among the top barriers for women in owning and using a mobile
phone, especially in rural zones of developing countries. In India, for instance, around 12% of women would
not use the Internet because of negative social perception, and 8% of women don’t use it due to the lack of
acceptance by family members (Intel and Dalberg, 2012). Social-cultural perceptions and stereotypes may be
also playing a role in determining a different facet of the gender divide; i.e. the under-representation of
women in senior roles within digital companies and in ICT fields, both in emerging and advanced economies
alike (see Sections 2 and 5): in the mobile communications industry, for instance, women worldwide are 20%
less likely to hold a senior leadership position (GSMA and ATKearny, 2015), while only 8% of the investing
2
partners at the top 100 VC firms are women. Furthermore, in the ICT industry, the quit rate seems to be more
than twice as high for women (41%) than it is for men (17%) (National Center for Women & Information
Technology, 2016).
8 © OECD, 2018EMPOWERING WOMEN IN THE DIGITAL AGE: WHERE DO WE STAND?
2. Women in science
Women are significantly less likely to choose natural sciences, engineering, and ICT studies. In 2015, they
only accounted for 30% of all students graduating in these fields at tertiary level, within OECD countries (OECD,
2017a). Furthermore, women represent only 20% of tertiary graduates in ICT-related studies – fields which are
particularly relevant for the digital era. However, emerging economies show encouraging counter-trends:
with more than 260 000 female tertiary ICT graduates in 2015, India is the country closest to gender parity in
this field, followed by Indonesia (Figure 2).
Figure 2. Tertiary graduates in ICTs, by gender, 2015
Women Men
%
10
8
6
4
2
0
Source: Based on OECD (2017a), OECD Science, Technology and Industry Scoreboard 2017, http://dx.doi.org/10.1787/888933618479.
While there are some encouraging signs of change, the road ahead is still long. The dearth of women in fields
of study such as computing and engineering is rooted in boys’ and girls’ gender-related career expectations
(OECD, 2016c). Although, on average across the OECD, the share of boys and girls who expect a science-related
career is balanced at aggregate level (at nearly 25%), there is a wide different in the choice of fields: twice as
many boys expect to work as engineers, scientists or architects, while almost three times as many girls expect
to become health professionals. When it comes to a career in ICT the gap widens to 4.8% of boys and only
0.4% of girls (Figure 3). Particularly large differences between boys’ and girls’ career expectations are observed
in some countries, even in those countries with high rates of female participation and pro-female gender
norms. In Finland, for example, boys (at 6.2%) are more than four times as likely as girls (at 1.4%) to expect a
career as an engineer, scientist or architect (OECD, 2015b). These findings indicate that the career paths of
boys and girls are already starting to diverge before the age of 15, and well before important career choices
are actually made. One contributing factor is entrenched stereotypes about passed on to children by their
families, teachers, and society at large. Indeed, OECD PISA (Programme for International Student Assessment)
reveals, that parents are more likely to expect their teenage sons than their daughters to work in STEM
occupations – even when their daughters perform just as well as in STEM fields (OECD, 2015a).
Fortunately, OECD PISA data also show that, in many countries, girls excel and do have the confidence that is
necessary to have successful careers in science and technology. Nonetheless, although data suggest that boys
and girls are generally on a par when it comes to performance in science, gender differences do emerge in
boys’ favour among the highest achieving students in test questions which require students to explain phenomena
scientifically, or refer to physical systems that require, for example, knowledge of the structure and properties
of matter. On the other hand, girls are generally less likely to appear among the lowest-achieving students,
© OECD, 2018 9EMPOWERING WOMEN IN THE DIGITAL AGE: WHERE DO WE STAND?
and appear to be more proficient in evaluating and designing scientific enquiry, and to have more interest in
knowing how scientists enquire and develop scientific theories. These differences come on top of gender
differences in mathematics performance among the highest achieving students, reinforced by the fact that
many girls hold negative attitudes about their mathematics abilities and express high levels of mathematics
anxiety (OECD, 2015). Policy makers across the OECD are aware of gender stereotyping at school and the
effect that it may have on future education and career choices and many countries have initiated efforts to
address these stereotypes and further bridge the divide (see Section 9).
Figure 3. Proportion of 15-year-olds who expect to work in a science-related occupation
by the age of 30, by type of science professional, OECD average, 2015
As science and engineering professionals As health professionals
As information and communication technology (ICT) professionals As science-related technicians or associate professionals
%
30
0.8
25
2.1
0.4
20 4.8
15 5.9
17.4
10
12.2
5
5.3
0
Boys Girls
Notes: ICT = information and communication technology. OECD PISA 2015 asked students what occupation they expected to be working in
by the time they reached the age of 30. Students could enter any job title or description in an open-entry field; their answers were later
classified according to the International Standard Classification of Occupations, 2008 edition (ISCO-08). These coded answers were used to
create an indicator of science-related career expectations, defined as those whose realisation requires the study of science beyond
compulsory education, typically in formal tertiary education. Within this large group of science-related occupations, the following major
groups were distinguished: science and engineering professionals; health professionals; science technicians and associate professionals;
and ICT professionals.
Source: OECD (2016b), Education at a Glance 2016, http://dx.doi.org/10.1787/eag-2016-en.
Even those girls that do persevere and study STEM and go into scientific careers continue to face barriers to
attaining senior decision-making positions within scientific occupations. A new indicator, based on an experimental
global survey of scientific publication authors, shows that only 21% of scientists who are identified as
“corresponding authors” – a proxy term for leadership in the world of research – are women (Figure 4) (OECD,
2017a). And while women account for around 20% of peer reviewers and editorial board members, this share
drops to less than 15% when these activities are remunerated. While women see the relevance of their scientific
outputs being recognised by citations in medicine protocols or legal proceedings, their impact is systematically
less acknowledged in patents, media and government reports. Furthermore, in 2015, only 17% of those scientists
earning more than USD 105 000 were women. Finally, the representation of women among corresponding authors
is highest in the social sciences, especially in the arts and humanities (slightly above 30% of corresponding
authors), and lowest in physics, followed by materials science and chemical engineering at 15% or less). These
figures, which partially reflect the gender composition of the R&D personnel and doctorate holders, point to a
male-centric academic world and suggest that gender equality in scientific publishing and team leadership is
not a reality, at least not yet.
10 © OECD, 2018EMPOWERING WOMEN IN THE DIGITAL AGE: WHERE DO WE STAND?
Figure 4. Share of women within the relevant group of corresponding scientific authors
All corresponding authors
Scientific responsibilities:
Peer reviewer Share of women in
Remunerated peer reviewer corresponding
Editorial board member author population:
Remunerated editorial board member 21%
Relevance / impact of scientific output:
Cited in peer-reviewed journal
Cited in technical document (e.g. patents)
Cited in government/policy report
Cited in practitioner's protocol (e.g. medicine)
Cited in media
Cited in legal proceedings
Dedication to research (full-time workers):
Research is full-time activity
Research is part-time activity
Earnings:
High annual earnings > USD 105 000
0 5 10 15 20 25 %
Source: OECD (2017a), OECD Science, Technology and Industry Scoreboard 2017: The Digital Transformation,
http://dx.doi.org/10.1787/9789264268821-en.
© OECD, 2018 11EMPOWERING WOMEN IN THE DIGITAL AGE: WHERE DO WE STAND?
3. Women inventors:
a narrowing gap in patenting activity?
Narrowing the gender gap requires not only empowering women in science and R&D, but also allowing them
to experiment, invent and claim credit for their innovation. One way to assess whether and to what extent
3
women are able to do so is to look at the proportion of patents featuring women inventors. OECD analysis
focusing on G20 countries shows that over the last two decades the number of patents featuring at least
one woman in the team of inventors has increased more rapidly than the average of all patents. As a
consequence, in the G20 area, the share of patents invented by women reached 8.4% in 2014, compared to a
level of 5.6% in 1994. Furthermore, women participation in inventive activities grew in all technology domains,
and especially so in patents related to ICT, therefore suggesting an increasing contribution of women to the
digital transformation (Figure 5).
Figure 5. Patents featuring woman inventors in G20 countries
ICT patents with women inventors Total ICT patents
Patents in other fields with women inventors Total patents in other fields
Index
160 IP5 patent families, index (2004=100)
150
140
130
120
110
100
90
2004 2005 2006 2007 2008 2009 2010 2011 2012 2013 2014 2015
Notes: ICT = information and communication technology. Data refer to patents with at least one woman inventor located in G20 countries
in the team of inventors listed in the patent documents. Data are based on whole counts. IP5 patent family figures from 2014 are
estimates based on existing data.
Source: OECD (2018), STI Micro-data Lab: Intellectual Property, http://oe.cd/ipstats (accessed January 2018).
The recent growth in the number of ICT-related patents featuring at least one woman in the team of
inventors is a much welcome sign of the possible narrowing of a historical gender gap. With the exception of
the United States and Saudi Arabia, women inventors in G20 countries have traditionally been less active in
ICT-related patents than in other technology domains (especially chemistry, pharmaceuticals, biotechnologies).
Overall, among G20 countries, India, Mexico, Turkey and Argentina reported the highest shares of innovations
invented by women that received a patent between 2010 and 2015 (Figure 6).
While some encouraging signs of change have begun to emerge, the broader evidence about female
participation in inventive activities point to the existence of a wide and persistent gender gap. Still in 2015,
almost 80% of all patents filed at key intellectual property offices worldwide came from teams of only men,
basically unchanged over the decade (Figure 7). Also, between 2010 and 2015, the number of inventions made
by female-only teams represented nearly 4% of patents, compared to 3% observed in the 2000-05 period.
Mixed teams of men and women accounted for 17% of all patent families from 2010 to 2015, 3 percentage
points more than between 2000 and 2005. While these figures suggest some gains, the sheer size and the slow
pace at which the gap is narrowing underscore that gender equality among inventors remains an uphill battle.
12 © OECD, 2018EMPOWERING WOMEN IN THE DIGITAL AGE: WHERE DO WE STAND?
Figure 6. Share of patents invented by women, G20 countries, 2010-15
ICT patents Patents in other technologies All patents
%
15
10
5
0
Notes: ICT = information and communication technology. The share of patents invented by women refers to the number of patents with
women inventors located in a given country divided by the number of patents invented in the country, by technology. Due to
incompatibility of data, Korea and the People’s Republic of China are not included in the G20 average. Figures from 2014 onwards are
based on incomplete data and only countries with more than 50 IP5 patent families in 2010-15 are included.
Source: OECD (2018), STI Micro-data Lab: Intellectual Property, http://oe.cd/ipstats (accessed January 2018).
Figure 7. Composition of inventors’ team by gender, G20 area
Men only Mixed Women only
% 3 4
100
14 17
80
83
79
60
40
20
0
2000-05 2010-15
Note: The indicator is based on whole counts of IP5 patent families by inventors’ country.
Source: OECD (2018), STI Micro-data Lab: Intellectual Property, http://oe.cd/ipstats (accessed January 2018).
Diversity and international collaborations have been found to increase the value of the inventive output. But,
what is the role of women inventors in international collaboration? Between 2010 and 2015, an average 11%
of patent families invented in G20 countries where the result of international collaborations, meaning that
they included at least one foreign co-inventor besides one or more domestic inventors. While the level of
international cooperation varies among countries, data suggest that in G20 countries women generally tend
to be more involved in international co-inventions (Figure 8) than men.
© OECD, 2018 13EMPOWERING WOMEN IN THE DIGITAL AGE: WHERE DO WE STAND?
Figure 8. International collaboration of inventors, 2010-15
International co-inventions as a percentage of IP5 patent families
Women Men
%
50
40
30
20
10
0
Source: OECD (2018), STI Micro-data Lab: Intellectual Property, http://oe.cd/ipstats (accessed January 2018).
14 © OECD, 2018EMPOWERING WOMEN IN THE DIGITAL AGE: WHERE DO WE STAND?
4. Software: still mainly about (male) geeks?
As innovation goes increasingly digital, software use and creation becomes a key asset for the digital
transformation. Experimental indicators using information about a popular open-source programming language
for data analysis, R, shows that about three quarters (i.e. 77%) of the 12 000 R-based software packages created
during the period 2012-17 were produced by teams of only men. Women-only teams accounted for a mere 6%
of such packages, whereas the remaining 17% came out of mixed teams of software developers (Figure 9).
Figure 9. Gender composition of teams producing R-based software packages
Number of packages and downloads, October 2012 – December 2017
Men only Mixed Women only
% 2
6
100
12
17
80
86
77
60
40
20
0
Unweighted Weighted by downloads
Source: OECD (2018), STI Micro-data Lab: Intellectual Property, http://oe.cd/ipstats (accessed February 2018).
Figure 10. R package authors, by country
Data related to top 300 package authors
Number of
R package authors R package authors of which: 1 woman
142
25
20
15
10
5
0
Source: OECD (2018), STI Micro-data Lab: Intellectual Property, http://oe.cd/ipstats (accessed February 2018).
© OECD, 2018 15EMPOWERING WOMEN IN THE DIGITAL AGE: WHERE DO WE STAND? A look at the downloads of these R-based software packages, which can be taken as a sign of the usefulness of such software, unveils the marginal role of women in the software world: the vast majority of (86%) of download-weighted packages were authored by men-only teams against a tiny 2% of packages authored by teams solely made of women. Looking at the location of top R-based software package authors shows that in many countries software is a male-only affair (Figure 10). Given the growing importance of “big data” analytics to the digital economy, this gap is of concern both in terms of engagement of women as well as potential unintended biases that may be embedded due to a lack of diversity. 16 © OECD, 2018
EMPOWERING WOMEN IN THE DIGITAL AGE: WHERE DO WE STAND?

                      5. The gender gap in start-up activity
                         and venture capital investments

Innovative entrepreneurship is essential for economies. Yet despite the proven role of entrepreneurship as
an engine of social inclusion (OECD and European Commission, 2014), the gender gap in entrepreneurship is
striking and persistent, with men being nearly twice as likely as women to be self-employed (OECD and
European Union, 2017), and three times more likely than women to own a business with employees across
OECD countries (Piacentini, 2013).

                            Figure 11. Share of females among start-up founders
                                                          A. By economy
          %
        15

        10

         5

         0

                                                            B. By sector
          %
         30

         25

         20

         15

         10

             5

             0

Note: Percentage of females in the sample of founders of companies less than ten years old and for whom gender is known.
Source: OECD, based on Breschi, Lassébie and Menon (2018), www.crunchbase.com.

© OECD, 2018                                                                                                               17
EMPOWERING WOMEN IN THE DIGITAL AGE: WHERE DO WE STAND?
Women entrepreneurs also appear to be missing out on the opportunities created by globalisation and
digitalisation – women-operated businesses are less likely to export, and less likely to engage in international
business-to-business transactions (OECD, 2017b). Perceptions, once again, may be playing an important role:
only 37% of women in OECD countries believe that they have the skills to start a business, compared to 51% of
men. Moreover, new female entrepreneurs are only half as likely as men to expect to create at least 19 jobs
over the next five years (OECD and European Union, 2017).
Among innovative start-ups looking for VC investments, the gender gap is even more striking: only 11% of
such start-up founders are female. This share varies substantially across countries and sectors; however, even
at best, female entrepreneurs represent less than a third of all start-up founders (Figure 11). Unleashing the
full potential of female entrepreneurial talents is needed to make women strive.
Not all start-up founders look for investors in the VC market to help get their businesses off the ground, but
those who do, know how difficult the pitching process can be. Recent OECD analysis based on Crunchbase
4
data finds that raising capital is even more difficult for female-owned firms (Breschi, Lassébie and Menon,
2018): in a sample of 25 000 start-ups operating across a wide set of countries and sectors, female-led business
ventures, i.e. start-ups with at least one female founder, are significantly less likely to be funded. Even if they
are funded, they receive on average 23% less funding than male-led start-ups, even after controlling for the
location and the nature of the start-up, as well as for the education level and professional background of start-
up founders (Figure 12). Female-led start-ups are also 30% less likely to have a positive exit, i.e. be acquired or
to issue an initial public offering. This is consistent with well-known anecdotes reporting “a particularly toxic
atmosphere for women in Silicon Valley” (Burleigh, 2015) (and in other start-up hot-spots).
Figure 12. The gender gap in start-up funding and acquisition
Probability of getting VC Raised amount Probability of acquisition
% USD %
million
0.57 10 0.1
9 0.09
8 0.08
0.56
7 0.07
6 0.06
0.55 5 0.05
4 0.04
3 0.03
0.54
2 0.02
1 0.01
0.53 0 0
Male-led businesses Female-led businesses Male-led businesses Female-led businesses Male-led businesses Female-led businesses
Note: The graphs show results from Ordinary Least Squares (OLS) regressions of the three outcomes variables on a set of founders and
firms characteristics, and country and sector fixed effects. Bars show the average predicted probability of receiving VC, the amount of
funding conditional on getting VC and the probability of acquisition for male- and female-led businesses. The advantage of this way of
representing the data is that it gets rid of potential confounding effects such as education or prior experience of start-up founders.
Source: OECD, based on Breschi, Lassébie and Menon (2018), www.crunchbase.com.
Several factors may contribute to explain the gender gap in entrepreneurship and determine the gap in start-
ups activity and VC investment (Johnstone et al., forthcoming). Among them:
• It may be yet another reflection of the widespread gender gap in STEM studies, which are particularly
5
relevant for acquiring the skills needed to thrive in the innovative entrepreneurship world (see Section 2).
• Differences in attitudes towards risk may also play a role, as women are generally more risk averse than
men with regard to financial decisions (Croson and Gneezy, 2009) and less likely to try to start a new venture
after a failure.
18 © OECD, 2018EMPOWERING WOMEN IN THE DIGITAL AGE: WHERE DO WE STAND?
• Gender differences in network formation and in social network ties to secure VC funding (Stephan and
El-Ganainy, 2007) can be playing a significant role. In a similar vein, “homophily” may be influencing
equity financing, with investors – who are disproportionately male – more likely to finance other men.
The glass looks half empty if one considers that the share of women acquiring the position of “partner” in VC
firms has been increasing in recent years at an extremely slow pace (Crunchbase News, 2017), with the number
of female partners at the top one hundred venture firms going up only by 1% in 18 months (i.e. 64 women out
of 752 partners at the top 100 VC firms). The same glass may look half full, though, if one considers that even a
small increase in female representation in venture firm partnership could translate to a more favourable VC
market for female-led start-ups. Evidence show that VC firms with a female partner are more than twice as
likely to invest in a company with a woman on the management team (34% vs 13%); and they are three times
as likely to invest in female CEOs (58% vs 15%) (Diana Project, 2014).
Boosting the presence of women on the supply side of financial markets is surely a step in the right direction.
While many G20 countries are increasing support to female entrepreneurs (see Section 11), more needs to be
done. Women entrepreneurs have enormous potential for making greater contributions to economic growth,
job creation, innovation and social inclusion: some recent estimates suggest that if the entrepreneurship
gender gap were eliminated, global GDP could rise by as much as 2% annually (Blomquist et al., 2014).
© OECD, 2018 19EMPOWERING WOMEN IN THE DIGITAL AGE: WHERE DO WE STAND?
6. Women at work in the digital era: less training
but higher labour market returns?
As the digital revolution unfolds and the content and nature of jobs change, so do the skills required to
perform them. Solid cognitive skills, coupled with the ability to solve problems and to learn and think creatively,
are key to adapting to the scale, speed and scope of digital transformations. Recent OECD analysis (OECD, 2017c),
based on the frequency of tasks performed at work, shows that, on average, workers in digital intensive industries
exhibit a greater endowment of all types of skills. This is true for cognitive as well as non-cognitive and social
6
skills, and notably for ICT skills, STEM-quantitative and self-organisation skills. In short, all these skills are
particularly important to successfully navigating the digital transformation. Looking at the skill levels of male
and female workers across 31 developed and developing countries (Figure 13) female workers generally appear
to be equipped with relatively better literacy, ICT, marketing and accounting skills, while male workers display
greater endowments of numeracy and STEM-quantitative skills, and slightly better problem solving and self-
organisation skills. This might to some extent be explained by women’s relatively lower propensity to pursue
STEM-related studies (see Section 2). Given that these skills are significantly and positively related to labour
market returns (OECD, 2017c, based on Grundke et al., forthcoming), especially for workers employed in digitally
intensive sectors, part of the persistent gender wage gap observed across countries can be explained by men’s
current greater endowment of numeracy and STEM-quantitative skills.
Figure 13. Average skill levels for male and female workers, 31 OECD countries
and partner economies, 2012 or 2015
Male workers Female workers
Average Score
60
58
56
54
52
50
48
46
44
42
40
Notes: ICT = information and communication technology; STEM = Science, technology, engineering and mathematics. All skill indicators are
rescaled to the interval 0-100. Averages across 31 OECD countries and partner economies are computed giving the same weight to each
country. All differences in skill means between male and female workers are significant at the 5% level, except for Management and
communication and Readiness to learn.
Source: OECD (2017c), Towards the implementation of the G20 Roadmap for digitalisation: Skills, business dynamics and competition,
www.oecd.org/g20/OECDreport_Implementation_G20_Roadmap.pdf.
The relative importance of certain skills in the digital transformation can also be seen by looking at whether labour
markets reward various skills differently, and how this may differ between the sexes. OECD analysis shows that
while men have higher returns to management and communication skills, the returns related to ICT skills and
readiness to learn are higher for women (Figure 14). These results hold also when differences among individuals
in age, education, country, industry or occupation of employment are taken into account. The increase in earnings
of female workers due to an increase in their ICT skills ranges from approximately 4% (Denmark) to 19% (Korea)
and is on average 12 percentage points (holding other observable characteristics of the individual constant).
20 © OECD, 2018EMPOWERING WOMEN IN THE DIGITAL AGE: WHERE DO WE STAND?
This suggests that women may find themselves better off in a digital world, which increasingly demands ICT skills,
and which is willing to reward them proportionally more. The provision of greater ICT skills for women could be a
policy lever to narrow the gender wage gap at least in the short term, before the labour market adjusts to the
increased supply of ICT skills. Narrowing the gender wage gap may require policies aimed to equip female workers
with better numeracy, STEM-quantitative skills and ICT skills, starting with encouraging them to pursue STEM-related
studies and supporting the ever-increasing need for systematic updating and enhancement of workers' skill sets.
Figure 14. Labour market returns to skills by gender across 31 OECD countries
and partner economies, 2012 or 2015
Skill returns for male workers Skill returns for female workers
%
14
12
10
8
6
4
2
0
Notes: ICT = information and communication technology; STEM = Science, technology, engineering and mathematics.
Labour market returns to skills are based on Ordinary Least Square (OLS) wage regressions (Mincer equations) using data from the OECD
Survey of Adult Skills (PIAAC) (OECD, 2017j) for 31 OECD countries and partner economies. The estimates by gender are obtained through
including an interaction term of the skill variable and the gender variable. The figure shows the percentage changes in wages determined
by an increase in skills by one standard deviation, holding other correlates of individual wages constant. Shaded diamonds indicate that
the difference between man and women is not significant at the 5% level.
Source: OECD (2017c), Towards the implementation of the G20 Roadmap for digitalisation: Skills, business dynamics and competition,
www.oecd.org/g20/OECDreport_Implementation_G20_Roadmap.pdf.
Adult learning may allow for smoother transitions of individuals between occupations and sectors, thus
helping people reap the benefits of the digital transformation, while minimising its social costs. For this to
happen, however, equity in learning opportunities needs to be enhanced. Recent OECD analysis shows that, on
average, across countries, only approximately 25% of workers receiving training in 2012 or 2015 are classified
as having low skills. In fact, those who are most likely to get trained are those with already a high proficiency in
numeracy and literacy, when observable characteristics are held fixed. Furthermore, workers performing jobs
that are largely routine in nature (which are also the ones at higher risk of losing their jobs, since routine tasks
are easier to automate) have a lower probability to be trained. Finally, men receive systematically more hours
of training than women performing similar jobs. Re-thinking and better targeting the beneficiaries of current
training programmes may help the most vulnerable and give them opportunities to effectively adapt their
skills during their working life to fully benefit from the digital era.
This entails removing barriers to human capital development and to adult education, for both men and women.
This could be done through tax systems designed to support learning and through targeted supports aimed
at alleviating the costs of learning for those in need of help. It could also mean providing more flexible
opportunities for adults to upgrade their skills, including easing access to formal education, improving the
recognition of skills acquired after initial education, providing family support and enhancing career guidance.
This would help women especially, as the OECD Survey of Adult Skills (PIAAC) (OECD, 2017j) shows that family
responsibilities are a major barrier to participation in education and training for women.
© OECD, 2018 21EMPOWERING WOMEN IN THE DIGITAL AGE: WHERE DO WE STAND?
7. The future of work for women:
more at risk of automation?
Technological innovations can contribute to greener production, safer jobs (with some hazardous work
performed by robots), new and more customised goods and services, and faster productivity growth. While
new technologies will create jobs through a number of channels, and productivity-raising technologies will
benefit the economy overall, the associated adjustments will have consequences on many domains, including
employment and well-being (OECD, 2017d). An issue that sparks much debate is automation: some fear that it
may result in significant loss of jobs, particularly in the case of industrial robots which are designed to carry out
tasks otherwise performed by humans (OECD, 2017a). Recent studies however find that robots do improve
productivity, but that their impact on employment and wages is ambiguous (Graetz and Michaels, 2015;
Acemoglu and Restrepo, 2016; Acemoglu and Restrepo, 2017). In parallel to increasing automation, over the
past two decades, most OECD countries have experienced a process of labour market polarisation whereby the
share of employment in high-skilled (and to some extent in low-skilled jobs) has increased, while the share of
employment in middle-skilled jobs has decreased (Autor, Katz and Kearney, 2006; Marcolin, Miroudot and
Squicciarini, 2016; OECD, 2017f). Estimating to which extent technological advances in artificial intelligence,
ICT and robotics will lead to further automation is complex, and estimates vary considerably. Recent calculations
place the percentage of jobs at a high risk of being displaced by automation (i.e. over 70% of tasks in those
jobs could be automated) in the next 15 to 20 years in the range 9% (OECD, 2016a) to 14%, for OECD countries
(Quintini, 2018). Another 30% or so of jobs are at risk of significant change as a result of automation.
Figure 15. The average risk of automation, by industry and by gender
20 industries with the greatest number of jobs at risk
Male share (average risk of automation) Female share (average risk of automation) Employment share
Food and beverage service activities
Retail trade, except of motor vehicles and motorcycles
Wholesale and retail trade and repair of motor vehicles
Land transport and transport via pipelines
Manufacture of food products
Manufacture of fabricated metal products
Specialised construction activities
Wholesale trade, except of motor vehicles and motorcycles
Manufacture of motor vehicles, trailers and semi-trailers
Manufacture of machinery and equipment
Insurance, reinsurance and pension funding
Residential care activities
Legal and accounting activities
Manufacture of computer, electronic and optical products
Financial service activities
Human health activities
Social work activities without accommodation
Public administration and defence
Computer programming, consultancy and related activities
Education
50 40 30 20 10 0 10 20 30 40 50 0 2.5 5 7.5 10
% %
Notes: The chart shows the 20 industries with the greatest number of jobs at risk (measured as the average risk of automation weighted
by the employment share of the industry), in descending order of overall risk of automation (left panel). The width of each bar in the left
panel represents the average share of jobs at risk in each industry. The placement of each bar relative to the centre line depicts how that risk is
shared between men (light blue) and women (grey). Values in the right panel represent the share of total employment held by each industry.
Risk of automation values are based on likelihoods calculated in Arntz, Gregory and Zierahn (2016). Countries covered in this analysis
include the 29 OECD countries that participated in the first and second rounds of the OECD Survey of Adult Skills (PIAAC) (OECD, 2017j).
Source: OECD (2017e), “Going Digital: The future of work for women”, www.oecd.org/employment/Going-Digitalthe-Future-of-Work-for-
Women.pdf.
22 © OECD, 2018EMPOWERING WOMEN IN THE DIGITAL AGE: WHERE DO WE STAND?
Whether automation will affect men and women to different extents is not clear. While the risk of automation
has traditionally been highest in manufacturing, where men dominate, OECD analysis shows a mixed and more
nuanced picture. Some large industries with high shares of women such as food and beverage service activities,
and retail trade (OECD, 2017e) (Figure 15) appear at a high average risk of automation. Men, in turn, feature
prominently in industries like manufacturing, construction and transportation where the average risk of automation
is also high. Other sectors, such as education, social work and health care seeing an important presence of
women have a lower risk of job automation; but since many women work in these large sectors, the absolute
number of female workers at risk of being displaced is still high. On average, across all industries, men and
women are seemingly exposed to similar risks of automation.
However, there are several reasons why the risk of automation may not necessarily translate into actual job
losses. Technology development and adoption depend on a host of economic, legal, ethical and social factors,
as well as on the availability of the skills needed to make technology work. In addition, not all technological
change is labour-replacing: some digital technologies make workers more productive. At the same time, it is
important to bear in mind that technological progress is creating many new jobs – either directly (for example
7
big data architects, cloud service specialists or digital marketing specialists ) or indirectly through its effect on
demand (e.g. by lowering prices of goods and services, and increasing their quality).
Figure 16. Change in employment levels, by gender and skill level, 2003-15
United States, Japan and European Union (million jobs)
Male Female
Panel A. United States Panel B. Japan Panel C. European Union
10 10 10
8 8 8
6 6 6
4 4 4
2 2 2
0 0 0
-2 -2 -2
-4 -4 -4
-6 -6 -6
-8 -8 -8
-10 -10 -10
Low skill Middle skill High skill Low skill Middle skill High skill Low skill Middle skill High skill
Notes: High-skill occupations include jobs classified under the ISCO-88 major groups 1, 2 and 3, namely: legislators, senior officials, and
managers (group 1); professionals (group 2); and technicians and associate professionals (group 3). Middle skill occupations include jobs
classified under the ISCO-88 major groups 4, 7, and 8: i.e. clerks (group 4); craft and related trades workers (group 7); and plant and
machine operators and assemblers (group 8). Low skill occupations include jobs classified under the ISCO-88 major groups 5 and 9,
namely: service workers and shop and market sales workers (group 5), and elementary occupations (group 9). European EULFS
employment data beyond 2010 are mapped from ISCO-08 to ISCO-88 using a many-to-many mapping technique. Data for Japan is for the
period 2003 to 2010 due to a structural break in the data. Data for the European Union includes: Austria, Belgium, Bulgaria, Cyprus, the
Czech Republic, Germany, Denmark, Estonia, Spain, Finland, France, Greece, Hungary, Ireland, Italy, Lithuania, Luxembourg, Latvia, the
Netherlands, Poland, Portugal, Romania, Sweden, Slovenia, and the United Kingdom. Data for Germany is from 2003 to 2013.
Note by Turkey:
The information in this document with reference to “Cyprus” relates to the southern part of the Island. There is no single authority
representing both Turkish and Greek Cypriot people on the Island. Turkey recognises the Turkish Republic of Northern Cyprus (TRNC).
Until a lasting and equitable solution is found within the context of the United Nations, Turkey shall preserve its position concerning the
“Cyprus issue”.
Note by all the European Union Member States of the OECD and the European Union:
The Republic of Cyprus is recognised by all members of the United Nations with the exception of Turkey. The information in this document
relates to the area under the effective control of the Government of the Republic of Cyprus.
Source: OECD (2017e), “Going Digital: The future of work for women”, www.oecd.org/employment/Going-Digitalthe-Future-of-Work-for-
Women.pdf.
© OECD, 2018 23EMPOWERING WOMEN IN THE DIGITAL AGE: WHERE DO WE STAND? Skills provide an important safeguard against the risk of automation (OECD, 2017g). Fewer than 5% of workers with a tertiary degree are at a high risk of losing their job due to automation, on average, compared to 40% of workers with a lower secondary degree (Arntz, Gregory and Zierahn, 2016; OECD, 2016a). This is good news for women: across OECD countries, more women than men are now tertiary graduates (OECD, 2016b). Indeed, looking at the type of jobs gained and lost over the last 15 years, shows that most job growth has been on the high-skill end, and that women have benefited from this more than men (see Figure 16). This is true in the United States, Japan, as well as in Europe as a whole. Similarly, jobs in the middle of the skills distribution have declined in absolute terms in all countries, but the gender distribution of losses varies by country. Everywhere, more women now also work in low-skilled jobs. In the United States, a larger share of the growth in low-skilled jobs has gone to men, while the opposite is true in Europe. In Japan, the number of men in low-skilled jobs has declined. 24 © OECD, 2018
EMPOWERING WOMEN IN THE DIGITAL AGE: WHERE DO WE STAND?
8. Leapfrogging opportunities to bridge
the digital gender divide
While the gender gap in the access and usage of digital technologies remains a challenge for policy, society as
a whole as well as individuals, digital technologies can provide “leapfrog” opportunities for women’s economic
empowerment and contribute to bridging the digital gender divide.
Platforms: The use of digital platforms may offer women many additional opportunities, including the possibility
to overcome challenges related to physical immobility, access to new markets, to knowledge as well as flexibility
in working time and supplementing household income: Etsy found that 17% of its sellers, for instance, have
annual household income under USD 25 000 and nearly half had never sold their goods before joining Etsy
(Etsy, 2015). The use of digital platforms may therefore result in relatively higher female employment rates on
platforms than in traditional industries or businesses: in the United States, for example, the proportion of
female drivers is higher for Uber (14%) than for traditional taxis (8%) (Hall and Krueger, 2015). Furthermore,
online platforms may allow women to more easily access new product markets, which, in turn, can trigger
innovation in e-commerce. Evidence from the United States shows that gender pay gaps also tend to be lower
in industries where working arrangements are more flexible (Goldin, 2014) and that women perceive their
work through digital platforms as a possibility for equal pay to their male counterparts (Hyperwallet, 2017). In
the online Chinese e-commerce group Alibaba women account for 9 of the 30 partners, while on average only
6% of corporate board positions are occupied by women in Asia (Financial Times, 2014). Finally, analysis from
Europe shows that greater work flexibility goes hand-in-hand with higher employment rates among mothers
(OECD, 2017k and calculations based on Eurofound, 2015).
Mobile phones: Mobile phones have proved to have both direct and indirect effects on the economic situation
and social well-being of women, their families and the wider economy. On an individual level, mobile phones have
contributed to economically empower women, through enhanced access to information, markets, and improved
saving behaviour. They have also provided women with improved access to knowledge about governmental
support, pension rights, medical treatments and maternal health care. Closing the digital gender gap is also a
business opportunity: it is estimated that connecting women would provide the mobile industry with a new
market worth USD 170 billion over the period 2015-20 (GSMA, 2015).
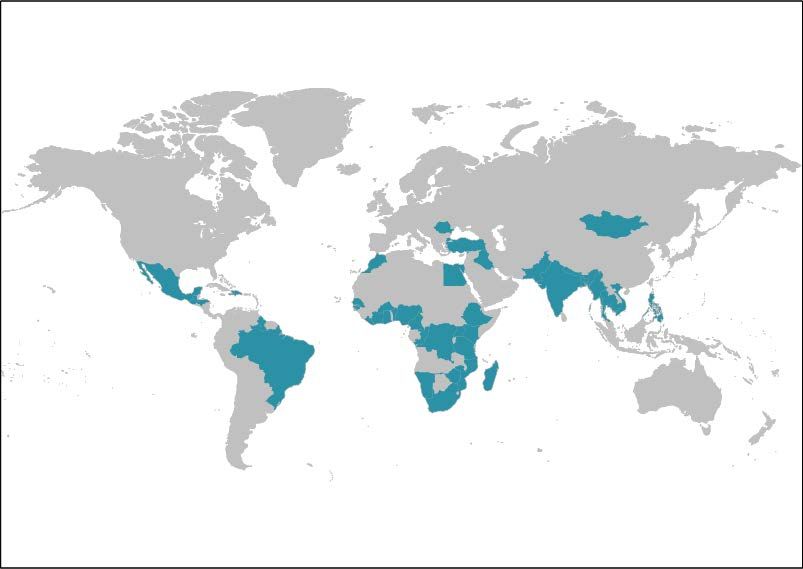
Figure 17. Countries with installed mobile money services for those without a bank account
Source: OECD, based on GSMA (2018), “Mobile Money Deployment Tracker”, https://www.gsma.com/mobilefordevelopment/m4d-
tracker/mobile-money-deployment-tracker.
© OECD, 2018 25You can also read