Convergent Evolution and Divergent Selection: Lizards at the White Sands Ecotone
←
→
Page content transcription
If your browser does not render page correctly, please read the page content below
vol. 167, no. 1 the american naturalist january 2006
Convergent Evolution and Divergent Selection:
Lizards at the White Sands Ecotone
Erica Bree Rosenblum*
Museum of Vertebrate Zoology, University of California, Berkeley, hinder local adaptation by homogenizing populations sub-
California 94720 ject to different selection pressures (Slatkin 1987; Kirk-
patrick and Barton 1997; Storfer et al. 1999; Lenormand
Submitted December 16, 2004; Accepted August 22, 2005;
Electronically published November 7, 2005 2002). Alternatively, divergent selection may overwhelm
even substantial gene flow and lead to population differ-
Online enhancements: appendixes. entiation (Turrelli et al. 2001; Doebeli and Dieckmann
2003). Population-level divergence in the face of coun-
tervailing gene flow has been documented in diverse taxa
(e.g., plants [Pressoir and Berthaud 2004], flies [Michalak
abstract: Ecological transition zones, where organismal pheno- et al. 2001], fish [Saint-Laurent et al. 2003], lizards
types result from a delicate balance between selection and migration, [Schneider et al. 1999], and birds [Smith et al. 2001]).
highlight the interplay of local adaptation and gene flow. Here, I Although these studies have been focused primarily at the
study the response of an entire species assemblage to natural selection population level, recent work also suggests a role for eco-
across a common ecotone. Three lizard species, distributed along a logical divergence in reproductive isolation and speciation
dramatic environmental gradient in substrate color, display conver- (Greenberg et al. 2003; McKinnon et al. 2004).
gent adaptation of blanched coloration on the gypsum dunes of
Most empirical studies of divergent selection across eco-
White Sands National Monument. I investigate the role of gene flow
in modulating phenotypic response to selection by quantifying color logical transition zones have focused on single species
variation and genetic variation across the ecotone. I find species (Smith et al. 1997; Ogden and Thorpe 2002). However,
differences in degree of background matching and in genetic con- different species may exhibit different phenotypic re-
nectivity of populations across the ecotone. Differences among spe- sponses to the same environmental gradient, especially if
cies in phenotypic response to selection scale precisely to levels of the relationship between selection and gene flow varies
genetic isolation. Species with higher levels of gene flow across the
among species. When exposed to selection across an eco-
ecotone exhibit less dramatic responses to selection. Results also
reveal a strong signal of ecologically mediated divergence for White
tone, theoretical models predict that phenotypic diver-
Sands lizards. For all species, phenotypic variation is better explained gence should scale with genetic isolation (Endler 1977; Orr
by habitat similarity than genetic similarity. Convergent evolution of and Smith 1998). For example, species with lower levels
blanched coloration at White Sands clearly reflects the action of of gene flow between divergent habitats (i.e., low intrinsic
strong divergent selection; however, adaptive response appears to be dispersal capability or patchy population distribution) are
modulated by gene flow and demographic history and can be pre- expected to exhibit greater phenotypic differentiation.
dicted by divergence-with-gene-flow models.
Studying multiple species distributed along the same en-
vironmental gradient therefore provides a comparative
Keywords: color variation, local adaptation, gene flow, Holbrookia
framework to test the hypothesis that species with reduced
maculata, Sceloporus undulatus, Aspidoscelis inornata.
population connectivity exhibit stronger phenotypic re-
sponses to divergent selection.
Ecological transition zones provide a dynamic opportunity The White Sands National Monument of southern New
to understand the balance between gene flow and adaptive Mexico provides a unique setting in which to examine the
evolution in natural systems. Depending on the strength response of multiple species to natural selection across a
of natural selection and rates of migration, gene flow may common environmental gradient. White Sands is a dis-
tinctive landscape of stark white hydrous calcium sulfate
* E-mail: rosenblum@berkeley.edu. (gypsum) dunes. The 275 square miles of gypsum contrast
Am. Nat. 2006. Vol. 167, pp. 1–15. 䉷 2006 by The University of Chicago. dramatically with the dark colors of adjacent substrate.
0003-0147/2006/16701-40811$15.00. All rights reserved. The deposition of white substrate represents a geologically2 The American Naturalist recent change in selective environment. The Tularosa Basin ferences among species. Observational data indicate that was engulfed by an inland lake at the last glacial maximum, S. undulatus and A. inornata are continuously distributed and estimates suggest that much of the dune sedimentation across the White Sands ecotone while H. maculata is more is as young as 2,000 years old (S. Fryberger, unpublished patchily distributed at the ecotone and in surrounding manuscript). Therefore, any evolutionary response in local dark soil habitat (Dixon 1967; E. B. Rosenblum, personal fauna to this post-Pleistocene formation has occurred rel- observation). Differences in vagility, microhabitat associ- atively rapidly. There are no physical barriers separating ation, and foraging mode among the three species (Dixon the white sands from the surrounding dark soils, and many and Medica 1966; Dixon 1967; Jones and Droge 1980; species have continuous distributions across the ecotone. Degenhardt et al. 1996; Hager 2001a) also ultimately affect Therefore, gene flow between different substrate environ- the genetic connectivity of populations. Because of its ments may modulate organismal response to natural se- patchy distribution, gene flow between dark soil and white lection at White Sands. sand habitats is likely reduced for H. maculata relative to There has been dramatic convergence in dorsal color S. undulatus and A. inornata. Divergence-with-gene-flow morphology by all of the lizard species that inhabit White models therefore predict that phenotypic differentiation Sands (fig. 1). Holbrookia maculata (common lesser earless among populations should be greater for H. maculata. lizard), Sceloporus undulatus (eastern fence lizard), and In this study, I ask how the complete lizard fauna at Aspidoscelis inornata (little striped whiptail, formerly White Sands has responded to natural selection across a Cnemidophorus inornatus; Reeder et al. 2002) exhibit common ecotone. To understand phenotypic response to blanched forms on the gypsum dunes and dark forms in selection, I quantify patterns of lizard color variation in the surrounding habitat matrix and the rest of their ranges three substrate environments (i.e., white sand, dark soil, (Smith 1943; Lowe and Norris 1956; Dixon 1967; Hager ecotone). To understand current and historical levels of 2001b). Breeding experiments with H. maculata and S. population connectivity, I evaluate patterns of genetic var- undulatus (Rosenblum 2005) and candidate gene studies iation across the ecotone. I then integrate phenotypic and with A. inornata (Rosenblum et al. 2004) provide evidence molecular data to examine the interaction between gene that dorsal color variation in this system has a genetic flow and natural selection and to explore the evidence for basis and is thus visible to natural selection. ecologically mediated divergence at White Sands. The blanched coloration of lizards at White Sands is hypothesized to be an adaptation for crypsis. The impor- tance of substrate matching in diminishing visibility from Methods avian predators has been demonstrated for a variety of Sampling taxa (Dice 1947; Kiltie 1992; Reed and Janzen 1999). Small diurnal lizards at White Sands likely receive similar benefits Collection locality information is presented in figure 1 and from cryptic coloration. For example, studies in both liz- table 1. For each species, three habitat categories were ards (Luke 1989) and small mammals (Kaufman 1973) sampled in the Chihuahuan Desert of southern New Mex- have documented the importance of background matching ico. First, “white sand” habitat is defined as pure gypsum for avoiding predation by the loggerhead shrike, Lanius substrate. This landscape consists of high barren dunes ludovicianus, a known predator of lizards at White Sands separated by low interdune areas dominated by rabbit- (Reid and Fulbright 1981; E. B. Rosenblum, personal ob- brush (Chrysothamnus pulchellus), yucca (Yucca elata), servation). The available evidence is also inconsistent with Mormon tea (Ephedra torrreyana), sand verbena (Phyla the alternative hypothesis that light coloration at White incise), and a variety of grasses (Oryzopsis sp., Sporobolus Sands is a thermoregulatory adaptation. A number of stud- sp.). Two dune localities were sampled for all species (pop- ies have demonstrated that more melanic animals can heat ulations A and B). Second, “dark soil” refers to habitat faster and obtain higher body temperatures than less me- with brown adobe substrate, typical of the Chihuahuan lanic conspecifics (Pearson 1977; Forsman 1995). Light Desert region. These grasslands and scrublands are dom- coloration may therefore serve to slow or limit heat gain inated by yucca (Yucca elata), mesquite (Prosopis glan- (Benson 1933). However, ambient and substrate temper- dulosa), cactus (Opuntia sp.), and grama grasses (Boute- atures at White Sands are actually lower than in surround- loua sp.). Six dark soil localities were sampled to capture ing dark soil habitats (Hager 2000; E. B. Rosenblum, un- variation both within the Tularosa Basin (populations G– published data), so selection pressure to reduce heat loads J) and just west of the San Andres Mountains (populations would not be predicted on the gypsum dunes. E and F). Because of differences in habitat requirements, If the relationship between selection and migration is not all species were sampled in all dark soil localities; important at White Sands, the effect of divergent selection however, sampling for each species occurred over the same may be modulated by ecological and distributional dif- spatial scale. Third, “ecotone” habitat is defined as areas
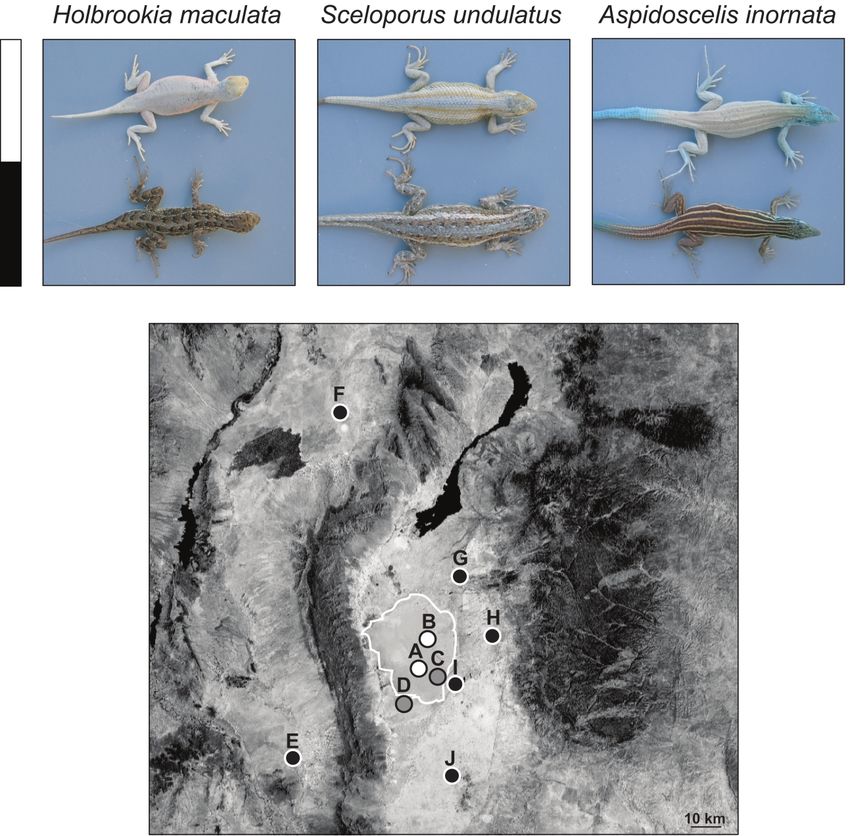
Convergent Evolution and Divergent Selection 3

Figure 1: Aerial photograph of the Tularosa Basin of southern New Mexico with photographs of lizards from different substrate color environments.
The blanched color morphs found at White Sands (indicated by the white bar) are compared to the wild-type color morphs found throughout the
rest of the species’ ranges (indicated by the black bar). On the map, black, white, and gray circles represent collecting localities with dark soil, white
sand, and ecotonal habitats, respectively. Population letter designations are used throughout and correspond to the following geographic localities:
A, Alkali Flats, White Sands National Monument; B, Range Road 10, White Sands Missile Range; C, Big Dunes, White Sands National Monument;
D, Observatory, White Sands Missile Range; E, Experimental Range, Jornada Long-Term Ecological Research Station; F, Mockingbird Pass, White
Sands Missile Range; G, Rita Site, White Sands Missile Range; H, Taylor Draw, Three Rivers; I, Visitor’s Center, White Sands National Monument;
J, Otero Mesa, Fort Bliss.

of transition from dark soil to white sand substrate. These                   dunes over time and the temporal layering of gypsum
narrow bands of habitat are found either at the margin of                     deposition cause greater variability in substrate color in
the large dune system or at small satellite dunes just re-                    ecotonal areas. These transition zones are extremely re-
moved from the primary dune field. The movement of the                        stricted, and the boundary of the white sand is abrupt and
4   The American Naturalist

    Table 1: Taxa surveyed and sampling design
    Species                                    White sand                               Ecotone                                Dark soil
    Holbrookia maculata
      (lesser earless lizard)      All white sand populations (19);        All ecotone populations (12);          All dark soil populations (34);
                                     populations A (12), B (7)               populations C (10), D (2)              populations E (10), F (10),
                                                                                                                    H (10), J (4)
    Sceloporus undulatus
      (eastern fence lizard)       All white sand populations (20);        All ecotone populations (20);          All dark soil populations (25);
                                     populations A (13), B (7)               populations C (11), D (9)              populations E (8), F (2),
                                                                                                                    G (9), I (6)
    Aspidoscelis inornata
      (little striped whiptail)    All white sand populations (14);        All ecotone populations (14);          All dark soil populations (13);
                                     populations A (11), B (3)               populations C (12), D (2)              populations E (10), F (2),
                                                                                                                    G (1)
       Note: Population letter designations refer to map in fig. 1. Collection locality details are provided in table A1 in the online edition. Number
    of lizards sampled from a population is given in parentheses.

easily defined. Lizards caught at the ecotone were generally                  understand the capacity for color change in the focal spe-
only meters from the edge of the dune field. Two ecotone                      cies. Prior experiments have evaluated the potential for
localities were sampled for all species (populations C and                    both physiological (rapid) and ontogenetic color change
D).                                                                           in H. maculata, S. undulatus, and A. inornata. These studies
   Distances from dark soil to white sand populations var-                    found that color change within morphs when held at dif-
ied among species. Dark soil populations of both Scelop-                      ferent temperatures and on different substrate colors was
orus undulatus and Aspidoscelis inornata occur essentially                    minimal compared to the dramatic differences between
parapatric to the gypsum dune fields, while the closest                       morphs (Smith 1943; Bundy 1955; Lowe and Norris 1956;
dark soil population of Holbrookia maculata was found                         Rosenblum 2005). Common-garden breeding experiments
farther away. Dark soil populations were sampled 35–64                        (Rosenblum 2005) also indicate that environmental effects
km away from the white sands for H. maculata, 10–85 km                        cannot explain the blanched coloration of lizards at White
away for S. undulatus, and 10–64 km away for A. inornata.                     Sands. To control for the slight darkening response that
The effect of H. maculata’s patchy distribution on analyses                   can occur for lizards at colder temperatures, all color re-
is discussed below. For each species, 12–34 adult individ-                    cordings were obtained at approximately 30⬚C. Lizards
uals per habitat type were sampled. When multiple lo-                         were held on an intermediate substrate before making
calities were sampled per habitat, roughly 10 individuals                     color measurements.
per locality were collected, although samples are smaller                        Lizard dorsal body coloration was characterized by tak-
for several localities. Samples were generally made up of                     ing spectrophotometric readings along the dorsal midline.
a balanced number of males and females. A subset of                           Spectral readings were highly consistent within individuals.
lizards was kept as vouchers and deposited in the Museum                      However, to account for any intra-individual measurement
of Vertebrate Zoology at the University of California,                        variation, three readings along the dorsal midline were
Berkeley. All other lizards were released at collection sites                 averaged: between the front limbs, at the center of the
once spectrophotometric data and tissue samples were                          body, and between the hind limbs. The color of four to
taken. Sample numbers and locality information for                            six substrate samples from each habitat type was also
voucher and tissue accessions are provided in table A1,                       quantified.
available in the online edition of the American Naturalist.                      Spectrophotometric readings were taken with an Ocean
Genotypic and phenotypic data were collected for all in-                      Optics USB 2000 spectrophotometer with a dual deute-
dividuals except for eight H. maculata that were included                     rium/tungsten halogen light source. A custom-made probe
in the molecular analyses but for which no color mea-                         holder was used to orient the probe at 45⬚ and 1 cm away
surements were made.                                                          from the dorsal body surface. Each spectral reading was
                                                                              taken in reference to a white standard and consisted of
                                                                              percent transmission recordings at 0.3-nm intervals. The
                  Quantifying Color Variation
                                                                              mean of every 10 points along the spectra was taken to
Because environmental effects on reptile coloration are                       create 3-nm bins, reducing the number of variables from
well documented (Waring 1963; Norris 1965; Sherbrooke                         ∼2,000 to ∼200. Readings from 300 to 700 nm, the spectral
et al. 1994; Nery and Castrucci 1997), it is essential to                     range visible to squamates and their avian predators (Ben-
Convergent Evolution and Divergent Selection 5
nett and Cuthill 1994; Ellingson et al. 1995; Fleishman et imals was calculated for each species. Statistical analyses
al. 1997; Cuthill et al. 1999), were used for analysis. were executed in Statistica (StatSoft).
Although there are multiple analytical methods available
for spectrophotometric data (Endler 1990; Grill and Rush
Characterizing Genetic Variation
2000; Thorpe 2002), there are several reasons why prin-
cipal components analysis (PCA) is preferred for the data To determine levels of historical isolation between white
set presented here. First, PCA is appropriate when little is sand and dark soil populations, the mitochondrial ND4
known about the visual system of focal species and their gene and associated tRNAs were sequenced. Primers mod-
predators because no assumptions are made about how ified from Arevalo et al. (1994) were used for polymerase
organisms perceive different segments of the spectrum. chain reaction and sequencing (ND4: 5-CAC CTA TGA
Second, this method provides information about specific CTA CCA AAA GCT CAT GTA GAA GC-3 and LEU: 5-
aspects of coloration. Color is composed of three com- CAT TAC TTT TAC TTG GAT TTG CAC CA-3). Forward
ponents: brightness describes light transmission intensity, and reverse sequencing were conducted on an ABI 3730
chroma describes color purity, and hue describes the wave- (Applied Biosystems). Sequences were aligned and edited
length of maximum slope (Endler 1990). Empirical find- in Sequencher (GeneCodes). For H. maculata, 812 bp were
ings show that principal component 1 (PC1) corresponds sequenced for 65 individuals, for S. undulatus 813 bp for
to brightness while PC2 and PC3 generally contain infor- 65 individuals, and for A. inornata 793 bp for 41 individ-
mation about chroma and hue (Grill and Rush 2000). I uals. Higher levels of ND4 variation were found for H.
corroborated this finding in my data set by comparing maculata and S. undulatus than for A. inornata, but var-
results from PCA with a more direct estimation of bright- iation was observed for all species (H. maculata, 51 variable
ness: area under the spectral curve (AUC). In the analyses sites and 24 haplotypes; S. undulatus, 55 variable sites and
of dorsal coloration presented here, PC1 explains over 84% 17 haplotypes; A. inornata, 17 variable sites and 14 hap-
of the variance in all data sets and returns results nearly lotypes). All mitochondrial sequences have been deposited
identical to calculations based on AUC. Therefore, PC1 in Genbank (accession nos. DQ113953–DQ114121).
scores are an accurate quantification of the brightness as- Intraspecific relationships were reconstructed using a
pect of color and describe most of the color variation maximum likelihood algorithm implemented in PAUP∗
observed in Tularosa Basin lizards. Finally, PCA allows for 4.0 (Swofford 2003). Appropriate models of evolution and
visualization of data in multivariate color space that uni- likelihood parameters were determined with MODELTEST
variate techniques such as AUC do not. (Posada and Crandall 1998). The HKY⫹G model was used
Three PCAs were performed on spectrophotometric for H. maculata and A. inornata, and the TrN⫹I⫹G was
data. First, substrate comparisons were used to document used for S. undulatus. Nodal support was determined by
color environment in white sand, dark soil, and ecotonal bootstrap analysis. For H. maculata and S. undulatus, con-
habitats. Second, comparisons among species were used specific individuals from Arizona were used as outgroups
to determine whether H. maculata, S. undulatus, and A. for tree rooting, and for A. inornata the closely related
inornata exhibit different degrees of local adaptation to Aspidoscelis uniparens was used as an outgroup.
the white sand environment. For interspecific compari- Levels of population subdivision within species were
sons, only white sand and dark soil individuals were in- computed using Tamura and Nei molecular distances (Ta-
cluded. Third, comparisons within species were used to mura and Nei 1993) implemented in Arlequin (Schneider
document patterns of phenotypic variation across the ec- et al. 2000). A hierarchical analysis of molecular variance
otone. For intraspecific comparisons, individuals from all (AMOVA) was conducted with populations nested within
three habitats were included. For each analysis, principal the three habitat types. Confidence intervals for the global
component factor scores (FS1, FS2, FS3) were analyzed FST from AMOVA were estimated by permuting haplotypes
with a MANOVA design. All analyses were performed with among populations and among habitat groups. To explore
individuals grouped by habitat (white sand, dark soil, and the effect of sampling design on inferences of population
ecotone). If a MANOVA was significant, univariate tests subdivision, FST was also calculated with a reduced sample
were performed for FS1, FS2, and FS3 to determine which in S. undulatus and A. inornata. Because dark soil pop-
aspect of color explained most of the observed differences ulations of H. maculata were not found parapatric to
among lizards. If an ANOVA on FS1, FS2, or FS3 was White Sands, analyses excluding population I (fig. 1) for
significant, post hoc Tukey HSD tests were used to deter- S. undulatus and A. inornata provide a more direct com-
mine which groups occupied significantly different regions parison of levels of genetic differentiation among species.
of color space. Finally, to better understand relative levels Pairwise population comparisons were also conducted. For
of local adaptation among species, the average phenotypic all FST analyses, 1,000 permutations were performed to
distance along PC1 between white sand and dark soil an- determine statistical significance.6 The American Naturalist
To understand whether patterns revealed by FST are ex- variety of data types (Smouse et al. 1986; Thorpe et al.
plained by ongoing or historical population dynamics, two 1996; Storz 2002). In the simplest case, the association
additional analyses were performed. First, levels of gene between two matrices (i.e., dependent and independent
flow between divergent color morphs were estimated using variables) can be evaluated using randomization proce-
the program IM (Hey and Nielsen 2004). IM uses a Mar- dures. If there are multiple potentially explanatory vari-
kov chain Monte Carlo method to estimate the posterior ables, partial MCTs can be used to test the association
probability of m, the migration rate between two popu- between a dependent variable and several independent var-
lations per gene per generation scaled by mutation rate. iables simultaneously. In this case, partial regressions are
With a known mutation rate, m can be used to obtain the conducted to understand the correlation between two ma-
population migration rate, Nm. Here I ask whether mi- trices while controlling for the effect of a third matrix.
gration rates between populations inhabiting divergent Because partial MCTs may be misleading when spatial au-
habitats are significantly greater than 0; all results are pre- tocorrelations of the dependent variables are important
sented as m, not Nm. For each species, migration rates (Raufaste and Rousset 2001; Castellano and Balletto 2002;
were estimated between white sand populations and the Rousset 2002)—a problem not encountered with pairwise
geographically nearest dark soil population with adequate MCTs—it is informative to compare results of both pair-
sample size (population H for H. maculata, population I wise and partial tests.
for S. undulatus, population E for A. inornata; fig. 1). For each species, three matrices were generated based
Maximum times for population splitting were set based on pairwise population comparisons. The first matrix de-
on the known geological history of White Sands. To ex- scribed phenotypic variation in dorsal brightness and was
plore the effects of unequal sample sizes on inferences generated using absolute values of linear distances along
using IM, analyses were also conducted with a subsample PC1. The second matrix described genetic differentiation
of white sand individuals. Runs using full and reduced within species and was composed of pairwise estimates of
data sets returned similar point estimates for migration linearized FST. The third matrix, the hypothesis matrix,
rates, so results from full analyses are presented here. Be- established expectations for the relationship between phe-
cause IM simultaneously estimates migration rate and di- notypic and genotypic variation among different habitat
vergence time, it is difficult to differentiate current and types. Phenotypic distance was predicted to be highest for
historical migration, especially for populations with shal- comparisons between the most dissimilar habitats (white
low divergence times. Therefore, to further explore the sand vs. dark soil), lowest for within-habitat comparisons,
possibility that recent common ancestry (i.e., population and intermediate for comparisons involving ecotonal
expansion) could explain observed genetic patterns, his- habitat.
torical population size changes were estimated using Both partial and pairwise MCTs were conducted for
FLUCTUATE (ver. 1.4; Kuhner et al. 1998). FLUCTUATE each species. Partial MCTs were used to test for significant
uses Metropolis-Hastings sampling to calculate g, popu- correspondence between the phenotypic matrix and the
lation growth rate per generation scaled by mutation rate. hypothesis matrix while controlling for the genotypic ma-
For each species, population growth was estimated using trix. This method effectively “removes” the component of
all available samples. For S. undulatus and H. maculata, population-level phenotypic divergence that would be ex-
the species for which the assumption of panmixis is likely pected because of observed levels of genetic subdivision.
violated at this spatial scale, population growth was also Pairwise MCTs were used to test for significant corre-
estimated using only white sand samples. Significance lev- spondence between all pairwise combinations of the phe-
els were the same regardless of sampling scheme, so results notypic, genotypic, and hypothesis matrices. Statistical sig-
with all samples are reported here. For IM and FLUC- nificance for all MCTs was assessed with permutation tests,
TUATE analyses, likelihood ratio tests were used to de- and Bonferroni corrections were used to adjust signifi-
termine whether m p 0 and g p 0 could be rejected, and cance levels for multiple comparisons conducted with pair-
statistical significance was approximated using the x2 wise MCTs. Results were consistent whether analyses were
distribution. conducted with partial or pairwise tests.
In general, phenotypic and genotypic matrices were con-
structed from data from identical sets of individuals. How-
Comparing Phenotypic and Genotypic Variation
ever, only genotypic data were available for eight H. ma-
To determine whether patterns of phenotypic and geno- culata from dark soil populations; the phenotypic matrix
typic variation were concordant across the White Sands for this population therefore contained fewer individuals.
ecotone, I conducted hypothesis-driven matrix correspon- To ensure that results were robust to the inclusion of pop-
dence tests (MCTs). MCTs can be a powerful tool in un- ulations with small sample sizes, MCTs were conducted
derstanding the association among distance metrics for a both with and without the several populations with fewerConvergent Evolution and Divergent Selection 7
than five individuals. Results of analyses were the same
regardless of whether these populations were included; re-
sults of tests with all data points are presented here.
Results
Adaptive Phenotypic Variation
Substrates from dark soil, white sand, and ecotonal hab-
itats were all statistically distinguishable in color space (fig.
2; table 2). The brightness aspect of color (PC1) explained
98% of the variation in substrate color. The white sand
of the gypsum dunes was significantly brighter than any
other substrate measured from the surrounding region. As
expected, ecotonal substrates were intermediate in bright-
ness between white sand and dark soil and showed a larger
variance in brightness. PC2 explained less than 2% of the Figure 2: Substrate color. For principal components analysis (PCA) of
variation in color, but differences among substrates were spectrophotometric data, PC1 (representing brightness) is plotted against
also observed on this axis, with ecotonal substrates ap- PC2. Values on each axis indicate the percentage of variation explained
pearing unique. No differences among groups were ob- by that factor. Black, white, and gray polygons enclose substrate mea-
surements from dark soil, white sand, and ecotone habitats, respectively.
served on PC3.
Interspecific comparisons revealed convergent evolution
of blanched coloration but also species differences in de- of observed variation (more than 84% in all comparisons).
gree of background matching (fig. 3; table 2). Similar to For H. maculata, ecotonal animals were statistically in-
the partitioning of variation in substrate color, brightness distinguishable in dorsal brightness from white sand an-
explained the bulk of variation in lizard coloration (87% imals. For S. undulatus, ecotonal samples comprised a
for interspecific comparison). In the dark soil habitat, all third, statistically distinguishable group intermediate in
three species exhibited dark color and occupied similar brightness between those from dark soil and white sand
regions of color space. Dark soil populations of Holbrookia habitats. In A. inornata, ecotonal populations were also
maculata were brighter than those of Sceloporus undulatus, intermediate in brightness but were statistically indistin-
but otherwise dark soil populations were similar in color guishable from dark soil conspecifics. Differences among
across species. In the white sand habitat, light color morphs along PC2 and PC3 were detectable only in S.
morphs of all three species were significantly brighter than undulatus and explained only a small proportion of total
conspecifics in dark soil habitat. However, the three species variation in color. For S. undulatus PC2 (9% of total var-
showed varying degrees of background matching in the iation), ecotonal animals were grouped with dark soil an-
white sand environment. The blanched morph of H. ma- imals to the exclusion of white sand animals, and for PC3
culata was significantly brighter than that of either S. un- (!2% of total variation), dark soil and white sand animals
dulatus or Aspidoscelis inornata. Although H. maculata was were grouped together to the exclusion of ecotonal ani-
brightest in both white sand and dark soil habitats, the mals. Because PC1 explained the vast majority of the color
greatest phenotypic distance between different color variation in all analyses and because it was not clear what
morphs was also observed in this species (fig. 3). The the relative contributions of chroma and hue were to PC2
difference between mean factor scores on PC1 for white and PC3, subsequent discussion focuses primarily on PC1
sand and dark soil animals was greater for H. maculata (brightness).
(19.46, SE p 1.48) than for S. undulatus (14.61, SE p
1.47) or A. inornata (13.83, SE p 1.89). A significant dif- Genetic Structure
ference in dorsal coloration was also observed on PC2
(accounting for 8% of observed variation) and was ex- Patterns of mitochondrial geographic structure differed
plained primarily by differences among species. Differ- among species (fig. 5). Holbrookia maculata was the most
ences on PC3 explained 4% of variation and did not elu- highly structured at this spatial scale, and clades generally
cidate any obvious intra- or interspecific patterns. represented geographically defined populations. A major
Intraspecific comparisons revealed differences among phylogeographic split was observed across the San Andres
species in phenotypic patterns observed at the ecotone (fig. Mountains; populations east of the San Andres Mountains
4; table 2). Again, PC1 (brightness) explained the majority were clearly differentiated from populations E and F west8 The American Naturalist
Table 2: Variation in substrate coloration and lizard dorsal coloration among different habitats: results
from principal components analysis (PCA) and MANOVA
Variation explained Distinguishable
Species by PC axis (%) df F P groupsa
Substrate 6, 18 14.42 !.00001
PC1 (brightness) 98.25 2, 11 20.77 .0002 (DS) (E) (WS)
PC2 1.45 2, 11 27.67 .0001 (DS ⫹ WS) (E)
PC3 .26 2, 11 .17 .845 NS
All species 15, 301 39.01 !.000001
PC1 (brightness) 86.75 5, 111 76.08 !.00001 See text
PC2 7.78 5, 111 7.34 .00001 See text
PC3 4.12 5, 111 42.02 .0001 See text
Holbrookia maculata 6, 104 26.55 !.000001
PC1 (brightness) 89.47 2, 54 100.66 !.00001 (DS) (E ⫹ WS)
PC2 7.36 2, 54 2.13 .128 NS
PC3 2.02 2, 54 1.00 .376 NS
Sceloporus undulatus 6, 120 21.68 !.000001
PC1 (brightness) 88.88 2, 62 48.19 !.00001 (DS) (E) (WS)
PC2 8.74 2, 62 6.27 .003 (DS ⫹ E) (WS)
PC3 1.51 2, 62 3.69 .031 (DS ⫹ WS) (E)
Aspidoscelis inornata 6, 72 15.86 !.000001
PC1 (brightness) 84.82 2, 38 31.13 !.00001 (DS ⫹ E) (WS)
PC2 11.30 2, 38 4.67 .015 (DS ⫹ E) (WS)
PC3 2.02 2, 38 .44 .645 NS
Note: For each analysis, results from the full MANOVA are shown first, and results from post hoc tests on PC1, PC2,
and PC3 are shown below. The percentage of variation explained by each PC is given. Results for brightness (PC1), which
explain most of observed variance in color, appear in bold. Degrees of freedom, F statistics, and P values from ANOVA
on PCA factor scores are provided.
a
Groups distinguishable with post hoc Tukey HSD tests are enclosed in separate parentheses; “NS” indicates an ANOVA
with no significant differences among groups. Habitat group abbreviations: DS p dark soil; WS p white sand; E p
ecotone.
of the San Andres Mountains. Within the Tularosa Basin, population subdivision were significantly different from 0
dark soil forms were basal; however, the dark soil popu- in H. maculata and S. undulatus but not in A. inornata.
lation H was nested within the clade containing white sand Results from pairwise FST comparisons were also consis-
individuals. In S. undulatus, organisms from similar hab- tent with the observation of less genetic differentiation
itats did not group together, and white sand individuals among populations of A. inornata than in the other two
did not form a monophyletic group. In this species, there species. For H. maculata and S. undulatus, 71% and 75%
were only two clades that corresponded to geographic of populations were statistically differentiated, respectively,
groupings (populations F and G). Other than these two while for A. inornata only 24% of pairwise population
groups, animals did not tend to cluster with others from comparisons showed significant differentiation.
the same locality. For A. inornata, the tree revealed a nearly Comparisons of FST involving ecotonal populations also
panmictic population at this spatial scale. There was no suggested that levels of genetic connectivity across the ec-
substructuring of individuals from different habitat types, otone varied among species. For H. maculata, ecotonal
and white sand animals were dispersed throughout the populations were genetically similar to white sands pop-
tree. ulations (FST p 0.01) but were highly differentiated from
Patterns of population subdivision, as revealed by dark soil populations (FST p 0.86). For S. undulatus, eco-
AMOVA, enabled the three species to be ranked by degree tonal populations were differentiated from both white sand
of genetic differentiation among populations. Global es- (FST p 0.20) and dark soil populations (FST p 0.55). For
timates of FST were high for H. maculata (0.83), inter- A. inornata, ecotonal populations exhibited low levels of
mediate for S. undulatus (0.54), and low for A. inornata differentiation when compared to either white sand
(0.09). When FST was estimated excluding dark soil pop- (FST p 0.06) or dark soil (FST p 0.07) populations.
ulations of S. undulatus and A. inornata adjacent to White Estimates of migration and population growth were
Sands, this pattern remained the same (for S. undulatus, used to better understand the demographic processes re-
FST p 0.64, and for A. inornata, FST p 0.09). Levels of sponsible for observed patterns of population structure.Convergent Evolution and Divergent Selection 9 Figure 3: Interspecific comparison of dorsal coloration. Species are indicated by generic initial: H p Holbrookia maculata; S p Sceloporus undulatus; A p Aspidoscelis inornata. A, Black polygons enclose all data points within species from dark soil habitats and white polygons enclose all data points within species from white sand habitats. B, Mean difference (and standard error of the mean) between white sand and dark soil individuals along PC1 for each species. Migration rates were measured between white sand pop- positive and asymmetric (m 1 p 1.62, LR p 4.60, P p ulations and their geographically closest dark soil neigh- .0320; m 2 p 2.60, LR p 2.41, P p .1206), with higher bors. For H. maculata, the species exhibiting the highest numbers of migrants estimated moving from dark soil to levels of population differentiation, no gene flow was de- white sand than the reverse (m 2 1 m 1). Although the point tected between white sand animals and the nearest dark estimate for m2 was larger than that for m1 in S. undulatus, soil population (population H; fig. 1; m 1 p 0, likelihood only m1 was statistically significant. Although not statis- ratio [LR] p 0, P p 1; m 2 p 0, LR p 0, P p 1). For S. tically significant, the P value associated with m2 was low, undulatus, the species with an intermediate level of genetic and previous work has shown that likelihood ratio tests structure, estimates of migration between white sand and may be conservative when applied to migration estimates the nearest dark soil population (population I; fig. 1) were (Nielsen and Wakeley 2001). Therefore, it is reasonable to Figure 4: Intraspecific comparisons of dorsal coloration. Black, white, and gray polygons enclose data points from dark soil, white sand, and ecotone lizards, respectively.
Convergent Evolution and Divergent Selection 11

consider scenarios involving symmetrical gene flow across                  Overall, MCTs indicated that color morphology correlated
the ecotone for S. undulatus. For A. inornata, the species                 with habitat similarity but not genetic similarity for White
with little genetic differentiation among populations, the                 Sands lizards.
point estimate for migration from white sand populations
to dark soil population E was positive, but m p 0 could
not be rejected (m 1 p 3.44, LR p 0.45, P p .5023;                                                       Discussion
m 2 p 0.02, LR p 0.08, P p .7773). Overall, the proba-                                    Divergent Selection and Gene Flow
bility of ongoing migration between divergent color
morphs was low for H. maculata, high for S. undulatus,                     Although all lizards inhabiting the white sand environment
and ambiguous for A. inornata. To explore a possible ex-                   exhibit convergent evolution of blanched coloration, the
planation besides ongoing gene flow for the low observed                   strength and geographic pattern of phenotypic response
FST in A. inornata, population growth rates were measured                  to selection vary among species. In the white sand habitat,
for all species. For H. maculata and S. undulatus, no sig-                 there are species differences in the degree of background
nificant changes in population size were detected (H. ma-                  matching to the gypsum environment (fig. 3; table 2). Most
culata g p 100.27, LR p 1.54, P p .2137; S. undulatus                      notably, Holbrookia maculata is significantly brighter in
g p ⫺55.33, LR p 1.58, P p .2085). However, for A. in-                     color and more highly substrate matched than either Sce-
ornata, a strong signature of population growth was ob-                    loporus undulatus or Aspidoscelis inornata. Not only is H.
served (g p 1,301.32, LR p 12.76, P p .0004), suggesting                   maculata more highly background matched at White Sands
that genetic similarity among populations is likely due to                 than the other two species, this species shows the greatest
historical population expansion rather than ongoing gene                   phenotypic change between dark soil and white sand forms
flow in this species.                                                      (fig. 3). The blanched coloration of H. maculata therefore
                                                                           represents a dramatic adaptation to the gypsum environ-
                                                                           ment, not merely a tendency for this species to be brighter
        Ecological Divergence: Comparing Phenotypic
                                                                           than S. undulatus and A. inornata on all substrates. In the
                    and Genetic Variation
                                                                           ecotonal habitat, where the balance between selection and
The prediction that phenotypic divergence should be high-                  migration is expected to be the most dynamic, each species
est among dissimilar habitats and lowest among similar                     also displays a unique phenotypic pattern (fig. 4; table 2).
habitats was tested with MCTs. Genotype, phenotype, and                    In H. maculata, the dorsal color of ecotonal animals is
hypothesis matrices are provided in figure B1, available in                indistinguishable from that of white sand animals. In S.
the online edition of the American Naturalist; results from                undulatus, ecotonal individuals form a statistically distinct
MCTs are shown in table 3. For partial MCTs, the null                      group, intermediate in color between white sand and dark
hypothesis was strongly rejected for each species, indicat-                soil forms. In A. inornata, ecotonal populations are in-
ing that there was more phenotypic variation among dif-                    distinguishable in color from dark soil animals. Overall,
ferent habitat types than expected on the basis of observed                the strongest phenotypic response to selection is observed
genetic variation (linearized FST). For pairwise MCTs, cor-                in H. maculata, an intermediate response occurs in S. un-
respondence between phenotypic distance and hypothesis                     dulatus, and the weakest response is seen in A. inornata.
matrices was strong and highly significant in all species,                    The strength of phenotypic response to selection across
corroborating the ranking of phenotypic differentiation                    the White Sands gradient scales exactly with levels of pop-
that was predicted from an ecological divergence model.                    ulation structure (table 4). Holbrookia maculata, the spe-
Correlations between phenotypic and genetic distance ma-                   cies exhibiting the most dramatic phenotypic response to
trices were weak and not statistically significant after cor-              the white sand environment, also exhibits the greatest de-
rection for multiple comparisons, revealing that popula-                   gree of genetic differentiation among populations
tions were highly divergent in color morphology without                    (FST p 0.82). Sceloporus undulatus, the species showing an
commensurate differentiation at the mitochondrial locus.                   intermediate phenotypic response, also shows an inter-
There was little correlation between genetic distance and                  mediate degree of population structure (FST p 0.54). As-
hypothesis matrices, indicating that genetic variation was                 pidoscelis inornata, the species with the weakest phenotypic
not partitioned corresponding to habitat boundaries.                       response at the ecotone, is nearly panmictic across the

Figure 5: Maximum likelihood reconstructions of historical relationships within species with individuals as operational taxonomic units. Colored
bars indicate the habitat from which animals were collected: black, white, and gray bars represent dark soil, white sand, and ecotonal habitats,
respectively. Population letter designations refer to the locality map in figure 1. Support levels are indicated only for major nodes with bootstrap
support above 50.
12 The American Naturalist
Table 3: Correlation coefficients and P values for matrix between dark soil and white sand populations were in-
correspondence tests (MCTs) ferred for S. undulatus, indicating that ongoing gene flow
Species and matrix may still connect populations with divergent color mor-
correspondence comparison Correlation P phologies. No signature of population expansion was de-
Holbrookia maculata: tected for this species. In A. inornata, extremely low levels
Phenotype ⫹ hypothesis given of genetic structure can best be explained by recent col-
genotype .539 .007* onization of the white sand region. In this species, a strong
Phenotype ⫹ hypothesis .518 .013* pattern of population expansion was observed, and mi-
Genotype ⫹ hypothesis .078 .355 gration rates were not significantly different from 0. Al-
Phenotype ⫹ genotype .426 .031 though patterns of population differentiation as inferred
Sceloporus undulatus:
from mitochondrial DNA provide a biologically mean-
Phenotype ⫹ hypothesis given
genotype .780 .002*
ingful comparison among species, additional data are nec-
Phenotype ⫹ hypothesis .720 .008* essary to better estimate current and historical levels of
Genotype ⫹ hypothesis .000 .182 gene flow among populations. Other studies have shown
Phenotype ⫹ genotype .074 .355 that nuclear and mitochondrial markers can yield sub-
Aspidoscelis inornata: stantially different estimates for demographic parameters
Phenotype ⫹ hypothesis given (see, e.g., Hey and Nielsen 2004). Particularly for model-
genotype .916 !.001* based analyses, results inferred from a single marker often
Phenotype ⫹ hypothesis .860 .002* have broad confidence intervals and may not lead to robust
Genotype ⫹ hypothesis .291 .224 reconstructions of population history. Future work in this
Phenotype ⫹ genotype .087 .358 system will use multilocus nuclear data to further explore
Note: Results from partial MCTs appear in bold, with results from the underlying processes responsible for observed patterns
pairwise MCTs below. Data matrices are provided in fig. B1 and include of genetic variation.
pairwise population comparisons of phenotypic distance (linear dis-
tance along PC1), genetic distance (linearized FST), and hypothesized
Whether levels of genetic isolation are explained by cur-
divergence (based on habitat similarity). rent or historical interaction among populations, patterns
* Significant results after Bonferroni correction for multiple observed strongly support the prediction of divergence-
comparisons. with-gene-flow models that phenotypic differentiation
should increase with genetic isolation between habitats
Tularosa Basin (FST p 0.09). Inferences about population (table 4). In the White Sands system, the species exhibiting
structure were not driven by differences among species in reduced genetic exchange across the ecotone, H. maculata,
sampling distance between white sand and dark soil pop- does show greater phenotypic divergence between white
ulations; the rank order of FST was identical even when sand and dark soil forms. The two species for which recent
dark soil populations collected adjacent to the dunes were genetic contact between divergent morphs was inferred, S.
excluded for S. undulatus and A. inornata. undulatus and A. inornata, exhibit decreased substrate
Because FST may be affected by dispersal rate and dis- matching on the gypsum dunes. Species differences in col-
persal history, genetic similarity may result from ongoing oration at the ecotone are also strongly correlated with
migration or recent common ancestry (i.e., population patterns of gene flow. The light color of ecotonal animals
expansion). Coalescent analyses indicate that differences in H. maculata is commensurate with high levels of gene
in population structure among species reflect underlying flow between ecotone and white sand populations and low
differences in both colonization history and ongoing gene levels of genetic connectivity between ecotone and dark
flow. In H. maculata, extremely high levels of genetic struc- soil populations. The intermediate color of ecotonal in-
ture can be explained by fairly stable, isolated populations dividuals in S. undulatus is consistent with indications that
through time. Phylogenetic breaks are consistent with gene flow may occur in both directions across the ecotone
landscape features in this species, indicating a strong geo- for this species. Finally, the dark color of ecotonal pop-
graphic signal to the partitioning of genetic variance. In ulations in A. inornata may reflect the recent expansion
addition, no signatures of ongoing gene flow or population of dark soil populations into white sand habitat. Obser-
size change were recovered for H. maculata. Reduced con- vations are thus consistent with divergence-with-gene-flow
tact across the White Sands ecotone for H. maculata may models and suggest dispersal as a fundamental parameter
therefore be due to lower intrinsic dispersal ability or a in understanding phenotypic patterns across ecological
more patchy spatial distribution of populations. For S. transition zones.
undulatus, intermediate levels of population structure can Although differences in population connectivity across
be explained by retained ancestral polymorphism and the White Sands ecotone are sufficient to explain the var-
likely ongoing gene flow. Moderate levels of migration iation in phenotypic response among species, several al-Convergent Evolution and Divergent Selection 13
Table 4: Support for divergence-with-gene-flow models: phenotypic divergence at White Sands scales with genetic isolation
Holbrookia maculata Sceloporus undulatus Aspidoscelis inornata
Phenotypic response
across the ecotone Strong: white sand populations Moderate: white sand popula- Weak: white sand populations
highly substrate matched; tions moderately substrate moderately substrate
ecotonal populations indistin- matched; ecotonal popula- matched; ecotonal popula-
guishable from white sand tions intermediate between tions indistinguishable from
populations white sand and dark soil dark soil populations
populations
Genetic isolation
among populations Strong: high levels of popula- Moderate: moderate levels of Weak: low levels of population
tion structure (FST p .82); population structure (FST p structure (FST p .09); strong
no evidence of population .54); no evidence of popula- evidence of population ex-
size changes or ongoing gene tion size changes but data pansion but not of ongoing
flow suggest ongoing gene flow gene flow
ternative explanations must be considered. First, popu- variation remains the strongest current explanation for
lations of H. maculata could be more highly adapted to observed patterns.
the white sand environment if natural selection is stronger
on this species for ecological reasons, such as foraging
mode or microhabitat association. A previous study com- Convergent Evolution and Ecologically
paring activity patterns between H. maculata and S. un- Mediated Divergence
dulatus at White Sands found that H. maculata spent more Hypothesis-driven tests reveal the importance of ecological
time in open areas and was less closely associated with factors in shaping phenotypic diversity at the White Sands
vegetation than S. undulatus (Hager 2001a). Quantitative ecotone. Data support the predicted relationship between
data on microhabitat association are not currently avail- dorsal color and substrate color: phenotypic divergence
able for A. inornata, but this species is found both under increases with habitat dissimilarity for all species. More-
vegetation and in more open areas (Degenhardt et al. over, patterns of dorsal coloration are better explained by
1996). Therefore, it is plausible that H. maculata is more habitat variation than by genetic variation. Both MCTs
visible to predators and that selection pressure for sub- and phylogenetic analyses indicate that color variation can-
strate matching is higher in this species. Second, inter- not be explained by neutral processes alone and under-
mediately colored S. undulatus could be locally adapted to score the importance of divergent selection in shaping
the intermediate substrate color at the margin of the dune phenotypic patterns for lizards at White Sands.
field. However, in contrast to the large expanse of pure The strong signal of ecologically mediated divergence
gypsum habitat, the band of intermediately colored eco- at White Sands is particularly compelling given the adap-
tonal substrate is extremely narrow, often only meters tive and historical differences observed among species. The
wide. Given the likelihood of gene flow across the ecotone three species vary in the strength of their phenotypic re-
in this species and the restricted area of the ecotone, nat- sponse to selection and in their demographic histories
ural selection would need to be implausibly strong to pro- (table 4). Convergence of blanched coloration in the entire
vide an adaptive explanation for maintenance of inter- guild of lizards at White Sands suggests that natural se-
mediate color morphs. Third, the three species may show lection is sufficiently strong to produce a concordant pat-
different responses to selection if genetic or developmental tern among species despite species-specific idiosyncrasies
constraints limit the potential for S. undulatus or A. in- in population structure, historical demography, and ecol-
ornata to obtain the dramatically blanched coloration of ogy. The strength of natural selection at White Sands is
H. maculata. However, candidate gene studies have iden- also suggested by the conspicuous absence of ecologically
tified a single gene of large effect associated with color similar species from the dunes. A more diverse lizard as-
variation in White Sands populations of A. inornata (Ro- semblage is found in dark soil habitats adjacent to White
senblum et al. 2004). Therefore, predictions based on ge- Sands, but only three species, all with blanched coloration,
netic architecture would suggest that potential response to inhabit the gypsum environment.
selection in A. inornata would be high, not low. Although The results from this study reinforce a growing body of
further study is necessary to reject these alternatives, the evidence for the importance of ecologically mediated di-
relationship between population structure and phenotypic vergence (see, e.g., Kingsolver et al. 2001; Schluter 2001;14 The American Naturalist
Rieseberg et al. 2002). Although patterns observed in Dixon, J. R., and P. A. Medica. 1966. Summer food of four species
White Sands lizards suggest the action of strong divergent of lizards from the vicinity of White Sands, New Mexico. Los
Angeles County Museum Contributions in Science 121:1–6.
selection, they also underscore the importance of gene flow
Doebeli, M., and U. Dieckmann. 2003. Speciation along environ-
in modulating this response. Empirical studies of com- mental gradients. Nature 421:259–264.
munity assemblages provide a powerful tool for extending Ellingson, J. M., L. J. Fleishman, and E. R. Loew. 1995. Visual pig-
our understanding of the role of adaptive evolution in ments and spectral sensitivity of the diurnal gecko Gonatodes al-
shaping the phenotypic diversity observed in natural bogularis. Journal of Comparative Physiology A 177:559–567.
populations. Endler, J. A. 1977. Geographic variation, speciation, and clines.
Princeton University Press, Princeton, NJ.
———. 1990. On the measurement and classification of colour in
Acknowledgments studies of animal colour patterns. Biological Journal of the Linnean
I thank White Sands National Monument, White Sands Society 41:315–352.
Missile Range, Jornada Long-Term Ecological Research Fleishman, L. J., M. Bowman, D. Saunders, W. E. Miller, M. J. Rury,
and E. R. Loew. 1997. The visual ecology of Puerto Rican anoline
Station, the New Mexico Department of Game and Fish,
lizards: habitat light and spectral sensitivity. Journal of Compar-
and the University of California Animal Care and Use ative Physiology A 181:446–460.
Committee (R093-0205) for permits. Logistical support Forsman, A. 1995. Heating rates and body temperature variation in
from J. Anderson, D. Burkett, B. Conrod, E. Garcia, S. melanistic and zigzag Vipera berus: does colour make a difference?
Hager, and D. Taylor-Glass was greatly appreciated. Special Annales Zoologici Fennici 32:365–374.
thanks to D. Burkett for ongoing discussion about Tularosa Greenberg, A. J., J. R. Moran, J. A. Coyne, and C.-I. Wu. 2003.
Basin lizards and several crucial samples. Valuable assis- Ecological adaptation during incipient speciation revealed by pre-
cise gene replacement. Science 302:1754–1757.
tance in the field was provided by D. Betz, C. Colvin, M.
Grill, C. P., and V. N. Rush. 2000. Analysing spectral data: comparison
Kiparsky, J. Krenz, and J. Parra. I thank J. Storz for dis- and application of two techniques. Biological Journal of the Lin-
cussion on analyses and C. Moritz, J. Storz, and D. Wake nean Society 69:121–138.
for comments on the manuscript. Support for this work Hager, S. B. 2000. Variation in body temperature and thermoregu-
was provided to E.B.R. by the National Science Founda- latory behavior between two populations of the lesser earless lizard,
tion, the American Museum of Natural History, and the Holbrookia maculata. Contemporary Herpetology, no. 1. http://
Society of Systematic Biologists. www.cnah.org/ch/ch/2000/1/index.htm.
———. 2001a. Microhabitat use and activity patterns of Holbrookia
maculata and Sceloporus undulatus at White Sands National Mon-
Literature Cited ument, New Mexico. Journal of Herpetology 35:326–330.
Arevalo, E., S. K. Davis, and J. W. Sites Jr. 1994. Mitochondrial DNA ———. 2001b. Quantification of body coloration for the lesser ear-
sequence divergence and phylogenetic relationships among eight less lizard, Holbrookia maculata: evidence for interpopulational
chromosome races of the Sceloporus grammicus complex (Phry- differences. Southwestern Naturalist 47:229–307.
nosomatidae) in central Mexico. Systematic Biology 43:387–418. Hey, J., and R. Nielsen. 2004. Multilocus methods for estimating
Bennett, A. T. D., and I. C. Cuthill. 1994. Ultraviolet vision in birds: population sizes, migration rates and divergence time, with ap-
what is its function? Vision Research 34:1471–1478. plications to the divergence of Drosophila pseudoobscura and D.
Benson, S. B. 1933. Concealing coloration among some desert rodents persimilis. Genetics 167:747–760.
of the southwestern United States. University of California Jones, S. M., and D. L. Droge. 1980. Home range size and spatial
Publications in Zoology 40:1–20. distributions of two sympatric lizard species Sceloporus undulatus
Bundy, R. E. 1955. Color variation in two species of lizards (Phry- and Holbrookia maculata in the sand hills of Nebraska, USA. Her-
nosoma modestum and Holbrookia maculata subspecies). PhD diss. petologica 36:127–132
University of Wisconsin, Madison. Kaufman, D. W. 1973. Shrike prey selection: color or conspicuous-
Castellano, S., and E. Balletto. 2002. Is the partial Mantel test in- ness? Auk 90:204–206.
adequate? Evolution 56:1871–1873. Kiltie, R. A. 1992. Tests of hypotheses on predation as a factor main-
Cuthill, I. C., A. T. D. Bennett, J. C. Partridge, and E. J. Maier. 1999. taining polymorphic melanism in coastal-plain fox squirrels Sci-
Plumage reflectance and the objective assessment of avian sexual urus niger L. Biological Journal of the Linnean Society 45:17–38.
dichromatism. American Naturalist 153:183–200. Kingsolver, J. G., H. E. Hoekstra, J. M. Hoekstra, D. Berrigan, S. N.
Degenhardt, W. G., C. W. Painter, and A. H. Price. 1996. Amphibians Vignieri, C. E. Hill, A. Hoang, P. Gibert, and P. Beerli. 2001. The
and reptiles of New Mexico. University of New Mexico Press, strength of phenotypic selection in natural populations. American
Albuquerque. Naturalist 157:245–261.
Dice, L. R. 1947. Effectiveness of selection by owls of deer mice Kirkpatrick, M., and N. H. Barton. 1997. Evolution of a species’
(Peromyscus maniculatus) which contrast in color with their back- range. American Naturalist 150:1–23.
ground. Contributions from the Laboratory of Vertebrate Biology Kuhner, M. K., J. Yamoto, and J. Felsenstein. 1998. Maximum like-
of the University of Michigan 34:1–20. lihood estimation of population growth rates based on the coa-
Dixon, J. R. 1967. Aspects of the biology of the lizards of the White lescent. Genetics 149:429–434.
Sands, New Mexico. Los Angeles County Museum Contributions Lenormand, T. 2002. Gene flow and the limits to natural selection.
in Science 129:1–22. Trends in Ecology & Evolution 17:183–189.You can also read