Historical Lynchings and Contemporary Voting Behavior of Blacks
←
→
Page content transcription
If your browser does not render page correctly, please read the page content below
Historical Lynchings and Contemporary Voting
                       Behavior of Blacks
                                               Jhacova Williams∗
                                          Louisiana State University
                                               jwil426@lsu.edu

                                                   Abstract
       Cultural beliefs of a group, shaped by historical events, can impact a variety of behaviors of
       future generations with economic implications ranging from labor force participation to polit-
       ical activity. I analyze the extent to which the political participation of blacks can be traced
       to historical lynchings that took place between 1882 and 1930 in the same counties. Using
       county-level voter registration data, I show that southern counties that experienced a higher
       number of historical lynchings have lower voter registration rates of blacks today. This rela-
       tionship holds after accounting for a variety of historical and contemporary characteristics of
       counties and strengthen when lynchings are instrumented with historical measures of environ-
       mental suitability for growing cotton. Examining individual-level data shows that blacks who
       reside in counties with more historical lynchings are less likely to vote compared to their white
       counterparts. Lynchings have no impact on voting differences between other minority groups
       and whites.

   ∗
     Many thanks to Naci Mocan, Louis-Philippe Beland, Chris Foote, Falk Brauning, Osborne Jackson, Geoffrey
Tootell, Ross Hallren, Tamara Gurevich, Gary Hoover, Gregory Price, and seminar participants of the Southern Eco-
nomic Association Conference in Washington D.C., the Federal Reserve Bank of Boston, and the United States Inter-
national Trade Commission for useful comments and discussions.

                                                       1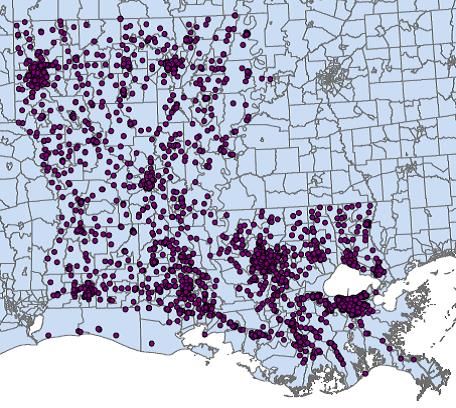
“A lynching is much more than just a murder. A murder may occur in private. A lynching is a public

spectacle; it demands an audience...A lynching is a majority’s way of telling a minority population that the

law cannot protect it.”

- Aatish Taseer, Anatomy of a Lynching (2017)

1        Introduction
        Lynchings, the killings of individuals by a group of people who ignore due process and take the law

into its own hands (Price et al. 2008), were prevalent in the American South for centuries. This form of

vigilantism reached its peak in the 1890’s following the enactment of the 13th, 14th, and 15th Amendments

to the U.S. Constitution to prevent blacks from exercising their new freedoms to work and vote (DeFina and

Hannon 2011; Price et al. 2008).1 Despite explanations of norm-based voting (DellaVigna et al. 2017) and

existing empirical evidence of habit-formation in voting (Gerber 2003; Fujiwara et al. 2016), little research

has been done to examine whether these violent events of the past continue to influence the voting behavior

of blacks.2

        In this paper, I examine whether there exists a link between historical lynchings and the contemporary

voting behavior of blacks. Considering that historical lynchings were aimed at preventing blacks from vot-

ing (Cook et al. 2017; Dickerson 2003), the emergence of cultural norms about the “right” thing to do to

protect their well-being may have caused blacks to avoid voting and these norms may have been transmitted

to subsequent generations.

        To investigate whether lynchings have had a long-run impact on the voting behavior of blacks, I com-

bine county-level lynching data with contemporary voter registration data. After accounting for a variety of
    1
      The 13th Amendment abolished slavery, except for individuals convicted of a crime, in 1865. The 14th Amend-
ment granted citizen rights to all persons born or naturalized in the U.S. in 1868. The 15th Amendment prohibited
individuals be denied the right to vote based on race in 1870. According to Beck and Tolnay (1992) and Cook et al.
(2017), lynchings were used to control the black labor force by instilling fear in blacks who could potentially compete
for jobs against whites. Additionally, Hagen et al. (2009) find that lynchings were used by southern whites to vent
economic frustration with inflation or decreases in cotton prices. Cook et al. (2017), Price et al. (2009) and Tolnay and
Beck (1995) state that lynchings were used to maintain the social hierarchy that existed antebellum between blacks and
whites. Cook et al. (2017) and Price et al. (2009) have employed the use of Blalock’s (1967) power threat hypothesis,
to argue that lynchings were used to protect the political resources of whites and to prevent blacks from contesting
whites’ political authority.
    2
      DellaVigna et al. (2017) find that individuals are motivated to vote due to the social image received from family
and friends. Gerber (2003) and Fujiwara et al. (2016) show that voting is a habitual act based on previous voting
conditions and experiences.

                                                           2
historical and contemporary characteristics of counties, the results show that blacks who reside in counties

that were exposed to a relatively higher number of lynchings from 1882 to 1930 have lower voter registra-

tion rates today.3 Motivated by the possibility that this negative relationship may be due to Republican party

dominance in southern states, high incarceration rates of blacks, the paucity of polling places in counties,

and institutional structures that remained after slavery, the analysis includes an additional specification that

accounts for these potential mechanisms. The results remain virtually unchanged after the inclusion of these

potential cofounders.

       An alternative explanation for the relationship between historical lynchings and the voting behavior of

blacks is that geographic sorting during the Great Migration may have caused blacks with higher voting

propensities to migrate away from violent southern areas while blacks who were less likely to participate

in voting remained. Using data from the 1940 100% IPUMS-USA, I examine whether black migrants out

of (and into) southern counties with higher lynching rates differ from individuals who did not migrate from

these counties. I find no evidence of geographic sorting as a function of lynching rates which suggests that

the relationship between lynchings and voting behavior of blacks is not explained by sorting.

       Alternatively, counties with a relatively higher number of historical lynchings may have contemporary

barriers that suppress the voting of blacks. For example, if counties that experienced more historical lynch-

ings also have fewer polling places in areas where blacks live today, then the results may be an artifact of this

phenomenon. To understand whether the paucity of polling places in black areas explains the relationship

between lynchings and the voting behavior of blacks, I use data on polling locations.4 I find no evidence that

counties with a relatively higher number of historical lynchings have fewer polling places in areas where

blacks reside.

       To address the concern that the estimates may be biased by measurement error or omitted variables, I

employ instrumental variables. Using geo-climatic suitability data from Acharya et al. (2016), as originally

obtained from the Food and Agriculture Organization (FAO), I use historical measures for the environmental

suitability of growing cotton as an instrument for lynchings. In addition to suppressing voting among blacks

in the past, lynchings were used to vent economic frustration (Cook et al. 2017; Hagen et al. 2009). Acharya

et al. (2016) find that counties that were more heavily engaged in slavery experienced more lynchings. Given
   3
    These results are robust to different measures of lynchings. See Appendix B for results.
   4
    Polling locations are obtained from the Secretary of State Offices in 2017 and reflect polling place locations in the
2016 Presidential Election.

                                                           3
that in 1840, cotton harvested by slaves generated more revenue than all other US exports combined (The
United States National Park Service Southeast Regional Office 2011), measures of cotton suitability should
be correlated with lynchings yet uncorrelated with unobservables that affect the contemporary voting behav-
ior of blacks. The instrumental variables estimates support the OLS estimates in that blacks who currently
reside in counties that were exposed to a relatively higher number of lynchings have lower voter registration
rates. Moreover, the instrumental variables estimates are larger in magnitude than the OLS estimates.
Considering that lynchings were aimed at preventing blacks from voting in the past, the findings indicate
that the historical lynching environment created voting norms among blacks that persists today. However,
this finding is consistent with other interpretations. For example, if historical lynchings were the by-product
of a distaste for blacks which also resulted in discriminatory practices towards blacks, then the negative
relationship between lynchings and contemporary voting may the result of this effect. To examine the rela-
tionship between lynchings and contemporary voting further, I perform a number of falsification exercises
using the same instrumental variable strategy. First, I examine whether lynchings impact additional contem-
porary outcomes of blacks, such as earnings and education. If there exists a relationship between lynchings
and these outcomes, then this would suggest that lynchings are proxies for discrimination rather then the
persistence of cultural voting norms among blacks. The results show that there is no significant relation-
ship between lynchings and earnings or lynching and levels of education of blacks. Second, I estimate the
relationship between lynchings and the contemporary voting behavior of whites. Given that blacks were
disproportionately lynched, lynchings should not affect the contemporary voting behavior of whites. The
estimates obtained from this exercise are close to zero and statistically insignificant. Finally, I conduct a
placebo exercise and randomly distribute lynching rates across counties and instrument these lynching rates
with measures of cotton suitability. The distribution of the 500 estimates obtained from this exercise shows
that they are statistically insignificant indicating that there does not exist a significant relationship between
lynchings and voter registration among blacks when lynching rates are randomly distributed across coun-
ties.
After establishing that historical lynchings adversely affect the voting behavior of blacks today, I ex-
amine whether this relationship can be mitigated. For example, Tate (1991) found that blacks with higher
income, more education, and stronger social ties to the black community were more likely to participate in
voting. To investigate this, I interact lynching rates with county-level measures of earnings, education, and
4the black church rate.5 The results show that earnings and the black church rate do not change the relation-
ship between lynchings and voting. However, the relationship between lynchings and voting behavior of
blacks is mitigated by higher levels of education of blacks.
The final exercise of this paper uses instrumental variables to examine the individual-level voting behav-
ior of blacks and whites. The individual-level voting data are obtained from the Current Population Survey
(CPS) Voting and Registration Supplement. Using county and state identifiers of respondents, I assign each
respondent a historical lynching rate based on his or her current residence. As done previously, lynching
rates are instrumented with historical measures of cotton suitability. After accounting for individual-level
characteristics and contemporary county-level controls, the results show that blacks who currently reside in
counties that were exposed to a relatively higher number of lynchings are less likely to vote in an election
compared to their white counterparts who live in the same county.6 To test whether similar differences in
voting behavior exist in groups that were not directly affected by lynchings, I examine the impact of his-
torical lynchings on voting differences between other minority groups and whites.7 The minority groups
included are foreign-born blacks, Native Americans, Asians, and Hispanics. The estimates obtained from
this exercise show that there does not exist a significant difference in voting between individuals belonging
to minority groups and whites for higher rates of lynchings. This indicates that historical lynchings neg-
atively affect voting differences between blacks and whites but does not affect voting differences between
other minorities and whites.
There are two main contributions of this paper. First, it adds to recent findings in economics by helping
us understand how an initial shock that alters behavior can have a persistent impact (Acemoglu et al. 2012;
Acharya et al. 2016; Nunn and Wantchekon 2011; Voigtlnder and Voth 2012). Second, the paper increases
our understanding of the determinants of voting by measuring the extent to which a violent event, aimed at
preventing voting, can deter the target group from voting in the future.
This paper is organized as follows. Section 2 describes voting trends in the United States. Section
3 provides the historical background and conceptual framework. The empirical framework, presented in
Section 4, is used to motivate the empirical analysis to follow. The data description is given in Section 5.
5
The black church rate is the number of blacks churches per black population in 2010.
6
The analysis compares blacks eligible to vote in US elections with whites eligible to vote in US elections. The
analysis does not use historical county-level data due to the decrease in sample size.
7
Blacks were disproportionately lynched compared to other groups. Nearly 90% of the victims of lynchings were
black.
5Section 6 presents the OLS and IV results as well as well as the falsification exercises. Section 7 shows the
heterogeneity results and Section 8 presents the individual-level results. Section 9 concludes.
2 Voting Trends
Figure 1 displays self-reported voter turnout in U.S. elections for blacks and whites from the CPS.8
While there exists a large and persistent voting gap between races in Presidential Elections in the earlier half
of the sample period, turnout among blacks begins an upward trend in the 1992 election and becomes nearly
equal to the turnout of whites in the 2012 election. In Midterm Elections, blacks have lower turnout when
compared to whites throughout the entire sample period.
Similarly, Figure 2 depicts self-reported registration rates for blacks and whites as obtained from the
CPS. In both Presidential and Midterm Elections, the gap between black and white registration rates is
persistent and stable across years.9 Taken together, Figures 1 and 2 show that blacks have lower self-
reported turnout and registration rates when compared to whites although, with the exception of the 2016
election, turnout rates of blacks was nearly equal to that of whites after 2008.
Turning the focus to voting behavior of blacks based on area of residence, Figure 3 displays turnout and
registration rates in Presidential Elections for blacks who reside in the south compared to blacks who reside
elsewhere in the country as obtained from the CPS.10 This figure shows lower voter turnout among blacks
who reside in the south compared to blacks who reside elsewhere throughout the 1980’s with rates that are
roughly the same beginning in the early 1990’s. Yet Figure 3 displays similar registration rates between
both groups throughout the 1980’s with registration rates of southern blacks surpassing rates of blacks who
reside elsewhere 1990 onward.
Considering that historical lynching were aimed at preventing blacks from voting in the past and a vast
majority of lynchings took place in the south, Figure 4 examines the voting and registration behavior of
8
Voter turnout is defined as the percentage of individuals who reported having voted in an election per voting age
population. Voting data by race are available in 1964 onward from the CPS. In 1978, the CPS began separating white
into two categories: white and white non-Hispanic. Since the analysis to follow will compare voting measures of
blacks and whites of European descent, Figure 1 begins in 1978 rather than 1964.
9
Due to the stable nature of registration rates as seen in figure 2, registration rates will be the preferred measure of
voting in the analysis to follow.
10
Southern states include Alabama, Arkansas, Delaware, Washington DC, Florida, Georgia, Louisiana, Kentucky,
Maryland, Mississippi, North Carolina, Oklahoma, South Carolina, Tennessee, Texas, Virgina, West Virgina.
6blacks who reside in the south as a function of lynching rates. It is worth noting that the registration data
used in the right panel of Figure 4 come from the Secretary of State Offices which are available from 2000
onward. For comparison purposes, the left panel of Figure 4 depicts voter turnout among blacks in southern
counties from the CPS from 2000 onward. Figure 4 shows that current voting and registration of blacks is
lower in counties that had historically high lynching rates when compared to counties that had historically
low lynching rates. This gap in voting is large and persistent in the 2000 - 2012 Presidential Elections.
Figure 4 suggests that voting behavior is lower for blacks who reside in counties that were exposed to a
relatively higher number of lynchings and motivates the empirical analysis to follow.
3 Historical Background and Conceptual Framework
3.1 Historical Background
Lynchings, a form of vigilante justice where a group of people ignore due process and takes the law
into its own hands (Price et al. 2008), began to rise postbellum to remind blacks of their inferior status and
to prevent them from exercising their new freedom to work and vote (DeFina and Hannon 2011). Three
theories have been proposed to explain lynching behavior. The first theory hypothesizes that blacks were
lynched because they were seen as an economic threat (Beck and Tolnay 1992; Cook et al. 2017). By
lynching blacks, whites vented economic frustration due to inflation or decreases in cotton prices (DeFina
and Hannon 2011) and instilled fear in blacks who could compete for jobs (Cook et al. 2017). The second
theory hypothesizes that blacks were lynched because they were viewed as a social threat (Cook et al. 2017
and Price et al. 2009). Cook et al. (2017) state that whites feared losing their social status to blacks and used
lynching as a way of maintaining social order. The third theory, Blalock’s (1967) power threat hypothesis,
proposed that violence arouse when the dominant group perceived the subordinate group contested their
political authority (Price et al. 2008).
Many lynchings were carried out by members of the Ku Klux Klan (KKK), a group initially created
as a social club by former Confederate Generals that quickly changed to a group whose mission was to
avenge the defeated Democratic Party (Dickerson 2003; Lester 1884). Following the enactment of the
15th Amendment to the U.S. Constitution, which granted newly freed black men the right to vote, blacks
7voted for white Republican politicians who filled seats once held by Democrats. Additionally, blacks began
holding political offices. For example, during the Reconstruction Era, in South Carolina, blacks comprised
the majority of the state’s legislature and over 2000 blacks held some type of public office throughout
the United States (Poverty and the Government in America: A Historical Encyclopedia 2009; History.com
2016). This change in southern politics along with blacks being compensated for their labor created a hostile
environment in the former Confederacy where whites felt threatened by blacks’ new freedom (Price et al.
2008; Cook 2017).
Violence from the KKK in the form of beatings, burnings, and lynchings were used to prevent blacks
from exercising their new freedom to work and vote (DeFina and Hannon 2011). During the Presidential
campaign season of 1868, KKK members rode around on horses wearing white hoods and robes threatening
blacks that if they did not vote for the Democratic ticket, they would be lynched (Dickerson 2003). In 1868,
the KKK killed more than 2,000 blacks in Louisiana, two South Carolina legislators, and the President of
the Urban League, causing black voter turnout to be reduced by 20 percent between the 1867 and the 1868
election (Dickerson 2003).11 These KKK terrorists’ acts helped the south regain Democratic control in the
statehouse in 1870 (Dickerson 2003). DeFina and Hannon (2011) quote Senator Benjamin Tillman of South
Carolina in 1900 discussing the disenfranchisement of blacks:
“We did not disfranchise the negroes until 1895. Then we had a constitutional convention convened
which took the matter up calmly, deliberately, and avowedly with the purpose of disfranchising as
many of them as we could under the fourteenth and fifteenth amendments. We adopted the educational
qualification as the only means left to us, and the negro is as contented and as prosperous and as well
protected in South Carolina to-day as in any State of the Union south of the Potomac. He is not
meddling with politics, for he found that the more he meddled with them the worse off he got. As to
his rights - I will not discuss them now. We of the South have never recognized the right of the negro
to govern white men, and we never will. We have never believed him to be equal to the white man,
and we will not submit to his gratifying his lust on our wives and daughters without lynching him.”
According to Allen et al. (2000), blacks were aware of lynchings that took place by the depiction of lynch-
ings in newspapers and on postcards.
11
The Urban League was an organization that helped blacks register to vote and was headed by northern Republi-
cans.
8Figure 5a presents a county-level mapping of the total number of lynchings between 1882 and 1930
and shows that some counties experienced as many as 35 lynchings during this time period with variation
across counties and states.12 Figure 5b presents the total number of lynchings normalized by the total black
population in 1900.
3.2 Conceptual Framework
The foundational model of voting was developed by Downs (1957) where individuals vote when the
benefit of voting exceeds the cost. Benefit is the probability that an individual’s vote will make a difference
in the outcome of an election times the utility received from the individual’s favorite candidate winning the
election; and the payoff an individual receives from exercising his social duty. Recent models have expanded
Downs’ (1957) framework of voting costs to include logistical cost and information cost (Ashworth 2011;
Charles and Stephens 2011; Matswaka 1995). The logistical cost of voting is the cost associated with the
act of voting (i.e. traveling to the poll, waiting in line, etc.) and the information cost of voting is the
cost associated with having limited information regarding a candidate or an election (Charles and Stephens
2011).
Within this framework, the historical lynching environment raised the cost of voting for blacks because
gathering information on elections as well as traveling to election polls could lead to death for many blacks.
Figure 6 demonstrates that lynchings were powerful messages sent to thousands of blacks that exercising
their right to vote would be met with death (Fryer and Levitt 2012). Considering that cultural beliefs are
viewed as decision-making heuristics or “rules-of-thumb” which are optimal when information acquisition
is either costly or imperfect (Alesina et al. 2013; Nunn and Wantchekon 2011), general beliefs about the
“right” action caused blacks to refrain from voting - thus allowing blacks to save on the cost associated with
voting. Within this environment, cultural beliefs about voting were beneficial to blacks and lowered their
voting behavior patterns. I hypothesize that these cultural voting norms persisted and were transmitted to
subsequent generations.
A natural question is why would one expect lower voter participation among blacks to persist more than
100 years after the historical lynching time period. One explanation can be found in the cultural economics
12
A map of lynchings is presented for county state pairs that have voting data separated by race namely Alabama,
Florida, Georgia, Louisiana, North Carolina, and South Carolina.
9literature, which demonstrates that historic events have long-run impacts by permanently affecting culture or
norms of behavior.13 For example, Nunn and Wantchekon (2011) showed that a culture of mistrust persisted
in individuals whose ancestors were heavily targeted during the slave trade in Africa which continues to
effect economic development in Africa over 400 years later. Mocan and Raschke (2016) analyzed whether
a culture of racist and xenophobic feelings persisted in Germany following World War II, and found that
people who live in states that provided above-median support for the Nazi Party in the 1928 elections have
stronger anti-Semitic feelings today. Similarly, Voigtlaender and Voth (2012) reported a strong positive
relationship between violent attacks on Jews during the Black Death in 1348 and support for the Nazi Party
in 1928, demonstrating a culture of anti-Semitic views that have persisted more than 500 years. Furthermore,
Acharya et al. (2016) showed that political attitudes could be traced to slavery’s prevalence over 150 years
ago. Specifically, these authors report that white southerners who currently reside in counties that have a
higher share of slaves in 1860 were also less likely to identify as Democrats, less likely to support Affirmative
Action and have higher levels of racial resentment towards blacks. Taken together, research in cultural
economics has shown that cultural beliefs are sticky and are transmitted across generations (Alesina et al.
2013).
A second explanation for persistence can be found in the voting literature. Research has shown that
voting is habit forming in that voting in one election increases an individual’s propensity to vote in future
elections. Gerber et al. (2003) used a randomized field experiment that randomly assigned individuals to
treatment and control groups to isolate the causal role in voting. Individuals in the treatment group were
encouraged to vote via mail or via face to face campaigning whereas individuals in the control group were
not encouraged to vote. These authors found that this randomized change produced an increase in voting in
the upcoming election and increased the likelihood of voting in the future. Fujiwara et al. (2016) also showed
that voting is habit-forming by empirically disentangling habit formation in voting from other channels of
voter persistence. These authors model rainfall, an unexpected and transitory shock, into the cost of voting
and find that rainfall on election day decreases voter turnout in the current and future elections.
13
For a more detailed discussion, see Nunn (2009).
104 Empirical Framework
To estimate the relationship between historical lynchings and the contemporary voting behavior of
blacks, the baseline equation uses county-level voting registration data from the Secretary of State Offices
in Alabama, Florida, Georgia, Louisiana, North Carolina, and South Carolina.14 I estimate the following
equation:
H C C
voter registration ratecst = β0 + β1 lynching ratecs + β2 Xcs + β3 Xcs + β4 Xcst + δs + γt + cst (1)
where c indexes counties, s indexes states, and t indexes years; voter registration ratecst is the percentage
of black registered voters per black voting-age population; lynching ratecs is the total number of lynch-
H represents the vector of observed
ings between 1882 and 1930 per 100,000 black population in 1900. Xcs
historical county characteristics that vary across counties, namely the proportion of black illiterate men of
voting age, the proportion of individuals born in Scotland or Ireland, the average number of newspapers
C represents the vector of
per total population in 1840, and the year in which a county was formed.15 Xcst
observed contemporary county characteristics that vary across county and time, such as the unemployment
C represents the vector of observed contempo-
rate, the crime rate, and the monthly earnings of blacks. Xcs
rary county characteristics that vary across counties which are the proportion of blacks with at least some
college experience, the median age of blacks, and the proportion of married individuals.16 δs is the set of
state fixed effects, γt is the set of year fixed effects, and ct is the error term. Standard errors in Equation
(1) are clustered at the county level. The main coefficient of interest, β1 , estimates the impact of one addi-
tional lynching per 100,000 black population in 1900 on the percentage of black registered voters per black
voting-age population.
County-level measures for four potential mechanisms, namely Republican party dominance, incarcera-
tion rates of blacks, the number of polling places, and the proportion of slaves, are included in an additional
14
These are the only states in the former Confederacy where individuals indicate their race when they register to
vote.
15
Newspaper circulation and the year in which a county was formed are included in the regression since they have
been shown to be a proxy for institutional quality (Grosjean 2014). The proportion of individuals of Scots-Irish descent
is included as a control since it is associated with more homicides by white offenders (Grosjean 2014).
16
The proportion of blacks with at least some college experience, the median age of blacks, and the proportion
married are available for each Decennial Census. I choose the 2000 Census, rather than the 2010 Census, since the
voting registration data come from before 2010, with the exception of the 2012 election.
11specification to Equation (1). Party dominance has been shown to impact voter participation (Redding
2003). Given that many of the states in my sample are Republican states, yet many blacks vote Democratic,
blacks may choose to refrain from voting in these states since they believe that their vote will not be pivotal
in the election. Because blacks have higher incarceration rates when compared to other racial groups and
individuals cannot vote when they are incarcerated, not accounting for incarceration rates may bias the esti-
mates.17 The number of polling places is included to serve as a proxy for accessibility to voting which has
been shown to positively affect voter participation. Considering Acharya et al. (2015) found that slavery
left behind formal and cultural institutions (i.e. black codes, racial violence, Jim Crow, etc.) that made it
difficult for blacks to vote which continue to affect voter turnout of blacks today, I include the proportion of
slaves in 1860 to serve as a proxy for these institutional structures.18 See Data Description for discussion of
Republican party dominance, incarceration rates of blacks, polling places, and the proportion of slaves.
Given that the lynching rate in Equation 1 and some of the county-level characteristics do not vary
across time, I include an additional specification that converts Equation 1 into a cross-section equation. This
is done by averaging each variable in Equation 1 across the years in the sample.
17
In Georgia, Louisiana, North Carolina and South Carolina ex-offenders can register to vote after completion of
their full sentence. In Alabama, ex-offenders can register to vote after completing their full sentence except those
convicted of murder, rape, incest, sexual crimes against children, and treason. In Florida, ex-offenders can register to
vote 5 years after completing their sentence except those convicted of murder, assault, child abuse, drug trafficking,
and arson. Ex-offenders convicted of these crimes can register to vote 7 years after completing their full sentence.
18
Acharya et al. (2015) use county-level data from Catalist, LLC. Catalist provides voting data by merging voter
registration files with state voter turnout data and commercial databases. Because Catalist does not contain demo-
graphic characteristics, the county-level regressions seen in Acharya et al. (2015) do not include social economic
status factors such as education and income, however, the regressions include county-level controls for geography
factors (i.e. latitude, longitude, terrain ruggedness, access to waterways, and county acreage) and economic factors
(i.e. proportion of small farms, land inequality, farm value per capita, and access to railways). Additionally, Acharya
et al. (2015) uses the Cooperative Congressional Election Study (CCES) which reports individual-level self reported
measures of voting. Since the CCES contains a respondent’s characteristics, the individual-level regressions includes
measures of education, income, age, race, and gender.
125 Data Sources and Description
5.1 Lynching Measure
The lynching data are obtained from the Historical American Lynching Data Collection Project (Project
HAL) and include all lynching victims’ records in southern counties from 1882 to 1930.19 For each lynching
record, the information includes the victim’s name, race, gender, and alleged offense. The data set also in-
cludes the county, state, month, day, and year that the lynching occurred. The victim records are aggregated
to the county-level to create a lynching measure that represents the total number of lynchings that occurred
in a county from 1882 to 1930.
I link the aggregated lynching data with population data from the 1900 Census. The 1900 Census popu-
lation data are obtained from the National Historical Geographic Information System (NHGIS) and contain
county-level measures for the black, white, and total population. The lynching and population data are used
to construct the main explanatory variable, lynching rate, which is the total lynchings per 100,000 black
population in 1900.
5.2 County-Level Voting Measure
The voter registration data are obtained from the Secretary of State Offices in Alabama, Florida, Georgia,
Louisiana, North Carolina, and South Carolina.20 Ideally, the sample would include all counties in the
former Confederate States, however, these are the only states in the former Confederacy in which individuals
are asked to identify their race when they register to vote.
The Alabama Secretary of State Office reports the number of black (white) registered voters at the
county-level for active and inactive voters separately on its website in 2000, 2004, 2008, and 2012.21 The
number of black (white) registered voters in Florida in 2016 were obtained from voter statistics files provided
19
Southern counties include counties in Alabama, Arkansas, Florida, Georgia, Kentucky, Louisiana, Mississippi,
North Carolina, South Carolina, and Tennessee.
20
The data for Alabama, Georgia, Louisiana, and South Carolina are obtained for the years 2000, 2004, 2008, and
2012. Voter registration data in North Carolina are obtained in 2004, 2008, and 2012 since North Carolina does not
report race until 2002. The voter registration data in Florida are obtained from its Secretary of State Office in 2016.
The method used for extracting voter registration for the years 2000, 2004, 2008, and 2012 is explained in detail below.
21
The Alabama Secretary of State Office website is http://www.alabamavotes.gov/Voterreg.aspx?m=voters. Inactive
voters are voters who have not voted in four years in their county whereas active voters are voters who are not on the
inactive voters list. I use the number of active black voters as the measure of registered black voters and define the
measure of registered white voters similarly.
13by the Florida Secretary of State Office.22 The Georgia Secretary of State Office reports the number of black
(white) registered voters at the county-level for females and males separately on its website in 2000, 2004,
2008, and 2012.23 The Louisiana Secretary of State Office reports the number of black (white) registered
voters at the parish (county) on its website in 2000, 2004, 2008, and 2012.24 The number of black (white)
registered voters from North Carolina are obtained from voter statistics files provided by the North Carolina
Secretary of State Office in 2004, 2008, and 2012.25 The South Carolina Secretary of State Office reports
the number of white and nonwhite registered voters at the count-level on its website in 2000, 2004, 2008,
and 2012.26
The voter registration data are merged with population data from the Surveillance, Epidemiology, and
End Results Program (SEER) of the National Cancer Institute for the years 2000, 2004, 2008, and 2012.
The SEER data contain county-level population counts by age and race. To focus on individuals who are of
voting age, the data is restricted to population counts for individuals who are 18 or older. The registration and
SEER data are used to construct the outcome measure, voter registration rate, as the county-level percentage
of black registered voters per black voting age population. Similarly, voter registration rate among whites is
measured as the percentage of white registered voters per white voting age population.27
5.3 Historical County Attributes
The primary source for historical measures in this study is the NHGIS which provides Census data
from 1790 to the present. The proportion of black (white) illiterate men of voting age is obtained from
the 1910 Census. The proportion of individuals who were born in Scotland or Ireland is obtained from
22
These files contain individual records that include the registration date, race, birth date and county of residence
of registered voters in 2016. The Florida Secretary of State Office removes individuals who have passed away from
its voter files. To compute the number of registered voters in 2000, I aggregate the number of registered voters with a
registration date on or before 2000 at the county-level. Similarly, the number of registered voters in 2004, 2008, and
2012 is computed.
23
The Georgia Secretary of State Office website is http://sos.ga.gov/index.php/elections. I compute the total number
of black registered voters at the county-level by summing the number of black (white) female and black (white) male
registered voters.
24
The Louisiana Secretary of State Office website is http://www.sos.la.gov/ElectionsAndVotings.
25
These files contain the number of registered voters by county, race, and age. Summing across age groups in each
county for blacks and whites separately gives the number of black and white registered voters.
26
The South Carolina Secretary of State Office webiste is https://www.scvotes.org/data/voter-history.html. The
number of nonwhite registered voters is used to represent the number of black registered voters.
27
Voter registration rate is more than 100% in some counties. The results to follow use voter registration as is. Ap-
pendix B shows the results when voter registration rates are top-coded to 100 and when counties with voter registration
rates that exceeds 100 are removed from the sample.
14the 1870 Census. Information on the number of daily, weekly, and triweekly newspapers in each county is
obtained from the 1840 Census and the newspaper rate is defined as the average number of daily, weekly,
and weekly newspapers per total population in 1840. The year in which a county was formed is obtained
from Grosjean (2014) as originally obtained from the National Association of Counties. The proportion of
slaves is obtained from the 1860 Census is defined as the number of slaves per black population in 1860.
Measures of environmental stability for growing cotton are obtained from Acharya et al. (2016) as
originally obtained from the FAO. Cotton suitability is measured in tons/hectare at the county-level and
indicates the maximum potential cotton yield based on soil, climate, and growing conditions. The earliest
year in which cotton suitability is available for states in the sample is 1961 and hence, as in Acharya et al.
(2016), cotton suitability is defined as the average value from 1961 to 1990.28 The cotton suitability rate is
the measure of cotton suitability per 100,000 black population in 1900.
5.4 Contemporary County Attributes
The county-level proportion of blacks (whites) with at least some college education, the median age of
blacks (whites), and the proportion of individuals who are married are obtained from the 2000 Census. The
county-level unemployment rates as reported in the month of June for the years 2000, 2004, 2008, and 2012
are obtained from the Bureau of Labor Statistics. The county-level monthly earnings for blacks (whites) for
the years 2000, 2004, 2008, and 2012 are obtained from the Census Bureau’s Quarterly Workforce Indicators
(QWI). The crime rate, defined by the number of crimes reported per 100,0000 population is obtained from
the 2000, 2004, 2008, and 2012 Uniform Crime Reporting Program. County-level lagged Republican party
dominance data are obtained from David Leip’s Atlas of US Presidential Elections.29 Party dominance is
defined as the percentage of votes awarded to the Republican Presidential Nominee minus the percentage
of votes awarded to the Democratic Presidential Nominee for the years 1996, 2000, 2004, and 2008.30 For
example, in DeKalb County, if the Republican Presidential Nominee was awarded 58% of the votes and if
the Democratic Presidential Nominee was awarded 42% of the votes in 2000, then the party dominance in
28
Acharya et al. 2016 use this time period since it is expected that changes to the suitability between 1860 and 1960
will be uniform shifts across the entire region as a result of climate change.
29
Lagged party dominance is used so that party dominance will not be correlated with the outcome variable.
30
Redding (2003) finds that voter turnout is lower when one party is dominant since the outcome appears to be
certain argues that party dominance accounts for declines in voter turnout more than race, election laws, or economic
class.
15DeKalb County in 2000 is 16%. The incarceration rate of blacks is obtained from the 2010 Vera Institute of
Justice which reports the number of black individuals in jail per 100,000 county residents. The number of
black churches is obtained from the 2010 U.S. Religion Census.31 The U.S. Religion Census classifies black
churches as churches with the largest historically black denominations.32 . The black church rate is defined
as the number of black churches per 100,000 black population in 2010. The number of polling places is
obtained from the Secretary of State Offices in Alabama, Florida, Georgia, Louisiana, North Carolina, and
South Carolina.33
Table 1 presents the Descriptive Statistics. Although Table 1 shows that the voter registration rate of
blacks is close to that of whites with rates of 74.32% and 75.71% respectively, this phenomenon is a result of
high voter registration rates and voter turnout among blacks in the 2008 and 2012 Presidential Elections.34
While voter registration rates among blacks (whites) exceeds 100% in some counties, the result remains
when these counties are excluded from the sample or when they are top-coded at 100%.35
6 Results
6.1 OLS Estimates
Estimates of Equation 1 are reported in Table 2. The dependent variable is the voter registration rate of
blacks which is defined as the percentage of black registered voters per black voting-age population. Column
(1) reports the results when only state and year fixed-effects are included. Column (2) reports the baseline
results which account for state and year fixed effects as well as historical and contemporary controls. The
baseline results show that for one additional lynching per 100,000 black population in 1900, the percentage
of black registered voters per black voting-age population decreases by 0.034 percentage points and this
result is significant at the 5% level.36 This suggests that blacks who reside in counties that were exposed to
31
Tate (2001) finds that voting propensity is higher for blacks who attend church.
32
The list of blacks churches include the African Methodist Episcopal Church, the African Methodist Episcopal Zion
Church, the Christian Methodist Episcopal Church, the Church of God in Christ, the National Baptist Convention of
America, Inc., the National Baptist Convention, USA, Inc., the National Missionary Baptist Convention, Inc., and the
Progressive National Baptist Convention, Inc.
33
This data are from 2017.
34
The 2008 and 2012 Presidential Elections included the first African American Presidential Nominee, Barack
Obama.
35
See Appendix B for results.
36
It is worth noting that the inclusion of historical controls reduces the sample size.
16a relatively higher number of historical lynchings are less likely to register to vote today.
Motivated by the possibility that this relationship may be explained by additional characteristics of coun-
ties, I examine four potential mechanisms - Republican party dominance, incarceration rate of blacks, the
number of polling places per 100,000 total population in 2010, and the proportion of slaves in 1860. Column
(3) of Table 2 includes a 4-year lag of Republican party dominance.37 Republican party dominance is nega-
tively and significantly associated with voter registration rates of blacks indicating that fewer blacks register
to vote in areas where a larger proportion of residents voted for the Republican nominee in the previous
Presidential Election. Column (4) includes the incarceration rate of blacks into the baseline specification
and shows that the incarceration rate is negatively associated with voter registration rates yet this association
is insignificant. Column (5) includes the number of polling places into the baseline specification. The results
show that the number of polling places is positively and significantly associated with voter registration rates
of blacks indicating that registration rates of blacks are higher in areas with more polling places. Column
(6) accounts for the proportion of slaves in 1860. The proportion of slaves is negatively associated with
voter registration rates of blacks yet this association is insignificant. With each specification in columns (3)-
(6), the main coefficient of interest remains stable and insignificant. The final column of Table 2 presents
the preferred specification which includes potential mechanisms, historical and contemporary controls, year
and state fixed effects. The results show that for one additional lynching per 100,000 black population in
1900, the voter registration rate of blacks decreases by 0.029 percentage points and this result is significant
at the 5% level. In summary, Table 2 shows that there exists a link between historical lynchings and the
contemporary voting behavior of blacks.
Considering that the lynching rate and some of the characteristics of counties do not vary over time, an
additional specification converts Equation 1 into a cross-section. The results are presented in Table A.1 in
Appendix A. Similar to the estimates obtained in Table 2, the cross-section estimates show a negative and
significant relationship between lynching rates and black voter registration rates. Specifically, the results
from the preferred specification show for one additional lynching per 100,000 black population in 1900,
voter registration rates of blacks decrease by 0.033 percentage points.
37
A 4-year lag is included since current measures of Republican party dominance will include current shares of
voters.
176.2 Migration Results
Next, I examine whether these results can be explained by geographic migration. For example, during
the Great Migration, which lasted from 1916 to 1970, millions of blacks migrated away from southern states
to northern and western states in search of better economic and social conditions. If blacks who were more
likely to participate in voting were also more likely to migrate away from violent southern counties, blacks
with lower voting propensities remained.
Following Acharya et al. (2016), I use the 1940 100% sample obtained from the IPUMS-USA. This
sample is unique in that it provides a respondent’s current county of residence as well as the county of
residence five years prior (Acharya et al. 2016) allowing for individuals who migrated from (to) southern
counties to be identified. Once identified, I can test whether migrants’ individual attributes differ from indi-
viduals who remained in southern counties. In order for geographic sorting to explain the results, patterns
of mobility out of (and into) southern counties would need to differ as a function of lynchings.
To examine whether geographic sorting explains the results, I restrict the data to blacks and estimate:
attributesi =γ1 out−migrationi + γ2 lynching rate1935i
+ γ3 (out−migrationi ∗ lynching rate1935i ) (2)
H C
+ γ4 X1935c + γ5 X1935c + δ1935s + ict ,
where attributesi represents a respondent’s wage, age, gender, education level, weeks worked, and rent;
out − migrationi represents whether an individual migrated out of a southern county.38 This regression
also includes historical and contemporary controls based on a respondent’s 1935 county of residence and
his or her 1935 state fixed effects. The main coefficient of interest, γ3 , estimates how differences between
out-migrants and those who did not migrate varies as a function of the lynching rate. Table 3 Panel A shows
the results from Equation (2) and shows that there is no significant difference between “migrants” from
southern counties and “stayers” as a function of the lynching rate for any of the selected attributes.
Table 3 Panel B shows the results for individuals who migrated into southern counties which is obtained
by replacing a respondent’s 1935 county of residence with his or her 1940 county of residence in Equation
(2). The results show that individuals who migrated into southern counties earn 2% less than stayers as the
38
Southern counties include counties in Alabama, Florida, Georgia, Louisiana, North Carolina, and South Carolina.
18lynching rate increases and in-migrants work more hours than stayers as the lynching rate increases. Taken
together, Panels A and B of Table 3 show that migrants’ attributes do not differ from stayers for higher
lynchings rates. This finding suggests that sorting does not explain the relationship between lynching and
the voting behavior of blacks.
6.3 Polling Locations
To examine whether counties that experienced a relatively higher number of lynchings have contempo-
rary barriers that suppress voting, I examine one potential barrier - the paucity of polling places in black
areas. That is, I estimate the extent to which counties with more historical lynchings have fewer polling
places in areas where blacks live. If the number of polling places varies as a function of lynching rates and
the proportion of blacks in an area, then my results may be a result of this phenomenon. However, if no
relationship exists, then this exercise will strengthen the claim that historical lynchings have had a long-run
impact on the voting behavior of blacks.
To examine this relationship, I obtain the GIS boundary census-tract map along with census-tract pop-
ulation data from the 2010 Census. Polling place information comes from the Secretary of State Offices
in Alabama, Florida, Georgia, Louisiana, North Carolina, and South Carolina and includes the name of the
polling place, address, and county and state identifiers. Using an address locator from ArcGIS, each polling
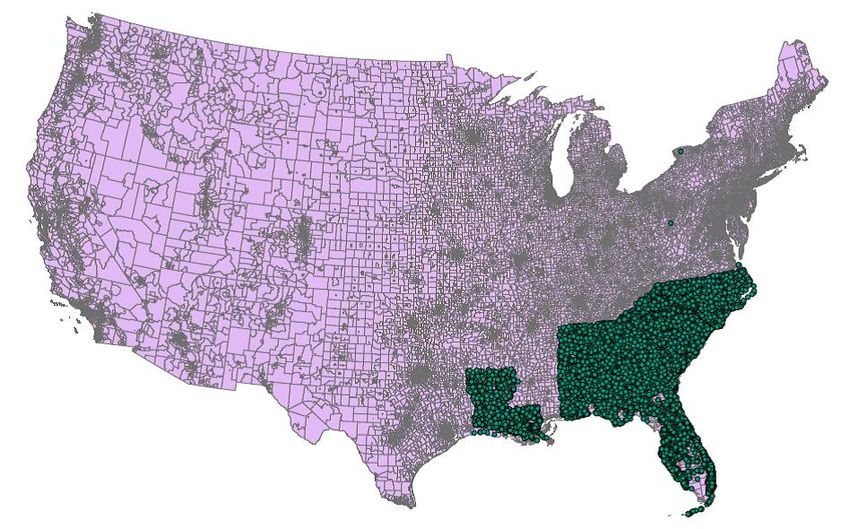
place address is geocoded into its equivalent latitude and longitude coordinate. As shown in Figure 7, these
pair of coordinates are overlaid onto the 2010 United States census-tract boundary map. Figure 8 shows an
enlarged mapping of geocoded addresses in Louisiana and shows that the number of polling places varies
across census-tracts. Using this mapping, I tally the number of polling places that lie within the GIS census-
tract and merge this data set with the 2010 population data and the lynching data to be used in Equation 3.39
To examine whether the number of polling places varies as a function of the proportion of blacks and
39
To merge the geocoded address (point) layer with the NHGIS census-tract boundary layer, I use the intersect tool
in ArcGIS. The intersect tool takes two layers as input and returns the features that belong to both layers as output.
Census-tract boundaries that do not contain any points from the point layer are assumed to have no polling places. The
merged point and boundary layer file is aggregated to the census-tract level which yields the total number of polling
places in each census tract.
19the lynching rate, I consider:
pollingt =κ0 + κ1 share blackt + κ2 lynching ratec +
(3)
κ3 (share blackt ∗ lynching ratec ) + t
where pollingt is the number of polling places which varies across census tracts, share blackt is the pro-
portion of blacks which varies across census tracts, and lynching ratec is the number of lynchings between
1882 and 1930 per black population in 1900 which varies across counties. The coefficient of interest, κ3 ,
measures the relationship between lynchings and the number of polling places as a function of the propor-
tion of blacks. Table 4 shows two important facts. First, the number of polling places decreases as the share
of blacks increases indicating that there are fewer polling places in areas where more blacks reside. Second,
there is no significant difference in the number of polling places as the share of blacks and lynching rate
vary. Figure 9 shows this relationship for counties with high and low lynching rates.40 The result from this
exercise rules out the possibility that counties with more historical lynchings have fewer polling places in
areas where blacks live.
6.4 IV Estimates
Since the negative relationship between lynchings and the voting behavior of blacks may be the result
of measurement error or omitted variables, the next strategy employs instrumental variables. This requires
an instrument that is correlated with the number of lynchings in a county between 1882 and 1930 but that
is uncorrelated with any unobservables in a county that may affect contemporary voting behavior. I use
measures of the environmental suitability for growing cotton between 1961 and 1990 as instruments for
lynching rates. This instrument captures a county’s exposure to lynchings since counties that were more
dependent on slave labor were also counties that experienced more lynchings following the American Civil
War (Acharya et al. 2016). Given that in 1840, cotton harvested by slaves generated more revenue than all
other US exports combined (The United States National Park Service Southeast Regional Office 2011), it
is plausible that lynchings and cotton suitability are positively correlated. Yet historical measures of cotton
suitability are plausibly uncorrelated with other factors that affect contemporary voting behavior.
40
The high lynching rate indicates the 75th percentile lynching rate and the low lynching rate indicates the 25th
percentile lynching rate.
20Table 5 reports the IV estimates. Column (1) depicts the estimates when only state and year fixed
effects are included. Although this estimate shows a negative relationship between lynching rates and voter
registration rates of blacks, this column is undesirable since it does not include characteristics of counties.
Column (2) presents the baseline estimates and columns (3)-(6) shows the estimates obtained from including
each potential mechanism. As seen in the OLS analysis, columns (3)-(6) show that the estimates are not
sensitive to the inclusion of these potential mechanisms. Column (7) shows the preferred specification which
includes historical and contemporary controls, year and state fixed effects, as well as potential mechanisms.
The first stage estimates are reported in Panel A which show a positive relationship between lynching rates
and cotton suitability rates which is significant at the 1% level. The F-statistic of the excluded instrument is
16.46 indicating a strong first stage. The second stage estimates are reported in Panel B. The second-stage
estimates report a negative and significant affect of lynchings on voting behavior of blacks. Specifically, the
estimates indicate that for one additional lynching per 100,000 black population in 1900, voter registration
rates of blacks decrease by 0.15 percentage points. This result is significant at the 5% level. In summary,
this result is consistent with the OLS estimates indicating that historical lynchings negatively affect voter
registration rates of blacks. Additionally, the IV estimates are larger in magnitude compared to the OLS
estimates.41
Considering that the lynching rate and some of the characteristics of counties do not vary over time, I
include a cross-section instrumental variables analysis. The results are presented in Table A.2 in Appendix
A. Similar to the estimates obtained in Table 5, the cross-section estimates show a negative and significant
relationship between lynching rates and black voter registration rates. Specifically, the results obtained from
the preferred specification show that for one additional lynching per 100,000 black population in 1900, voter
registration rates of blacks decrease by 0.21 percentage points.
6.5 Falsification Exercises
Although the previous finding supports the hypothesis that cultural voting norms persisted in areas
that experienced historical lynchings, this finding is consistent with other interpretations. For example, I
would observe the same relationship if counties that were exposed to a relatively higher number of historical
41
The Hausman test shows that the IV coefficient on the lynching rate is different that the OLS coefficient at the 1%
significance level.
21You can also read