Bay, Franklin, Gulf
Healthy Start Coalition, Inc.

  Service Delivery Plan
         2021-2026
←
→
Page content transcription
If your browser does not render page correctly, please read the page content below

Bay, Franklin, Gulf
Healthy Start Coalition, Inc.
Service Delivery Plan
2021-2026
Table of Contents
BOARD OF DIRECTORS�������������������������������������������������������������������������������������������������1
ACKNOWLEDGEMENTS������������������������������������������������������������������������������������������������2
PARTNERSHIPS���������������������������������������������������������������������������������������������������������������2
HISTORY AND BACKGROUND���������������������������������������������������������������������������������������3
PLANNING PROCESS ����������������������������������������������������������������������������������������������������4
KEY ACCOMPLISHMENTS���������������������������������������������������������������������������������������������4
    Coalition Initiatives�����������������������������������������������������������������������������������������������������������4
    Improvements in Healthy Start Service Delivery ����������������������������������������������������������5
SUMMARY OF NEEDS ASSESSMENT FINDINGS���������������������������������������������������������5
    Data Limitations����������������������������������������������������������������������������������������������������������������5
    Socioeconomic Factors ����������������������������������������������������������������������������������������������������5
    Mother’s Age at Birth�������������������������������������������������������������������������������������������������������7
    Educational Attainment����������������������������������������������������������������������������������������������������7
    Births With an Interpregnancy Interval Less Than 18 Months�������������������������������������7
    Adequate Prenatal Care (Kotelchuck Index)�������������������������������������������������������������������8
    Entry into Prenatal Care ��������������������������������������������������������������������������������������������������8
    Tobacco and Substance Use ��������������������������������������������������������������������������������������������9
    Preterm and Low Birth Weight Infants ������������������������������������������������������������������������10
    Infant Mortality ��������������������������������������������������������������������������������������������������������������10
FETAL AND INFANT MORTALITY REVIEW (FIMR)���������������������������������������������������� 11
    FIMR Data������������������������������������������������������������������������������������������������������������������������12
    Barriers�����������������������������������������������������������������������������������������������������������������������������12
PREVIOUS PLANNING CYCLE PRIORITIES ���������������������������������������������������������������� 12
NEW PLANNING CYCLE INDICATORS ���������������������������������������������������������������������� 13
GOALS AND STRATEGIES������������������������������������������������������������������������������������������� 13
ACTION PLAN������������������������������������������������������������������������������������������������������������� 15
ENDNOTES������������������������������������������������������������������������������������������������������������������ 18
COMMUNITY NEEDS ASSESSMENT ������������������������������������������������������������������������� 19
RESOURCE DIRECTORY ��������������������������������������������������������������������������������������������� 20

                                                  2021-2026 SERVICE DELIVERY PLAN
                                         Healthy Start Coalition of Bay, Franklin & Gulf Counties
Board of Directors
                        HEALTHY START COALITION
                                   OF
                   BAY, FRANKLIN, AND GULF COUNTIES

                                       Elizabeth Moore
                                                 Chair

                                   Mary Beth Lovingood
                                              Vice-Chair

                                        Sonya Caldwell
                                              Treasurer

                                       Cay Commander
                                              Secretary

              Kim Bodine                                                     Michelle Ginn

             Julie Durden                                                   Cathy Douglass

             Carla Thacker                                                     Kris Nelson

           Julia Maddalena                                                 Andrea Morgan

             Brad Thomas                                                        Trey Hutt

The Coalition expresses its sincere appreciation to the Board of Directors for
           their support, making endeavors such as this possible.

                                     2021-2026 SERVICE DELIVERY PLAN                         Page 1
                            Healthy Start Coalition of Bay, Franklin & Gulf Counties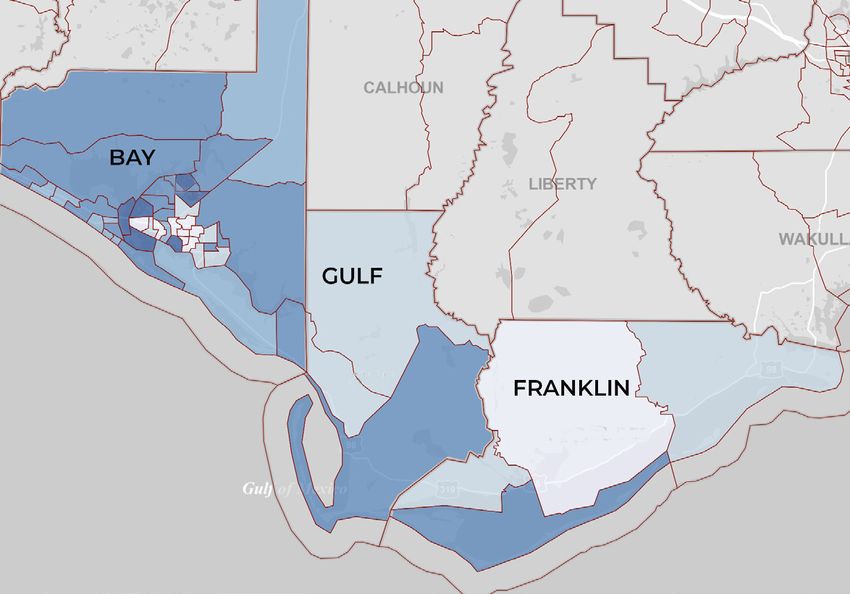
ACKNOWLEDGEMENTS

The Healthy Start Coalition of Bay, Franklin, & Gulf Counties Service Delivery Plan (SDP) is the culmination of several
months of collaboration and strategic planning between individuals, community- based organizations, partners, and Coali-
tion staff.
The Coalition is grateful to the healthcare providers, community agencies, Healthy Start participants, and care coordina-
tion staff who participated in community cafes, interagency meetings, and surveys, all of which contributed to the frame-
work of this plan.

                                                  PARTNERSHIPS

                       Cribs For Kids                                       Gulf Coast Children’s Advocacy Center

                     Healthy Families                                                      Plan of Safe Care

              Pregnancy Resource Center of                                  Gulf County Students Working Against
                     Panama City                                                      Tobacco (SWAT)

            The Treatment Center of Panama                                    Gulf Coast Regional Medical Center
                         City
                                                                                          St. Joe Foundation
                  Bay Health Foundation

                                                                                            Salvation Army
                        United Way
                                                                                          All About Women
                 Emerald Coast OB/GYN

                 Dr. Bryce Jackson, M.D.

                                                 2021-2026 SERVICE DELIVERY PLAN                               Page 2
                                        Healthy Start Coalition of Bay, Franklin & Gulf Counties
HISTORY AND BACKGROUND

The Healthy Start Coalition of Bay, Franklin,
& Gulf Counties was organized in 1992 to
serve as a part of a statewide network of
community based organizations to reduce Florida’s high infant
mortality and improve the lives of pregnant women and their
families. Today, the Coalition is responsible for directing local, state,
and federal funding to local community organizations that deliver direct services to
pregnant women and children, birth to age three.
The Coalition’s mission is to reduce preventable fetal and infant deaths associated with
lack of adequate prenatal care, socioeconomic conditions, and other racial, social, and
economic reasons. Our goals include improving pregnancy outcomes, reducing infant
mortality rates, and promoting healthy growth and development in all children up to age
three in Bay, Franklin, and Gulf Counties.
The Coalition is governed by a 14-member Board of Directors who guide the organization
toward a secure future and advancement of the mission. Members of the board have experi-
ence and leadership in business, legal, finance, and healthcare and are diverse in perspective and
background.
The Coalition, located in the central Florida panhandle has a landmass of 1,852 square miles and a
total population of 173,283¹. Over the past ten years, only Franklin County has shown an increase
in population. Since 2015 the number of resident births in the coalition service area has decreased by 19%.
In 2018, the area was severely impacted by Hurricane Michael. Rated at a category 5, this hurricane was the stron-
gest hurricane on record in the Florida Panhandle². It is estimated that over 40,000 homes were damaged in the
storm and over 1,400 federally assisted rental homes were destroyed or substantially damaged. Those who were
renters before the storm were left out of many disaster relief programs which were structured for those who owned
storm-damaged property³. In our local area, of the eleven need-based housing complexes, only three are functional
today. While the community has moved forward, the long-term effects of the storm continue, especially for those in a
lower socioeconomic status.
Since the last planning cycle, there have been significant changes to the statewide Healthy Start program. A program
redesign was initiated in 2011 in an effort to standardize program components throughout Coalitions in the state.
In 2015, Healthy Start began conducting operations under the Healthy Start Momcare Network, which acts as the
contract agent for the Agency for Healthcare Administration (AHCA) and subcontracts with Healthy Start coalitions to
serve pregnant women and babies enrolled in Medicaid.
In 2019, the Healthy Start program redesign was implemented, introducing a new statewide system of care aimed
at improving maternal and infant health outcomes by improving service delivery through the use of evidence-based
or research-based components. The process began with the introduction of the CONNECT, a coordinated intake and
review process which creates a one-stop entry point for home visiting programs. The introduction of CONNECT was
closely followed by the implementation of the Healthy Start pathway model of service delivery.
In the midst of the COVID-19 pandemic, The Healthy Start Coalition of Bay, Franklin, and Gulf Counties continues
to decrease risk factors. In 1992, when the Coalition was established, the infant mortality rate was 12.2 deaths per
1,000 live births, well exceeding the state rate of 8.8, in 2019, the infant mortality rate was 7.5.

                                                2021-2026 SERVICE DELIVERY PLAN                             Page 3
                                       Healthy Start Coalition of Bay, Franklin & Gulf Counties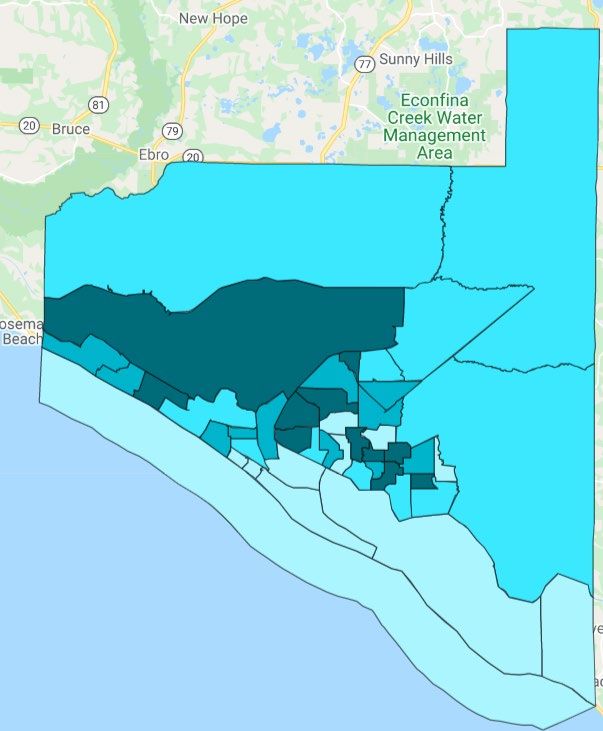
PLANNING PROCESS

The 2021-2026 Service Delivery Plan is the result of a yearlong process beginning with a Community Needs Assessment
(Exhibit 1), followed by an analysis of maternal and child health indicators, review of barriers and strengths, and identifica-
tion of key priorities.
The planning process led to the development of an action plan that includes 3 goals to address key priorities. The plan
includes strategies for the attainment of the goals and action steps.
It is important to note that the Community Needs Assessment was completed before the COVID-19 pandemic. While the
full effect on the health of the community is not yet known, we continue to move forward, monitoring outcomes closely,
and adjusting the plan as needed.

                                           KEY ACCOMPLISHMENTS

Coalition Initiatives
Fetal and Infant Mortality Review (FIMR) Healthy Start of Bay, Franklin, and Gulf Counties is one of 12 FIMR projects
statewide. FIMR is a two-tiered, evidence-based process that is used to examine fetal and infant deaths. The Coalition
reviews a total of 28 fetal or infant deaths yearly, identifying social, cultural, and systems factors associated with infant and
fetal mortality. The goal is to improve service systems and community resources for women, infants, and families to reduce
future fetal and infant deaths³.
Safe Sleep Initiative In partnership with Children Advocacy Center, we provide safe sleep training via a PowerPoint pre-
sentation to nurses and health care workers in the OB/GYN offices, first responders, and law enforcement. This initiative
also provides a safe sleep swag bag with a onesie and educational materials to parents after delivery.
Walk to Remember Every October a remembrance walk held to commemorate the lives of babies lost too soon. The
walk is open to anyone who has been touched by the loss of an infant or pregnancy. The event includes children’s activ-
ities, a remembrance ceremony, and a bubble release. By adding a sponsorship component to this event, it became a
fundraiser, where 100% of the funds are used for our “Last Rites for Little Ones” program and providing Resolve Through
Sharing bereavement training for the nurses and care coordinators.
Last Rites for Little Ones Provides bereavement boxes and grief support to parents. Financial assistance for burial or
cremation is also available.
Parents as Teachers (PAT) An evidence-based home visiting model that matches parents and caregivers with trained
professionals and makes regular, personal home visits from birth to age 3. The goal is to provide parents with child devel-
opment knowledge and parenting support, provide early detection of developmental delays and health issues, prevent
child abuse and neglect, and increase children’s school readiness.
Coordinated Intake and Referral (CONNECT) The Coalition was one of the pilot sites to test potential models using a
Learning Collaborative approach before the full implementation of CONNECT. CONNECT is a coordinated intake and review
process which creates a one-stop entry point for home visiting programs.
Mental Health Relief This intiative provides mental health services to Healthy Start clients primarily using a virtual
platform. The virtual visits have proven to be highly successful especially in families with substance exposed newborns and
parents who are in the detoxification phase. Participants receive parenting education and strategies for managing stress.
Initially funded by a grant, the Coalition has continued the services for several years using other funds.
Hurricane Michael Response The Coalition and direct service staff were “boots on the ground” days after the storm.
Frequently, Healthy Start home visitors were the first outside contact families had after the storm. Workers used burner
phones and assisted clients to contact their families. Many families still live in inadequate housing, potentially creating
unsafe sleep situations for babies. This has prompted the Coalition to increase infant safe sleep education.

                                                    2021-2026 SERVICE DELIVERY PLAN                               Page 4
                                           Healthy Start Coalition of Bay, Franklin & Gulf Counties
Improvements in Healthy Start Service Delivery
OB/GYN Office-Based Healthcare Navigators The Coalition started this initiative in 2013 as a strategy to increase the
initial intake (initial contact) completion rate. The Coalition entered into Agreements with local OB/GYN offices to place
Healthy Start direct service workers in the office. The direct service worker utilizes the time a woman is in the waiting
room to complete the Initial Intake and any necessary referrals to services. The process also provides a meeting place for
home visitors who may not have been able to contact their clients through other means.
The Office-Based Health Care Navigator initiative has resulted in near 100% prenatal screen rate and a large decrease in
"unable to complete" initial intake rates. Because of this initiative, more women in the area are receiving crucial education
in the prenatal period and referrals to home visitation programs.
Car Seat Safety Initiative The Coalition provides car seats and car seat safety technician certification classes to two local
fire departments. The departments then distribute the car seats and provide installation.

                          SUMMARY OF NEEDS ASSESSMENT FINDINGS

In March of 2020, in preparation for the Service Delivery Plan process, the Coalition completed a Community Needs
Assessment of Bay, Franklin, and Gulf Counties. This was the first needs assessment completed since Hurricane Michael
changed the physical and demographic landscape of the area. The most recent indicator data in the assessment were from
the year of the hurricane (2018) and was interpreted with caution.
Data Limitations
It is important to note that the data sets referenced in this plan have been compiled from numerous sources. When possi-
ble, the data is presented in 3-year rolling rates, which is not an average, but a sum of the three years referenced. How-
ever, when needed for clarity or because it was unavailable in any other form, data is also referenced in single-year rates.
We emphasize, that in many cases our number of incidents is less than five, such as infant mortality, causing our data to
fluctuate greatly and be unstable.
The assessment included a review of community demographics, birth outcome indicators, and community input. The
assessment and supplemental review of data was completed with a focus on the social determinants of health: housing,
employment, education, transportation, and poverty. Where evident, racial disparities are also included.
To maximize the accuracy, completeness, and timeliness of the data to support proposed priorities, the Coalition conduct-
ed a supplemental review of 2019 data, and where possible, 2020 data. The intent was to ensure data completeness and
smooth trending during the hurricane and post-hurricane era.
The assessment included a review of socioeconomic and environmental factors as well as an analysis of key indicators in
birth outcomes.
Socioeconomic Factors
Bay, Franklin, and Gulf Healthy Start Coalition service area is 82% White and 18% Black and Other races. Most residents
speak English, however, roughly 6% of the population speaks a language other than English at home. The most populous
age group is 25-34-year-old cohort. The largest male age group is 25-34-year-old cohort, the largest female age group is
the 55-64-year-old group.
The median household income for each county is less than the national and state average. Bay and Franklin County medi-
an income has risen steadily since 2015. Gulf County experienced a decrease in median household income in 2018. How-
ever, the median income is not distributed equally within the counties. Attention to income distribution is important when
planning service delivery as lower-income areas may have access to fewer resources such as reliable internet and cellular
service, transportation, or access to healthcare.

                                                   2021-2026 SERVICE DELIVERY PLAN                             Page 5
                                          Healthy Start Coalition of Bay, Franklin & Gulf Counties
Median Income by Census Tract⁵
                                      Bay, Franklin and Gulf County,2015-2019

Socioeconomically, if a family has children in the Coalition service area, they have a 1 in 5 chance of living below the
federal poverty level. Since 2017, both Gulf and Franklin County have seen a significant rise in the percentage of fam-
ilies with related children less than 5 years old, living below the poverty level⁶. Forty-nine percent (49%) of residents
receiving SNAP benefits in the coalition service area have children under the age of 18, 53% of those are in families
with female householders with no spouse present⁷.
Over 50% of the births in the Coalition service area list Medicaid as the payment source. This number is higher than
the state but the rate has decreased significantly since 2013, especially in Franklin County. The graph below shows the
some of characterisics of those who live in poverty in our area.

                                                  Those Who Live in Poverty
                                                 Coalition Service Area, 2019
                                                       2015-2019 Estimates

                                     19%                       27%                       13%

                                  Hispanic                    Black                   White

                                     29%                       24%                      53%

                                  No Diploma               Children
In addition to exploring the socioeconomics, the analysis included a review of indicators associated with birth outcomes
or birth outcome indicators. In some cases, the birth outcome indicator is a socioeconomic factor, such as educational
achievement.
Mother’s Age at Birth
Births to mothers aged 15-19 have been a priority throughout the state and Coalition service area for several years. Both
have decreased steadily since 2000, but the Coalition remains higher than the state rate.
In 2019, Franklin County had the highest rate of births to mothers, age 15-19, in the state (rate of 72.7 represented an
n of 16 births) and exceeds the state rate for repeat births to teens. Babies born to teens have a higher risk of complica-
tions such as premature birth, low birth weight, and infant mortality. Pregnant teens are more likely to drop out of school,
limiting opportunities for future employment, and increasing their risk of living in poverty. Social determinants may play
a role in teen pregnancy such as low education and family income levels, lack of opportunity in the teen’s life for positive
community involvement, and racism⁸.

                                                      Births to Mothers Aged 15-19
                                                        per 1,000 females aged 15-19
                                                                   3-Year Rolling
                                    70
                                    60
                                    50
                                    40
                                    30
                                    20
                                    10
                                     0
                                              2012-14     2013-15       2014-16     2015-17       2016-18   2017-19
                              Florida          24.9         22.7          21.0        19.7          18.2     17.1
                              Bay              43.3         39.2          38.6        35.3          33.1     29.0
                              Franklin         55.8         58.1          60.7        58.3          45.7     54.6
                              Gulf             36.4         36.4          33.0        30.1          31.4     28.9
                 Source: flhealthcharts.com

Births to mothers over the age of 35 carry similar physical risks as teen births with the addition of an increased possibility
of certain congenital anomalies. The Coalition service is well below the state rate for births to mothers over the age of 25.
The rates are trending up in Bay and Franklin Counties.
Educational Attainment
Births to mothers, aged 18 and older, without a high school education are more prevalent in the Coalition service area
than in the state. While the incidence has decreased steadily in the state, it has increased in Franklin County, remained
steady in Bay County, and decreased in Gulf County.
Educational attainment is a major determinant of living in poverty. Of those living in poverty in the Coalition service area,
it is estimated that 29% do not have a high school diploma⁹.
Births With an Interpregnancy Interval less than 18 months
Interpregnancy interval, or birth spacing, is the interval between the end of one pregnancy and the conception of the
next. The recommended minimum birth spacing of 18 months can reduce the risk of poor outcomes such as preterm
birth and low birth weight10. The Needs Assessment showed that the overall pregnancy interval was over the state rate
with a slight upward trend. When broken down into specific spacing periods the Coalition service area is over the state

                                                          2021-2026 SERVICE DELIVERY PLAN                             Page 7
                                                 Healthy Start Coalition of Bay, Franklin & Gulf Counties
rate for birth spacing at less than 6 months and between 6-11 months. The higher than state rate numbers are largely
driven by Bay County. The Coalition service rates are similar to the state in the 12-17 month period.
The Needs Assessment showed that the overall pregnancy interval was over the state rate with a slight upward trend.
When broken down into specific spacing periods the Coalition service area is over the state rate for birth spacing at less
than 6 months and between 6-11 months. The higher than state rate numbers are largely driven by Bay County. The Coali-
tion service rates are similar to the state in the 12-17 month period.

                                      Percentage of Births with Interpregnancy Interval
Tobacco and Substance Use
As well as being a health danger for pregnant women, tobacco use during pregnancy can increase risks for the baby being
born preterm or low birth weight. Smoking during pregnancy and after pregnancy can also increase the risk of sudden
infant death syndrome (SIDS)11.
The rates of women who smoke tobacco during pregnancy have decreased significantly since 2012 in the state and the
Coalition service area. However Bay, Franklin, and Gulf Counties remain well above the state rate for this indicator.
Births to Mothers Who Report Smoking During Pregnancy
% of births
3-Year Rolling
25%
20%
15%
10%
5%
0%
12-14 13-15 14-16 15-17 16-18 17-19
Florida 6.5% 6.2% 5.7% 5.2% 4.8% 4.4%
Bay 16.0% 14.4% 13.3% 11.9% 9.6% 8.3%
Franklin 19.0% 20.8% 20.4% 21.4% 22.3% 20.9%
Gulf 19.0% 18.1% 17.9% 15.4% 10.8% 11.2%
Source: flhealthcharts.com
Data related to substance use in pregnancy is difficult to obtain. Data related to overdoses in a given area is more widely
available. While there is no information on the demographics of the following data, it serves to show a picture of the over-
doses and the culture of substance use in the area.
Overdoses
Counts, 2018-2019
2018 2019
Suspected Non-Fatal Suspected Non-Fatal
Overdose Deaths Overdose Deaths
Overdoses Overdoses
BAY 71 268 112 269
FRANKLIN 1 0 1 19
GULF 2 22 3 18
Source: flhealthcharts.com
During the Community Café, participants were asked to identify barriers to substance use and mental health treatment.
The responses included stigma, cost and availability of services, and generational norms. Participants suggested the
following solutions: telehealth services, more screenings and services in the primary care venue, and education to those
incarcerated with a focus on women of childbearing age.
2021-2026 SERVICE DELIVERY PLAN Page 9
Healthy Start Coalition of Bay, Franklin & Gulf CountiesPreterm and Low Birth Weight Infants The Needs Assessment revealed that the rate of preterm births (
Deaths related to congenital malformations commonly rank as the leading cause of infant death in many communities.
According to the CDC, the top 3 leading causes of infant death in the US in 2018 were congenital malformation, followed
by disorders related to short gestation, and accidents or unintentional injuries (includes SUID/SIDS).
In the Coalition service area, the second leading cause of death is unintentional injuries, most often related to unsafe
sleep practices. The higher rates of SUID is a point of concern during the post-Hurricane Michael housing crisis when
many families live in inadequate housing and may not have the ability to create a safe sleep environment for their baby.
The chart below reflects an increase in SUID deaths in 2018 with a rapid decline in 2019.

                                              Sudden Unexpected Infant Deaths (SUID)
                                                                   2013-2019
                                                              per 1,000 live births
                                                                 Florida          Coalition
                       3.5
                       3.0
                       2.5
                       2.0
                       1.5
                       1.0
                       0.5
                       0.0
                                 2013          2014         2015           2016        2017       2018    2019

                      Source: flhealthcharts.com

While these rates and incidents may be small, it is useful when adopting future goals to examine the causes of infant death
and relative associated risks. For example, a newborn death may occur related to placental abruption in the setting of
maternal high blood pressure. Hypertension is often a condition present prior to pregnancy, indicating a potential need
for better preconception care. Trends are followed closely as they may be indicative of a need for additional community
outreach and education.

                         FETAL AND INFANT MORTALITY REVIEW (FIMR)

The Healthy Start Coalition of Bay, Franklin, and Gulf Counties is one of 12 Florida Department of Health-funded Fetal and
Infant Mortality Review (FIMR) sites in Florida. Contractually required to review 28 fetal and/or infant deaths per year, the
Coalition is able collect data through these reviews that are otherwise not available. While the data may be statistically
insignficant due to the small numbers within each variable, FIMR is often the only method in which to obtain lifestyle infor-
mation or the family’s perspective, through the maternal interview. This data is used in conjunction with more stable data
to further inform decisions regarding community outreach and services.
In 2018, the FIMR database migrated from a state case reporting system to a national case reporting system. The system
allows data to be gathered on a local, state and national level. Data gathered from the local FIMR case review team com-
bines with other teams throughout the country to identify national risk factors or patterns in child injury and safety.
Between 2018 and 2021 79 fetal and infant deaths were reviewed by the FIMR team. The following is an analysis of the
deaths reviewed through the Fetal and Infant Mortality Review Process.

                                                        2021-2026 SERVICE DELIVERY PLAN                          Page 11
                                               Healthy Start Coalition of Bay, Franklin & Gulf Counties
FIMR Data
Infant Factors Present Maternal Factors Present
FIMR Review, 2018-2021 FIMR Review, 2018-2021
80% 80%
70% 70%
60% 60%
50% 50%
40% 40%
30% 30%
20% 20%
10% 10%
0% 0%
Premature Low Birth Intrauterine Late NICU stay Infant ever Unplanned Pre-pregnancy Maternal Maternal Referral to
(6mos) or of >1 day breastfed pregnancy BMI >30 medical stress health/human
(4. Improve the access to KidCare and Medicaid insurance coverage
5. Reduce maternal and child health risk factors caused by the use of substances including tobacco, alcohol, street
drugs, and prescription drugs.
6. Continue educational outreach associated with fetal/infant mortality, including unsafe sleeping, SIDS, sleep related
deaths, and parenting skills
NEW PLANNING CYCLE INDICATORS
After a thorough review of the Community Needs Assessment The Healthy Start Coalition of Bay, Franklin, and Gulf Coun-
ties has determined the following to be the key priorities for the new planning cycle, 2021-2026.
1. High rates of pregnant women who report using tobacco during pregnancy
2. Substance use exists in pregnant women
3. There has been an increase in infant deaths related to unsafe sleep environments.
GOALS AND STRATEGIES
Goal 1: Decrease the percentage of women who smoke during pregnancy.
Strategies:
A. Collaborate with direct service workers to coordinate smoking cessation education and distribution of product in
target population areas.
1. Host individual outreach events in target neighborhoods that focus on smoking cessation.
2. Have a Smoking Cessation table at the annual baby shower that features s Smoker Lyzer, Smoking Sue, and
smoking cessation products.
B. Implement public service announcements (PSA's) including commercials, billboards, and social media cam
paigns, to educate about the dangers of smoking while pregnant.
1. Create Instagram and Twitter accounts for the Coalition.
2. Develop PSAs with a local production company to utilize on a variety of media platforms.
C. Increase referrals to Script and the Quitline and track outcomes.
1. Coordinate with the Franklin County Florida Healthy Babies Tobacco Free program to help promote smoking
cessation in Franklin County.
Goal 2: Increase the awareness of Medication Assisted Treatment (MAT) and other available resources.
Strategies:
A. Continue to collaborate with the statewide Plan of Safe Care
1. Implement Plan of Safe Care baby showers in collaboration with other community preograms
B. Provide training to direct service workers to effectively support pregnant women while they are in enrolled in a
substance treatment program
1. Hire a trainer to educate staff about the effects of subtance use during pregnancy, strategies for assisting
women receiving treatment, and stress management techniques.
C. Collaborate with the local birthing hospital to implement the new Maternal Opioid Recovery Effort initiative.
1. Assist with the completion of the Community Mapping Tool.
2. Provide in-service training for hospital staff regarding referring women who are not already enrolled in home
2021-2026 SERVICE DELIVERY PLAN Page 13
Healthy Start Coalition of Bay, Franklin & Gulf Countiesvisitation to CONNECT.
3. Assist in the development of a process to address the needs of women with Opioid Use Disorder (OUD) who
refuse a referral to CONNECT or other services.
Goal 3: Reduce the number of babies who die due to an unsafe sleep environment
Strategies:
A. Implement the Safe Sleep Ambassadors program through Cribs for Kids to pregnant women served by Healthy
Start.
1. Train direct service workers on the Safe Sleep Ambassador program, how to assist clients with participation inf
the program, and how to track participation.
B. Continue to collaborate with other community agencies and first responders to increase awareness of the safe
sleep initiative.
1. Share information with agencies not involved with the initiative.
C. Implement Safe Baby Curriculum training.
1. Certify local trainers in the Safe Baby Curriculum.
2. Offer lunch and learns and /or virtual trainings to faith based community members, teachers, first responders,
etc.
D. Implement new safe sleep awareness campaigns (PSAs).
1. Update exisiting products and develop new safe sleep awareness campaigns.
2. Create Coalition Twitter and Instagram accounts.
3. Distribute new campaigns across multiple media outlets such as social media, television, radio, and billboards.
2021-2026 SERVICE DELIVERY PLAN Page 14
Healthy Start Coalition of Bay, Franklin & Gulf CountiesACTION PLAN
GOAL 1: Decrease the percentage of women who smoke during pregnancy.
PERSON START END
STRATEGY ACTION STEPS
RESPONSIBLE DATE DATE
1. Host individual outreach events in Coalition Staff July 1, June 30,
A. Collaborate with 2021 2026
direct service workers target neighborhoods that focus on
to coordinate smoking smoking cessation.
cessation education
and distribution of Coalition Staff July 1, June 30,
2. Have a Smoking Cessation table at
product in target popu- 2021 2026
the annual baby shower that features
lation areas.
Smoker Lyzer, Smoking Sue, and smok-
ing cessation products.
B. Implement public 1. Create Instagram and Twitter Coalition Staff July 1, June 30,
service announce- accounts for the Coalition. 2021 2026
ments (PSA's) includ-
ing commercials,
billboards, and social
2. Develop PSAs with a local produc- Coalition Staff July 1, June 30,
media campaigns, to
tion company to utilize on a variety of 2021 2026
educate about the
dangers of smoking media platforms.
while pregnant.
C. Increase referrals to 1. Coordinate with the Franklin County Coalition Staff July 1, June 30,
Script and the Quitline Florida Healthy Babies Tobacco Free 2021 2026
and track outcomes. program to promote smoking cessa-
tion in Franklin County.
2021-2026 SERVICE DELIVERY PLAN Page 15
Healthy Start Coalition of Bay, Franklin & Gulf CountiesACTION PLAN
GOAL 2: Increase the awareness of Medication Assisted Treatment (MAT) and other available resources.
PERSON START END
STRATEGY ACTION STEPS
RESPONSIBLE DATE DATE
1. Implement Plan of Safe Care baby Coalition Staff July 1, June 30,
A. Continue to collab- 2021 2026
orate with the state- showers in collaboration with other
wide Plan of Safe Care. community programs.
B. Provide training to 1. Hire a trainer to educate staff about Coalition Staff July 1, June 30,
direct service workers the effects of subtance use during 2021 2026
to effectively support pregnancy, strategies for assisting
pregnant women while women receiving treatment, and stress
they are in enrolled in management techniques.
a substance treatment
program.
Coalition Staff July 1, June 30,
1. Assist with the completion of the
2021 2026
Community Mapping Tool.
C. Collaborate with Coalition Staff July 1, June 30,
2. Provide in-service training for hos-
the local birthing pital staff regarding referring women 2021 2026
hospital to implement who are not already enrolled in home
the new Maternal visitation to CONNECT.
Opioid Recovery Effort
initiative.
Coalition Staff July 1, June 30,
3. Assist in the development of a pro-
cess to address the needs of women 2021 2026
with Opioid Use Disorder (OUD) who
refuse a referral to CONNECT or other
services.
2021-2026 SERVICE DELIVERY PLAN Page 16
Healthy Start Coalition of Bay, Franklin & Gulf CountiesACTION PLAN
GOAL 3: Reduce the number of babies who die due to an unsafe sleep environment.
PERSON START END
STRATEGY ACTION STEPS
RESPONSIBLE DATE DATE
1. Train direct service workers on Coalition Staff July 1, June 30,
A. Implement the Safe
the Safe Sleep Ambassador program, 2021 2026
Sleep Ambassadors
program through Cribs how to assist clients with participa-
for Kids to pregnant tion in the program, and how to track
women served by participation.
Healthy Start.
1. Share information with agencies not Coalition Staff July 1, June 30,
B. Continue to col-
involved with the inititative. 2021 2026
laborate with other
community agencies
and first responders
to increase aware-
ness of the safe sleep
initiative.
Coalition Staff July 1, June 30,
1. Certify local trainers in the Safe
2021 2026
Baby Curriculum.
C. Implement the
Safe Baby Curriculum July 1, June 30,
2. Offer lunch and learns and/or virtu- Coalition Staff
training. 2021 2026
al trainings to faith based community
members, teachers, first responders,
etc.
Coalition Staff July 1, June 30,
1. Update existing products and
2021 2026
develop new safe sleep awareness
campaigns.
D. Implement new Coalition Staff July 1, June 30,
2. Create Coalition Twitter and Insta-
safe sleep awareness gram accounts. 2021 2026
campaigns (PSAs).
Coalition Staff July 1, June 30,
3. Distribute new campaigns
across multiple media outlets such 2021 2026
as social media, television, radio,
and billboards.
2021-2026 SERVICE DELIVERY PLAN Page 17
Healthy Start Coalition of Bay, Franklin & Gulf CountiesENDNOTES
1. https://worldpopulationreview.com/us-counties/states/fl
2. https://www.noaa.gov/media-release/hurricane-michael-upgraded-to-category-5-at-time-of-us-landfall)
3. Slow Relief, Deep Divide in Hurricane Housing Recovery (n.d.). Retrieved from https://nextcity.org/daily/entry/
slow-relief-deep-divide-in-hurricane-housing-recovery
4. Fetal & Infant Mortality Review. (2020, October 21). Retrieved from http://www.ncfrp.org/fimr/
5. (n.d.). Retrieved from https://data.census.gov/cedsci/table?q=median income
6. Non Vital Indicators Group Data Viewer - CHARTS - Florida Department of Health. (n.d.). Retrieved from http://
www.flhealthcharts.com/ChartsReports/rdPage.aspx?rdReport=NonVitalIndGrp.Dataviewer&cid=0296
7. (n.d.). Retrieved from https://data.census.gov/cedsci/table?q=SNAP&tid=ACSDT1Y2019.B09010
8. Social Determinants and Eliminating Disparities in Teen Pregnancy. (2019, October 15). Retrieved from https://
www.cdc.gov/teenpregnancy/about/social-determinants-disparities-teen-pregnancy.html
9. (n.d.). Retrieved from https://data.census.gov/cedsci/table?q=poverty&tid=ACSST5Y2019.
S1701&hidePreview=true&moe=false
10. March of Dimes (2015). Retrieved from https://www.marchofdimes.org/
11. Substance Use During Pregnancy. (2020, July 15). Retrieved from https://www.cdc.gov/reproductivehealth/mater-
nalinfanthealth/substance-abuse/substance-abuse-during-pregnancy.htm#:~:text=Smoking during pregnancy increases
the,infant death syndrome (SIDS).
2021-2026 SERVICE DELIVERY PLAN Page 18
Healthy Start Coalition of Bay, Franklin & Gulf CountiesCOMMUNITY NEEDS ASSESSMENT
Healthy Start Bay, Franklin, and Gulf

Needs Assessment for the Service Delivery Plan
               March 2020
2020 Needs Assessment 2
Table of Contents
INTRODUCTION ..............................................................................................................................................................3
SUMMARY .........................................................................................................................................................................7
SUMMARY OF NEEDS ASSESSMENT FINDINGS ...............................................................................................................................7
PRIORITIES ..........................................................................................................................................................................................7
NEEDS ASSESSMENT DATA .........................................................................................................................................8
BIRTH OUTCOME INDICATORS .........................................................................................................................................................8
COMMUNITY INPUT ......................................................................................................................................................................... 21
Community Cafe summary ................................................................................................................................................. 21
Survey results .......................................................................................................................................................................... 22
ADDITIONAL DATA .......................................................................................................................................................................... 26
Unsafe sleep ............................................................................................................................................................................. 26
Substance abuse ..................................................................................................................................................................... 26
Smoking cessation ................................................................................................................................................................. 27
Infant death rate .................................................................................................................................................................... 272020 Needs Assessment 3
Introduction
The mission of Healthy Start of Bay, Franklin, and Gulf is to reduce preventable fetal
and infant deaths associated with lack of adequate prenatal care, socio-economic
conditions and other racial, social, and economic reasons. The goals of Healthy Start
are to improve pregnancy outcomes, to reduce infant mortality rates, and to promote
healthy growth and development in all children up to age three in Bay, Franklin, and
Gulf Counties.
This is the first needs assessment completed since Hurricane Michael hit the area in
October of 2018. This category five hurricane devastated the communities served by
Healthy Start of Bay, Franklin, and Gulf. The hurricane impacted every facet of daily
life and of daily operations at Healthy Start and has particularly impacted housing,
availability of services, and stress – which can lead to increased substance use and
poor mental health. Data sources for this needs assessment included birth outcome
indicators, community cafés, and a community survey. Unfortunately, the most recent
indicator data are from the year of the hurricane and should be interpreted with
caution as the community and its population have changed since then.
Figure 1 provides a snapshot of the three counties we serve. This section includes
secondary data aligned with social determinants of health, including housing,
employment, education, transportation, and poverty. These measures are not a
perfect fit for the impacts of social determinants of health but do provide context.
Figure 1: Community demographics
Bay Franklin Gulf
Rolling three-year average, 2016-2108, Florida CHARTS
Number of women of childbearing age 5,942
98,862 4,563
Percentage of women 15 to 44 who are White 79.2% 87.5% 83.0%
Percentage of women 15 to 44 who are Black 13.4% 9.1% 11.9%
Percentage of women 15 to 44 who are some other race 7.4% 3.5% 5.1%
Percentage of women 15 to 44 who are Hispanic 1 7.6% 4.5% 3.1%
2013-2017 estimates, American Community Survey
Number of children under 5* 531 647
11,333
Percentage of families with children under 5 that are 19.4% 22.5% 11.8%
below the federal poverty level
1The terms “Hispanic” and “Latino” are used interchangeably by the U.S. Census Bureau. Hispanics or
Latinos may be of any race.2020 Needs Assessment 4
Bay Franklin Gulf
Percentage of the total population over 25 years old with 89.1% 81.4% 84.3%
at least a high school diploma
Median family income (total population) $52,164 $55,866
$61,750
Unemployment rate for all residents over 16 years old 6.4% 7.9% 5.4%
Percentage of total households with no vehicle available 6.4% 7.9% 5.4%
Percentage of total population in the same house one year 79.8% 83.6% 84.0%
ago**
Percentage of total population that speaks a language 6.9% 5.5% 5.3%
other than English at home
*2018 population estimate from the American Community Survey
**Prior to Hurricane Michael
As noted, our mission is to reduce infant deaths. Figure 2 provides the number of
births in each county while Figures 3 through 6 provide data on low birth weight and
infant mortality. Please note that data are typically provided as a percentage of all
births or a rate per 1,000 births. In smaller counties, this can create fluctuations when
the counts are low.
Figure 2: Number of births in each county, rolling three-year average
8,000
7,000
6,000
5,000
4,000
3,000
2,000
1,000
0
Bay Franklin Gulf
12-14 6,867 321 369
13-15 6,963 318 370
14-16 7,065 294 357
15-17 7,051 308 363
16-18 6,841 283 352
Source: Florida Department of Health, CHARTS2020 Needs Assessment 5
Figure 3: Percentage of live births under 2,500 grams, rolling three-year
average
Fluctuations are due to the low counts in Franklin and Gulf (27 and 24 low birth
weight babies respectively).
12%
10%
8%
6%
4%
2%
0%
12-14 13-15 14-16 15-17 16-18
Florida 8.6% 8.6% 8.7% 8.7% 8.7%
Bay 7.8% 8.3% 8.5% 8.6% 8.3%
Franklin 8.1% 6.6% 8.8% 10.4% 9.5%
Gulf 6.2% 5.9% 6.4% 6.1% 6.8%
Source: Florida Department of Health, CHARTS
Figure 4: Percentage of live births under 2,500 grams, by race, 2016-2018
Please note that the percentages below are denominator-specific, meaning that the
percent of White low birth weight babies is of White births, not as a portion of all low
birth weights. Although the percentages are high, please note that counts are low. For
example, there was only an average of five Black low birth weight babies in Franklin
County between 2016-2018 and nine in Gulf County. Black women, however, are still
more likely to deliver a low birth weight baby.
Bay Franklin Gulf Florida
White 7.5% 9.0% 4.9% 7.2%
Black 13.2% 25.0% 20.5% 13.8%
Another race 7.6% 25.0% 6.7% 8.6%
Hispanic 8.0% 10.5% 0.0% 7.2%2020 Needs Assessment 6
Figure 5: Infant death rate per 1,000 live births, rolling three-year average
Although the rate is over the state average, in Franklin and Gulf counties the number
of infant deaths are low (an average of 3 and 7 per year, respectively).
25
20
15
10
5
0
12-14 13-15 14-16 15-17 16-18
Florida 6.1 6.1 6.1 6.1 6.1
Bay 8.7 8.0 7.5 5.8 7.7
Franklin 12.5 9.4 6.8 6.5 10.6
Gulf 10.8 13.5 16.8 16.5 19.9
Source: Florida Department of Health, CHARTS
Figure 6: Infant deaths per 1,000 births, by race, 2016-2018
Please note that the rates below are denominator-specific, meaning that the rate of
White infant deaths is per 1,000 White births, not as a portion of all infant deaths. As
with low birth weight, the counts of Black infant deaths are low (an average of two
per year in Gulf county) but Black women are more likely to experience in infant
death.
Bay Franklin Gulf Florida
White 5.1 11.8 10.5 4.3
Black 21.5 0.0 45.5 11.2
Another race 7.1 0.0 133.3 7.5
Hispanic 3.3 0.0 0.0 5.3
The next section provides a summary of the findings and the priorities identified.
These priorities will be used to create the service delivery plan.2020 Needs Assessment 7
Summary
Summary of Needs Assessment Findings
• Substance use (marijuana and alcohol) is higher than the state average in all
three counties.
• Community surveys identified substance use as a top concern.
• Deaths due to unsafe sleep practices are higher than the state average in Bay
and Franklin Counties.
• Recent Fetal and Infant Mortality Reviews (FIMRs) identified unsafe sleep as a
concern.
• In all three counties, the infant death rate is over the state rate and increasing,
however, the counts in Franklin and Gulf Counties are low (two and 11
respectively).
• Births to mothers who report smoking during pregnancy and births to mothers
over 18 without high school education are over the state average in all three
counites but decreasing in Bay and Gulf Counties.
• In all three counties, the birth rate to mothers age 15-19 is over the state rate
but decreasing.
Priorities
• Reduce substance use among pregnant women.
• Reduce unsafe sleep practices. Housing availability is contributing to this issue.
• Continue to focus on smoking cessation, focusing on Franklin County. Although
the percentage of women smoking during pregnancy is decreasing in two
counties, the percentage is still over the state average. In addition, FIMRs
identified smoking as a contributing factor in infant deaths.2020 Needs Assessment 8 Needs Assessment Data Birth Outcome Indicators This section provides the birth outcome indicators, by county, for the prior five years. Data for the 24 birth outcome indicators for each county were obtained from two Florida CHARTS products: the Pregnancy and Young Child Profile and the County Birth Comparison. Data are three-year rolling averages unless otherwise noted. The scales of the graphs are not consistent and were chosen to allow for visual comparison among years and counties and not across indicators. For some indicators, the smaller counties show wide fluctuations even with a rolling three-year average; in this case, the counts are provided for context. Figure 7 identifies for each county where the indicator is over the state average and whether that indicator is showing a concerning trend (increasing/decreasing) or may be a concern, but is improving. Following Figure 7 are the indicator graphs. Please note that the last year of available data was the year of Hurricane Michael.
2020 Needs Assessment                                                               9

Figure 7: Priority areas of concern “at a glance”

                                Bay              Franklin                Gulf
 Percentage of live                          The percentage is
 births under 2,500                          over the state
 grams                                       average, but
                                             counts are low
 Infant death rate per
                              The rate is over the state average and increasing
 1,000 live births
 Percentage of births                        The percentage
 with adequate                               dropped to under
 prenatal care                               the state average
                                             during 2016-18.
 Births to mothers age
 15-19 per 1,000                   Over the state average but decreasing.
 females age 15-19
 Repeat births to                            Over the state      Under the state
 mothers ages 15-19 as                       average.            average but
 a percentage of births                                          increasing.
 to mothers ages 15-19
 Births with an inter-
                           Over the state average and fluctuating, but showing a
 pregnancy interval
                                            slight upward trend.
 under 18 months
 Births to mothers over Over the state       Over the state      Over the state
 18 without high        average but          average and         average but
 school education       showing a slight     increasing.         showing a slight
                        downward trend.                          downward trend.
 Births to mothers who Over the state        Over the state      Over the state
 report smoking during average but           average and         average but
 pregnancy              decreasing.          increasing.         decreasing.
 Births covered by        Over the state average but showing a slight downward
 Medicaid                                           trend.
 Kindergarten children Dropped over the
 fully immunized        last three years.

The next pages provide data on each of the birth outcome indicators reviewed.
2020 Needs Assessment 10
Figure 8: Percentage of births with adequate prenatal care according to the
Kotelchuck index, rolling three-year average
80%
70%
60%
50%
40%
30%
20%
10%
0%
12-14 13-15 14-16 15-17 16-18
Florida 70.1% 69.9% 70.0% 70.5% 70.5%
Bay 72.4% 73.7% 73.9% 73.6% 72.9%
Franklin 69.9% 70.7% 69.3% 71.5% 63.4%
Gulf 71.3% 71.3% 71.5% 73.4% 73.2%
Figure 9: Births to mothers age 15-19 per 1,000 females age 15-19, rolling
three-year average
70
60
50
40
30
20
10
0
12-14 13-15 14-16 15-17 16-18
Florida 24.9 22.7 21.0 19.7 18.2
Bay 43.3 39.2 38.6 35.3 33.1
Franklin 55.8 58.1 60.7 58.3 45.7
Gulf 36.4 36.4 33.0 30.1 31.42020 Needs Assessment 11
Figure 10: Repeat births to mothers ages 15-19 as a percentage of births to
mothers ages 15-19, rolling three-year average
35%
30%
25%
20%
15%
10%
5%
0%
12-14 13-15 14-16 15-17 16-18
Florida 16.6% 16.2% 16.1% 15.7% 15.4%
Bay 15.6% 13.8% 12.6% 15.0% 15.1%
Franklin 16.7% 13.5% 12.8% 24.3% 31.0%
Gulf 2.9% 2.9% 5.9% 6.1% 8.6%
Figure 11: Births with an inter-pregnancy interval under 18 months as a
percentage of births, rolling three-year average
45%
40%
35%
30%
25%
20%
15%
10%
5%
0%
12-14 13-15 14-16 15-17 16-18
Florida 34.7% 34.4% 34.6% 34.7% 34.7%
Bay 38.5% 38.6% 40.5% 41.8% 41.7%
Franklin 31.5% 34.4% 38.8% 38.1% 36.8%
Gulf 38.8% 35.5% 38.5% 37.5% 41.0%2020 Needs Assessment 12
Figure 12: Births to mothers over 18 without high school education as a
percentage of births to all mothers over 18, rolling three-year average
25%
20%
15%
10%
5%
0%
12-14 13-15 14-16 15-17 16-18
Florida 12.3% 11.7% 11.2% 10.9% 10.6%
Bay 13.0% 12.3% 12.4% 12.6% 12.2%
Franklin 18.6% 17.8% 16.5% 17.5% 19.6%
Gulf 10.7% 12.1% 13.9% 12.9% 10.9%
Figure 13: Births to mothers over age 35 per 1,000 females over age 35, rolling
three-year average
7.0
6.0
5.0
4.0
3.0
2.0
1.0
0.0
12-14 13-15 14-16 15-17 16-18
Florida 4.6 4.7 4.8 4.9 5
Bay 3.4 3.7 3.8 4.1 5.9
Franklin 1.5 0.9 0.7 1.1 1.8
Gulf 2.2 2.2 2.4 2.8 2.72020 Needs Assessment 13
Figure 14: Births to overweight mothers at the time pregnancy occurred as a
percentage of births, rolling three-year average
35%
30%
25%
20%
15%
10%
5%
0%
12-14 13-15 14-16 15-17 16-18
Florida 25.5% 25.8% 26.0% 26.3% 26.6%
Bay 24.9% 25.0% 25.6% 26.3% 23.5%
Franklin 24.9% 29.8% 32.1% 29.0% 26.5%
Gulf 25.0% 26.1% 25.5% 27.0% 28.5%
Figure 15: Births to obese mothers at time the pregnancy occurred as a
percentage of births, rolling three-year average
35%
30%
25%
20%
15%
10%
5%
0%
12-14 13-15 14-16 15-17 16-18
Florida 22.4% 22.8% 23.4% 24.1% 25.1%
Bay 26.4% 27.3% 27.7% 28.2% 27.2%
Franklin 31.0% 29.8% 26.1% 31.0% 30.9%
Gulf 31.8% 31.5% 31.1% 32.1% 32.1%2020 Needs Assessment 14
Figure 16: Births to mothers who report smoking during pregnancy as a
percentage of births, rolling three-year average
25%
20%
15%
10%
5%
0%
12-14 13-15 14-16 15-17 16-18
Florida 6.5% 6.2% 5.7% 5.2% 4.8%
Bay 16.0% 14.4% 13.3% 11.9% 9.6%
Franklin 19.0% 20.8% 20.4% 21.4% 22.3%
Gulf 19.0% 18.1% 17.9% 15.4% 10.8%
Figure 17: Births to uninsured women ("self-pay" checked on birth certificate)
as a percentage of births, rolling three-year average
8%
7%
6%
5%
4%
3%
2%
1%
0%
12-14 13-15 14-16 15-17 16-18
Florida 7.1% 6.6% 6.4% 6.3% 6.2%
Bay 1.2% 1.3% 1.2% 1.4% 3.1%
Franklin 0.9% 0.0% 1.7% 2.9% 5.3%
Gulf 0.8% 1.1% 1.4% 1.4% 1.7%2020 Needs Assessment 15
Figure 18: Births covered by Medicaid as a percentage of births, rolling three-
year average
Data from 2016-2018 are not yet available
90%
80%
70%
60%
50%
40%
30%
20%
10%
0%
12-14 13-15 14-16 15-17
Florida 51.0% 50.2% 49.1% 48.8%
Bay 53.9% 52.4% 50.3% 51.7%
Franklin 77.2% 75.4% 71.7% 69.4%
Gulf 62.5% 64.5% 63.9% 60.7%
Figure 19: C-section births as a percentage of births, rolling three-year average
40%
35%
30%
25%
20%
15%
10%
5%
0%
12-14 13-15 14-16 15-17 16-18
Florida 37.7% 37.4% 37.3% 37.3% 37.1%
Bay 30.6% 30.4% 30.4% 30.0% 32.0%
Franklin 32.1% 29.2% 28.9% 33.1% 32.9%
Gulf 35.0% 33.0% 30.0% 31.7% 31.3%2020 Needs Assessment 16
Figure 20: Multiple births (twins, triplets, or more) as a percentage of births,
rolling three-year average
5%
4%
4%
3%
3%
2%
2%
1%
1%
0%
12-14 13-15 14-16 15-17 16-18
Florida 3.3% 3.3% 3.3% 3.3% 3.3%
Bay 2.8% 3.0% 3.1% 3.5% 3.5%
Franklin 3.4% 4.1% 2.4% 1.3% 1.4%
Gulf 1.9% 2.4% 1.7% 1.7% 1.1%
Figure 21: Very low birth weight (VLBW) infants born in subspecialty perinatal
centers as a percentage of VLBW births, rolling three-year average
Fluctuations are caused by low counts of VLBW infants. For example, in Gulf County,
the rolling three-year average ranged between two and seven.
120%
100%
80%
60%
40%
20%
0%
12-14 13-15 14-16 15-17 16-18
Florida 78.3% 77.8% 76.7% 77.1% 79.0%
Bay 71.6% 91.8% 90.3% 87.9% 82.2%
Franklin 100.0% 100.0% 100.0% 100.0% 100.0%
Gulf 71.4% 100.0% 100.0% 100.0% 50.0%2020 Needs Assessment 17
Figure 22: Preterm births as a percent of total live births
16%
14%
12%
10%
8%
6%
4%
2%
0%
12-14 13-15 14-16 15-17 16-18
Florida 10.1% 10.0% 10.0% 10.1% 10.2%
Bay 9.8% 10.0% 9.8% 9.9% 9.8%
Franklin 13.4% 13.2% 12.2% 10.1% 9.2%
Gulf 6.5% 7.8% 7.8% 9.9% 10.2%
Figure 23: Preterm births as a percentage of total births, by race, 2016-2018
Please note that the percentages below are denominator-specific, meaning that the
percent of White preterm births is of White births, not as a portion of all preterm
births.
Bay Franklin Gulf Florida
White 8.9% 7.5% 7.7% 9.1%
Black 14.2% 30.0% 25.0% 13.9%
Another race 9.4% 12.5% 13.3% 9.0%
Hispanic 10.9% 10.5% 0.0% 9.1%2020 Needs Assessment 18
Figure 24: Maternal deaths per 100,000 live births, rolling three-year average
Please note fluctuations in rates are due to low counts of maternal deaths (between
two and five per year in Bay County).
80
70
60
50
40
30
20
10
0
12-14 13-15 14-16 15-17 16-18
Florida 23.8 24.1 19.9 18.3 17.2
Bay 72.8 14.4 28.3 14.2 29.2
Franklin 0.0 0.0 0.0 0.0 0.0
Gulf 0.0 0.0 0.0 0.0 0.0
Figure 25: Total fetal deaths per 1,000 live births and fetal deaths, rolling three-
year average
Fluctuations in rates are due to low counts of fetal deaths.
25
20
15
10
5
0
12-14 13-15 14-16 15-17 16-18
Florida 7.1 7.0 6.9 6.9 6.8
Bay 7.1 5.6 5.2 5.4 6.5
Franklin 3.1 9.3 16.7 22.2 20.8
Gulf 5.4 8.0 8.3 8.2 11.22020 Needs Assessment 19
Figure 26: Total neonatal infant deaths per 1,000 live births, rolling three-year
average
Fluctuations in rates are due to low counts of neonatal infant deaths.
12
10
8
6
4
2
0
12-14 13-15 14-16 15-17 16-18
Florida 4.0 4.1 4.2 4.2 4.1
Bay 5.5 4.9 4.5 3.4 4.8
Franklin 6.2 3.1 0.0 3.2 3.5
Gulf 10.8 10.8 11.2 8.3 11.4
Figure 27: Total post-neonatal infant deaths per 1,000 live births, rolling three-
year average
Fluctuations in rates are due to low counts of neonatal infant deaths.
9
8
7
6
5
4
3
2
1
0
12-14 13-15 14-16 15-17 16-18
Florida 2.1 2.0 1.9 2.0 2.0
Bay 3.2 3.2 3 2.4 2.9
Franklin 6.2 6.3 6.8 3.2 7.1
Gulf 0 2.7 5.6 8.3 8.5You can also read