A Rapid Screening Test for the Diagnosis of Influenza Infection Incubation Period Using Coincidence Analysis of Pulse Waves
←
→
Page content transcription
If your browser does not render page correctly, please read the page content below
Preprints (www.preprints.org) | NOT PEER-REVIEWED | Posted: 20 October 2017                doi:10.20944/preprints201710.0137.v1

                 A Rapid Screening Test for the Diagnosis of Influenza Infection
                 Incubation Period Using Coincidence Analysis of Pulse Waves

                             Po-Ying Chen 1, *, Keng-Chang Tu 2, Shyr-Shen Yu 2 and Wen-Kuan Yeh 3

                 1
                   Department of Electronic Engineering, National Chin-Yi University of Technology,
                   Taichung 41170, Taiwan; poychen@ncut.edu.tw
                 2
                    Department of Computer Science and Engineering, National Chung Hsing
                   University, Taichung 402, Taiwan
                 3
                   Department of Electronic Engineering, National Kaohsiung University, Kaohsiung
                   811, Taiwan

                 Abstract
                       Viral infections have long been the biggest threat to human survival, and from a
                 medical perspective, the development of noninvasive high-throughput screening
                 methods that target the incubation period to either treat diseases or limit viral spread
                 would be strikingly effective. Using this technology to target viral incubation periods
                 would also be inexpensive to perform. The current study proposes to transform pulse
                 signals into a rapid diagnostic test using “coincidence analysis” in the hope of
                 preventing or reducing the symptoms of viral infections.
                       The heart plays a critical role in calculating and supplying the needs of all tissues
                 of the body. Pulse waves are pressurized signals in response to heart’s calculations
                 and include all phases of the cardiac cycle, which maintains life and provides energy
                 needed to perform tasks. Any small movement gives a corresponding signal to pulse
                 waves. The current study investigated conclusive data on self-limiting infections, such
                 as common cold. We used pulse wave, coincidence analysis technology to capture
                 signals from individuals with common cold during the incubation period and
                 investigated if particular characteristic signals could be applied to influenza during the
                 incubation period. Preliminary work demonstrated that pulse waves could generate
                 signals using this technology that would be worthwhile for future research.
                         A small amount of analytical data from common cold existed previously. The
                 data structure is based on the idea that a single pulse wave at differing physiological
                 conditions would have slight modifications that would be amplified and presented by
                 various geometrical shapes after extensive data are accumulated. These geometric
                 shapes can then be sliced vertically or horizontally to extract data during different
                 illness stages.
                        The significance of these findings are impressive; from a personal or a public
                 hygiene perspective, this analytical technology provides many benefits, such as rapid

            © 2017 by the author(s). Distributed under a Creative Commons CC BY license.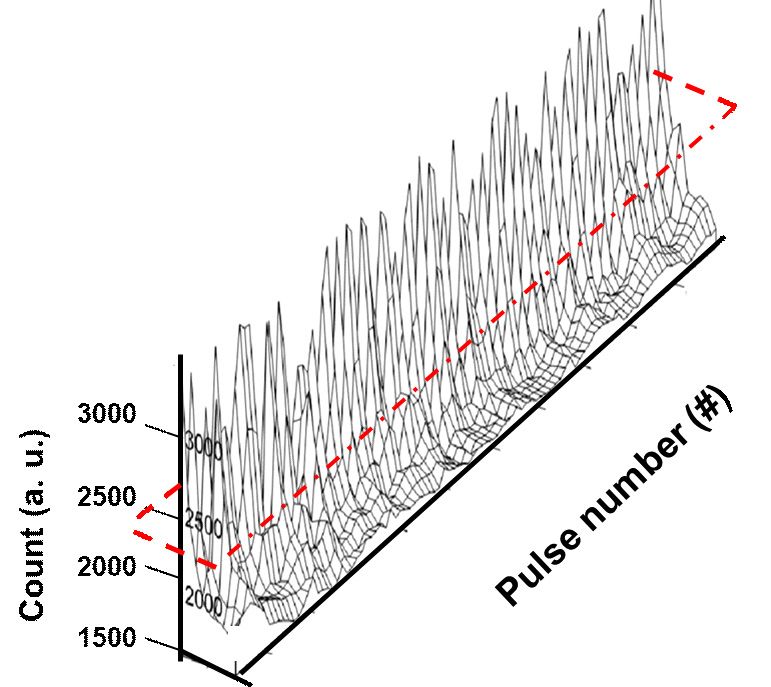
Preprints (www.preprints.org) | NOT PEER-REVIEWED | Posted: 20 October 2017        doi:10.20944/preprints201710.0137.v1

                 and precise decision-making that can be directly visualized or can be analyzed using
                 software programs. Also, this technology also uses futuristic wearable technology that
                 brings practical problem solving to physiology.

                 Keywords: influenza; pulse waves; incubation period; rapid diagnostic tests;
                 coincidence analysis
Preprints (www.preprints.org) | NOT PEER-REVIEWED | Posted: 20 October 2017           doi:10.20944/preprints201710.0137.v1

                 1. Introduction
                   Pulse wave detection via tactile pressure has always been used as a diagnostic
                 method in Chinese medicine. The development of modern medical equipment allows
                 us to understand the roles of and relationships between the nervous system and
                 different organs in the human body.
                        Current clinical research indicates that the shape of the pulse wave is primarily
                 influenced by pressure created when the heart pulses, arterial wall flexibility, blood
                 vessel resistance, blood viscosity, and other related factors. The arterial system is
                 highly branched; if pulse waves encounter changes in the arteriole transverse surface
                 area (e.g., the arterial tube is narrow, branched, or with sharp ends) or arterial wall
                 flexibility while propagating along the arterioles, a partial reflection of pulse waves is
                 induced. Therefore, taking a pulse by using tactile sensation detects the sum of
                 incoming waves from the heart and all reflective waves after a delay. Thus, pulse
                 waves represent the physiological signals of life that provide different information for
                 sickness, health, and other physiological conditions. The heartbeat is the key to
                 human survival, and the pulse can not only identify physiological conditions but also
                 be used to analyze human behavior. For example, dramatic increases in the heart rate
                 and blood pressure occur during exercise, anxiety, and public speaking. Many
                 physiological states can be detected from the pulse. Thus, pulses can not only reflect
                 individual health status but also determine emotional fluctuations, physical activity,
                 and other physical or environmental changes.
                        When the human viscera is healthy, the arterial tree resonates at a certain
                 frequency, causing pressure waves to be transduced from the aorta to the arterioles
                 through pulse waves that gradually decrease at capillary joints. When humans become
                 ill, capillaries become blocked, resulting in changes in the aortic and arteriole
                 flexibility and resistance, and as pressure waves propagate to sick regions, abnormal
                 changes are reflected back. Therefore, different reflective waveforms are created
                 when changes in visceral responses occur with changing symptoms, and each
                 reflective wave has the characteristics of the corresponding illness. However,
                 detecting pulses by using tactile sensation requires very sensitive fingers, extensive
                 doctoral training, and is subjective. By contrast, small physiological characteristics
                 stimulated by physical activity are more easily observed on pulse images (i.e.,
                 changes in the shapes and intervals of wave fluctuations).
                                Influenza, also known as nasopharyngitis or acute nasopharyngitis, is
                 very contagious and infects many people each year. Symptoms can be severe and
                 include nasal congestion, runny nose, and fever. Fever results from the severe
                 inflammation of the upper respiratory tract, which can cause dizziness, headache, sore
                 throat, chills, nausea, inappetence, and weakness. Patients with these symptoms are
Preprints (www.preprints.org) | NOT PEER-REVIEWED | Posted: 20 October 2017           doi:10.20944/preprints201710.0137.v1

                 usually categorized as having cold or influenza. The “common cold” is a respiratory
                 illness caused by several types of viruses, and although cold is usually present during
                 the early winter, infections can occur in any season. Influenza is caused by only an
                 influenza virus, whereas cold can be caused by several different viruses. Influenza is
                 an acute respiratory infectious disease that dwells in the respiratory tract and is passed
                 among individuals through saliva during coughing or sneezing episodes. The
                 influenza virus is very robust and mutates easily. Therefore, even if someone has
                 previously been infected with influenza, that person can be reinfected, creating
                 situations where huge outbreaks occur, called influenza pandemics. Pandemics often
                 occur during winter and spring, and individuals have a 20%–40% chance of catching
                 the flu each season. Although flu is common, there is no effective method to predict,
                 control, and manage flu at its various stages. Therefore, efficient monitoring and
                 prevention methods are needed to effectively manage influenza.
                            The autonomic nervous system (ANS) is a self-regulating nervous system.
                 Its function is to regulate, control, and maintain the body at stable and pleasant
                 physiological conditions. The term “autonomic” means involuntary control of nerve
                 activities through consciousness. The ANS controls essential physiological functions,
                 such as heartbeat, respiration, blood pressure, digestion, and metabolism. ANS can be
                 categorized into (1) the sympathetic nervous system and (2) the parasympathetic
                 nervous system. The sympathetic nervous system mainly functions in initiation and
                 excitation, and the parasympathetic nervous system plays a role in resting and
                 rehabilitation.
                        Recent research studies found that ANS activity may can be measured through
                 the use of using heart rate variability analysis (HRV) analysis, which is an indicator
                 named the heart rate variability (HRV), or so-called the heart rate variability analysis.
                 HRV is a method that used to of measuring the level of consecutive changes in the
                 heart rate changes, and which suggests that in addition to . The idea is that, apart from
                 its own regular electrically-induced beating beats, the heart is also regulated by the
                 ANS. For In the past twenty 20 years, many articles studies have indicated that there
                 is the significant relationship between the ANS and mortality exists that are caused by
                 results from cardiovascular diseases, for example such as sudden death [1] ,
                 hypertension [2], hemorrhagic shock [3], and septic shock [4-6],
                       HRV predict mortality rates related to certain cardiovascular diseases, can be
                 grouped into time and frequency domains, and is most commonly computed as a
                 series of R-to-R peak interval (RRI) times through electrocardiography. HRV usually
                 excludes arrhythmias and other markedly abnormal rhythmic diseases and targets
                 minor heart rate variations with normal heart rhythm.
Preprints (www.preprints.org) | NOT PEER-REVIEWED | Posted: 20 October 2017 doi:10.20944/preprints201710.0137.v1
In 1965, when Hon and Lee initially described HRV [7], they described a
method that could detect changes between pulses in consecutive heartbeats. HRV
aims to measure changes in the rate and regularity of a heartbeat; however, many
factors can affect HRV, including age, sex, ethnic group, and other pathological
factors, such as myocardial infarction, diabetes, and heart failure. In 1981, Akselrod et
al. defined the relationship between the parasympathetic nervous system,
parasympathetic activity, and heart rate. They believed that the ANS was directly
responsible for regulating the heart rate and that it influenced frequency fluctuations,
such as arterial blood pressure. Normal heartbeats are affected by ANS regulation and
can produce fluctuations that can disappear with maladjustment of the ANS.
When this occurs, the heart rate becomes regular and without fluctuations.
These heart rate fluctuations are recognized as ANS heart abnormalities. Appropriate
HRV standards were developed by the European Society of Cardiology and the
Cardiac Electrophysiology Society of North America to ensure future research
directions and included names and terminology, measurement methods, defined
physiological and pathological correlations, and appropriate description of clinical
applications.
To date, many studies have reported that ANS activity during rest and exercise
is significantly different. Ivanovv et al. [8] compared healthy individuals with patients
with heart disease and astronauts in severe environments to evaluate differences in
HRV parameters while being awake and asleep.
HRV refers to the analysis of heartbeat frequency and the extent of the
heartbeat interval distance change. Most studies have indicated that HRV is a
relationship between the balances and checks between the ANS and the
cardiovascular system. Thus, we can learn from HRV experimental results that
different outcomes can be obtained during physiological responses to influenza. Most
HRV analyses are extracted directly from changes in RRI times to obtain meaningful
physiological signals and are feasible.
Our research team aimed to examine at “the incubation period of influenza” in
particular and for personal its physical health and public health issues. As well as
operational investigations had also been ongoing for many years and had obtained
preliminary results. To analyze physiological information, In addition, our team also
took this opportunity to developed a physiological information analysis platform to
analyze physiologic information that possessing the following five characteristics,
including: (1) easy to operate, ; (2) easy to disassemble and assemble, ; (3)
programmable, ; (4) easily to acquire physiological signals, with the opportunity to
amplify the signals, ; and (5) non-invasive, these features allow a portable method to
obtain can basically be used to do the basic pulse wave measurements. In thisPreprints (www.preprints.org) | NOT PEER-REVIEWED | Posted: 20 October 2017 doi:10.20944/preprints201710.0137.v1
experiment, we used ANSWatch®, a novel multi-functional wrist physiological
monitor [9], which was used in order to collect pulse waves at the wrist joint,
coincidence analysis was then captured and analyzed. then use the big data analysis to
capture ‘the flu incubation period’ signals, arranging the pulse waves possessing the
same baselines at equal intervals were arranged to for overlapping, making causing
geometric patterns obtained after the data were as overlapped to create a basis for
judgment basis for ‘the flu incubation period” distinction.
The current study differs from many conventional studies in that it uses a
single-pulse amplitude using a large number of stacked numbers that are magnified
into different geometric shapes, for which different vertical or cross-sectional cuts can
be used to capture criteria to be used in the diagnosis of the “influenza incubation
period.” We hope to demonstrate that pulse waves can be used in big data analysis and
that the development of a “flu signal latency difference” using pulse waves as the
backbone can be achieved. The common cold is a viral infection that causes physical
discomfort, headache, nasal congestion, and coughing; it is also known as respiratory
tract infections, including acute rhinitis, acute pharyngitis, acute laryngitis, and other
diseases in medical terms. If cold is not actively treated, it may cause exacerbations,
such as acute bronchitis and acute pneumonia.
Some colds may also appear abdominal Bay, diarrhea, and other symptoms,
named stomach influenza. The onset of a cold causes many symptoms including (1)
sore throat, (2) swallowing difficulty, (3) breathing difficulty, (3) tonsillar hypertrophy,
(4) pharyngeal swelling, (5) speaking with a twang, and (6) difficulty in opening the
mouth. These physiological responses, in theory, do not generate characteristic pulse
wave signals. However, because most of the physiological discomfort experienced in
cold acts through the ANS, which can relieve some body movements associated with
the illness, capturing characteristic signals with big data analysis of pulse waves
becomes feasible.
We used the coincidence analysis method to diagnose patients infected with
influenza in preclinical stages as a rapid diagnostic test. This test can determine if a
patient with influenza is already infected with the virus by using signals in the big
data analysis of pulse waves. This study proposes to use big data pulse wave analysis
in a new way. The disease analysis algorithms used in this study are different from
many conventional methods used. The overall structure uses a single pulse wave
under various physiological conditions that show slight differences. These small
differences were amplified using many stacking processes, exhibiting various
geometric shapes that can be vertically or horizontally cut to identify all stages of cold
or influenza.Preprints (www.preprints.org) | NOT PEER-REVIEWED | Posted: 20 October 2017 doi:10.20944/preprints201710.0137.v1
2. Methods
2.1 Participants
We recruited 38 men and 35 women (aged 20–-40 years old) to prevent the
impact effect of gender sex and age on HRV testing. Pulses were taken for for the
experiment. The time spent sampling the subject’s pulse was 0.005 seconds, and the
sampling frequency was 200 Hz. The measurements were taken time was set
between 22:00- and 23:00 hours coordinated universal time (UTC) daily, for and
measured for five minutes each time (considered a “measurement unit”) each time
as a measuring unit. To be included in the study, Subjects participants subjects were
required to complete a normal routine each day without sleep, were not must undergo
a day’s normal routine without sleep in order to be tested, and they are not allowed to
do intense exercise intensely, or to engage in any activity that would result in exercise
or any behaviors which may cause them to be in a highly mentally excited state an for
one1 hour before the experiment, , and were required to wear the subjects will wear
the pulse pulse-measuring device in advance before throughout the testing.
Because completely awake and completely asleep states exist, physiological
data for each state was captured for 2 minutes. During each measurement, 128
heartbeats were sampled 20 times. Participants were placed into three groups (A, B, or
C) with 20 people in each group; none were undergoing medical treatment, and all
were in good health. In addition to the aforementioned restrictions, participants were
not allowed to stay up late the night before or eat food 1 hour before testing to ensure
data objectivity.
2.2 Experimental equipment and materials
The hardware included a laptop, a Rhythm Masters wrist monitor (ANSWatchâ),
a timer, a scale, and a subjective measuring and recording questionnaire. Software
equipment included an ANSWatch Manager Pro data analysis system and an Excel
statistical program.
The Rhythm Masters physiology wrist monitor recorded measurements, as
shown in Figure 1. If blood pressure and HRV were measured, eight physiological
parameters could be obtained in 5 minutes, including SYS, DIA, HR, HRV, LF (NU),
HF (NU), LF/HF, and irregular heartbeats. After completion of testing, the
abovementioned physiological parameters were displayed on the LCD screen. Up to
50 tests could be stored on the pdf .
The physiology wrist monitor must be worn on the left wrist, and the height
should be measured at approximately the position of the heart. Participants were not
allowed to move while measurements were being recorded. The monitor was labeled
with (a) to designate the front side and (b) to designate the backside so that the reader
could recognize the correct position of the monitor. The center line should align withPreprints (www.preprints.org) | NOT PEER-REVIEWED | Posted: 20 October 2017 doi:10.20944/preprints201710.0137.v1
the index finger in extension.
Figure 1 New physiological wrist monitor: Rhythm Masters (ANSWatchâ). This
monitor must be worn on the left wrist, and the height should be measured
approximately at the position of the heart. Testing lasted 5 minutes, and participants
were not allowed to move while measurements were being recorded. (a) the front side
of the monitor and (b) the backside of the monitor.
3.0 Results and Discussion
3.1 Influenza Investigation
“The common cold is a self-healing limiting illness [10-13],, the common cold being
divided into ‘cold’ and ‘influenza’ whereas influenza is a more a severe illness.
Overall, the term unlike a common cold, influenza can be associated with more severe
symptoms, “common cold” should not be confused with influenza, the latter being
more obvious and serious than the former, and also possesses additional symptoms in
comparison to the former, such as fever, chills and , muscle muscular pain, and more
severe systemic symptoms are more obvious. Influenza can be fatal to those in
patients with poor weak immunity (mostly infants, and young children, and thePreprints (www.preprints.org) | NOT PEER-REVIEWED | Posted: 20 October 2017 doi:10.20944/preprints201710.0137.v1
elderly people). The difference between the two is that common cold is caused by
rhinovirus, whereas influenza is caused by influenza is caused by influenza virus the
influenza virus causes influenza [14-18], as a comparison of these illnesses is listed in
Table I. Comparison of the differences of the common cold and influenza. Influenza is
very contagious, and the viruses usually travels by droplets in the air, contact between
people, or spread by being through contact with contaminated items, . and it is a
contagious disease. It is Influenza viruses are composed of RNA viruses belonging to
within the family Orthomyxoviridae. mucus viral family. Every year, the influenza is
popular prevalent during the temperate fall and winter seasons, . Sand serious
complications associated with the virus viral infection has led to a higher mortality
rate in critically ill patients.
Figure 2. The “flu” can cause physical discomfort, headache, nasal congestion, cough,
runny nose, and other symptoms.Preprints (www.preprints.org) | NOT PEER-REVIEWED | Posted: 20 October 2017 doi:10.20944/preprints201710.0137.v1
Table I. Common symptoms of cold and influenza illnesses
Influenza Cold
Vulnerable October every year to March; October
Non-seasonal
period is one yearly, but spring can be
Outbreak
process Sudden Gradual
Systemic Severe systemic symptoms with light No systemic symptoms with severe
Condition respiratory symptoms local symptoms
Frequent, and with temperature above
Fever
38.3℃, maintained for three to four Rare
Condition
days
Discomfort Frequent Slight to moderate
Headache Severe Rare
Cough Sometimes severe Dry cough
Sneezing Occasional Often
3.2 The importance of latency research
From a public health management perspective, the incubation period is a critical
period before an outbreak occurs, and finding a characteristic signal to identify
infection is the primary goal. Currently, the main diagnostic test is a rapid diagnostic
blood test and a test measuring viral RNA. These procedures require at least 24 hours,
are time consuming, and expensive, which considerably reduce virus prevention
efficiency. A more effective rapid diagnostic test is needed. The new test developed
should be (1) simple, (2) can be implemented on a large scale, and (3) noninvasive.
Influenza viruses mutate easily, are highly contagious, and often cause epidemics.
Figure 3 shows the complete cycle of influenza infection and defines the incubation
period. In general, because influenza viruses are transmitted through air, speaking,
coughing or sneezing, once a person is infected, the incubation period is short,
approximately 1–3 days [19-23]. The onset of clinical symptoms can also be after
approximately 7 days. Because infectious viral diseases spread and proliferate in the
host, the best strategy to effectively treat this disease is to test as soon as the first
evidence of disease is seen. If a person can be tested during the incubation period,
they can be quarantined and treated, which is the only effective response to infectiousPreprints (www.preprints.org) | NOT PEER-REVIEWED | Posted: 20 October 2017 doi:10.20944/preprints201710.0137.v1
viral diseases, such as influenza.
Healthy carrier (incubation period)
Normal Window period Self-recovery
Lung inflammation
Infected by virusAntibody produced Pathogenesis
Figure 3. The complete cycle of influenza and definition of the incubation period
Most recovery from influenza occurs within 1 week to 10 days [19-23], but some
people develop severe lung infections, such as bacterial pneumonia or bronchitis.
Differences between influenza infection and other viral diseases and intestinal
diseases exist [24-26]. Diarrhea, nausea, and vomiting are often mistaken as influenza.
However, influenza usually does not affect the intestines, although approximately
25% of the infected individuals show signs of nausea, vomiting, and diarrhea [27-32].
Influenza is usually caused by three viral types: influenza A, B, and C [33-39]. Type A
occurs once every 10–40 years and can cause worldwide epidemics. Type B has a
more limited reach. Type C occurs less often, and its symptoms are mild; it is a very
stable virus. Type A and B viruses mutate frequently. A new epidemic occurs once
every couple of years. Malignant virus strains occur in a localized manner and usually
occur approximately once every 3 to 15 years. Once infected with influenza, people
produce antibodies against the virus, but these antibodies are defenseless against any
new strains of the virus. The highest risk groups to have severe complications are
those between 6 months and 2 years and those aged 65 years and older. Nursing home
residents and patients in chronic care centers are also at a high risk of complications.
3.3 Study of pulse waves
Because the pulse is the heart and its accompanying counteractive interactions,
a series of actions and reactions causing fluctuations can occur. This process includes
(1) the beating of the heart valve induced by the rush of blood sent out by the heart, (2)
the beating of arteries caused by the rush of blood sent out by the heart, (3) the
rebounding waves of arteries due to the impact of blood sent out from the heart, (4)
the backtracking waves produced by blood sent out by the heart, which then runs
through the aorta and into smaller arteries, and (5) the expansion and retraction ofPreprints (www.preprints.org) | NOT PEER-REVIEWED | Posted: 20 October 2017 doi:10.20944/preprints201710.0137.v1
arterial walls during rhythmic diastolic and systolic heartbeats. All pulses can be
detected through the artery near the skin surface. These fluctuations cover a complete
body cycle; thus, signals of the body and heart get recorded in the process.
A test that is very similar to the measurement of pulse waves is
electrocardiography (ECG). ECG records electrical activity of the heart in terms of
time through electrodes on the chest skin. The working principle of ECG is that when
myocardial cells depolarize during a heartbeat, minimal electrical changes occur on
the skin surface, and these small changes are captured as tracing by the
electrocardiogram. When myocardial cells are in the resting state, differences in the
concentration between positive and negative ions on each side of cells produce a
potential difference. When the potential difference of myocardial cells rapidly
changes to zero, depolarization occurs, which causes contraction. In the cardiac cycle
of healthy hearts, depolarization waves are produced by the sinoatrial node cells and
are transmitted through the heart; they are first transmitted to the atrium and then to
the ventricles. If two electrodes are placed randomly on each side of the heart, small
voltage changes can be recorded, which are displayed on an ECG monitor and traced.
ECG recordings can reflect the entire rhythm of the heart, including that the weakest
cardiac muscles. However, ECGs have four disadvantages: (1) electrode pads cause
inconvenience and discomfort, (2) the machine is large and is not portable, (3) female
participants were unable to could not be measured tested in a comfortable
environment due to the clothing they wear, and (4) only certain information can be
obtained from ECG recordings. By contrast, pulse wave technology does not have
these problems, and because it is portable, individuals can have their pulse waves
measured daily and continuously until they are infected with influenza and a doctor
confirms the disease. Due to previous more basic pulse wave measurements looking
at common cold, the corresponding disease symptom information can be used to
precisely determine the exact point at which the incubation period starts. If big data
stacking analysis is performed on basic measurements that correspond to the
incubation period, it is realized that these techniques have a significant application
based on the idea that such techniques can transform signals of touch into signals of
three-dimensional (3D) vision. These can occur through complete pulse wave capture,
and the completion of one-dimensional arrangements and 3D vision stacking. Touch
sensation in identifying pulse is not easily understood by many people, machines, or
computers, but the transformation touch sensation into 3D visionary effects is a
technique that people, machines, and computers can understand. Figure 4 shows two
types of signals related to the heart pulse are displayed, Figure 4(a) shows a type one
heart signal using electrocardiography, and Figure 4 (b) shows a type two heart signal
using the ANSWatchâ. One can see that the (a) and (b) provide information inPreprints (www.preprints.org) | NOT PEER-REVIEWED | Posted: 20 October 2017 doi:10.20944/preprints201710.0137.v1
different forms. With the preliminary data available, data translation from the second
type of heart signal (pulse waves) can be performed.
Figure 4. (a) Type one heart signal: electrocardiography (b) Type two heart signal:
pulse wave
3.4 Congruence analysis and the study of pulse waves
Figure 5 describes the three things completed before capturing heart pulse wave
data in our study: (i) pulse wave measurement, (ii) complete pulse wave excision, and
(iii) equidistant stacking of pulse waves on the same axis. Completing these three
activities presents the entire pulse wave signals in a 3D stereoscopic image. Current
studies on pulse wave technology use HRV and physiologically related measurements.
However, through careful observation, we found that when RRI times change, pulse
wave shapes also change gradually. If we record all complete wave changes and
couple those with the effect of big data 3D stereoscopy, a higher number of signals
can be displayed. Information garnered from these signals includes pulse wave
steepness, amplitude, width, and density intervals. Such information can allow one to
create even more physiological signal algorithms.
Figure 5. (a) partial information about basic pulse wave measurements, using
360 pulse waves recorded in 5 minutes. The study used R-to-R peak interval (RRI)
times to reveal physiological information. However, as can be seen in this figure,
more valuable information is hidden within the data, such as that complete pulse
waves represent key physiological signals by taking an entire pulse wave starting
from its baseline to find applicable methods. Figure 5 (b) shows the process of
capturing pulse waves. After deciding on which sampling number to use, the sampling
software locates the position from the top of the R peak, and with that can define the
position at which the pulse wave can be captured from the minimum R peak value.
Once the pulse waves are captured, the method of application can be determined.
Figure 5 (c) shows a straightforward alignment of captured pulse waves equidistant
along the same axis. Such alignment gives interesting results because alignment and
stacking create shapes that are similar to that of a mountain. With this method, pulsesPreprints (www.preprints.org) | NOT PEER-REVIEWED | Posted: 20 October 2017 doi:10.20944/preprints201710.0137.v1
detected using the touch of a finger will be transformed into three-dimensional data,
which would allow people, computers, and machines to gain a better understanding of
such signals. Many different criteria can be applied to the analysis of “wakefulness
and drowsiness” or “uninfected and infected.”
RRI R peak
cut cut cut
(b) cut
____
C om posite
(c)
Count (a. u.)
Figure 5 Three actions are completed before computing information captured from
pulse waves: (a) pulse wave measurements, (b) complete excision of pulse waves, and
(c) equidistant stacking alignment of pulse waves along the same axis.
3.5 Reliability of the congruence analysis
Data captured while generating different numbers of pulse waves causes the
most concerning issue when performing the equidistant overlapping alignment of
pulse waves along the same axis. In case of inconsistent visual effects after alignment,
we captured two different numbers from the basic data (50 or 70 pulse waves) and
also checked to see if the number of pulse waves captured affected the final result. If
both tests passed, then other capture numbers should not interfere with the final
results.
Figure 6 shows the capture and exportation of 50 and 70 pulse waves for
alignment. This figure indicates that equidistant overlapping of pulse waves along the
same axis can transform planarized data into three-dimensional images, which
increase and enrich the readability of all the information acquired from pulse waves.Preprints (www.preprints.org) | NOT PEER-REVIEWED | Posted: 20 October 2017 doi:10.20944/preprints201710.0137.v1
Such data enrichment presents the HRV of every pulse wave in a more detailed
manner. In other words, for all small HRV signals, our team developed functions that
allow us to rotate or tilt the overlapped graphics along a certain axis, resulting in
equidistant and overlapping alignment along the same baseline and axis and allowing
us to perform a detailed inspection of every three-dimensional image. These images
indicate that regardless of pulse wave number used to transform the three-dimensional
images, the effects are the same.
(a)
3000
Count (a. u.)
50
2500 40
30 #)
r(
2000 20 be
10 n um
1500
ulse
0 P
Pulse
(b)
3000
Count (a. u.)
2500
70
2000
50 60 )
1500 40 r (#
30 be
20 n um
Pulse 0 10 P ul
se
Figure 6. The capture and exportation of basic data from (a) 50 and (b) 70 pulse
waves were gathered to perform equidistant and overlapping alignment along the
same baseline and axis.
3.6 Analysis of pandemic influenza pulse waves
3.6.1 Analysis of combined double influenza pulse waves
We then compared the exportation of two neighboring pulse waves from healthy
people and patients with influenza. Figure 7 shows that after an influenza diagnosis,
all the basic data obtained each day were compared to find common factors.
Consecutive pulse waves from the healthy and infected stages of one influenza patient
by comparison of graph wave curves were recorded. We found that the pulse wave R
peak amplitude was more uniform, shorter, and wider in the asymptomatic stage
compared with wave slopes that were less steep and more complete (R, S, T, U, and V
waves) in the symptomatic stage. Therefore, the total length of each wave was longer,
and the R wave amplitude was higher in the symptomatic stage than in thePreprints (www.preprints.org) | NOT PEER-REVIEWED | Posted: 20 October 2017 doi:10.20944/preprints201710.0137.v1
asymptomatic stage. Furthermore, after patients are infected, individual small pulse
waves (U and V) are covered by the following R wave, which appears in the complete
pulse wave curve graphs.
Comparing the exportation of two neighboring pulse waves of “healthy person
and flu patient”, Figure 7 indicates that after the flu patient has been confirmed by the
doctor as being infected by the influenza, all of the basic measured data obtained each
day are compared for common evidence. Figure 7 shows consecutive pulse waves
from the healthy stage and the infected stage of the same flu patient, through
comparison fo the wave curves in the graph, it was found that the pulse wave R peak
amplitude is more uniform and shorter and more fat for the healthy stage, and the
slope of the complete waves are less steep and more complete (R, S, T, U, V waves),
therefore the total length of each wave is longer, yet on the contrary, the R wave
amplitude average height for the infected stage is higher than that of the healthy stage,
also the change in height of the R wave amplitude is far greater. Furthermore, after the
subjects are infected with the flu virus, certain small pulse waves (U, V waves) will be
covered by the next R wave that is to appear in the complete pulse wave curve graphs.
Influenza
Health
Figure 7. Shapes of consecutive pulse waves recorded during the healthy (red
curve-line) and symptomatic stages of influenza (blue curve-line)virus infection in the
same infected individuals.
3.6.2 Analysis of double pulse waves during influenza virus infection
If we reorganize the data in Figure 7 and separately draw curves of healthy
stages and symptomatic stages, as seen in Figure 8 (a), the pulse wave curve during
the healthy stage can be observed more clearly. The surface area is also enclosed byPreprints (www.preprints.org) | NOT PEER-REVIEWED | Posted: 20 October 2017 doi:10.20944/preprints201710.0137.v1
the connection between the left and right base points of the R wave (defined as A),
and the surface area enclosed by the lowest connection point after reduction of A is
defined as B. Figure 8 (a) shows that the ratio of the R wave area, A, and the reduced
area, B, in the asymptomatic stage is 1:4, and Figure 8 (b) shows that the same ratio in
the symptomatic stage is 1:2.5. R waves represent the left ventricular beat cycle
during one heartbeat; therefore, the R wave surface area A could be defined as the
blood volume pumped out of the heart in every beat. The curve graph in Figure 8 (b)
could indicate the time at which the influenza virus already infected the body; the
ANS adjusts the heartbeat cycle to a larger left ventricular beat and a faster heartbeat
frequency.
(a)
3000
A
A
Count (a. u.)
2500 B
B
2500
1500
Pulse
3000 (b)
A A
Count (a. u.)
2500
B B
2500
1500
Pulse
Figure 8. The curve graph of consecutive double pulse waves from (a) the healthy and
(b) symptomatic stages of influenza virus infection in the same patient (as in Figure 6).Preprints (www.preprints.org) | NOT PEER-REVIEWED | Posted: 20 October 2017 doi:10.20944/preprints201710.0137.v1
3.7 Congruence analysis of influenza infection pulse waves
The discussions and presentations in the previous sections have allowed us to
understand a few of the pulse waves seen during the asymptomatic and symptomatic
stages of influenza infection. Based on the discussion in Section 3.5 and after
individuals were diagnosed with influenza infection, our research team exported 60
pulse waves from the daily basic measured data. Figure 9 (a) shows the equidistant
overlapping alignment of 60 pulse waves from the individuals in the asymptomatic
stage of influenza infection captured along the same baseline and axis. 3D image
curve graphs showed that after big data stacking of asymptomatic stage pulse waves,
the height decreased portion by portion. By contrast, in Figure 9 (b), data from 60
pulse waves exported during 5 minutes at the symptomatic stage of influenza
infection, and 3D image curve graphs revealed a steep, uneven angle distribution and
a vertical drop to the base of the curve.
(a)
Count (a. u.)
3000
2500
2000 50
40
1500 30
20
10
0
(b)
Count (a. u.)
3000
2500
2000
1500 40 50
30
10 20
0Preprints (www.preprints.org) | NOT PEER-REVIEWED | Posted: 20 October 2017 doi:10.20944/preprints201710.0137.v1
Figure 9. Sixty pulse waves from basic data captured using equidistant overlapping
alignment along the same baseline and axis from (a) the healthy and (b) symptomatic
stages of influenza virus infection in the same patient (as in Figure 6).
Figure 10 shows the same graph as that shown in Figure 9 with a 45° rotation
along the Y axis. By performing this inspection, we confirmed that the line produced
from 3D images were single straight lines. Figure 10 (a) and (b) shows that the lines
of the 3D mountain-like shape were both straight and coherent.
(a) (b)
Figure 10. Using the same data as used in Figure 9, data were rotated at 45° along the
Y axis from (a) the healthy and (b) symptomatic stages of influenza virus infection in
the same patient (as in Figure 6)
3.8 Discussion of cross-sectional graphs of coincidence analysis concerning
influenza virus infection
Figures 10 and 11 confirm that patients infected with influenza virus have easily
recognizable differences when comparing healthy versus symptomatic stages of
infection. Although these differences are seen at only a few points in only a few of the
pulse waves and shapes, five differences are found when these minor differences are
analyzed using coincidence analysis (1) amplification, (2) highlights, (3) contrast, (4)Preprints (www.preprints.org) | NOT PEER-REVIEWED | Posted: 20 October 2017 doi:10.20944/preprints201710.0137.v1
easy visualization, and (5) easy recording and downloading. The resultant 3D image
produced is completely stacked. Figure 11 (a) shows pulse waves from the basic data
measured from patients with confirmed influenza infection and who were in the
symptomatic stages of infection. The image was obtained from the exportation of 70
pulse waves, with a superimposed arrangement of basic data and 3D images. The
narrowness of the R wave, and the range, steepness, and shortening of the pulse wave
amplitude are pulse waves that identify influenza-infected patients. As shown in
Figure 11 (a), we attempted to find physiological signals that were exclusive to the
incubation period of influenza is very sensitive. We obtained cross- sectional slices of
3D images, and when the plane view of the upper section was removed from half of
the average height of the mountain-like 3D pulse wave image, inspection of the image
performed.
In Figure 11 (b), we can see that the view obtained after cross-sectioning the 3D
image has a large number of closed circles distributed on the edge, which come from
differences in 70 exported R waves. Figure 8, we show that when the body is invaded
by a virus, the ANS activates the immune system in an attempt to attack the virus and
also performs two other functions: (1) it accelerates the heartbeat cycles and increases
the strength of the large left ventricle to pump out blood and (2) it accelerates the
homeostatic rate, which is subject to changes in left ventricular strength. These two
factors cause the R wave height and width to become inconsistent during the
influenza incubation period, enabling viral counteracting and immune activating
waves to occur in a short period. The heart works with these counteracting waves,
needing to pump out more blood than usual. The R wave width becomes narrower to
increase the heart rate, and the height of the R wave increases to increase the amount
of blood pumped by the left ventricle.
½h
(a) (b)
70
60
50 70
Count (a. u.)
40 60
30
50
20 40
Count (a. u.)
10 30
0
Puls 20
e
Half 10
h eigh
t
Puls 0
e
c ut
Figure 11. (a) Seventy pulse waves in an overlapping arrangement exported fromPreprints (www.preprints.org) | NOT PEER-REVIEWED | Posted: 20 October 2017 doi:10.20944/preprints201710.0137.v1
basic data measured in influenza-infected patients. (b) Cross- sections of the upper
half of a stereoscopic image, revealing a large number of small close circles
distributed over the edge.
3.9 A rapid diagnostic test to identify the incubation period of influenza virus
infection
The template of this study used basic data collected from influenza-infected
patients, who were asymptomatic, and followed them until they became symptomatic.
This basic data involved collecting pulse wave data for 5 minutes and then storing the
data in a database each day. The data were then traced back from the date of symptom
onset because the influenza incubation period is usually 3–4 days before the onset of
flu. We investigated the physiological signals of influenza virus infection during the
incubation period and used software that could perform (1) equidistant overlapping
alignment along the same baseline and axis and (2) stereoscopic cross-sections of data.
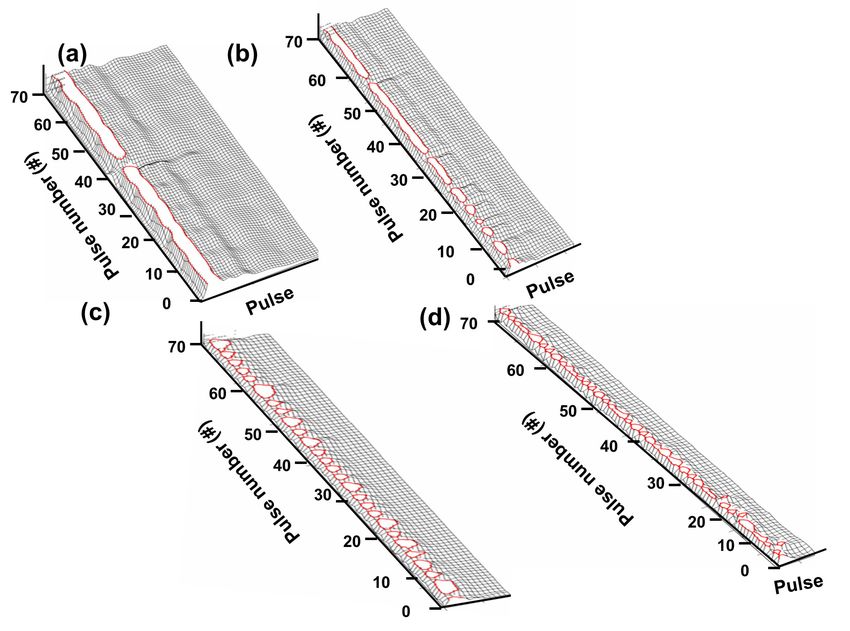
The first day of the incubation period (Figure 12 (b)) showed differences in
cross-sectional images compared with those of the asymptomatic stage. Figure 12 (a)),
which included (1) shortening of the complete pulse wave amplitude, (2) shortening
of the R wave baseline, and (3) multiple breakpoints at the outer edges of the
cross-sectional platform, forming many small closed circles. On the second day of the
incubation period (Figure 12 (c)), the three differences of the cross-sectional images
were even greater compared with the asymptomatic stage. On the third day of the
incubation period, (Figure 12 (d)), the cross-sectional images revealed that the
complete pulse wave amplitude was one third of that of the asymptomatic stage;
however, the most obvious signal was similarly sized small closed circles throughout
the outer edges of the cross-sectional platform. We therefore concluded that the outer
edge of the cross-sectional platform is the candidate signal for the influenza
incubation period. In Chinese medicine, when palpating the pulse on an individual’s
wrist, a floating pulse is considered diagnostic for influenza. A floating pulse of
Chinese medicine is defined as a strong pulse that is easily taken, but that can be
reduced when forceful pressure is applied. Pyrogens cause increased, irregular heart
and metabolic rates to generate body heat, causing blood vessels on the body surface
to dilate. A relative increase in blood and lymph volumes occurs after an influenza
infection, causing the floating pulse to appear. Another pulse classification in Chinese
medicine is a “full” pulse. This pulse “full of energy” and is indicated by an increase
in breathing and body temperature. When the immune system competes with viruses
(vital energy vs. pathogens), especially at the skin surface, capillaries dilate, releasing
many immunoglobulins, which increase body temperature and initiates the early
stages of a viral infection (the incubation period). Regarding pulse waves, two layersPreprints (www.preprints.org) | NOT PEER-REVIEWED | Posted: 20 October 2017 doi:10.20944/preprints201710.0137.v1
of meaning can be inferred: (i) pulse waves with coincidence analysis can be used to
detect critical incubation period signals during influenza infection and (ii) pulse
waves with coincidence analysis should be measured during the influenza incubation
period. The main reasons for the appearance of closed loops on the cross-sectional
images of the pulse wave after coincidence analysis are the narrowed width and
increased coefficient of variation in every pulse wave. Therefore, the coincidence
analysis of pulse waves revealed in this study is a visualized process of the tactile
pulse used in Chinese medicine. In other words, the valuable Chinese medical wisdom
of tactile pulse responses can be more easily understood using our defined pulse wave
technology. Although few people can learn tactile pulse techniques, many more
people can understand pulse changes using the coincidence analysis of pulse waves.
Future smart medical applications can be developed using this technology.
Figure 12. Characteristic signals of the influenza incubation period showing a
cross-sectional view of stereoscopic images in patients with influenza infection at (a)
the healthy stage, (b) the first day of the incubation period, (c) the second day of the
incubation period, and (d) the third day of the incubation period.Preprints (www.preprints.org) | NOT PEER-REVIEWED | Posted: 20 October 2017 doi:10.20944/preprints201710.0137.v1
3.10 The real reason pulse waves are suitable as rapid diagnostic tests for the
incubation period of influenza
With blood as a medium, the pulse signal is carried and mixed into the last wave
form. However, blood is a none Newtown fluid (non-Newtonian fluid), and its
viscoelasticity changes depending on strain rate, such as temperature, pressure and
RBC concentration. Strain rate mainly affects the aggregation and transformation of
RBC. At low strain rate, red blood cell aggregates form easily when blood flow has
nearly stopped, which results in an increase in frictional resistance in the fluid, and an
increase in viscosity. It is not only related to current state of motion, but also the state
of motion of fluid in the past. In other words, this type of fluid has a memory effect.
Besides the memory effect, the characteristics of a none Newtown
fluid(non-Newtonian fluid) include: (i) easy to operate, (ii) short reaction time and (iii)
good reproducibility. Since the length scale concerned in the project is often much
larger than the distance traveled by moving molecules of fluid, by using a microscopic
(molecular) point of view to study the phenomena in fluid, it is not difficult to solve
the project's problems. Therefore, all molecules of fluid within a small range of flow
field can be considered a fluid element. The scales of fluid elements are much larger
than the scales of motion of molecules of liquid. Every fluid element contains
numerous molecules. It represents the collective behavior and phenomena of all
molecules in the fluid. At this moment, the average characteristics of fluid element,
such as density, concentration and speed can be obtained through statistical averages.
The macroscopic method, that the space being occupied by fluid is considered as
continuous and full of fluid element, is known as the continuum hypothesis. The
effects of temperature and pressure on coefficient of viscosity are (1) the coefficient
of viscosity of fluid will influence pressure change when affected by temperature.
Under normal circumstances, the higher the temperature, the smaller the coefficient of
viscosity of fluid, and the pressure of the blood will become higher. (2) For fluid,
since the molecules are packed relatively close to one another, the cohesion (attraction)
between the molecules is greater. Therefore, cohesion is a major part of the viscous
force of the fluid. Hence, when cohesion becomes smaller as the temperature
increases, the coefficient of viscosity also becomes smaller. Conversely, the
coefficient of viscosity becomes larger when the temperature decreases. The pressure
of the pulse will change rapidly with these fluctuations. Hence, the body temperature
change will cause the pressure to change during the incubation period, which is the
early stage of the influenza virus entering the body, and the pulse waves profile
presents a closed-loop pattern after coincidence. However, another signal wave of the
heart is electrocardiography (ECG or EKG), and the potential change of ECG is not
related to the change in the none Newtown fluid (non-Newtonian fluid) characteristicsPreprints (www.preprints.org) | NOT PEER-REVIEWED | Posted: 20 October 2017 doi:10.20944/preprints201710.0137.v1
of blood. Therefore, since the body temperature change will not cause the potential to
change during the incubation period when influenza virus enters the body, ECG is not
a suitable rapid diagnostic test for the incubation period when the influenza virus
enters the body.
4. Conclusion
To perform physiological analysis, we developed an information platform with
the following five characteristics: (1) easy to operate, (2) easy to disassemble and
assemble, (3) programmable, (4) easily captures and amplifies physiological signals,
and (5) noninvasive. These five characteristics are found using pulse waves with
coincidence analysis.
Our particular emphasis was on using this platform to diagnose influenza during
the incubation period. We proposed an entirely new set of pulse wave coincidence
analysis with algorithms that were different from many conventional methods. The
overall structure use single pulse waves in various physiological conditions that could
detect slight differences and then amplify the differences so that they can be easily
visualized. The data can be easily recorded and combined with other signals and can
be presented in different geometric shapes. Longitudinal or cross-sectional cuts can
also be performed to capture every viral infection stage.
We found significant differences between asymptomatic healthy individuals and
patients diagnosed with early symptomatic influenza infection starting as early as the
incubation period. This analytic method has many advantages, including the ability to
make precise and fast judgments either visually or by using software programs. It is
suitable for future wearable technology. This set of algorithms can complement the
medical diagnostics used in traditional Chinese medicine.
Acknowledgement
We acknowledge funding from the Ministry of Science and Technology under
Contract MOST 105-2223-E-390-063-MY1.
References
1. C.A. Glaser and et al. Medical care capacity for influenza outbreaks, Los Angeles.
Emerging infectious diseases, 8(6):569–574, 2002.
2. M.J. Schull, M.M. Mamdani, and J. Fang. Community influenza outbreaks and
emergency department ambulance diversion. Annals of emergency medicine,
44(1):61–67, 2004.
3. W.M. McDonnell, D.S. Nelson, and J.E. Schunk. Should we fear ”flu fear” itself?
Effects of H1N1 influenza fear on ED use. The American journal of emergencyPreprints (www.preprints.org) | NOT PEER-REVIEWED | Posted: 20 October 2017 doi:10.20944/preprints201710.0137.v1
medicine, 30(2):275–282, 2012.
4. J-P. Chretien, D. George, J. Shaman, R.A. Chitale, and F.E. McKenzie. Influenza
forecasting in human populations: a scoping review. PloS ONE, 9(4):e94130,
2014.
5. E. Nsoesie, J. Brownstein, N. Ramakrishnan, and M. Marathe. A systematic review
of studies on forecasting the dynamics of influenza outbreaks. Influenza and
other respiratory viruses, 8(3):309–316, 2014.
6. Dreifus LS, Agarwal JB, Botvinick EH et al. (American College of Cardiology
Cardiovascular Technology Assessment Committee). Heart rate variability for
risk stratification of life-threatening arrhythmias. J Am Coll Cardiol 1993; 22:
948–50
7. Hon EH, Lee ST. Electronic evaluations of the fetal heart rate patterns preceding
fetal death, further observations. Am J Obstet Gynec 1965; 87: 814–26.
8. Ivanov, I. T., Boytcheva, S. & Mihailova, G. (1999). Parallel study of thermal
resistance and permeability barrier stability of Enterococcus faecalis as affected
by salt composition, growth temperature and preincubation temperature. J
Therm Biol 24, 217–227.
9. Taiwan Scientific Corp., http://www.taiwanscientific.com.tw/index.html.
10. R. Perini and A. Veicsteinas. Heart rate variability and autonomic activity at rest
and during exercise in various physiological conditions, Eur J Appl Physiol,
2003, Volume 90, pp.317-325
11. D. Balcan, V. Colizza, B. Gon¸calves, H. Hu, J.J. Ramasco, and A. Vespignan.
Multiscale mobility networks and the spatial spreading of infectious diseases.
PNAS, 106(51):21484–21489, 2009.
12. D. Balcan and et al. Seasonal transmission potential and activity peaks of the new
influenza A(H1N1): a Monte Carlo likelihood analysis based on human mobility.
BMC Medicine, 7(1):45, 2009.
13. D. Balcan, B. Gon¸calves, H. Hu, J.J. Ramasco, V. Colizza, and A. Vespignani.
Modeling the spatial spread of infectious diseases: The GLobal Epidemic and
Mobility computational model. Journal of Computational Science, 1(3):132–145,
aug 2010.
14. M. Santillana, D.W. Zhang, B.M. Althouse, and J.W. Ayers. What can digital
disease detection learn from (an external revision to) Google Flu Trends?
American journal of preventive medicine, 47(3):341–347, 2014.
15. M. Biggerstaff and et al. Results from the centers for disease control and
prevention’s predict the 2013–2014 influenza season challenge. BMC Infectious
Diseases, 16(1):357, 2016.
16. R.M. Anderson and R.M. May. Infectious Diseases of Humans: Dynamics andPreprints (www.preprints.org) | NOT PEER-REVIEWED | Posted: 20 October 2017 doi:10.20944/preprints201710.0137.v1
Control. Oxford University Press, 1992.
17. E.L. Ionides, C. Bret´o, and A.A. King. Inference for nonlinear dynamical systems.
PNAS, 103(49):18438–18443, 2006.
18. C.L. Barrett and et al. Episimdemics: an efficient algorithm for simulating the
spread of infectious disease over large realistic social networks. In Proceedings
of the 2008 ACM/IEEE conference on Supercomputing, page 37. IEEE Press,
2008.
19. D.L. Chao, M.E. Halloran, V.J Obenchain, and I.M. Longini. Flute, a publicly
available stochastic influenza epidemic simulation model. PLoS Comput Biol,
6(1):e1000656, 2010.
20. S. Merler and M. Ajelli. The role of population heterogeneity and human mobility
in the spread of pandemic influenza. Proc. R. Soc. B, 277(1681):557–565, 2010.
21. J. Ginsberg and et al. Detecting influenza epidemics using search engine query
data. Nature, 457(7232):1012–1014, February 2009.
22. A. Culotta. Towards detecting influenza epidemics by analyzing Twitter messages.
In Proceedings of 1st Workshop on Social Media Analytics (SOMA ’10), 2010.
23. D.A. Broniatowski, M.J. Paul, and M. Dredze. National and local influenza
surveillance through Twitter: an analysis of the 2012-2013 influenza epidemic.
PLOS ONE, 12(8):e83672, 2013.
24. H. Achrekar, A. Gandhe, R. Lazarus, Y. Ssu-Hsin, and L. Benyuan. Predicting Flu
Trends using Twitter data. In 2011 IEEE Conference on Computer
Communications Workshops, pages 702–707, 2011.
25. K. Hickmann and et al. Forecasting the 2013-2014 influenza season using
wikipedia. PLoS Comput Biol, 11(5):e1004239, 05 2015.
26. D.J. McIver and J.S. Brownstein. Wikipedia usage estimates prevalence of
influenza-like illness in the united states in near real-time. PLoS Comput Biol,
10(4):e1003581, 2014.
27. T. Bodnar and et al. On the ground validation of online diagnosis with twitter and
medical records. In WWW2014 Companion, pages 651–656, 2014.
28. P. Chakraborty and et al. Forecasting a moving target: Ensemble models for ili
case count predictions. Proceedings of the 2014 SIAM International Conference
on Data Mining., pages 262–270, 2014.
29. J. Shaman and A. Karspeck. Forecasting seasonal outbreaks of influenza.
Proceedings of the National Academy of Sciences, 109(50):20425–20430, Nov
2012.
30. J. Shaman and et al. Real-time influenza forecasts during the 2012−2013 season.
Nat. Comms, 4, Dec 2013. 318You can also read