Health Research Alliance - Member Organization Author Manuscript Nat Methods. Author manuscript; available in PMC 2020 July 06 - CCSP
←
→
Page content transcription
If your browser does not render page correctly, please read the page content below
Health Research Alliance
 Member Organization Author Manuscript
 Nat Methods. Author manuscript; available in PMC 2020 July 06.
 Published in final edited form as:
 Nat Methods. 2020 February ; 17(2): 175–183. doi:10.1038/s41592-019-0687-1.
Health Research Alliance Author Manuscript

 BIOPHYSICAL PREDICTION OF PROTEIN-PEPTIDE
 INTERACTIONS AND SIGNALING NETWORKS USING MACHINE
 LEARNING
 Joseph M. Cunningham1, Grigoriy Koytiger1,2, Peter K. Sorger1,†, Mohammed
 AlQuraishi1,*,†
 1Laboratoryof Systems Pharmacology, Department of Systems Biology, Harvard Medical School,
 Boston, Massachusetts, USA
 2Current Address: cascade.bio, Cambridge, Massachusetts, USA

 Abstract
 In mammalian cells, much of signal transduction is mediated by weak protein-protein interactions
 between globular peptide-binding domains (PBDs) and unstructured peptidic motifs in partner
 proteins. The number and diversity of these PBDs (over 1,800 are known), low binding affinities,
 and sensitivity of binding properties to minor sequence variation represent a substantial challenge
 to experimental and computational analysis of PBD specificity and the networks PBDs create.
 Here we introduce a bespoke machine learning approach, hierarchical statistical mechanical
 modelling (HSM), capable of accurately predicting the affinities of PBD-peptide interactions
Health Research Alliance Author Manuscript

 across multiple protein families. By synthesizing biophysical priors within a modern machine
 learning framework, HSM outperforms existing computational methods and high-throughput
 experimental assays. HSM models are interpretable in familiar biophysical terms at three spatial
 scales: the energetics of protein-peptide binding, the multi-dentate organization of protein-protein
 interactions, and the global architecture of signaling networks.

 INTRODUCTION
 Signal transduction downstream of transmembrane receptors, particularly receptor tyrosine
 kinases (RTKs), is commonly mediated by networks of weak protein-protein interactions
 (PPIs) having dissociation constants in the micromolar range.1,2 Many such interactions

 Users may view, print, copy, and download text and data-mine the content in such documents, for the purposes of academic research,
 subject always to the full Conditions of use:http://www.nature.com/authors/editorial_policies/license.html#terms
 *
 Address correspondence to: Mohammed AlQuraishi, WAB 438, Harvard Medical School, 200 Longwood Avenue, Boston MA 02115,
 Tel: 617-432-6901, alquraishi@hms.harvard.edu.
 †These authors contributed equally.
 AUTHOR CONTRIBUTIONS
 JMC, PKS, and MA conceived and designed the model, analysis and computational experiments. JMC implemented model and carried
 out the analysis and experiments. GK collected and processed binding and structural data and contributed to the analysis. All authors
 wrote and reviewed the manuscript.
 COMPETING INTERESTS
 PKS is a member of the SAB or Board of Directors of Merrimack Pharmaceutical, Glencoe Software, Applied Biomath and RareCyte
 Inc. and has equity in these companies; Sorger declares that none of these relationships are directly or indirectly related to the content
 of this manuscript.
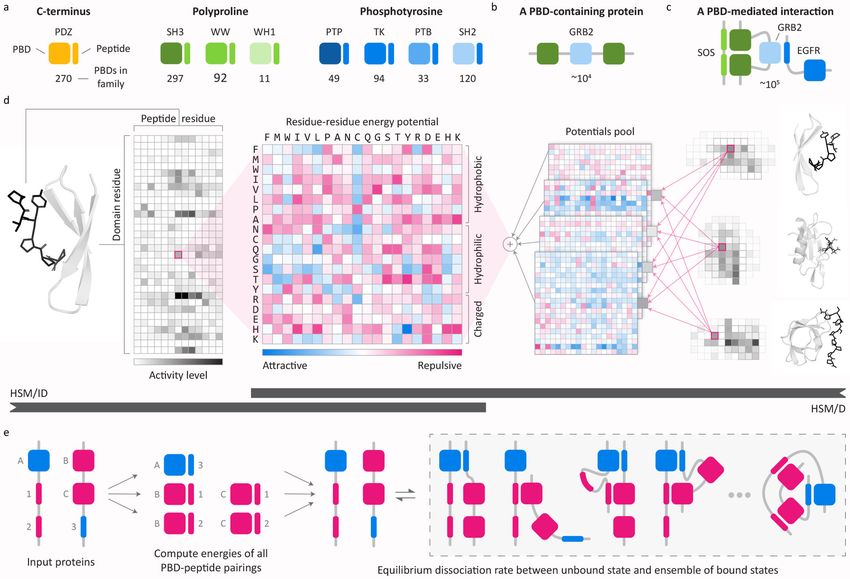
Cunningham et al. Page 2

 involve peptide-binding domains (PBDs; e.g. SH2, SH3, PDZ domains) that bind short
 linear sequences in partner proteins (hereafter “peptides” or “peptidic sites”) to form multi-
 protein scaffolds and regulate enzyme activities.3–6 Oncogenic mutations are common in
 PBD-containing proteins and many of these proteins are drug targets.7,8 The large number of
Health Research Alliance Author Manuscript

 PBDs and peptidic sites presents a considerable hurdle to structural understanding: PBDs
 and peptidic sites are too numerous for comprehensive crystallization or analysis by cryo-
 EM.9–11

 The low affinities of PBD-mediated interactions represents a second challenge to their
 characterization: relatively few PBD-peptide complexes are detectable using the pull-down
 assays from cell extracts currently being performed on large scale, and this has necessitated
 the use of other methods such as protein-peptide arrays, isothermal titration calorimetry, and
 surface plasmon resonance.12–15 Such methods require synthetic and/or immobilized
 peptides and recombinant proteins and do not readily scale to a full proteome; as a result,
 binding data on many PBD families remain sparse. Computational approaches have been
 stymied by this data scarcity and by the diversity of PBD folds. Consequently, modeling
 efforts to date have focused primarily on individual domains (e.g. the SH2 domain of the
 protein STAP1)16–19 or domain families for which sufficient binding data are available (e.g.
 all SH2 domains)20.

 In this paper we describe a machine learning method, hierarchical statistical mechanical
 modelling (HSM), for studying PBD-peptide interactions en masse. HSM uses experimental
 domain-peptide array data to model PPIs by generalizing along two axes: from individual
 PBD-peptide interactions to multi-dentate PPIs, and from one PBD family to another. A key
 feature of HSM is the inference of a unified energy model that enables transfer of
 biochemical and structural knowledge from domain families for which abundant binding
Health Research Alliance Author Manuscript

 data are available (e.g. SH2 domains) to ones for which data are sparse (e.g. PTB domains).
 We show that HSM predicts PBD-peptide biophysics with precision and recall superior to
 existing computational methods and to high-throughput assays (e.g. protein arrays, yeast
 two-hybrid screening, and affinity mass spectrometry). By exploiting biophysical
 knowledge, machine learning, and large-scale but sparse empirical data, HSM provides a
 substantial technical and biological advance in the study of PBDs and the cellular signaling
 networks they form in both physiological and dysregulated conditions.

 RESULTS
 Model design and approach
 We constructed HSM models for six common PBD families involving phosphotyrosine,
 polyproline, and C-terminal peptidic sites (PDZ, SH2, SH3, WW, WH1, PTB; n = 823
 domains) and for tyrosine kinases and protein tyrosine phosphatases (TK, PTP; n = 143
 domains; Fig. 1a; Supplementary Table 1). In the human proteome, the total number of
 PBD-containing proteins is estimated to be ~104 proteins (Fig. 1b) which participate in ~105
 - 106 interactions (Fig. 1c). The eight domains studied in this paper constitute ~39% of the
 total number of human PBDs (see Supplementary Note 1). In principle, the same modeling
 framework is applicable to all remaining human PBDs, but a scarcity of data (
Cunningham et al. Page 3

 HSM is a method for inferring structured Hamiltonians, the mathematical function that maps
 the state of a system to its energy and, consequently, to its thermodynamic properties. In
 classical statistical mechanics, this function is derived from physical theory. In HSM, an
 empirical approximation to the Hamiltonian is machine-learned in a manner that satisfies
Health Research Alliance Author Manuscript

 known and inferred biophysical constraints (see Supplementary Note 2). Due to data
 limitations, the process of inferring full Hamiltonians is underdetermined. Consequently, the
 HSM model is more appropriately termed a pseudo-Hamiltonian. We constrain the model to
 include only energy terms corresponding to single residues and interactions between pairs of
 residues, one in the domain and one in the peptide. Given additional data, higher-order
 effects (e.g. steric effects of triplets of residues) could be added to the model to more
 completely approximate the true Hamiltonian.

 Prior to initiating machine learning we carry out a combined sequence/structure alignment
 that brings into correspondence all residue positions of a given PBD family and peptide
 class, resulting in a unified system of residue coordinates. HSM then learns a pseudo-
 Hamiltonian that maps individual residues and residue pairs to binding energies in a manner
 that respects two constraints: (i) within a PBD family, a residue or residue pair at the same
 position always contributes the same energy and, (ii) across PBD families, residue pair
 energies are derived from a fixed pool of energy potentials.

 The first constraint is motivated by atomic-resolution structures of PBD-peptide co-
 complexes. These complexes show that structurally aligned residue positions in a domain
 family create biophysically similar binding pockets (Supplementary Fig. 1)6,13,21–24. Thus,
 learned energies for a given residue position should be transferable among domains from the
 same PBD family. Models applicable to all domains in one PBD family are described below
 as HSM for Independent Domains (HSM/ID) (Fig. 1d). HSM/ID is a generalization of the
Health Research Alliance Author Manuscript

 multiscale statistical mechanical (MSM)20 model we previously used to model SH2
 domains. However, unlike MSM, HSM/ID does not require alignment on phosphotyrosine
 sites (the chemical moiety recognized by all SH2 domains) or high-resolution protein
 structures.

 The second constraint is motivated by our analysis of residue-residue potentials learned by
 HSM/ID, which revealed similar energetic patterns for groups of residues across families of
 domains (Supplementary Fig. 2). Such similarity is consistent with the view that interactions
 among diverse types of proteins are mediated by a relatively limited set of interaction
 surfaces.25,26 We formalize this observation by forcing the HSM model to learn a shared set
 of residue-residue potentials that are assigned via a learned weighted mixture to specific
 position pairs in each PBD family (Fig. 1e). We find that a small number of potentials used
 in combination can capture the observed set of sterically and chemically distinct interaction
 surfaces, enabling information transfer among residue positions. The model that uses shared
 potentials and satisfies the HSM/ID constraint is referred to as HSM for Domains (HSM/D).

 Training and validation
 To train HSM models, we assembled a dataset of ~2 × 10⁶ PBD-peptide interactions derived
 primarily from array-based assays; data were binarized to allow values from different
 experimental methods to be combined, yielding 3-5% positive interactions (Supplementary

 Nat Methods. Author manuscript; available in PMC 2020 July 06.
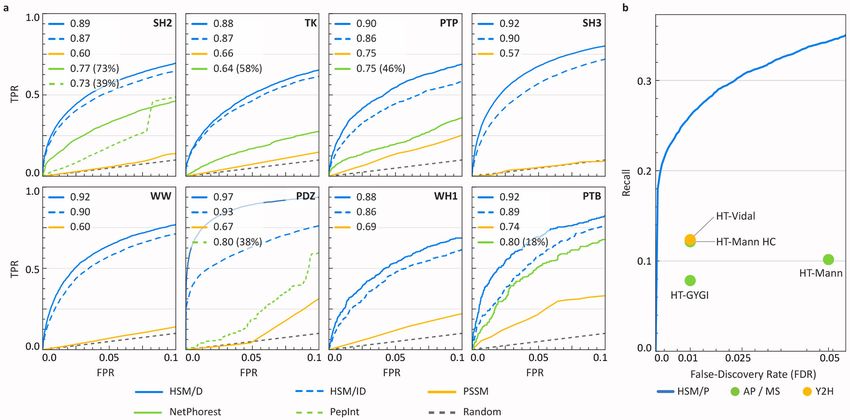
Cunningham et al. Page 4

 Table 1). To evaluate the merits of enforcing different constraints on learned energies we
 trained eight separate HSM/ID models, one for each PBD/enzyme family, and a single
 unified HSM/D model covering all families. We are unaware of any single model that covers
 an entire PBD family (including sequence variants that are associated with disease; our SH2-
Health Research Alliance Author Manuscript

 specific MSM framework is the exception20) or PBDs from multiple families
 (Supplementary Table 2). We therefore compared HSM against conventional position-
 specific scoring matrices (PSSM27) and, when available, previously published machine
 learning models covering subsets of PBD families.

 HSM/D and HSM/ID significantly outperformed existing machine learning models17,28 (p ≤
 6.4 × 10⁻¹²; DeLong test) and PSSMs27 (p ≤ 4.9 × 10−56; DeLong test) in all cases in which
 comparison was possible (Fig. 2a; Supplementary Fig. 3a; Supplementary Table 3). We also
 observed strong concordance between experimentally-derived and model-inferred
 interaction probabilities (Supplementary Fig. 3b), suggesting that predicted values can be
 meaningfully interpreted as physical affinities. HSM/D outperformed HSM/ID across all
 domains (p ≤ 2.4 x 10⁻²; DeLong test), likely due to information sharing among domains.
 Improvement was observed for both high-data (e.g. PDZ) and low-data (e.g. PTB) domains.
 HSM covers more PBD families and a substantially larger fraction of each family than other
 methods (parentheses in Fig. 2a). Critically, much of the improvement is concentrated in low
 false-positive rate (FPR) regions (FPR < 0.10), where realistic use of model predictions
 would occur.

 Many mammalian signal transduction proteins contain multiple PBDs and/or peptidic sites.
 We modelled multi-dentate PPIs involving multiple peptidic sites and/or PBDs by
 computing the energies of all possible binding configurations using the HSM/D pseudo-
 Hamiltonian and then extracting the probability of the bound ensemble. These whole-protein
Health Research Alliance Author Manuscript

 models are referred to as HSM for Proteins (HSM/P) (Fig. 1c; Supplementary Table 4). The
 additivity of Hamiltonians is a key advantage of the HSM approach; it enables the principled
 aggregation of domain-level predictions while accounting for increases in affinity arising
 from multi-dentate binding. Thus, HSM/P accounts for cooperativity, but not changes in
 binding energy associated with steric hindrance at the level of tertiary structure. This
 limitation may not be consequential since many proteins containing PBDs and peptidic sites
 involve discrete folded domains separated by structurally disordered and presumably flexible
 polypeptides.

 To evaluate the accuracy of HSM/P models, we constructed a “gold standard” set of 32,504
 direct PPIs derived from two curated molecular interaction databases (BioGRID29, IntAct30)
 using three criteria: (i) direct interactions, (ii) low-throughput assays, and (iii) multiple
 verifications (see Methods). We assessed the performance of HSM/P and three recent high-
 throughput experimental assays11,31–33 (Supplementary Table 5) against this gold standard
 set. Because HSM is only trained on domain-peptide interactions, the gold standard protein-
 level PPI data is independent of HSM predictions. To further guard against data leakage, we
 removed from the gold standard set any PPIs comprised of domain-peptide interactions
 present in the HSM training set. To ensure a fair comparison, recall was computed on the
 subset of PPIs detectable by each method (e.g. tested pairs in a yeast two-hybrid binary
 interactome). At comparable false-discovery rates, HSM/P roughly doubled the recall

 Nat Methods. Author manuscript; available in PMC 2020 July 06.
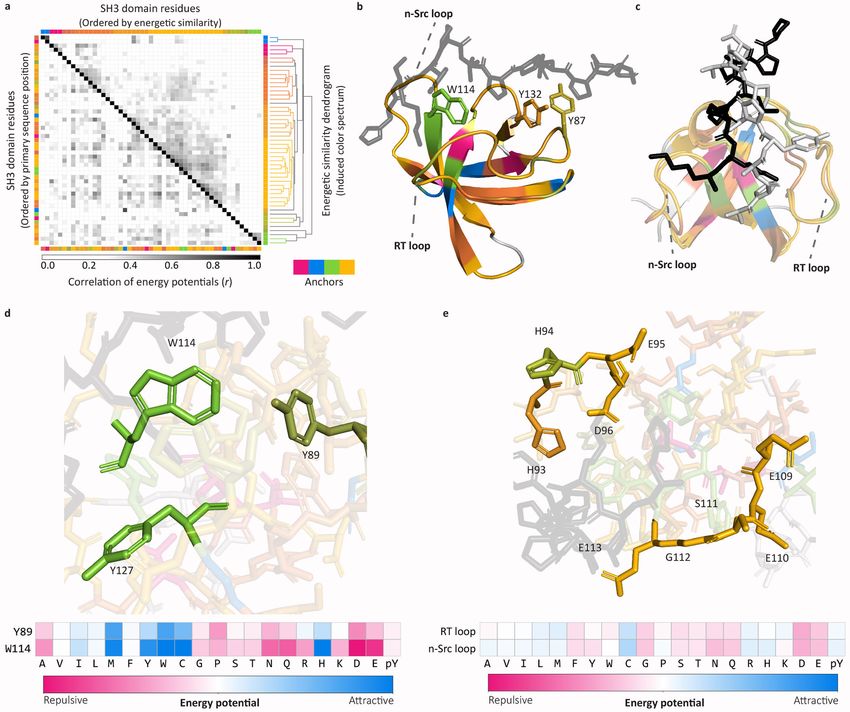
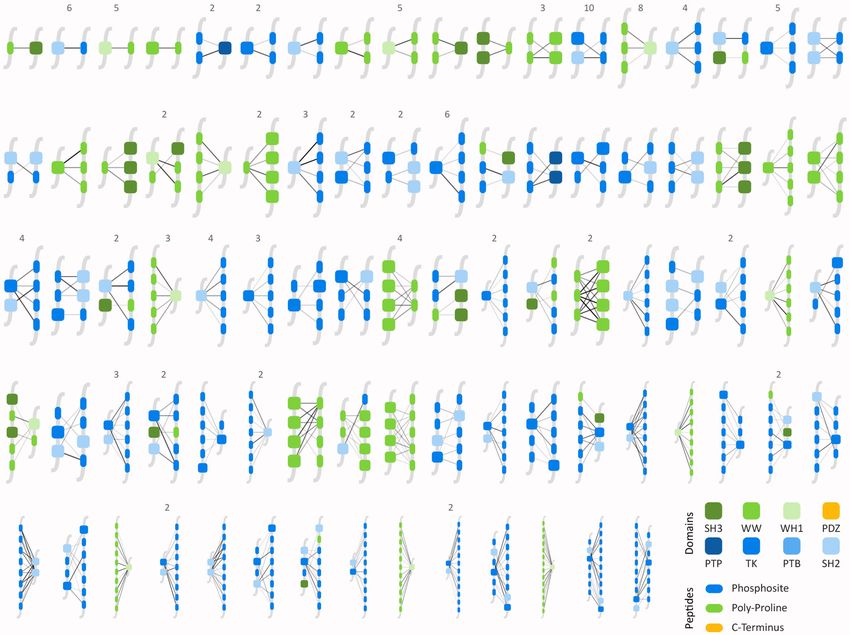
Cunningham et al. Page 5

 achieved by any of the three experimental assays (Fig. 2b). This comparison is likely to
 underestimate the actual improvement provided by HSM due to (i) underreporting of weak
 PPIs in the gold standard dataset (these appear as false positive HSM predictions),1,34 and
 (ii) the presence in the gold standard dataset of interactions that are mediated by domains
Health Research Alliance Author Manuscript

 other than the modeled PBDs (these appear as false negative HSM predictions). The
 comparison nonetheless shows that HSM/P improves on high-throughput experimental
 methods while covering the space of poorly-characterized interactions.

 To assess the utility of HSM in predicting novel protein-protein interactions, we combined
 protein-level data from BioGRID and high-throughput experiments and filtered them for
 PPIs discovered subsequent to the date HSM domain-level training data were reported (see
 Methods). Given the number of domain- and peptide-containing proteins in the human
 proteome for which HSM is capable of making predictions, the highest number of possible
 PPIs is ~5.3M. At an expected FDR of 0.01 (calibrated using the results of Fig. 2), HSM/P
 predicts 23,309 PPIs not reported in the combined protein-level data prior to the time of the
 split. Among these, 161 interactions have subsequently been detected experimentally (Fig. 3;
 Supplementary Fig. 4); we use HSM/P to gain detailed insight into them. Almost all
 interactions examined (99%, n = 160 PPIs) involved one or more high-affinity PBD-peptide
 interactions (p ≤ 0.05, HSM/D prediction) but they were otherwise diverse: 69 (43%) were
 multi-dentate (with two or more strongly-interacting PBDs), 11 (7%) involved multiple
 PBDs from one or more families and a single peptide, and 68 (42%) involved multiple
 peptides and one PBD. Phosphotyrosine- and proline-binding predominated (Fig. 3), but the
 two chemistries were largely non-overlapping (only 6 PPIs combined both). In most
 interactions we also observed either that (i) the number of multiply bound peptidic sites (i.e.
 sites having more than one high-affinity PBD partner) exceeded the number of PBDs (n =
 106 PPIs), and/or (ii) that multiple peptidic sites strongly interacted with a single PBD (p ≤
Health Research Alliance Author Manuscript

 0.05, HSM/P; n = 119 PPIs). We expect both types of interactions to decrease off-rates (Koff)
 while minimally impacting on-rates (Kon). Consequently, the affinities of these PPIs should
 be higher than predicted from PBD-peptide affinities considered individually (that is, they
 should exhibit cooperativity). Phosphosite-binding has the additional property of being
 regulable by kinases and phosphatases, further diversifying the properties of multidentate
 interactions.

 Mechanistic insights into PBD-peptide binding.
 How well does HSM capture the details of a PBD-peptide interaction known from a high-
 resolution structure? To investigate this we examined the structural basis of SH3-peptide
 binding; similar analyses of other PBD families are shown in Supplementary Fig. 5 and 6.
 To identify key features in PBD-peptide interaction based on energetic similarity, the
 Pearson correlation coefficient was calculated for all residue-to-residue energy potentials
 across domain positions (Fig. 4a) and then used as the basis for hierarchically clustering
 domain positions. To visualize energetic similarity, the four maximally separated clusters
 were colored using distinct colors (“anchors” in Fig. 4a, bottom). All other clusters were
 colored using a weighted mixture of these four colors, with cophenetic distance as the
 weight (see Methods and Supplementary Fig. 5a for color mixtures). Resulting colors were
 mapped onto the SH3 domain of HCK, an SH3-peptide co-complex for which a high-

 Nat Methods. Author manuscript; available in PMC 2020 July 06.
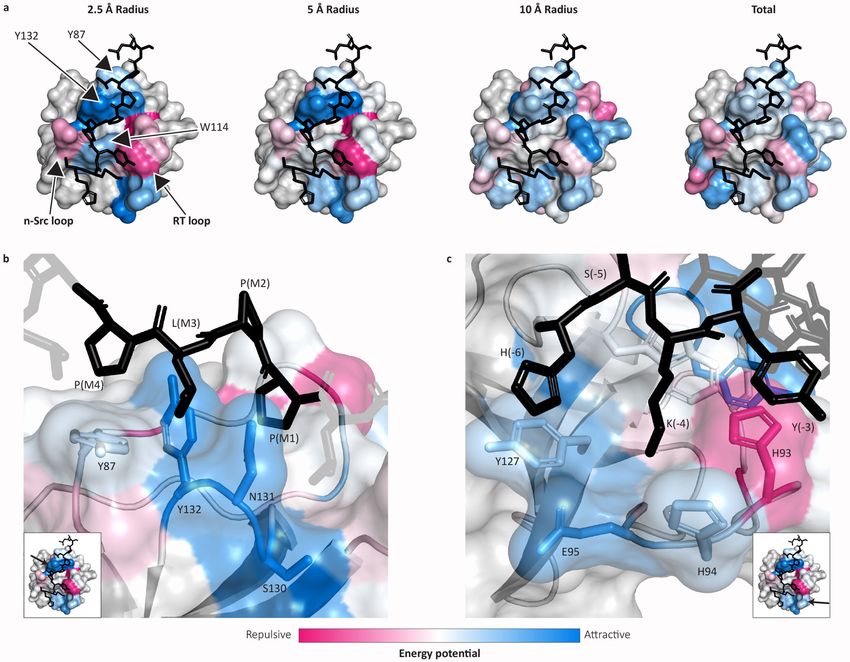
Cunningham et al. Page 6

 resolution structure is available (PDB:2OI3; Fig. 4b). The canonical SH3 binding pocket is
 known to involve a conserved triplet of aromatic residues (W114, Y132, Y87) comprising
 two polyproline type-II (PPII) helix xP-recognition grooves and specificity-defining n-Src
 and RT-loops21,35 (Fig. 4b–c). W114 constitutes a “tryptophan switch” that can adapt to
Health Research Alliance Author Manuscript

 support both Class I (N-to-C oriented) and Class II (C-to-N oriented) peptide binding.36
 HSM reveals the involvement of two additional residues in peptide binding (Y89, Y127; Fig.
 4d); these residues are energetically similar to W114 (shared green color), potentially
 contributing to binding energy via van der Waals forces (involving the tryptophan aromatic
 core) or via hydrogen-bonding (involving the tyrosine alcohol group). Y89 and Y127 appear
 to function cooperatively with W114 to facilitate binding in Class I and Class II
 conformations, with Y89 exhibiting features characteristic of both W114 and Y87 (Y89 is
 darker green, similar to Y87 in Fig. 4b). The existence of such energetic coupling is
 confirmed by the selectivity of W114 and Y89 for a residue adjacent to the core proline
 motif on the peptidic site (Fig. 4d, bottom). We also observed energetically similar residues
 in the RT and n-Src loops (Fig. 4e; shared gold color). This similarity, supported by
 associated energy profiles (Fig. 4e, bottom), is consistent with the conformational flexibility
 observed in the peptidic segments adjacent to the RT and n-Src loops (Fig. 4c): all residues
 in both loops have similar physico-chemical preferences which, in conjunction with their
 flexibility, allows them to act cooperativity. Thus, even though HSM uses no high-resolution
 structural information for training, it correctly infers known binding motifs (e.g. the W114
 tryptophan switch) as well as previously unrecognized aspects of peptide binding (e.g. the
 role of Y89 and Y127 in Class I vs. II binding). We conclude that HSM generates an energy-
 based description of protein mechanism from which novel biophysical and structural
 insights can be obtained.

 As a second approach to studying the energies that comprise HSM predictions, we mapped
Health Research Alliance Author Manuscript

 predicted interaction energies onto the HCK co-complex (PDB: 2OI3). Residues on the
 surface of the domain were colored by mean energies of interaction with peptidic residues at
 defined radii (2.5Å, 5Å, and 10Å) and in total (Fig. 5a). Attractive regions (blue) broadly
 correspond to known interaction surfaces such as the RT-loop and proline recognition
 pocket. The peptide bound to HCK in this complex (HSKYPLPPLPSL) is unusual however:
 it binds in a Class I (N-to-C oriented) conformation involving the typical proline motif
 (HSKYPLPPLPSL) but an atypical N-terminal sequence (HSKYPLPPLPSL).37,38 HSM
 predicts a strongly favorable set of interactions for the proline motif involving both the
 conserved tyrosine residues (Y87, Y132) as well as two adjacent polar residues S130, N131
 (Fig. 5b). Although the role of the tyrosine residues is well-described21,37,38, the
 contributions of S130 and N131 are not. We speculate that these residues may serve to
 decrease off rates by coming into contact with a dissociating peptide.

 In its specificity defining N-terminal sequence, the bound peptide is atypical with an
 aromatic tyrosine residue at the -3 position and a basic lysine residue at the -4 position.37
 Compared to the typical peptide conformation, which smoothly curves into the RT and n-Src
 pocket, this induces an atypical, “S-shaped” conformation that involves two structural
 differences: K(-4) is in an orientation that is typically occupied by the -3 position and Y(-3)
 sterically hinders H93 (Fig. 5c). Despite this unusual arrangement, HSM predicts the

 Nat Methods. Author manuscript; available in PMC 2020 July 06.
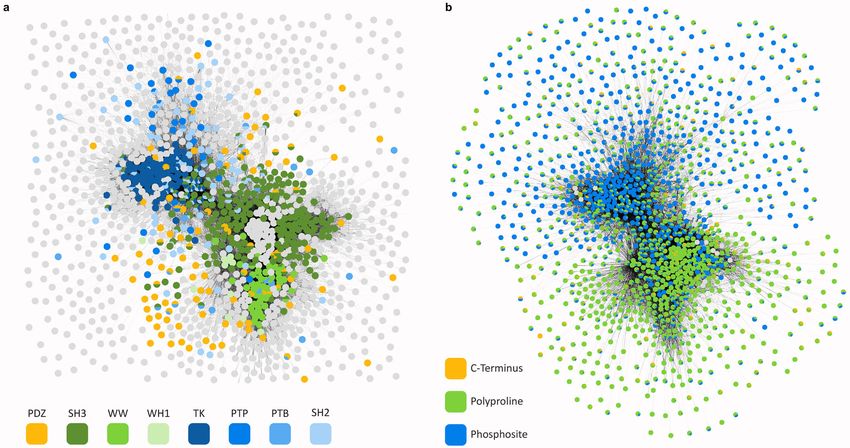
Cunningham et al. Page 7

 expected energetics: the RT-loop has a broadly attractive interaction with the anchoring basic
 residue (K(-4) and E94 / D95, possibly electrostatic) along with weaker interactions between
 H(-6) and Y127, which may involve van der Waals forces. Similarly, HSM assigns repulsive
 energies to the sterically hindered H93 residue. Speculatively, this unfavorable interaction
Health Research Alliance Author Manuscript

 suggests a potential mechanism for optimizing the binding affinity of the peptides; HSM
 suggests that smaller, non-polar residues (leucine and isoleucine are the most favorable
 substitutions) would better enhance affinity at position (-3) than tyrosine.

 Insights into signaling networks.
 Many proteins contain multiple PBDs of different classes with and without co-occurring
 peptidic sites. To study networks involving this type of binding, we generated a proteome-
 wide node-edge graph of high-confidence human PPI predictions (HSM/P, p > 0.7), with
 nodes corresponding to proteins and edges to interactions (Fig. 6). Networks were laid out
 using an automated, repulsion-based algorithm that places nodes with similar neighbors
 nearby (i.e. proteins having similar sets of interacting proteins; Methods). We found that
 proteins containing PBDs from the same family interacted with similar sets of partners,
 resulting in PBD “neighborhoods” (Supplementary Fig. 7). Globally, the network is further
 divided into clusters rich in phosphosite-binding and polyproline-binding, with relatively
 few interconnecting proteins. This hierarchical organization is suggestive of separate,
 potentially independently-evolving, signaling programs.

 Many PBD families form distinct subnetworks (Supplementary Fig. 7), with a broad range
 of microscale structures such as bifans and feed-forward loops.39 The existence of common
 peptidic ‘currencies’ for PBDs based on phosphosite and polyproline binding allows distinct
 PBD-specific subnetworks to interact, establishing the observed mesoscale structure. We
 speculate that proteins with PDZ and/or SH3 domains may have evolved to interconnect the
Health Research Alliance Author Manuscript

 phosphosite-binding and polyproline-binding signaling currencies (Fig. 6).

 DISCUSSION
 The HSM approach to modeling PBD-mediated interactions represents a form of bespoke
 machine learning in which statistical mechanical principles and universal features of protein
 chemistry are wedded to the data-driven learning paradigm through the power of automatic
 differentiation frameworks (e.g. TensorFlow). Bespoke models like HSM combine the
 robustness of machine learning—with respect to learning from complex, heterogeneous, and
 incomplete data—with the interpretability of fundamental (bio)physical theory. We speculate
 that the performance achieved by HSM is unlikely to be possible using a generic machine
 learning approach.

 Because learned pseudo-Hamiltonians are the basis of HSM, it is possible to interpret
 learned interactions in terms of familiar position-specific binding energies. HSM is therefore
 able to provide structural insight at three spatial scales: the residue/co-complex level, by
 facilitating understanding and prediction of PBD and/or peptidic function; the protein level,
 by quantifying relative contributions of individual PBDs and ligands in multi-dentate
 interactions; and the network level, by enabling large scale modeling of information
 transmission from the cell surface to determinants of cell structure and function.

 Nat Methods. Author manuscript; available in PMC 2020 July 06.
Cunningham et al. Page 8

 The biophysical detail captured by HSM is most readily illustrated by comparing learned
 energies to insights inferred from crystal structures, as illustrated in this paper by analysis of
 SH3 domains, one of the eight classes of PBDs/enzymes we model. We find that HSM
 provides insight into regions of contact that are remarkably similar to those obtained from
Health Research Alliance Author Manuscript

 crystal structures while also providing a broader synthesis obtainable only from a
 comprehensive picture of all known SH3 structures.

 For well-studied PBD families (SH2, SH3, PDZ) the current work substantially extends
 current understanding of binding modes and for less well-understood domains (e.g. PTB,
 WH1) it provides new insights. The flexibility of HSM representation makes it adaptable to
 modeling mutant PBDs and peptides in disease and to designing peptide-based drugs or
 PBD-like biosensors. In the future it should be possible to develop models for PBDs (e.g.
 BRCT, 14-3-3) that currently lack sufficient data. We expect this to yield comprehensive,
 proteome-scale models of PBDs in mitogenic and inflammatory signaling and of PBD and
 peptidic site mutations in diseases such as cancer.

 Online Methods
 HSM - models
 We denote a given PBD by D and its putative cognate peptide by L, and consider the
 reaction:

 D+L DL

 where D+L represents the pair in an unbound configuration and DL in a bound
 configuration. We associate a Hamiltonian with both the unbound, ℋ(D + L), and bound,
Health Research Alliance Author Manuscript

 ℋ(DL), states. We assume that the energies associated with the unbound configuration are
 additive, i.e. ℋ(D + L) = ℋ(D) + ℋ(L).

 Every Hamiltonian is decomposed into a set of energy functions {e(·)}, such that each
 function maps a set of residues (singles or pairs) to an energetic contribution, dependent on
 the: (i) state of the interaction (bound (b) or unbound (u)), (ii) position(s) of residue(s) in the
 canonical alignment, and (iii) order of the interaction (singleton or pairwise). We denote the
 state and position in subscript and the order in a superscript; for example e(2)
 b; i, j corresponds
 to the pairwise (i.e., order 2) interaction between the i-th PBD position and j-th peptide
 position in a bound PBD-peptide complex. A Hamiltonian is then defined by a summation
 over these energy functions:

 ∣D∣
 ℋ(D) = ∑ e(1)
 u; i(Di)
 i=1

 ∣L∣
 ℋ(L) = ∑ e(1)
 u; i(Li)
 i=1

 Nat Methods. Author manuscript; available in PMC 2020 July 06.
Cunningham et al. Page 9
∣D∣ ∣L∣ ∣D∣ ∣L∣
e(1) e(1)
(2) (D L )
ℋ(DL) = ∑ b; i(Di) + ∑ b; j(L j) + ∑ ∑ eb; i, j i, j
i=1 j=1 i=1j=1
Health Research Alliance Author Manuscript
In general, a Hamiltonian should be composed of all possible interaction orders (i.e. all
possible subsets of residues in a complex). Due to limitations in available experimental data,
we constrain our representation to first- and second-order interactions. Thus, HSM is more
correctly thought of as a pseudo-Hamiltonian. The above model formulation corresponds to
a single PBD family in the case of HSM/ID.
A stronger prior can be placed on this pseudo-Hamiltonian by redefining the second-order
energy functions to be linear combinations of an underlying basis set shared among all PBD
families:
K
e(2) ∑ wki, j ⋅ bk(Di, L j)
b; i, j(Di, L j) =
k=1
Where K is the number of basis functions, bk is the k-th basis, and wi,k j is a learned weight
associating the k-th basis with position pair (i,j). Note that the weights are dependent on
position, whereas the basis functions are independent of position and common to all PBDs
and all families. This model corresponds to the HSM/D formulation.
Finally, we consider the interaction of two proteins 1 and 2:
1 + 2 1 2
Health Research Alliance Author Manuscript
Let β( 1, 2) define all permissible bound states between the two proteins. A permissible
state is a set comprised of PBD-peptide pairs {DL} such that every pair has a non-zero
probability of interaction in HSM and no PBD or peptide is paired more than once. For a
given bound state B ∈ β( 1, 2), we define the Hamiltonian:
ℋ(B) = ∑ ℋ(DL) + ∑ ℋ(D) + ∑ ℋ(L)
DL ∈ B D∉B L∉B
While the unbound state Hamiltonian is described by:
ℋ( 1 + 2) = ∑ ℋ(D) + ∑ ℋ(L)
D ∈ 1 L ∈ 2
HSM – probabilistic derivation
To learn energy functions, we first translate the model described above into a probabilistic
framework.20 Using the Boltzmann distribution, we write the likelihood of the canonical
ensemble (ce) representing the bound and unbound states as:
Nat Methods. Author manuscript; available in PMC 2020 July 06.Cunningham et al. Page 10 1 − (ℋ(D) + ℋ(L) − TSu) 1 p(ce)(D + L) = e kT Z(D, L) Health Research Alliance Author Manuscript 1 − (ℋ(DL) − TSb) 1 p(ce)(DL) = e kT Z(D, L) where Z(D,L) is the partition function over the two states: 1 1 − (ℋ(D) + ℋ(L) − TSu) − (ℋ(DL) − TSb) kT Z(D, L) = e + e kT and T is the temperature, k the Boltzmann constant, and Su and Sb are the entropies associated with the unbound and bound states, respectively. Note that entropies are not sequence specific. Using the same distribution, we define the likelihood of a pair of interacting proteins in configuration B as 1 − (ℋ(B) − T( ∣ N b(B) ∣ Sb + ( ∣ N ∣ − ∣ N b(B) ∣ )Su)) 1 p(ce)(B) = kT e Z( 1, 2) where Nb (B) defines the number of domains in a bound state in configuration B and N defines the total number of domains. The partition function over the interacting proteins is Health Research Alliance Author Manuscript consequently defined as: 1 − (ℋ( ) + ℋ( ) − T ∣ N ∣ S ) 1 2 u Z( 1, 2) = e kT 1 − (ℋ(B) − T( ∣ N b(B) ∣ Sb + ( ∣ N ∣ − ∣ N b(B) ∣ )Su)) kT + ∑ e B ∈ β( 1, 2) Using this probabilistic formulation we can apply machine-learning techniques to learn model parameters. The above formulation contains an inherent indeterminacy however. Specifically, algebraic simplification yields partition functions that are exclusively described in terms of differences between bound and unbound terms. As a result, the parameters we learn are differences in energy. This is illustrated by simplification to the standard logistic function: Nat Methods. Author manuscript; available in PMC 2020 July 06.
Cunningham et al. Page 11

 1
 − (ℋ(DL) − TSb)
 kT
 e
 p(ce)(DL) =
 1 1
 − (ℋ(D) + ℋ(L) − TS ) − (ℋ(DL) − TSb)
 u
 e kT + e kT
Health Research Alliance Author Manuscript

 1
 − (ℋ(DL) − ℋ(D) − ℋ(L) − T(Sb − Su))
 e kT
 p(ce)(DL) =
 1
 − (ℋ(DL) − ℋ(D) − ℋ(L) − T(S − S ))
 b u
 1 + e kT

 Expanding the Hamiltonian, we are left with a function that is a difference of bound and
 unbound energies:

 ∣D∣ ∣L∣ ∣D∣ ∣L∣
 e(1) (1) e(1) (1)
 ℋ(DL) − ℋ(D) − ℋ(L) = ∑ ∑ ∑ ∑ e(2)
 b; i(Di) − eu; i(Di) + b; j(L j) − eu; j(L j) + b; i, j(Di, L j)
 i=1 j=1 i=1j=1

 These differences, which we will denoted by Δℋ(i), in addition to the change in entropy, ΔS,
 are the uniquely determinable values. Hence the inferred energy functions represent the
 difference in energy associated with binding a peptide. This indeterminacy extends to the
 protein interaction model described below.

 Given a likelihood function, we can define a loss function. Using the negative of the
 conditional log-likelihood we define the loss function as:

 Loss ≔ − p(emp)log p(ce) + (1 − p(emp)) log(1 − p(ce))
Health Research Alliance Author Manuscript

 This function maximizes the conditional likelihood of the data over the available training set.
 We encourage sparsity via an L1 regularization penalty. In HSM/ID the penalty is placed on
 all weights, while in HSM/D the basis sets are excluded.

 HSM/D (independent and universal)
 Data—Sequences for PBDs were taken from the UniProt database and aligned using the
 Superfamily40 Hidden Markov Model (HMM) associated with each PBD’s respective fold.
 Sequences were aligned and trimmed to the model using HMMER3.1b2 (hmmalign and
 alimask; see Supplementary Data Set 1).

 The space of PBDs considered in this work divided naturally into three peptidic types for the
 purpose of alignment: phosphosites, C-terminal sites and ‘other’ sites. Phosphosites, bound
 by the SH2, PTB/PID, TK and PTP families, were aligned using the central phosphorylated
 residue and trimmed to include the seven leading and trailing residues. C-terminal sites,
 associated with the PDZ family, were aligned to the C-terminus and trimmed to include the
 trailing six residues. In both cases, the choice of site length was based on examination of
 representative crystallographic structures of PBD-peptide co-complexes.

 Nat Methods. Author manuscript; available in PMC 2020 July 06.
Cunningham et al. Page 12

 The ‘other’ sites, associated with SH3, WW, and WH1/EVH1 domains, were aligned with
 reference to PBD-peptide co-complexes. All co-complexes of a given family were extracted
 from the Protein Data Bank and structurally aligned using a rigid-body alignment38, with the
 PBD domains serving as the reference points (i.e. the positions of peptides were ignored
Health Research Alliance Author Manuscript

 when defining the alignment, but were rigidly transformed in the same way as the domain).
 This alignment induced a structure-based correspondence between peptides, even ones with
 highly divergent sequences. We extracted a multiple sequence alignment (i.e. residue-to-
 residue correspondences with no internal gaps) from the structural alignment by pairing
 residues between peptides such that the sum of Euclidean distances between paired residues
 is minimized. We then add peptides without structural representatives to this multiple
 sequence alignment by finding the most similar peptide with a structural representative, and
 performing pairwise sequence alignment on the two peptides (with no internal gaps).

 Binding data were extracted from a total of 554 publications reporting domain-peptide
 binding assays. The complete training set is provided in Supplementary Data Set 2 (file
 includes PubMed ID of each publication).

 Implementation and Training—All models were implemented in TensorFlow (v. 1.4).
 Learned parameters include the energetic terms comprising the Hamiltonian and a constant
 term, which approximates entropic contributions. The basis functions defined in HSM/D are
 learned and not pre-defined. In each training iteration, all domain families are represented.
 Consequently, the domain-specific weights receive gradients (only) from domain-peptide
 samples of the same class whereas the basis functions receive gradients from all domain
 families.

 We used a k-fold cross-validation procedure (k = 8). Data for each domain was randomly
Health Research Alliance Author Manuscript

 split into k independent subsets (folds). For each split, we hold out a single fold (“test data”)
 and re-train the model on the remaining folds (“training data”). Hyper-parameters (L1
 regularization parameters per domain, number of epochs, learning rate) were fit against a
 randomly chosen training fold in a given split and a model was trained on the entire training
 set using these parameters. For novel prediction (i.e. for use in HSM/P), a model was re-
 trained on all training data with hyper-parameters averaged over all validation folds.

 Validation—HSM/ID and HSM/D were first compared against position-specific scoring
 matrices (PSSMs). A PSSM, w, of length L is specified by an L x A matrix (A is the number
 of amino-acids) where the l,a-th entry is the empirical probability of observing amino acid a
 at position l. The likelihood of observing a sequence s is then defined as:

 ∣s∣
 P(s ∣ w) = ∏ Pi(si ∣ wi)
 i=1

 To compute this model, domains of a given class were clustered using average / unweighted
 pair group method with arithmetic mean (UPGMA)41 with inter-sequence distance defined
 via the PAM120 substitution matrix. A PSSM was derived for each cluster from all the

 Nat Methods. Author manuscript; available in PMC 2020 July 06.
Cunningham et al. Page 13

 empirical binding data in our training set. The clustering threshold was chosen to maximize
 the performance of the PSSMs on the test set.

 Second, HSM/ID and HSM/D were compared with published models of PBD-peptide
Health Research Alliance Author Manuscript

 interactions if such models were available. The significance of the relative performance
 improvement of HSM/ID and MSM/D was assessed using the DeLong Test.42

 HSM/P
 Data—We identified a total of 991 human PBDs in 591 proteins using the alignments
 constructed for HSM/D. For peptidic sites, tyrosine phosphosites were extracted from
 PhosphositePlus43 and filtered to only include entries with a minimum of one literature
 citation. Potential non-phosphorylated sites (i.e. C-termini and polyproline sites) were
 selected based on two properties: solvent accessibility and disorder, which we predicted
 proteome-wide using RaptorX_Property.44 Using known ligands derived from the ELM45
 linear motif database, thresholds were chosen for RaptorX_Property-predicted values to
 optimally recreate this known set of ligands. All C-termini regions (length = 6) that meet the
 previously described thresholds were included. Potential polyproline regions were identified
 by taking all protein regions that satisfied the previous thresholds and included at least one
 proline residue. At each proline, we search l residues in each direction (l = 8). If a proline
 residue is encountered, that residue is added to the putative site, and the search is expanded
 by another l residues. If no proline residues are found, the site is padded by l / 2 in that
 direction. When no expansions are possible, the site is finalized as a potential polyproline
 binding site. This algorithm splits large regions (20+ residues) into subsets of contiguous
 prolines in a motif-agnostic way, i.e. a motif like ‘PxxP’ is not pre-defined.

 Phosphosites and C-termini peptides were aligned in the same manner as described above
Health Research Alliance Author Manuscript

 for HSM training. For polyproline sites, all possible binding configurations were considered
 for a given site. That is, the bound ensemble represents the likelihood of a given domain
 binding the entire polyproline region. For efficiency, computation of PPIs only included
 ligands with greater than 0.01 probability of interaction.

 The selection of peptidic sites represents a potential and unavoidable source of error. For
 example, some known ligands of SH3 (i.e. annotated via ELM) are excluded due to the
 solvent accessibility / disorder thresholds. The existence of annotation error necessarily
 informs interpretation of model results, as they are conditional on the space of selected
 ligands. We release the set of selected peptidic sites in our analysis (Supplementary Data Set
 3) for future reference and possible improvement.

 Validation—A high confidence set of PPIs, the “gold standard” set, was derived as follows.
 First, interaction data was extracted from the BioGRID29 and IntAct30 databases, which
 serve as repositories for experimentally-detected, manually curated PPI datasets. From these
 databases, all interactions were extracted that fit three criteria: (1) direct interaction (PSI-MI:
 0407), (2) low-throughput source, and (3) reported by multiple (low-throughput) sources.
 Here, a low-throughput source is defined as any source reporting no more than 1,000
 interactions. For comparative assessment, we used three recently released, high-throughput
 data sources: HT-MANN11, HT-GYGI (BioPlex)31,32, and HT-VIDAL33. Comparisons were

 Nat Methods. Author manuscript; available in PMC 2020 July 06.
Cunningham et al. Page 14

 conducted on detectable interactions for each method (i.e. filtered based on bait-prey
 relationships). False-discovery rate (FDR) was based on literature-reported values for each
 source.33 We report predictions at an equivalent FDR by combining HSM/D false-positive
 rates using Fisher’s method (to derive a combined p-value) and correcting using the
Health Research Alliance Author Manuscript

 Benjamini-Hochberg method (see Fig. 2b).46 For calculating HSM recall, we removed any
 PPIs in the gold standard set that may be comprised of domain-peptide interactions in the
 training set.

 This benchmark likely underestimates the true predictive performance of HSM. While we
 only consider proteins that contain at least one PBD or peptidic site, we cannot guarantee
 that any given PPI will be PBD-mediated. The high-throughput methods considered can
 detect, in principle, any kind of PPI, unlike HSM which only predicts PBD-mediated ones.
 Furthermore, curated databases are primarily composed of higher-affinity PPIs1,34,
 presenting an underreporting bias against the types of PPIs HSM is specifically designed to
 predict.

 As additional validation, we consider a set of chronologically-split PPIs reported in public
 repositories subsequent to when our (domain-level) training data was collected. Specifically,
 we combine all interactions from the three high-throughput proteomics experiments (HT-
 MANN, HT-GYGI, and HT-VIDAL) with all data reported in BioGRID following 2015
 (IntAct does not record dates). We did not filter BioGRID using the previous three criteria as
 we wanted to maximize the number of PPIs for this analysis, but interactions reported prior
 to 2015 were removed. Predictions from HSM (FDR ≤ 0.01) that confirmed these results are
 reported with the associated mechanisms visualized in Fig. 3 and Supplementary Fig. 4.

 Biophysical analysis of inferred models
Health Research Alliance Author Manuscript

 Analyses of PBD-peptide co-complexes was performed by computing the Pearson
 correlation coefficient between all residue positions for a given PBD. We then summarize
 each position in the aligned PBD coordinate system by a set of second-order interaction
 energies e(b)
 i, j (αi, α j) , where i and j correspond to residue positions in the PBD and peptide,
 respectively, and α is the amino acid at a given position. We define the correlation between
 two PBD residue positions, m and n, as the correlation over all amino acid pairs and all
 peptide positions, i.e.:

 ∑k∣ =
 P∣∑ (b) (b)
 1 αm = αn, αk ∈ AA em, k(αm, αk) − μm en, k(αn, αk) − μn
 r(D) =
 m, n
 ∑k∣ =
 P∣∑ (b) ∣P∣ (b)
 1 αm, αk ∈ AA em, k(αm, αk) − μm ∑k = 1∑αn, αk ∈ AA en, k(αn, αk) − μn

 This correlation coefficient effectively treats the similarity of different PBD residue
 positions as the average similarity of their inferred binding energies. Finally, we performed
 hierarchical clustering on all residue positions based on the above distance metric to order
 residue positions (clustering illustrated by a dendrogram; Fig. 4a). To enable visual
 inspection of energetically related surface patches, we associated colors with clusters using a
 greedy algorithm to map cophenetic distance into a color space.

 Nat Methods. Author manuscript; available in PMC 2020 July 06.
Cunningham et al. Page 15

 Consider the set of non-singleton clusters, C1, C2, … , Cn, and singleton clusters, S1, S2, … ,
 Sn that result from a given clustering threshold. For a given inter-cluster distance metric,
 δ(·,·) (here, average / unweighted pair-group method with arithmetic mean (UPGMA)), we
 choose the next most distinct cluster, Di = Cj, on the basis of greatest sum of distances from
Health Research Alliance Author Manuscript

 the previously selected most distinct clusters, D1, D2, … Di−1 (i.e. Di = Cj if
 Cj = argmax ∑li − 1
 = 1δ(Ck, Dl)). The first most distinct cluster, D1, is chosen as the most
 Ck ∉ D1, …Di − 1

 distinct from all clusters. The first four clusters, D1, D2, D3, D4, are “anchored” into a color
 space by arbitrarily assigning the four “anchor colors” to the clusters. For each subsequent
 non-singleton cluster, Di, we assign the red (R), green (G), and blue (B) color channels by
 taking an inverse (cophenetic) distance weighted average of all previously colored channels
 (e.g. the fifth most distinct cluster is colored as a function of the first four clusters, the sixth
 as a function of the first five clusters, and so forth). For example, the red channel, R(·), of Di
 is defined:

 i−1
 R(Di) = ∑ wD (D j) ⋅ R(D j)
 j=1 i

 where wDi(Dj) is defined as a basic inverse distance weight:

 δ(Di, D j)− p
 wD (D j) =
 i ∑ij −= 11δ(Di, D j)− p

 We found that setting p to 15 yielded the best results visually and emphasized nearby
Health Research Alliance Author Manuscript

 clusters. The green and blue channels are assigned in the same way. Singleton clusters were
 not assigned iteratively; rather, singletons were assigned as a mixture of all non-singleton
 clusters (i.e. all singletons are weighed with respect to the set C1, C2, …, Cn). Colors were
 mapped onto representative co-complexes for which high resolution structures are available
 enabling identification of congruent surface patches (Fig. 4b–e; Supplementary Fig. 5–6).

 Domain structures were also colored according to the interaction energy between domain
 and peptidic residues (Fig. 5). Using the second-order interaction energies
 e(b) (b)
 i, j (αi, α j) ei, j (αi, α j) , consider a domain residue at position i, αi = a. The interaction energy
 is determined by the set of peptidic residues, p1, p2, … pn. We compute the total interaction
 energy is computed by averaging over all peptidic residues:

 n
 1
 eι = ∑ e(b)
 n i, j (a, p j)
 j=1

 We may refine this average energy by considering subsets of peptidic residues that lie within
 a certain distance (we use radii of 2.5Å, 5Å, and 10Å) of the i-th domain position, αi.
 Residue-residue distance is defined by the closest pair of atoms in the domain and peptidic
 residues.

 Nat Methods. Author manuscript; available in PMC 2020 July 06.
Cunningham et al. Page 16

 Force-directed layout algorithm
 Protein-protein interaction networks were laid out using a force-directed algorithm through
 the graph-tool Python package47 (https://graph-tool.skewed.de). This algorithm simulates a
Health Research Alliance Author Manuscript

 pair of physical forces—repulsion between nodes (i.e. nodes are analogous to electrons) and
 springs for edges (i.e. all edges are approximately the same length). The layout results from
 minimizing the opposing forces (i.e. repulsion between nodes and attraction based on
 springs), placing nodes with similar sets of adjacent nodes close to one another. In the
 context of proteins, this translates into the formation of neighborhoods that have similar sets
 of neighboring proteins. The non-random structure of the networks shown in Figure 6 and
 Supplementary Figure 7 arises directly from these calculations and does not involve human
 intervention.

 Website
 A Web-based tool was created to enable visualization of HSM interactions by capturing both
 topology and the PBD/peptide composition of individual nodes. At the review stage, the
 network can be viewed at (https://ProteinPeptide.hms.harvard.edu). A searchable interface is
 also provided to allow users to query for PPIs at varying likelihood thresholds.

 Reporting Summary
 Further information on research design is available in the Reporting Summary linked to this
 article.

 DATA AVAILABILITY—The domain-peptide and protein-protein interactions predictions
 are made available through a custom website (https://ProteinPeptide.hms.harvard.edu). The
 protein-peptide interaction data are also made available in figshare with the identifiers
Health Research Alliance Author Manuscript

 https://doi.org/10.6084/m9.figshare.10084745. Data used in training the model are available
 as Supplementary Data Set 2.

 CODE AVAILABILITY—All code and data used for training and testing HSM are available
 in a public repository at https://github.com/aqlaboratory/hsm.

 Supplementary Material
 Refer to Web version on PubMed Central for supplementary material.

 ACKNOWLEDGEMENTS
 This work was funded by NIH Grants U54-CA225088 and P50-GM107618 and by DARPA/DOD grant
 W911NF-14-1-0397 to PKS.

 References
 1. Gao A et al. Evolution of weak cooperative interactions for biological specificity. Proc. Natl. Acad.
 Sci 115, E11053–E11060 (2018). [PubMed: 30404915]
 2. Perkins JR, Diboun I, Dessailly BH, Lees JG & Orengo C Transient Protein-Protein Interactions:
 Structural, Functional, and Network Properties. Structure 18, 1233–1243 (2010). [PubMed:
 20947012]

 Nat Methods. Author manuscript; available in PMC 2020 July 06.
Cunningham et al. Page 17

 3. Mayer BJ The discovery of modular binding domains: building blocks of cell signalling. Nat. Rev.
 Mol. Cell Biol 16, 691–698 (2015). [PubMed: 26420231]
 4. Tompa P, Davey NE, Gibson TJ & Babu MM A Million Peptide Motifs for the Molecular Biologist.
 Mol. Cell 55, 161–169 (2014). [PubMed: 25038412]
Health Research Alliance Author Manuscript

 5. Scott JD & Pawson T Cell Signaling in Space and Time: Where Proteins Come Together and When
 They’re Apart. Science 326, 1220–1224 (2009). [PubMed: 19965465]
 6. Cesareni G, Gimona M, Sudol M & Yaffe M Modular Protein Domains. (John Wiley & Sons, 2006).
 7. Yang F et al. Protein Domain-Level Landscape of Cancer-Type-Specific Somatic Mutations. PLOS
 Comput. Biol 11, e1004147 (2015). [PubMed: 25794154]
 8. Miller ML et al. Pan-Cancer Analysis of Mutation Hotspots in Protein Domains. Cell Syst. 1, 197–
 209 (2015). [PubMed: 27135912]
 9. Rual J-F et al. Towards a proteome-scale map of the human protein–protein interaction network.
 Nature 437, 1173–1178 (2005). [PubMed: 16189514]
 10. Beck M, Claassen M & Aebersold R Comprehensive proteomics. Curr. Opin. Biotechnol 22, 3–8
 (2011). [PubMed: 20888217]
 11. Hein MY et al. A Human Interactome in Three Quantitative Dimensions Organized by
 Stoichiometries and Abundances. Cell 163, 712–723 (2015). [PubMed: 26496610]
 12. Levinson NM, Seeliger MA, Cole PA & Kuriyan J Structural Basis for the Recognition of c-Src by
 Its Inactivator Csk. Cell 134, 124–134 (2008). [PubMed: 18614016]
 13. Waksman G, Shoelson SE, Pant N, Cowburn D & Kuriyan J Binding of a high affinity
 phosphotyrosyl peptide to the Src SH2 domain: Crystal structures of the complexed and peptide-
 free forms. Cell 72, 779–790 (1993). [PubMed: 7680960]
 14. Demers J-P & Mittermaier A Binding Mechanism of an SH3 Domain Studied by NMR and ITC. J.
 Am. Chem. Soc 131, 4355–4367 (2009). [PubMed: 19267471]
 15. Tinti M et al. The SH2 Domain Interaction Landscape. Cell Rep. 3, 1293–1305 (2013). [PubMed:
 23545499]
 16. Hou T, Chen K, McLaughlin WA, Lu B & Wang W Computational Analysis and Prediction of the
 Binding Motif and Protein Interacting Partners of the Abl SH3 Domain. PLOS Comput. Biol 2, e1
 (2006). [PubMed: 16446784]
 17. Kundu K, Mann M, Costa F & Backofen R MoDPepInt: an interactive web server for prediction of
Health Research Alliance Author Manuscript

 modular domain–peptide interactions. Bioinformatics 30, 2668–2669 (2014). [PubMed:
 24872426]
 18. Mignon D, Panel N, Chen X, Fuentes EJ & Simonson T Computational Design of the Tiam1 PDZ
 Domain and Its Ligand Binding. J. Chem. Theory Comput 13, 2271–2289 (2017). [PubMed:
 28394603]
 19. Kaneko T et al. Loops Govern SH2 Domain Specificity by Controlling Access to Binding Pockets.
 Sci Signal 3, ra34–ra34 (2010). [PubMed: 20442417]
 20. AlQuraishi M, Koytiger G, Jenney A, MacBeath G & Sorger PK A multiscale statistical
 mechanical framework integrates biophysical and genomic data to assemble cancer networks. Nat.
 Genet 46, 1363–72 (2014). [PubMed: 25362484]
 21. Zarrinpar A, Bhattacharyya RP & Lim WA The Structure and Function of Proline Recognition
 Domains. Sci STKE 2003, re8–re8 (2003). [PubMed: 12709533]
 22. Denu JM & Dixon JE Protein tyrosine phosphatases: mechanisms of catalysis and regulation. Curr.
 Opin. Chem. Biol 2, 633–641 (1998). [PubMed: 9818190]
 23. Wagner MJ, Stacey MM, Liu BA & Pawson T Molecular Mechanisms of SH2- and PTB-Domain-
 Containing Proteins in Receptor Tyrosine Kinase Signaling. Cold Spring Harb. Perspect. Biol 5,
 a008987 (2013). [PubMed: 24296166]
 24. Harris BZ & Lim WA Mechanism and role of PDZ domains in signaling complex assembly. J. Cell
 Sci 114, 3219–3231 (2001). [PubMed: 11591811]
 25. Kolodny R, Koehl P, Guibas L & Levitt M Small Libraries of Protein Fragments Model Native
 Protein Structures Accurately. J. Mol. Biol 323, 297–307 (2002). [PubMed: 12381322]
 26. Nepomnyachiy S, Ben-Tal N & Kolodny R Global view of the protein universe. Proc. Natl. Acad.
 Sci 111, 11691–11696 (2014). [PubMed: 25071170]

 Nat Methods. Author manuscript; available in PMC 2020 July 06.
Cunningham et al. Page 18

 27. Stormo GD, Schneider TD, Gold L & Ehrenfeucht A Use of the ‘Perceptron’ algorithm to
 distinguish translational initiation sites in E. coli. Nucleic Acids Res. 10, 2997–3011 (1982).
 [PubMed: 7048259]
 28. Miller ML et al. Linear Motif Atlas for Phosphorylation-Dependent Signaling. Sci Signal 1, ra2–
Health Research Alliance Author Manuscript

 ra2 (2008). [PubMed: 18765831]
 29. Chatr-aryamontri A et al. The BioGRID interaction database: 2017 update. Nucleic Acids Res. 45,
 D369–D379 (2017). [PubMed: 27980099]
 30. Orchard S et al. The MIntAct project—IntAct as a common curation platform for 11 molecular
 interaction databases. Nucleic Acids Res. 42, D358–D363 (2014). [PubMed: 24234451]
 31. Huttlin EL et al. The BioPlex Network: A Systematic Exploration of the Human Interactome. Cell
 162, 425–440 (2015). [PubMed: 26186194]
 32. Huttlin EL et al. Architecture of the human interactome defines protein communities and disease
 networks. Nature 545, 505–509 (2017). [PubMed: 28514442]
 33. Rolland T et al. A Proteome-Scale Map of the Human Interactome Network. Cell 159, 1212–1226
 (2014). [PubMed: 25416956]
 34. Yoo J, Lee T-S, Choi B, Shon MJ & Yoon T-Y Observing Extremely Weak Protein–Protein
 Interactions with Conventional Single-Molecule Fluorescence Microscopy. J. Am. Chem. Soc 138,
 14238–14241 (2016). [PubMed: 27758101]
 35. Lee CH et al. A single amino acid in the SH3 domain of Hck determines its high affinity and
 specificity in binding to HIV-1 Nef protein. EMBO J. 14, 5006–5015 (1995). [PubMed: 7588629]
 36. Fernandez-Ballester G, Blanes-Mira C & Serrano L The Tryptophan Switch: Changing Ligand-
 binding Specificity from Type I to Type II in SH3 Domains. J. Mol. Biol 335, 619–629 (2004).
 [PubMed: 14672668]
 37. Schmidt H et al. Solution Structure of a Hck SH3 Domain Ligand Complex Reveals Novel
 Interaction Modes. J. Mol. Biol 365, 1517–1532 (2007). [PubMed: 17141806]
 38. Teyra J et al. Comprehensive Analysis of the Human SH3 Domain Family Reveals a Wide Variety
 of Non-canonical Specificities. Structure 0, (2017).
 39. Ma’ayan A et al. Formation of Regulatory Patterns During Signal Propagation in a Mammalian
 Cellular Network. Science 309, 1078–1083 (2005). [PubMed: 16099987]
Health Research Alliance Author Manuscript

 References (Online Methods-only)
 40. Wilson D et al. SUPERFAMILY—sophisticated comparative genomics, data mining, visualization
 and phylogeny. Nucleic Acids Res. 37, D380–D386 (2009). [PubMed: 19036790]
 41. Sokal RR & Michener CD A Statistical Methods for Evaluating Relationships. Univ. Kans. Sci.
 Bull 38, 1409–1448.
 42. DeLong ER, DeLong DM & Clarke-Pearson DL Comparing the areas under two or more
 correlated receiver operating characteristic curves: a nonparametric approach. Biometrics 44, 837–
 845 (1988). [PubMed: 3203132]
 43. Hornbeck PV et al. PhosphoSitePlus, 2014: mutations, PTMs and recalibrations. Nucleic Acids
 Res. 43, D512–D520 (2015). [PubMed: 25514926]
 44. Peng J & Xu J Raptorx: Exploiting structure information for protein alignment by statistical
 inference. Proteins Struct. Funct. Bioinforma 79, 161–171 (2011).
 45. Dinkel H et al. ELM—the database of eukaryotic linear motifs. Nucleic Acids Res. 40, D242–
 D251 (2012). [PubMed: 22110040]
 46. Benjamini Y & Hochberg Y Controlling the False Discovery Rate: A Practical and Powerful
 Approach to Multiple Testing. J. R. Stat. Soc. Ser. B Methodol 57, 289–300 (1995).
 47. Peixoto TP The graph-tool python library. (2017) doi:10.6084/m9.figshare.1164194.v14.

 Nat Methods. Author manuscript; available in PMC 2020 July 06.
You can also read