Urbanization Patterns around the North Sea: Long Term Population Dynamics, 1300-2015 - Cogitatio Press
←
→
Page content transcription
If your browser does not render page correctly, please read the page content below
Urban Planning (ISSN: 2183–7635)
                                                                                    2021, Volume 6, Issue 3, Pages 10–26
                                                                                  https://doi.org/10.17645/up.v6i3.4099

Article
Urbanization Patterns around the North Sea: Long‐Term Population
Dynamics, 1300–2015
Yvonne van Mil * and Reinout Rutte

Faculty of Architecture and the Built Environment, Delft University of Technology, The Netherlands;
E‐Mails: y.b.c.vanmil@tudelft.nl (Y.v.M.), r.j.rutte@tudelft.nl (R.R.)

* Corresponding author

Submitted: 30 January 2021 | Accepted: 2 April 2021 | Published: 27 July 2021

Abstract
Around the North Sea, how have port cities and cities in the hinterlands of port cities influenced one another in the past?
What possible links are there between population trends in various urban areas and time periods? Is it possible to identify
the origin of the urbanization patterns around the North Sea? To understand the current era of urbanization, we need to
analyze historical trends and urbanization patterns in the long term. By mapping the population figures for eight moments
in history and combining this with data on political boundaries and large infrastructures that facilitate flows of goods and
people, this article aims to contribute to an improved understanding of contemporary and historical urbanization trends
around the North Sea. It also presents the first spatial dataset on urban settlements around the North Sea by means of
a series of demographic maps, from 1300 to 2015. It provides a detailed explanation of the method used for mapping
and handling demographical data. Each map is accompanied by a brief explanation of the urbanization pattern, with spe‐
cial attention to identifying demographic and economic developments and possible clarifications for centers of gravity and
shifts. The maps lay the foundation for further research on social patterns and spatial developments in urban (port) regions
around the North Sea and for understanding urban culture through space and time. Port cities must be analyzed from the
perspective of the sea, which requires a rethinking of data sets and data borders, to understand the ways in which these
port cities have served as porous distribution hubs and as transit nodes for boundary‐crossing flows.

Keywords
demography; geo‐spatial mapping; infrastructure; North Sea region; political boundaries; population numbers; port cities;
urbanization patterns

Issue
This article is part of the issue “Planning for Porosity: Exploring Port City Development through the Lens of Boundaries and
Flows” edited by Carola Hein (Delft University of Technology, The Netherlands).

© 2021 by the authors; licensee Cogitatio (Lisbon, Portugal). This article is licensed under a Creative Commons Attribu‐
tion 4.0 International License (CC BY).

1. Introduction                                                   with the rest of the world. For centuries, people and
                                                                  goods have flowed through and around the North Sea.
Viewed from land and from various countries with their            Areas near the sea are linked by shipping, trade, and
boundaries, the North Sea is often perceived as a bar‐            the exchange of products and people passing through
rier. In The Edge of the World: How the North Sea                 port cities. These port cities facilitate flows of goods
Made Us Who We Are, Pye (2014) argues that the world              and people between a maritime foreland and cities in
looks different when the sea is perceived as facilitat‐           the hinterland. Ports are porous, so to speak, because
ing movement: Land becomes a barrier and the sea the              they facilitate flows that pass boundaries. This poros‐
bearer of trade and prosperity. The North Sea is an               ity generates urbanization around the port and in an
important link in shipping routes and connects Europe             often‐transnational hinterland connected to the port city

Urban Planning, 2021, Volume 6, Issue 3, Pages 10–26                                                                     10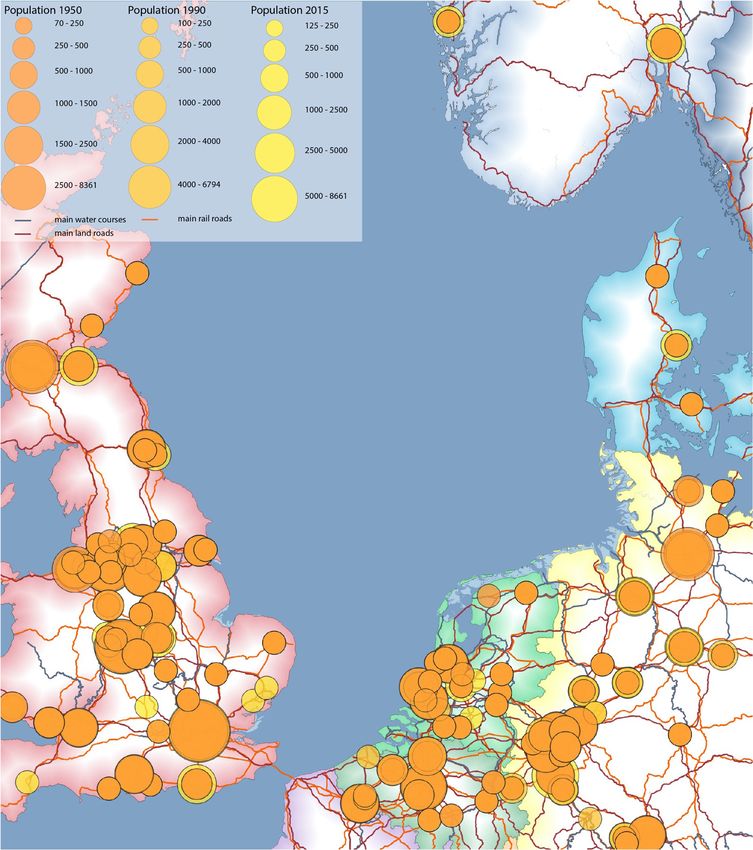
through infrastructure (see the editorial of this thematic    2.1. Working with Population Data from 1300 to 2015
issue of Urban Planning).
    Around the North Sea, port cities and the cities in       Since the introduction of geographic information sys‐
their hinterlands have been influencing one another           tems (GIS), online mapping interfaces, and available dig‐
throughout history (Couling & Hein, 2020). Academic           ital data, it has become easier to create detailed maps
research on urbanization is often nationally oriented,        from a huge number of statistical datasets. Although
focused on a specific country, and often attention is paid    creating and interpreting maps requires some techni‐
only to developments that took place either up to the         cal spatial knowledge, more people than ever can pro‐
Industrial Revolution or from the Industrial Revolution       duce them, relying on a series of well‐established car‐
onwards (De Vries, 1984; Lawton & Lee, 2002). By looking      tographic and statistical principles (O’Brien & Cheshire,
at urbanization from the perspective of the sea, we can       2016). This is especially the case when the maps concern
overcome the limitations of national thinking. To under‐      contemporary social, political, or demographic data from
stand the current urbanization pattern of cities around       a single national state. Finding—or building—a reliable
the North Sea, it is also helpful to consider a longer time   dataset and mapping long‐term urbanization patterns
frame, starting with city formation in the 11th–14th cen‐     in a region that includes multiple political boundaries,
turies up to the present. But how it is possible to get a     however, requires more specialized knowledge and labor
grip on developments over such a long‐term and across         to process datasets to obtain meaningful and reliable
such a large area? In this exploratory article we use pop‐    results. We will explain some of the important decisions
ulation numbers of cities around the North Sea, not dic‐      we needed to make concerning definitions and criteria
tated by national borders, as an indicator. We limit our‐     when we were selecting and interpreting data and data
selves to: 1) explaining how to classify, unify, and map      sources, as well as when we were classifying and unifying
the data; and 2) describing the urbanization patterns and     data in the context of porosity.
shifts that become visible on the maps and exploring the           In recent decades, several extensive and valuable
possible causes of these shifts.                              global demographic studies that take a long‐term per‐
                                                              spective have been published by Chandler (1987) and
2. Method for Mapping and Ranking Data                        Modelski (2003). Concerning Europe, the demographical
                                                              studies of De Vries (1984), Bairoch et al. (1988), Terlouw
Geographically, the North Sea is shaped by the coast‐         (1996), Pinol (2003), and Rutte and Abrahamse (2016)
lines of Norway, Denmark, Germany, the Netherlands,           should be mentioned. The two global studies, as well
Belgium, France, and the United Kingdom. In the south         as the European studies by De Vries (1984) and Bairoch
it borders the Strait of Dover near Calais; in the north,     et al. (1988) provided demographic data in tabular form
the Atlantic Ocean. But what does the area around             with an extensive account of the sources, definitions,
the North Sea consist of? One may argue about that.           and interpretations used, but these studies are limited
Throughout history, the North Sea has been described          in terms of time frame: Chandler’s (1987) study stops
from multiple perspectives by travelers, researchers,         at 1975, and is the only one to make it to the twen‐
and scientists (Blass, 2016; Couling & Hein, 2020; Pye,       tieth century. A disadvantage of the other three stud‐
2014). It has also been mapped countless times and for        ies is that they provided only a series of demographi‐
many purposes, from navigation to propaganda. In this         cal maps without the underlying data itself being visible
study we focus on the urbanization patterns around the        or accessible as spatial datasets. Until recently, the only
North Sea, with the sea as a shared body of water and         spatially explicit data on urban populations with global
foundation for our research. We pragmatically chose a         coverage was the United Nations World Urbanization
rectangular map cutout, on which population numbers           Prospects (Desa, 2014). This free available dataset is con‐
were charted for eight survey years from 1300 to 2015.        sidered the most authoritative source of global urban
The maps in this article have been compiled on the basis      population data and provides information on urban pop‐
of datasets that were produced as part of the research        ulations for major urban agglomerations around the
project “Ranking cities around the North Sea,” and that       world. However, these data are only available starting
were made possible in part with grants from DANS and          in 1950 (Reba, et al., 2016). In 2015, the Yale School
4TU (van Mil & Rutte, 2020a, 2020b). In addition to           of Forestry & Environmental Studies published the first
including a series of maps (1300, 1500, 1700, 1850, 1900,     spatially explicit dataset of urban settlements from a
1950, 1990, 2015) that allowed us to rank cities based        long‐term perspective, 3700 BC to AD 2000, by digitizing,
on population size, we include a series of three maps         transcribing, and geocoding the historical, archaeologi‐
in which the population numbers are combined with             cal, and census‐based urban population data of Chandler
flows (infrastructures) and boundaries (political borders)    and Modelski (Reba et al., 2016).
in 1500, 1900, and 2015. These maps give us a better               With these primary sources as a starting point, we
understanding of the porosity of port cities—the move‐        have developed and refined a dataset for the North
ments of people and goods around the North Sea and            Sea region (the Netherlands, Belgium, and parts of
political forces behind them.                                 the United Kingdom, Norway, Denmark, Germany, and
                                                              France) for eight moments in history, starting in 1300,

Urban Planning, 2021, Volume 6, Issue 3, Pages 10–26                                                                  11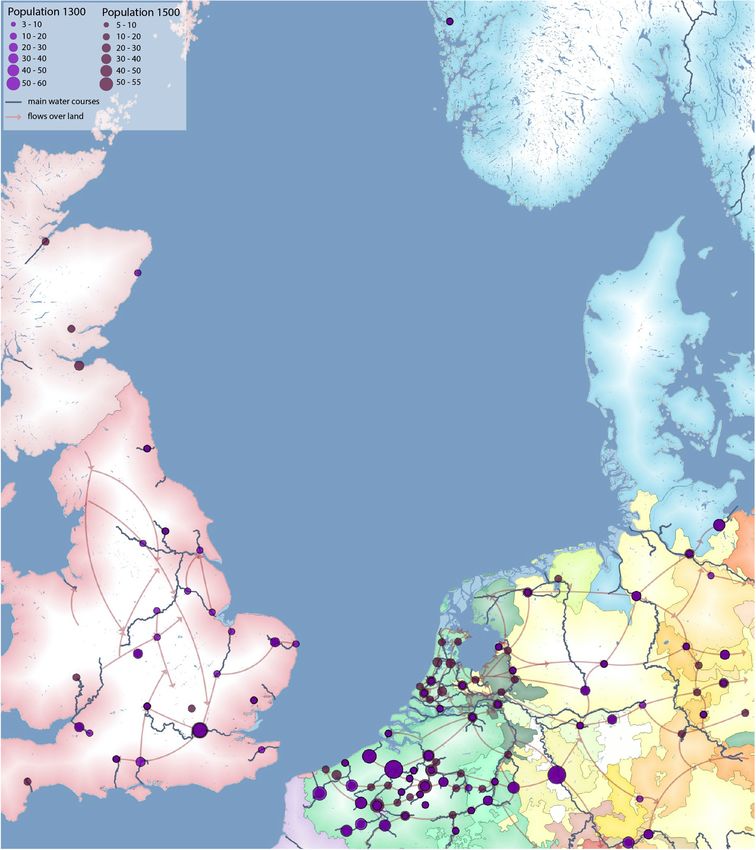
and we use steps of 200 years to capture major social,           increased significantly, not only because of urban growth
geo‐political, and economic changes. We add more                 but because Altona was incorporated by Hamburg in
detailed information through smaller steps of 25 to              1938. Another example of a change in the pattern, which
50 years; these are represented through the years 1850,          is not necessarily related to urbanization, is Wuppertal.
1900, 1950, 1990, and 2015. Identifying the appropriate          This German city was created in 1929 through the merger
time period to represent in a map in relation to space           of several villages and towns, including Elberfeld and
allows us to capture key changes and patterns, but a par‐        Barmen, which until 1900 were among the cities with
ticular time period may mean one thing for one conti‐            more than 50,000 inhabitants. Most municipal border
nent or country, and something else entirely for another.        changes were made in the second half of the 20th cen‐
Selecting time periods for a region that crosses several         tury. In the Netherlands, the number of municipalities
national borders, is therefore difficult. We tried to over‐      fell from over 1,000 in 1950 to just over 500 in 2000.
come restraints in the availability of data to allow a view      In England, the Local Government Act of 1972 revised all
from the sea. Based on the selected scale and time peri‐         administrative boundaries. The reclassification of cities
ods, we framed the data and added missing numbers                and municipal boundaries complicates the comparison
of cities and reference years on the basis of available          of census results between 1950, 1990, and 2015.
data from national or regional publications and open                  Another critical issue concerning selecting and inter‐
access databases including results of national censuses          preting data is availability. The further back in time, the
and the Eurostat Regional Yearbook by the European               more limited the available data. The data that do exist are
Commission (Kotzeva, 2019). For each reference year we           often not comparable from one city to another. Given
selected only the largest cities in terms of population,         that historical sources are often incomplete, the qual‐
each with its own minimum threshold: In 1300 the min‐            ity of the data is uneven and often does not permit
imum is 3,000 inhabitants; in 1500 it is 5,000; in 1700 it       full understanding or comparison. Translating historical
is 7,000; and so on, with a maximum of about 100 cities          developments into maps involves numerous questions
per reference year. Chandler (1987), De Vries (1984), and        about which dates to choose. A date that is meaningful in
Bairoch et al. (1988) relate the threshold to urbanity or        one country may have less relevance for another, making
the number of urban inhabitants, but as argued below,            the choice of a date for comparative research particularly
definitions of each differ widely. By using a maximum            difficult (Hein & van Mil, 2019). Population censuses and
of the 100 largest cities per reference year it is possible      other methods of measuring populations record num‐
to provide insight into shifts in the urbanization patterns      bers in intervals. These intervals do not always run paral‐
around the North Sea. After collecting and processing the        lel to the chosen reference years; circumstances such as
population numbers, we have harmonized the data and              war, natural disaster, and political agitation can disrupt
where necessary spatialized the dataset by providing lat‐        the interval. For reference year, 1850 for example, the
itude and longitude values.                                      results of the census from 1851 are the most accurate
     In selecting data, before establishing municipal            for French and English cities; in Belgium the most accu‐
administrative boundaries, it is important to define ‘city’      rate would be the results of 1846; for Germany, 1849,
and ‘city population,’ especially in the periods up to 1850.     and for Denmark, 1845 or 1855. Estimates are there‐
There is a wide variation in definitions of urbanity and         fore inevitable. To avoid a semblance of precision and
it is well established that ‘urban’ is a multi‐dimensional       yet show a reliable pattern, the population numbers are
concept, and that the city is defined in myriad ways by dif‐     rounded to thousands. Additionally, we attempt to cross‐
ferent disciplines and research communities (Reba et al.,        check these demographic factors, definitions, and meth‐
2016). Chandler for example, defines a city as “urban            ods when possible. Undoubtedly, errors remain, and a
area including suburbs lying outside of the municipal            more rigorous process would strengthen the values in
area, and omitting farmland lying within the municipal‐          the dataset. Unlike some other demographic data, such
ity” (Chandler, 1987, p. 1). Bairoch et al. (1988) aimed to      as Chandler’s digital dataset (Reba et al., 2016), we did
improve Chandler’s population estimates by also taking           not add a reliability rating by including a number for cer‐
into consideration the land type within city walls (com‐         tainty to the dataset.
mercial, residential, gardens, or grazing), uninhabitable             To classify data for mapping, it is crucial to decide
space within buildings, and the density of occupations,          both the number of classes and the method for breaking
and suggests increasing Chandler’s estimate of European          data into ranges. In classifying the population numbers,
city values by 15 percent (Bairoch et al., 1988; Reba, et al.,   we chose to distinguish six classes, which reduces the
2016). In modern times, most scientists and disciplines          chance of data generalization and increases readability.
define an urban area using administrative or political           Generalized data is easy to read and remember but may
boundaries, but there are national differences in how            gloss over some important aspects of data and create
municipal boundaries are determined. For instance, the           artificial geographic patterns by lumping together many
boundaries of German urban municipalities are much               places that are in fact quite different. Too many classes
wider than those of Dutch municipalities. Moreover, cities       would increase the risk of map reading errors because
and their boundaries are constantly changing. Between            more variation in size means a smaller distinction in
1900 and 1950, for example, the population of Hamburg            classes, which is more difficult to identify. GIS allows

Urban Planning, 2021, Volume 6, Issue 3, Pages 10–26                                                                     12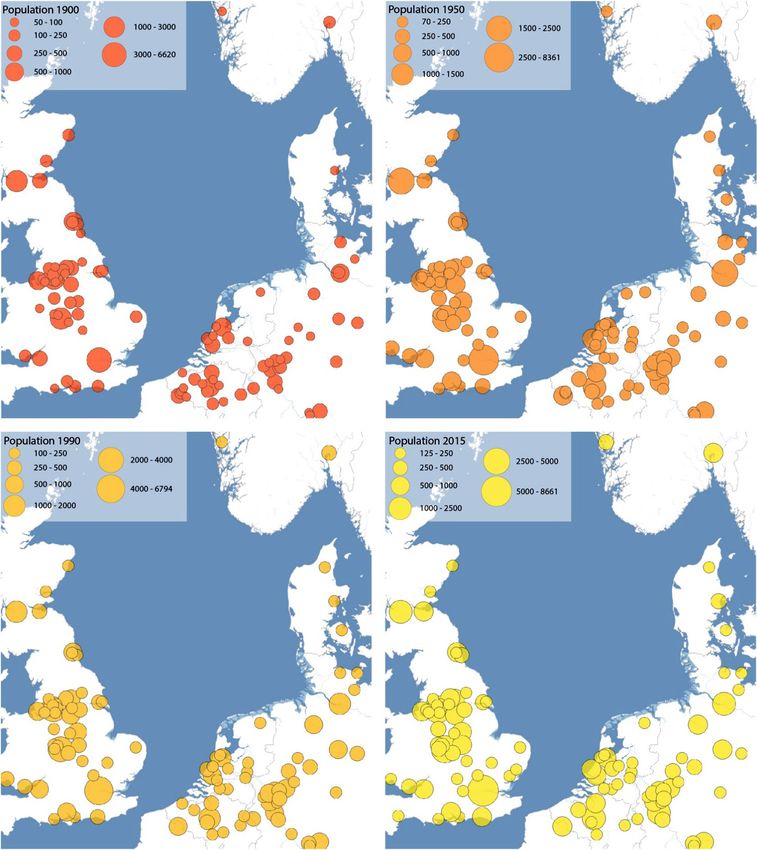
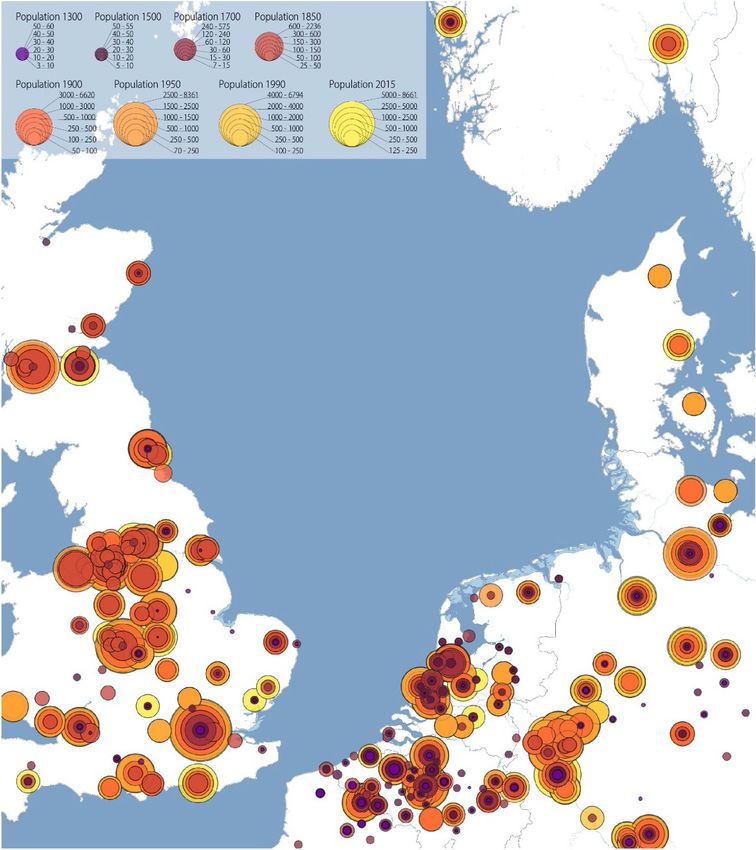
you to choose from a variety of preset classification         of maps that show developments and changes within
methods, including Equal Interval, Quantile (equal num‐       the population pattern over time, it is important that
bers), and the Jenks (1967) natural breaks. These clas‐       the classification can be applied to all maps and that
sification methods did not adequately differentiate the       reference years match. The Jenks classification system
required spatial patterns, mainly because the outliers—       was modified to include more categories for cities with
in this case the large cities with high population num‐       a lower population and fewer categories for high popu‐
bers such as London, Hamburg, and Brussels—occupied           lations and to align the categories of the reference years
the three highest categories, while the majority of the       from 1300 to 2015. Between 1300 and 1500, for example,
cities—with low population numbers such as Cambridge,         the population remains almost the same: Only the min‐
Oslo, and The Hague—were combined into the lowest             imum threshold and the highest population differ. With
class. Therefore, a manual method was developed, based        the Jenks classification method, the breaks would be
on a modified Jenks classification. Jenks natural breaks is   unequal, but are kept the same. To visualize the increase
a commonly used method and a kind of optimal classifi‐        in population over time, the size of the symbols has
cation that finds class breaks that (for a given number of    also been manually adjusted. However, the differences
categories) will minimize within‐class variance and max‐      in population from 1300 to 2015 are too big for a true
imize between‐class differences (Jenks, 1967). A disad‐       continuous series. Moreover, the aim of this study is to
vantage of this approach is that each dataset generates       show shifts in urbanization patterns and not the develop‐
a unique classification solution. Since we make a series      ment of population over time (see Figure 1).

Figure 1. The result of mapping and ranking population numbers in eight survey years. Map by Yvonne van Mil. Source:
van Mil and Rutte (2020a, 2020b).

Urban Planning, 2021, Volume 6, Issue 3, Pages 10–26                                                                 13
2.2. Working with Historical Maps and Digital Datasets         ways have been constructed (canals). After 1800, country
about Infrastructure and Political Boundaries                  roads and railways increasingly took over the transport of
                                                               people and goods. However, water transport remained
Finding—or building—reliable data sets is one of the           important, especially the newly constructed and mod‐
biggest challenges in research. It requires the neces‐         ernized canals. For the reference year 1500, we only
sary knowledge and labor to process datasets to obtain         show waterways and possible routes—flows over land.
meaningful and reliable results. Historical maps and           For the other two reference years, we show roads, water‐
existing datasets imply definitions and decisions; they        ways, and railways.
reflect local particularities and historical choices that          The roads and railways shown on the map are
may already shape answers. In addition, the effective‐         primary routes, meaning transport connections on
ness of a map is a result of selectivity, but before select‐   land between major cities and industrial areas of
ing or determining data, it is important to acknowledge        (inter)national importance. On the map of 1500 and
the purpose and the historical and social context of the       1900, the land roads are not by definition the primary,
maps in order to select the necessary information (Hein        or most important routes or flows: Formal hierarchy in
& van Mil, 2019). To estimate the reliability of a map, it     roads has only existed since the 19th century. The French
is important to know the function: Who is the cartogra‐        government was the first to introduce a road network
pher or client and what was the purpose of the map?            that distinguished between different road types serving
A map is first and foremost a tool of communication, and       different purposes. At the top of the hierarchy were the
to understand a map we need to know both the sup‐              Grandes Routes, which started in Paris and continued
ply side (the maker) and the demand side (the client).         to a major city or seaport or to an international bor‐
We can only understand maps if we know what the car‐           der (Blond, 2013). At the beginning of the 19th century,
tographer wanted to show, to whom, and why. The pur‐           Napoleon Bonaparte continued the French hierarchi‐
pose of the map determines the scale, the reliability,         cal system of roads (Routes Impériales) throughout the
implementation, and content (Renes, 2016). As Segal            French Empire, including Belgium and the Netherlands
(2020) shows in his article “Flow Mapping through the          (Schipper, 2008). Since the introduction of motorized
Times,” infrastructures—especially canals and railways—        transport, a hierarchy in roads was standardized at a
were used to display a country’s sophistication and pros‐      national level and after 1950 on a European level (E‐road
perity: “Movement and flows became [from the mid‐              and TEN‐T network).
19th century] the signifiers of cultural and scientific            The first step in the map‐making process is find‐
progress, while a lack of movement was a sign of retar‐        ing reliable sources that accurately reflect the most
dation” (Segal, 2020, p. 92). Topographical and thematic       recent reference year. Because we are examining dif‐
maps from the 19th to mid‐20th century support this            ferent geographical regions around the North Sea, it
assumption; railways and canals are the most or some‐          has been important to find global or continental GIS
times the only indicated infrastructures on maps, and          datasets that cover several national states with suffi‐
are represented as the drivers of flows of people and          cient spatial resolution to analyze and compare the
goods. This complicates the mapping of important infras‐       regions in a consistent and systematic way. National
tructures in history. For the reference years 1500, 1900,      and regional data may be more detailed and accurate,
and 2015, a first attempt was made to map the main             but is often not freely accessible and each dataset has
infrastructures over water, land, and rail for the North       its own definitions and criteria, which makes combin‐
Sea region, and combine them with political bound‐             ing and comparing difficult (Hein & van Mil, 2019). As a
aries. In this section some difficulties and decisions are     starting point for the dataset on infrastructure we used
explained in more detail.                                      the EuroGlobalMap from Eurogeographics (2017). After
    Infrastructure usually refers to the total of facili‐      selecting, adjusting, and preparing the GIS datasets to
ties such as railways, airports, ports, cabling, sewerage,     obtain the required maps for reference year 2015, new
and road networks. In this article, by ‘infrastructure’ we     data must be generated for the years 1900 and 1500. For
mean physical connections over land, water, and rail,          this, we have relied on national sources and historical
as connections facilitating flows of goods and people.         maps. For 1900, changes in the infrastructure and land‐
Roads enable flows, but they also restrict them in the         scape can be mapped on the basis of regularly updated
sense that they define the routes flows can follow and         national topographic maps, such as Ordnance Survey
thus where it is possible to go (Edwards, 2003). Flows of      maps, supplemented with thematic maps. For 1500, we
goods can mean economic prosperity and urban growth.           used two studies on land routes in the Netherlands, one
Infrastructure, especially the construction of new canals,     by Horsten (2005) and one by Kosian et al. (2016), supple‐
land, and railroads, has therefore been the cause of           mented with indications and assumptions based on lit‐
conflict between cities and regions for ages (De Pater,        erature, national topographical maps, and logic. For the
2009). In 1500, waterways were the main transport              waterways in 1500, we used the Stedenatlas Jacob van
routes. River access was one of the main reasons for           Deventer (Rutte & Vannieuwenhuyze, 2018) and London:
the emergence of urban centers. For centuries water‐           The Illustrated History (Ross & Clark, 2008, p. 68). The
ways have been dammed and deepened, and new water‐             political boundaries are obtained from Euratlas (n.d.).

Urban Planning, 2021, Volume 6, Issue 3, Pages 10–26                                                                  14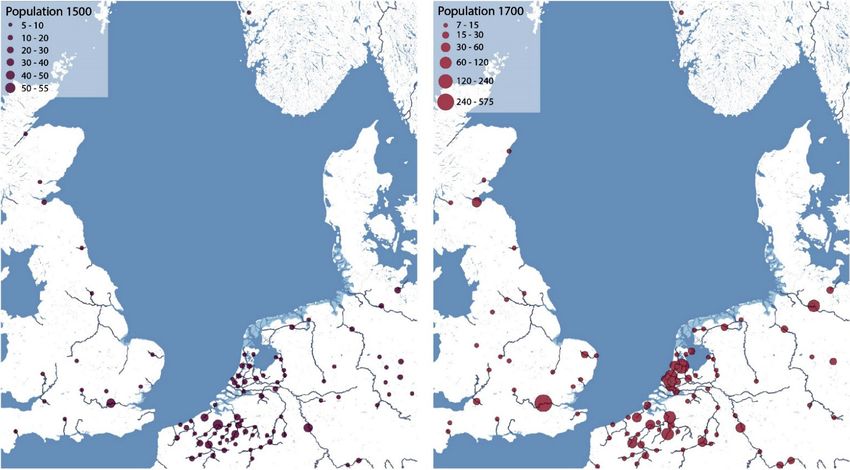
3. Description and Exploration of Urbanization                The cities in the German countries, apart from Cologne
Patterns and Shifts                                           and Lübeck, for example Mainz and Bremen, were more
                                                              dispersed and were spread across several principalities.
3.1. 1300: Foundations                                        Here we find a good example of porosity in the Middle
                                                              Ages: The sea with the flows was important, the bound‐
The largest concentration of cities and the center of         aries were not. As in the Low Countries, rivers flowing
economic gravity was found in the principalities of           into the North Sea were of great importance: In addi‐
the Southern Netherlands: Flanders, Brabant, Artois,          tion to the Rhine, there were the Elbe and the Weser.
Hainaut, and Liège (see Figure 2). This is also where         In England, the orientation of many towns towards the
seven of the ten largest cities in 1300 were located:         North Sea is also striking. Great Yarmouth is the only
Ghent, Bruges, Ypres, Saint‐Omer, Lille, Arras, and Douai.    one close to the coast, the others are connected to the
In addition, London, Cologne, and Lübeck were among           North Sea by rivers and include London and Oxford via
the largest ten. Both the largest cities and the other        the Thames, Norwich like Great Yarmouth via the Yare,
cities in the Southern Netherlands were connected to          Boston and Lincoln via the Witham, and Hull and York
the North Sea by navigable water: The rivers Scheldt,         via the Humber‐Ouse. In Scandinavia only Bergen is on
Lys, IJzer, Aa, Meuse, and tributaries. In the Northern       the map.
Netherlands, cities such as Dordrecht, Nijmegen, and              During the time of city formation—the 11th–14th
Deventer that were situated on the major rivers Rhine,        centuries—hundreds of cities sprang up around the
Meuse, and IJssel, also flowed into the North Sea. Delft      North Sea (Verhulst, 1999). Only a limited number
and Leiden lay along a trade route through Holland, a cru‐    were important and appeared on the map: These were
cial north‐south water link for northwest European trade.     the cities with a favorable location and a good water

Figure 2. Cities around the North Sea area with the largest population in 1300, combined with main water courses. Map
by Yvonne van Mil. Source: van Mil and Rutte (2020a, 2020b).

Urban Planning, 2021, Volume 6, Issue 3, Pages 10–26                                                               15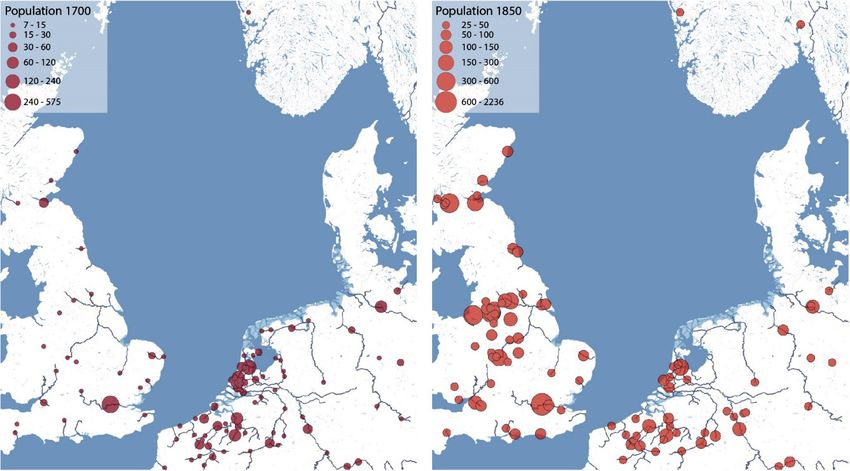
connection to the North Sea. Intensive contacts existed          3.2. 1500: Crossroads
between these port cities (Ayers, 2016, pp. 33–70).
Moreover, these cities, especially the larger ones, were         Compared to 1300, four striking trends can be observed
hubs between the cities in the hinterland and trade flows        in 1500 (see Figure 3): 1) An increased concentration
across the North Sea. The high concentration of cities in        of cities in the Southern Netherlands, but also some
the Southern Netherlands is probably due to their central        shifts, such as Antwerp, Mechelen, and Brussels emerg‐
location in relation to the German and French hinterland         ing at the expense of Saint‐Omer, Ypres, and Douai;
as well as the North Sea and England and, furthermore,           2) An increase in the number of cities in the Northern
to the fertile agricultural land that was easily accessible      Netherlands, especially in the principality of Holland and
from the rivers. This was an area where a large group            along the river IJssel, for example Haarlem, Amsterdam,
of cities could flourish, together forming a solid eco‐          and Kampen; 3) A decrease in the number of cities in
nomic system (Boone, 2013). The pattern formed by the            England as well as a contraction of those remaining; and
cities in the Southern Netherlands also had to do with           4) Little change in the German countries, where Cologne
the fact that, in addition to waterways, there were land‐        remained the largest city.
based trade routes, via Cologne, between the Rhineland                In 1500, the historical sources and available data
and the Flemish coastal area on the North Sea (Verhulst,         make it possible to represent land trade flows on the map
1996). It is striking that the largest concentration of cities   (see Figure 4). For example, the connection between
in the Southern Netherlands and the cities in the German         the distribution pattern of the cities in the Southern
lands, in contrast to the kingdom of England, are situated       Netherlands and the important routes to Cologne and
in a fragmented area with many political boundaries, gov‐        the Rhineland come into focus. It also becomes clear
erned by many lords, dukes, counts, and bishops, who             that in the Low Countries along the North Sea, water‐
did not always seem able to exercise much power. This            ways were the primary infrastructure, while the German
phenomenon is characteristic of the Low Countries and            countries depended on overland routes for east‐west
the German countries, especially during the 12th–13th            connections. In England, on the other hand, the rivers
centuries: the German emperor, who was officially in             to the North Sea were decisive for east‐west trade.
charge, had little authority. Some lords, such as the            The north–south connections were overland. Ostensibly,
Counts of Flanders, the archbishops of Cologne, the bish‐        these land routes run partly from nowhere to nowhere,
ops of Munster, the Dukes of Brabant, and the Counts             but that is because cities smaller than the largest
of Holland knew how to take advantage of this, but it            100 in 1500 are missing from the map. Proportionally,
was mainly the inhabitants of the cities who knew how to         cities in England were hardest hit by the plague, which
benefit: Burghers, merchants, and skippers became pow‐           claimed many victims in Europe in the mid‐14th century
erful (Blockmans, 2010, pp. 23–161).                             (Pounds, 1990, pp. 187–209). The Northern Netherlands

Figure 3. Cities around the North Sea area with the largest populations in 1300 and 1500, combined with the main water
courses. Map by Yvonne van Mil. Source: van Mil and Rutte (2020a, 2020b).

Urban Planning, 2021, Volume 6, Issue 3, Pages 10–26                                                                    16
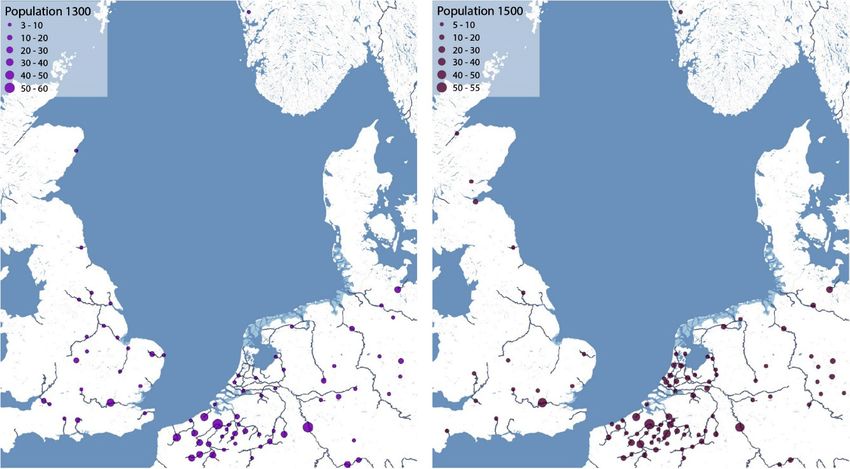
Figure 4. Cities around the North Sea area with the largest populations in 1300 and 1500, combined with political bound‐
aries and flows of goods and people over land and water in 1500. Map by Yvonne van Mil. Source: van Mil and Rutte (2020a,
2020b).

in particular seems to have suffered less from the plague:      In this period, the transit function of the port cities in
The number of towns increased between 1300 and 1500,            Holland became more important (Brand, 2011). Its loca‐
perhaps even thanks to the demographic and economic             tion at the junction of the trade flows by water from
decline in England. In a broader perspective, the develop‐      the Rhineland to the North Sea and from the Baltic to
ments in the Northern Netherlands during the 14th–15th          the south was particularly favorable. By 1500, much of
centuries were exceptional, because in large parts of           the Low Countries was in the hands of the Burgundian
Western Europe this was an era of decline or contraction.       princes, but it will be shown below that the remarkable

Urban Planning, 2021, Volume 6, Issue 3, Pages 10–26                                                                   17
fragmented political geography benefiting cities and citi‐    did the rest of the Southern Netherlands, which were
zens did not end there.                                       under the yoke of the Spanish rulers. Many people from
                                                              Flanders, Brabant, Artois, and Hainaut fled north, particu‐
3.3. 1700: Shifts                                             larly to cities in Holland, such as Rotterdam, Delft, Leiden,
                                                              and Haarlem. These cities formed a tight economic sys‐
Comparing the map of 1700 with that of 1500, four             tem together with the most important city, Amsterdam,
striking trends can be identified (see Figure 5): 1) The      which took over the role of world seaport from Antwerp
concentration of largest cities shifted from the Southern     (Lesger, 1993). The Republic experienced a Golden Age
Netherlands to the Northern Netherlands, with the             as a seafaring nation. This attracted many immigrants
center of economic gravity becoming the province of           from the German countries too, both from the cities and
Holland, with Amsterdam as its largest city, accompanied      the countryside (De Vries, 1984, pp. 151–172; Terlouw,
by a group of other large cities including Leiden, Haarlem,   2009). Cities in the hinterland stagnated, but a limited
Delft, Rotterdam, Gouda, and Dordrecht; 2) There was          number of port cities favorably situated in relation to
a decline in the number of cities in the Southern             the North Sea, experienced golden times during the
Netherlands and a contraction of the remaining ones,          17th century: Hamburg, Bremen, Emden, Edinburgh, and
particularly of Ghent, apart from Brussels, which grew;       London, because these were sea‐minded, porous port
3) While Bremen and Emden emerged during this period,         cities, entrance gates to the hinterland, like Amsterdam
there was a decline in the number of cities in the German     and Rotterdam. In the late 16th century and during the
countries, apart from Cologne, which remained impor‐          17th century, Holland became the economic heart of
tant, and Hamburg, which grew strongly; and 4) The            Europe largely because of a number of economic and
number of cities in England increased and London and          political‐administrative shifts in the center of gravity, not
Edinburgh became much larger.                                 only from the Southern to the Northern Netherlands
    The shift from the Southern Netherlands to the            but also a shift from lords to burghers. We saw ear‐
Northern Netherlands is inextricably linked to political      lier that in the late Middle Ages the burghers in the
boundaries and the Eighty Years’ War (see Figure 6).          towns gained in influence at the expense of rulers like
The cities and provinces of the young Dutch Republic          the Counts of Flanders or the Dukes of Brabant. In the
fought to free themselves from Spanish rule and gain          15th century, the Dukes of Burgundy took over in the
political independence, but above all economic free‐          Low Countries, which subsequently, in the 16th cen‐
dom, which brought about an enormous flow of peo‐             tury, under Emperor Charles V and his son and succes‐
ple and trade. In 1585, the Scheldt was blocked by the        sor Philip II, were absorbed into the Spanish‐Habsburg
Dutch rebels and Antwerp fell into Spanish hands, as          Empire. However, during the Eighty Years’ War, the urban

Figure 5. Cities around the North Sea area with the largest populations in 1500 and 1700, combined with main water
courses. Map by Yvonne van Mil. Source: van Mil and Rutte (2020a, 2020b).

Urban Planning, 2021, Volume 6, Issue 3, Pages 10–26                                                                    18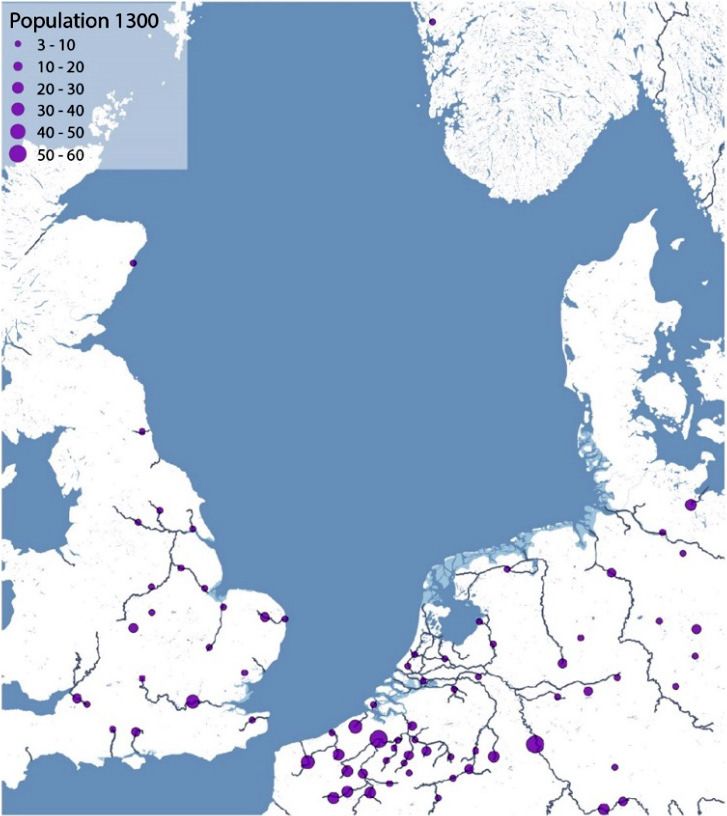
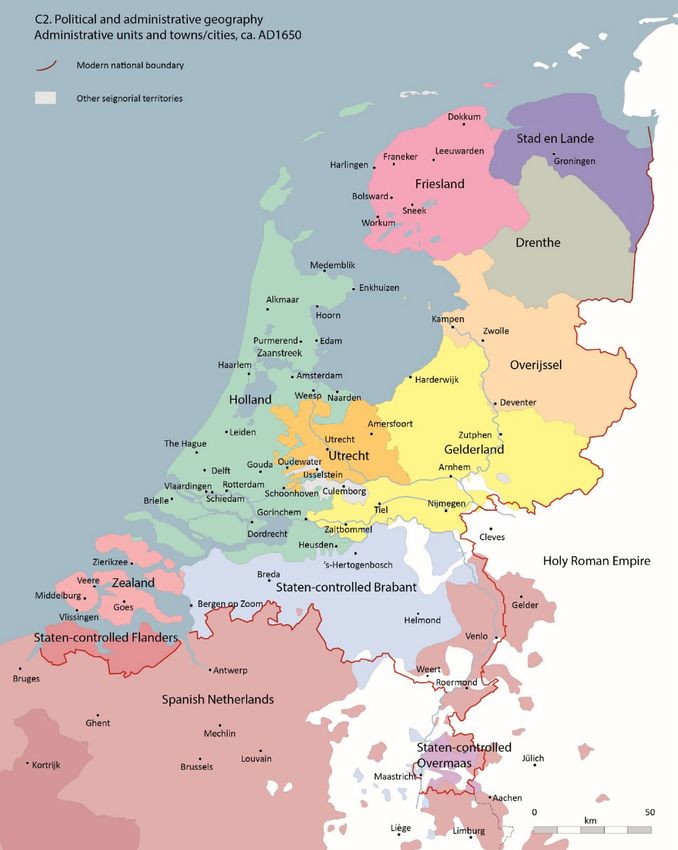
Figure 6. Political and administrative boundaries in the Netherlands, ca. 1650. Source: Rutte and Abrahamse (2016).

citizenry in the fragmented area of the seven provinces         growing industrial cities, the largest being Manchester,
of the Dutch Republic began to act with increasing inde‐        Birmingham, Leeds, and Sheffield; 2) London and
pendence while the economies of the cities in Holland           Edinburgh continued to grow; 3) The North Sea ports
flourished (Rutte & Abrahamse, 2016, pp. 188–197).              in the United Kingdom declined in relation to the
                                                                Atlantic ports of Glasgow, Liverpool, and Bristol, although
3.4. 1850: Changes                                              Newcastle, Hull and, as said, London, also experienced
                                                                strong growth; 4) Cities in the former Dutch Republic
In the 150 years between 1700 and 1850, six striking            (since 1815, the Kingdom of the Netherlands) sharply
trends occurred (see Figure 7): 1) The concentration of         declined and cities in the provinces of North‐Holland and
the largest cities shifted from the Northern Netherlands        South‐Holland, including Leiden, Delft, and Gouda, also
to England, with a new center of economic activity              contracted; 5) The number of cities increased in north‐
blossoming in the Midlands, where there were rapidly            ern France, the south of the young kingdom of Belgium,

Urban Planning, 2021, Volume 6, Issue 3, Pages 10–26                                                                    19
Figure 7. Cities around the North Sea area with the largest populations in 1700 and 1850, combined with main water
courses. Map by Yvonne van Mil. Source: van Mil and Rutte (2020a, 2020b).
and around Liège; and 6) The Ruhrgebiet also saw new ing countries and as a guiding factor for the patterns
cities emerge. of cities seems to have diminished during this time, not
During the Dutch Golden Age, the administration only because of the new infrastructure of railroads, but
of the Republic was characterized by a combination of also because industrialization was largely determined by
seven united provinces, a group of powerful cities, stad‐ the presence of raw materials. Undoubtedly, the large
holders, and so‐called raadspensionarissen, and during sphere of influence of world powers such as the British
the 18th and 19th centuries the British Empire devel‐ Empire and the formation of nation‐states also played a
oped into a world power (see Figure 8). London was role in this.
both the capital of the empire and a major port. In addi‐
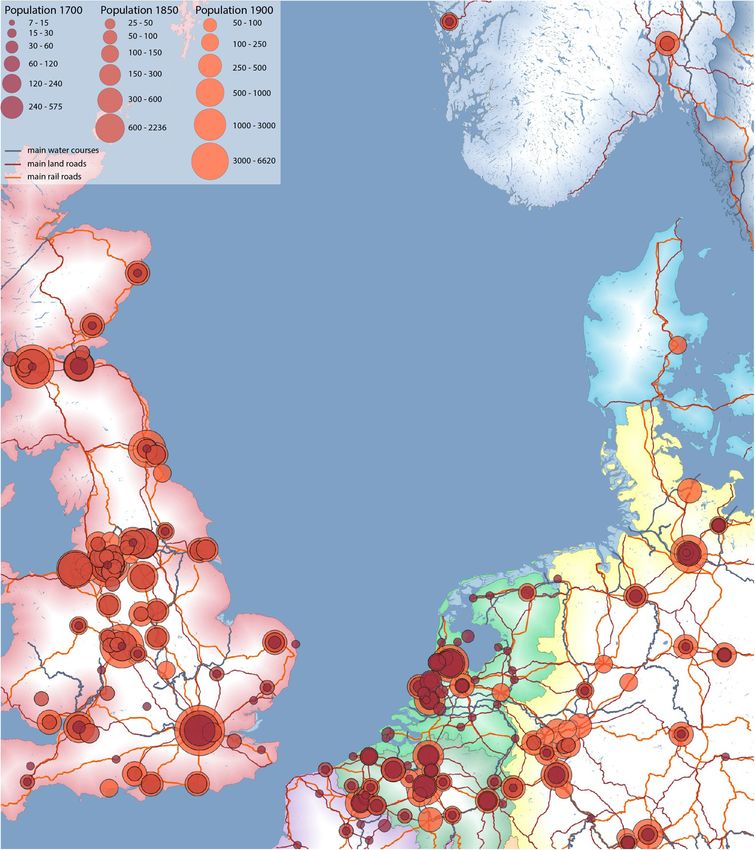
tion to a British hegemony at sea and overseas ter‐ 3.5. 1900–2015: Consolidation
ritories, the Industrial Revolution during the second
half of the 18th century was decisive. Raw materials In 1900, the trends that came into view in 1850 contin‐
including coal and ores, equipment like steam engines ued (see Figure 9). After a long period of stagnation, in
and blast furnaces, and a new infrastructure of canals the late 19th century cities in the Netherlands became
and railroads brought about major changes (Hohenberg industrialized and began to grow. This happened much
& Lees, 1995, pp. 179–214). Industrialization led to later than in the Midlands, northern France, Belgium,
an unprecedented increase in scale, especially in the and the Ruhrgebiet. The seaports of Hamburg, Antwerp,
Midlands, where necessary raw materials were mined. Rotterdam, Newcastle, Glasgow, and Liverpool also grew
Consequently, the seaports on the west coast of the rapidly. Between 1900 and 1950, the population of the
United Kingdom experienced great growth. On the conti‐ cities that were already large in 1900 rose sharply. And
nent, too, industrialization took off in the vicinity of coal finally, some cities in Denmark appear on the map, in
basins, to which the new infrastructure of canals and addition to Bergen and Oslo in Norway. These develop‐
railroads was adapted. This transformation took place ments result in a more even distribution pattern of cities
during the early 19th century in the border region of and not one but several centers of economic gravity.
France and Belgium, around Liège, and in the Ruhrgebiet. However, by 1990, many cities saw their population num‐
For the Ruhrgebiet, the Rhine was the main transport bers stagnate or decline, as compared to 1950. This is
artery. Rotterdam became an important transhipment particularly the case with the most industrial cities, such
port. Industrialization enhanced the importance of North as Manchester, Leeds, and Sheffield. Many seaports in
Sea ports as links in the transport chains of raw mate‐ the United Kingdom also saw a decrease in population in
rials and other products. At the same time, the signifi‐ 1990, particularly Liverpool. In 2015, a modest recovery
cance of the North Sea as a link between the surround‐ in population numbers appears to have begun.
Urban Planning, 2021, Volume 6, Issue 3, Pages 10–26 20Figure 8. Cities around the North Sea area with the largest populations in 1700, 1850, and 1900, combined with political
boundaries and infrastructure over land, rail, and water in 1900. Map by Yvonne van Mil. Source: van Mil and Rutte (2020a,
2020b).
During the 19th century, a major renewal of infras‐ the distribution pattern of cities during the 20th cen‐
tructure took place with the construction of canals and tury. The question is why. Of course, the effects of
railways, which connected both existing cities and new de‐industrialization during the second half of the 20th
industrial cities (Lees & Lees, 2013). Country roads were century should not be underestimated—think of the
improved and renewed, and during the 20th century net‐ stagnating or declining populations in many cities, the
works of highways were built. Looking at the maps from enormous change in function in industrial cities and
1900–2015 (see Figure 10), it is striking that these infras‐ port cities, or the differentiation that has occurred. For
tructural innovations did not lead to major changes in example, London is no longer an important seaport,
Urban Planning, 2021, Volume 6, Issue 3, Pages 10–26 21Figure 9. Cities around the North Sea area with the largest populations in 1900, 1950, 1990, and 2015 in thousands. Map by Yvonne van Mil. Source: van Mil and Rutte (2020a, 2020b). whereas Hamburg, Rotterdam, and Antwerp remain as been intensely concerned with the development of their such, but compared to the shifts we saw in the previ‐ countries, the well‐being of their citizens, and with the ous centuries, since 1900 these have been less signifi‐ demographic and economic development of their cities, cant. It is tempting to look for the answer in the rise of an unprecedented phenomenon, into which sweeping national states with strong governments in the 19th and shifts such as those during the late 16th‐early 17th or 20th centuries, eventually cooperating in the European during the 18th century do not fit, since they caused dra‐ Union, but that requires further research. In any case, matic decline for a long period of time in many cities. for the last 100 years or so, national governments have Urban Planning, 2021, Volume 6, Issue 3, Pages 10–26 22
Figure 10. Cities around the North Sea area with the largest populations in 1950, 1990, and 2015, combined with political
boundaries and infrastructure over land, rail, and water in 2015. Map: Yvonne van Mil. Source: van Mil and Rutte (2020a,
2020b).

4. Conclusions                                                  The porous seaports serve as distribution valves; they
                                                                connect to the hinterland through canals, rivers, rail‐
Taking a bird’s eye view of long‐term development               roads, and motorways, sometimes blocked by national
from 1300 to the present day, the areas around the              borders. But from the moment industrialization reached
North Sea seem to have worked like communicating ves‐           the continent, not one, but several centers of economic
sels: The Southern Netherlands fall back, the Northern          gravity emerged. The role of the North Sea in the flows
Netherlands rise, Holland falls into decline, England rises.    between the surrounding areas diminished from that

Urban Planning, 2021, Volume 6, Issue 3, Pages 10–26                                                                  23
point on. Remarkably, until the shift to England, the cen‐ We hope that with this exploratory article we have
ter of gravity was in politically fragmented areas, where made it clear that combining, classifying, unifying, and
cities and citizens had much influence, while later on, mapping data offers many possibilities for making long‐
nation‐states with national boundaries and influential term spatial and social‐cultural developments transpar‐
governments emerged. In addition to the centers of grav‐ ent, and useable for different goals. We are aware of
ity, there are cities like Cologne and Hamburg that have the limitations of (historical) maps as a source, as well
developed steadily from 1300 to the present. It also as maps as scientific evidence. In this study, the maps
appears that dynamics vary from area to area. England provide insight into large amounts of spatial data, which
experienced the most numerous and significant changes make it possible to study and understand urbanization
over the course of 700 years: It hosted a considerable patterns in a Western European context, and a means
number of North Sea ports in 1300, then underwent a to communicate by presenting the data in a series of
prolonged decline due to the plague. It saw renewed maps. By not only publishing the outcome—the written
prosperity in the 18th century, followed by major growth as well as the mapped results—of our study, but also the
during industrialization, a new center of gravity in the ‘blackbox’ (Harley, 1989), the underlying decisions, defi‐
Midlands, and the increasing importance of the ports on nitions, and sources, we hope to contribute to a better
the west coast, eventually followed again by decline. understanding of long‐term urbanization patterns in the
Contrary to what is often assumed, the current urban‐ North Sea region.
ization pattern around the North Sea can best be under‐
stood by looking at the long‐term development, by exam‐ Acknowledgments
ining how this pattern arose and developed over the
centuries. Looking no further back than the Industrial We are grateful for the excellent feedback provided by
Revolution creates a distorted picture. After all, the the anonymous reviewers.
distribution pattern of cities was largely determined
before that time. The basis for today’s important port Conflict of Interests
cities, including Hamburg, Amsterdam, Rotterdam, and
Antwerp, was laid during the late Middle Ages. Figure 1 The authors declare no conflict of interests.
shows that many other cities that matter today also go
back to that time. Only for two groups of cities was References
the Industrial Revolution decisive: those in the Midlands
and in the Ruhrgebiet, not port cities. To understand Ayers, B. (2016). The German Ocean: Medieval Europe
the urbanization pattern and the position, function, and around the North Sea. Equinox Publishing.
meaning of today’s important ports and cities around the Bairoch, P., Batou, J., & Chevre, P. (1988). The population
North Sea, the developments and shifts through time are of European cities from 800 to 1850: Data bank and
also crucial. These can be broadly characterized as follows. short summary of results. Droz.
The foundations for the urbanization pattern around the Blass, T. (2016). The naked shore: Of the North Sea.
North Sea were laid before 1500. The center of economic Bloomsbury Publishing.
gravity, with the most important port cities, can be found Blockmans, W. (2010). Metropolen aan de Noordzee:
in a fragmented area, where powerful citizens ensured De geschiedenis van Nederland 1100–1560
an intensive exchange of goods beyond the borders; the [Metropolises on the North Sea: The history of
ports thus served as porous transit centers. Subsequently, the Netherlands 1100–1560]. Bert Bakker.
the center of economic gravity shifts from the Southern Blond, S. J. L. (2013). The Trudaine atlas: Government
Netherlands to the Northern Netherlands. The Southern road mapping in eighteenth‐century France. Imago
Netherlands lost their fragmented freedom and the free Mundi, 65(1), 64–79.
Dutch Republic port cities flourished as transit centers. Boone, M. (2013). Medieval Europe. In P. Clark (Ed.),
During the 18th century, there were major changes: the The Oxford handbook of cities in world history (pp.
center of gravity shifted to the other side of the North Sea, 221–239). Oxford University Press.
to England, and the character of the economy changed Brand, N. (2011). Waterways and town’s interests:
dramatically with the Industrial Revolution. The main port The influence of infrastructure on the urban pat‐
cities were then part of a kingdom, which became the tern in Holland (1200–1560). OverHolland, 7(10/11),
British Empire. From the moment industrialization began 127–147.
in northern France, Belgium, and the Ruhrgebiet at the Chandler, T. (1987). Four thousand years of urban
beginning of the 19th century, the North Sea region growth: A historical census. St. David’s University
has been characterized by different economic centers of Press.
gravity, which have persisted despite profound economic Couling, N., & Hein, C. (2020). The North Sea: New per‐
changes in the 20th century. Thus, consolidation of the spectives on the sea‐land continuum. In N. Couling
urbanization pattern occurs, to all appearances, due to & C. Hein (Eds), The urbanisation of the sea: From
the intensive involvement of national governments in the concepts and analysis to design (pp. 6–15). Nai010
development of the cities. Publishers.
Urban Planning, 2021, Volume 6, Issue 3, Pages 10–26 24De Pater, B. (2009). West‐Europa: Hoofdlijnen van large, open demographic data sets using familiar geo‐ geografie en ruimtelijke planning [Western Europe: graphical features. Journal of Maps, 12(4), 676–683. Outlines of geography and spatial planning]. Van Pinol, J. P. (Ed.). (2003). Histoire de l’Europe urbaine [His‐ Gorcum. tory of the urbanization of Europe]. Edition du Seuil. De Vries, J. (1984). European urbanization, 1500–1800. Pye, M. (2014). The edge of the world: How the North Sea Methuen & Co. made us who we are. Penguin Books. Desa, U. N. (2014). World urbanization prospects, the Reba, M., Reitsma, F., & Seto, K. C. (2016). Spatializing 2014 revision. United Nations. 6,000 years of global urbanization from 3700 BC to Edwards, P. (2003). Infrastructure and modernity: Force, AD 2000. Scientific Data, 3(1), 1–16. time, and spatial organization in the history of Renes, H. (2016). Gebruik van kaarten voor historische sociotechnical systems. In T. J. Misa, P. Brey, & onderzoek [Use of maps for historical research]. In A. Feenberg (Eds.), Modernity and technology (pp. M. Hameleers, M. Carnier, P. Alkhoven, & R. Kruk 185–225). MIT Press. (Eds.), Cartografie Visie op de kaart [Cartography Euratlas. (n.d.). Homepage. https://www.euratlas.net vision on the map] (Vol. 15, pp. 153–176). Stichting Eurogeographics. (2017). EuroGlobalMap: Version 10.0 Archiefpublicaties. [Data set]. https://eurogeographics.org/maps‐for‐ Ross, C., & Clark, J. (2008). London: The illustrated history. europe/open‐data Allen Lane. Harley, J. B. (1989). Deconstructing the map. Cartograph‐ Rutte, R., & Abrahamse, J. E. (2016). Atlas of the Dutch ica: The International Journal for Geographic Infor‐ urban landscape: A millennium of spatial develop‐ mation and Geovisualization, 26(2), 1–20. ment. THOTH. Hein, C., & van Mil, Y. (2019). Towards a comparative spa‐ Rutte, R., & Vannieuwenhuyze, B. (2018). Stedenatlas tial analysis for port city regions based on historical Jacob van Deventer [Town Atlas of maps made by geo‐spatial mapping. PORTUSplus, 8(Special Issue). Jacob van Deventer]. THOTH. Hohenberg, P. M., & Lees, L. H. (1995). The making of Schipper, F. (2008). Driving Europe: Building Europe on urban Europe: 1000–1994. Harvard University Press. roads in the twentieth century. Eindhoven Technis‐ Horsten, F. H. (2005). Doorgaande wegen in Nederland, che Universiteit. 16e tot 19e eeuw [Main roads in the Netherlands, Segal, Z. (2020). Flow mapping through the times: The 16th to 19th century]. Aksant. transition from Harness to Nazi propaganda. In Jenks, G. F. (1967). The data model concept in statistical Z. Segal & B. Vannieuwenhuyze (Eds.), Motion in mapping. International Yearbook of Cartography, 7, maps, maps in motion: Mapping stories and mov‐ 186–190. ing through time (pp. 81–103). Amsterdam Univer‐ Kosian, M. C., van Lanen, R. J., & Weerts, H. J. T. sity Press. (2016). Nederland in 1575 [The Netherlands in 1575] Terlouw, K. (1996). A general perspective on the regional [Data set]. Nationaal Georegister. http://nationaal development of Europe from 1300 to 1850. Journal georegister.nl/geonetwork/srv/dut/catalog.search#/ of Historical Geography, 22(2), 129–146. metadata/bda25f76‐49ce‐4f11‐9fc3‐99b00900a86a Terlouw, K. (2009). Transnational regional develop‐ ?tab=general ment in the Netherlands and Northwest Germany, Kotzeva, M. (2019). Eurostat regional yearbook. Euro‐ 1500–2000. Journal of Historical Geography, 35(1), pean Commission. 26–43. Lawton, R., & Lee, W. R. (2002). Population and society van Mil, Y., & Rutte, R. (2020a). Ranking cities around the in Western European port cities, C.1650–1939. Liver‐ North Sea: Demography, infrastructure and soil [Data pool University Press. set]. DANS. https://doi.org/10.17026/dans‐zzg‐9vkq Lees, A., & Lees, L. H. (2013). Europe: 1800–2000. In P. van Mil, Y., & Rutte, R. (2020b). Ranking cities around the Clark (Ed.), The Oxford handbook of cities in world his‐ North Sea [Data set]. 4TU. https://doi.org/10.4121/ tory (pp. 464–482). Oxford University Press. uuid:975097be‐f863‐484a‐9807‐20ec70166305 Lesger, C. (1993). Intraregional trade and the port sys‐ Verhulst, A. (Ed.). (1996). Anfänge des Städtewesens an tem in Holland, 1400‐1700. In K. Davids & L. Noorde‐ Schelde, Maas und Rhein bis zum Jahre 1000 [The graaf (Eds.), The Dutch economy in the Golden Age: genesis of towns on the rivers Scheldt, Meuse and Nine studies (pp. 185‐217). Nederlands Economisch‐ Rhine up to the year 1000]. Böhlau. Historisch Archief. Verhulst, A. (1999). The rise of cities in North‐West Modelski, G. (2003). World cities: –3000 to 2000. FAROS. Europe. Cambridge University Press. O’Brien, O., & Cheshire, J. (2016). Interactive mapping for Urban Planning, 2021, Volume 6, Issue 3, Pages 10–26 25
About the Authors

                     Yvonne van Mil is Researcher in Spatial History and Cartographer, affiliated with Delft University of
                     Technology. Her research topics includes urban and spatial planning in the 19th and 20th century,
                     focusing specifically on regional history and geo‐spatial mapping. She was co‐author of several books
                     including Driven by Steel: From Hoogovens to Tata Steel 1918–2018 (2018) and contributed chapters
                     to the Atlas of the Dutch Urban Landscape (2016).

                     Reinout Rutte is an Urban and Architectural Historian. Since 2004, he has been an Assistant
                     Professor in the Chair History of Architecture and Urban Planning in Delft University of Technology’s
                     Faculty of Architecture. Together with Jaap Evert Abrahamse, he published the Atlas of the Dutch
                     Urban Landscape (2016), and together with Bram Vannieuwenhuyze the Stedenatlas Jacob van
                     Deventer (2018).

Urban Planning, 2021, Volume 6, Issue 3, Pages 10–26                                                                   26
You can also read