Quantifying Ship Strike Risk to Breeding Whales in a Multiple-Use Marine Park: The Great Barrier Reef
←
→
Page content transcription
If your browser does not render page correctly, please read the page content below
ORIGINAL RESEARCH
                                                                                                                                        published: 14 February 2020
                                                                                                                                     doi: 10.3389/fmars.2020.00067

                                            Quantifying Ship Strike Risk to
                                            Breeding Whales in a Multiple-Use
                                            Marine Park: The Great Barrier Reef
                                            Joshua N. Smith 1* , Natalie Kelly 2† , Simon Childerhouse 3 , Jessica V. Redfern 4 ,
                                            Thomas J. Moore 5† and David Peel 2
                                            1
                                             College of Science, Health, Engineering and Education, Murdoch University, Perth, WA, Australia, 2 Data 61, CSIRO,
                          Edited by:        Hobart, TAS, Australia, 3 Cawthron Institute, Nelson, New Zealand, 4 Anderson Cabot Center for Ocean Life, New England
                         Ellen Hines,       Aquarium, Boston, MA, United States, 5 Southwest Fisheries Science Center, National Marine Fisheries Service, NOAA, La
       San Francisco State University,      Jolla, CA, United States
                       United States
                       Reviewed by:
                        Danielle Kreb,
                                            Spatial risk assessments are an effective management tool used in multiple-use marine
    Conservation Foundation for Rare        parks to balance the needs for conservation of natural properties and to provide for
       Aquatic Species of Indonesia,
                                            varying socio-economic demands for development. The multiple-use Great Barrier Reef
                             Indonesia
                       Kylie L. Scales,     Marine Park (GBRMP) has recently experienced substantial increases in current and
    University of the Sunshine Coast,       proposed port expansions and subsequent shipping. Globally, large whale populations
                              Australia
                                            are recovering from commercial whaling and ship strike is a significant threat to some
                 *Correspondence:
                    Joshua N. Smith
                                            populations and a potential welfare issue for others. Within the GBRMP, there is
    joshua.smith@uqconnect.edu.au;          spatial conflict between the main breeding ground of the east Australian humpback
       joshua.smith@murdoch.edu.au
                                            whale population and the main inner shipping route that services several large natural
                   † Present  address:
                                            resource export ports. The east coast humpback whale population is one of the largest
                          Natalie Kelly,
 Australian Antarctic Division, Hobart,     humpback whale populations globally, exponentially increasing (11% per annum) close
                         TAS, Australia     to the maximum potential rate and estimated to reach pre-exploitation population
                    Thomas J. Moore,
          CSS, Inc., Office for Coastal
                                            numbers in the next 4–5 years. We quantify the relative risk of ship strike to calving
       Management, National Ocean           and mating humpback whales, with areas of highest relative risk coinciding with areas
         Service, NOAA, Seattle, WA,
                                            offshore of two major natural resource export ports. We found females with a dependent
                         United States
                                            calf had a higher risk of ship strike compared to groups without a calf when standardized
                   Specialty section:       for group size and their inshore movement and coastal dependence later in the breeding
         This article was submitted to
                                            season increases their overlap with shipping, although their lower relative abundance
                  Marine Conservation
                     and Sustainability,    decreases risk. The formalization of a two-way shipping route has provided little change
               a section of the journal     to risk and projected risk estimates indicate a three- to five-fold increase in risk
          Frontiers in Marine Science
                                            to humpback whales from ship strike over the next 10 years. Currently, the whale
            Received: 15 June 2019
         Accepted: 29 January 2020
                                            Protection Area in the GBRMP does not cover the main mating and calving areas,
        Published: 14 February 2020         whereas provisions within the legislation for establishment of a Special Management
                              Citation:     Area during the peak breeding season in high-risk areas could occur. A common
                     Smith JN, Kelly N,
                                            mitigation strategy of re-routing shipping lanes to reduce risk is not a viable option for
Childerhouse S, Redfern JV, Moore TJ
  and Peel D (2020) Quantifying Ship        the GBRMP due to physical spatial limitations imposed by the reef, whereas speed
   Strike Risk to Breeding Whales in a      restrictions could be the most feasible based on current ship speeds.
 Multiple-Use Marine Park: The Great
    Barrier Reef. Front. Mar. Sci. 7:67.    Keywords: spatial risk assessment, ship strike, great barrier reef, humpback whale, shipping, AIS, breeding
      doi: 10.3389/fmars.2020.00067         ground

Frontiers in Marine Science | www.frontiersin.org                                 1                                             February 2020 | Volume 7 | Article 67
Smith et al.                                                                                                         Whale Ship Strike Risk in GBR

INTRODUCTION                                                               potential welfare issue at the individual-level as a result of non-
                                                                           fatal injuries (Bejder et al., 2016). Analysis of records worldwide
Shipping is one of the world’s largest industries and extremely            (Vanderlaan and Taggart, 2006) and within Australia (Peel et al.,
important to world economic trade, accounting for 80% of global            2018), demonstrate that humpback and right whales are the most
trade by volume and more than 70% of its value (UNCTAD,                    frequently reported species involved in ship strikes. In Australia,
2019). The world shipping fleet has been continuously growing              despite the lack of reported incidents involving large ships (one
since the 1990s and has doubled in number over the last                    reported case), there are indications that collisions between large
12 years, with ships increasing in both size and designed                  ships and humpback whales occur and that the number of reports
speed capacity to accommodate this trade growth (UNCTAD,                   do not reflect the number of incidents. This is demonstrated
2018). Globally, seaports and other restricted waterways (like             by photographs of live humpback whales showing significant
canals) are expanding and adapting to meet changes in the                  wounds consistent with propeller cuts from large ships and
industry, resulting in infrastructure expansion projects tied to           stranding events resulting in mortality of humpback whales with
evolving development plans to take advantage of regional and               wounds suggestive of large ships given the nature and severity of
global opportunities. Shipping is one of the most extensive and            the wound (Peel et al., 2018).
pervasive uses of the marine environment, which is exacerbated                 In Australia, the Great Barrier Reef (GBR) is a UNESCO
in coastal areas due to increased interaction with other human             World Heritage Area (GBRWHA) covering approximately
uses (i.e., fishing) and protected marine species (Tournadre,              348,000 km2 , within which the Great Barrier Reef Marine Park
2014). Marine protected areas (MPA’s) are recognized as one of             (GBRMP) comprises 99% of this area. The Marine Park is
the best ways to conserve and protect marine habitats and species          managed by the Great Barrier Reef Marine Park Authority
in our oceans (Kelleher, 1999). The management of multiple-                (GBRMPA) as a multiple-use marine park, which supports a
use marine parks though, particularly in World Heritage Areas,             wide range of activities such as tourism, defense, fishing, boating
requires a balance between conserving the natural properties of            and shipping. The GBRMP is recognized as one of the world’s
the area and providing for increasing or shifting socio-economic           best managed marine protected areas (UNESCO, 2012), although
demands for development. Marine spatial planning and spatially             management of it is complex due to overlapping State and Federal
explicit risk assessments are important management tools to                jurisdictions and that sometimes the two levels of government
balance these interests and manage multiple users.                         are politically ideologically opposed. The GBR is designated
    While there are a range of potential impacts associated with           a Particularly Sensitive Sea Area (PSSA) by the International
shipping activity (e.g., groundings, collisions, oil and chemical          Maritime Organization (IMO) because of its potential risk of
spills and introduction of invasive species), ship strike and noise        damage from international shipping activities. Consequently,
pollution have the greatest impact on marine mammals. Ship                 shipping is well regulated through an established Vessel Traffic
strike and ship noise are the main, current anthropogenic threats          Service (REEFVTS) monitoring system and mandatory vessel
to whales worldwide (Cates et al., 2017; Erbe et al., 2019) due            reporting for vessels >50 m in length. In 2014, a two-way
largely to the global increase in shipping. While increases in             shipping route through the GBR was formalized by the IMO,
shipping traffic have resulted in the rise in ambient noise at             which predominantly follows previous ship traffic patterns and
low frequencies (10–100 Hz) in many ocean regions, ships also              now provides well-defined lanes to enhance the safety and
emit significant energy at higher frequencies (10 of kHz) and              efficiency of shipping (Figure 1). However, there are current
can therefore have potential impacts on low frequency specialist           and projected increases in shipping throughout the GBRWHA,
(e.g., baleen whales) as well as higher frequency specialists (e.g.,       predominantly due to the export of natural resources. Australia
odontocetes) (Erbe et al., 2019). However, the impacts from                is one of the world’s largest exporters of natural resources,
ship noise are less tangible than that of ship strike. Ship strikes        with approximately 87% of Australia’s total cargo in 2014–15
represent a conservation concern for some whale species in                 attributed to international exports predominantly of coal and
their recovery from 20th century commercial whaling, and a                 liquefied natural gas (LNG) (Bureau of Infrastructure, Transport
welfare issue for other species exhibiting significant population          and Regional Economics [BITRE], 2017). Due to substantial
recovery and increasing interactions with vessels. Quantifying             coastal development and port expansions related to the mining
the population-level extent of ship strike mortality on whales,            industry, UNESCO is closely monitoring Australia’s commitment
however, is notoriously difficult due to inherent reporting biases         to the sustainability of the GBR as a World Heritage Area.
and because collisions with large vessels are frequently unnoticed             Concurrent to Australia’s growth in shipping, the eastern
and consequently go unreported (Laist et al., 2001; Panigada et al.,       Australian population of humpback whales is one of the world’s
2006; Vanderlaan and Taggart, 2006; Peel et al., 2018). The most           fastest growing population of humpback whales. The population
well-documented example of ship strike having a detrimental                has been undergoing an exponential rate of recovery (approx.
population-level effect on whale recovery is that of the North             11% increase per annum) over the last couple of decades after
Atlantic right whale (Eubalena glacialis), with the major cause            facing near extinction from commercial whaling (Noad et al.,
of population decline directly linked to ship strike (Laist et al.,        2016) and their breeding ground also occurs in the GBRMP
2001; Laist et al., 2014). In contrast, for other whale species            (Smith et al., 2012). In 2015, the estimated population size was
(e.g., humpback whale, Megaptera novaeangliae) that show strong            25,000 whales and projected to be ∼41,000 whales in 2020. There
recovery toward pre-exploitation population levels, ship strike            is little evidence of slowing, with estimates of recovery ranging
is less of an impact at the population-level and more of a                 between 58–98% due to uncertainty of the historical abundance

Frontiers in Marine Science | www.frontiersin.org                      2                                       February 2020 | Volume 7 | Article 67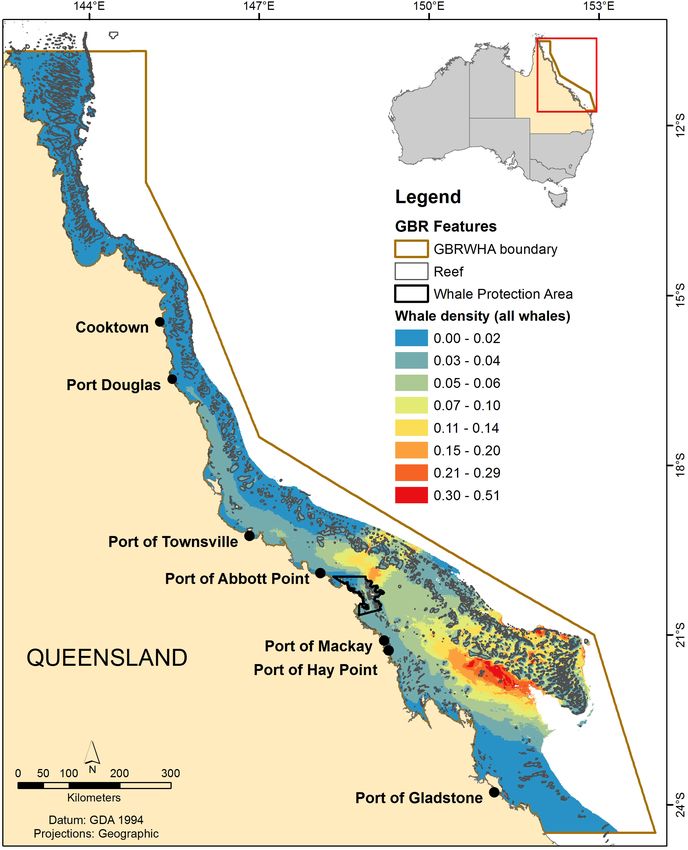
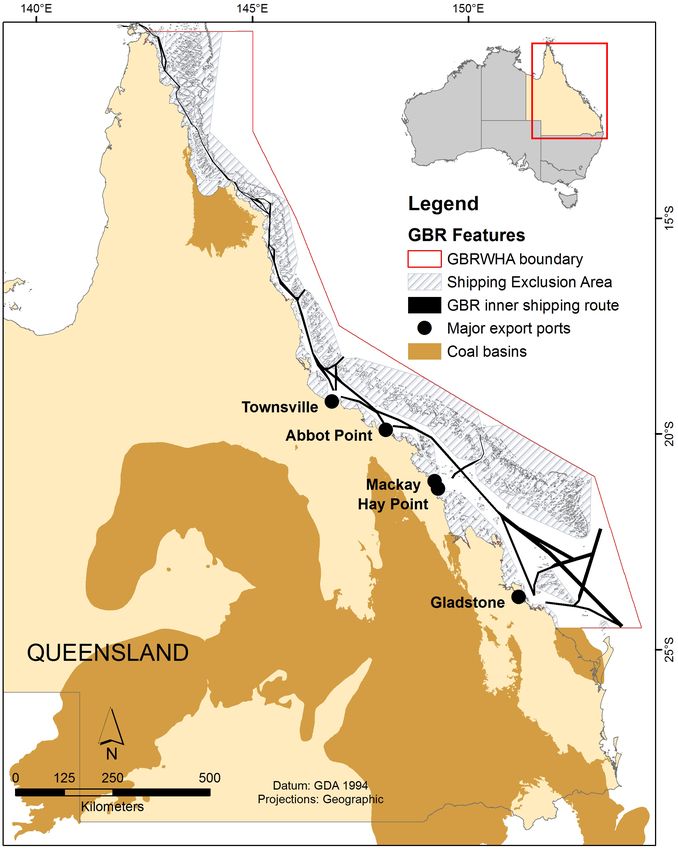
Smith et al.                                                                                                                              Whale Ship Strike Risk in GBR

  FIGURE 1 | Spatial extents of coal basins, locations of major coal export ports in the State of Queensland, and two-way inner shipping route within the Great Barrier
  Reef World Heritage Area.

(Noad et al., 2008; Bejder et al., 2016; Noad et al., 2016). Their                     vessel speed (Cates et al., 2017). With increased shipping activity
core breeding aggregation overlaps with the inner shipping route                       and whale population size, there is concern for an increased risk
that services all ports on the Queensland coast (Smith et al., 2012).                  in whale fatalities from vessel strikes and increases in non-fatal
Ship strikes involving large vessels and whales can result in death                    injuries. While ship strike is unlikely to have a population-level
or serious injury to individuals with the level of risk depending                      effect on humpback whales in the GBR given the increasing
on whale density, behavior, the time of year, vessel density and                       population size, their increased interaction with ships on their

Frontiers in Marine Science | www.frontiersin.org                                  3                                               February 2020 | Volume 7 | Article 67
Smith et al.                                                                                                         Whale Ship Strike Risk in GBR

breeding ground is likely to be an emerging management issue               clinometer) and horizontal (protractor) angles to the group, total
that could result in welfare issues to the whales from non-fatal           number of animals’ visible, number of calves and sighting cue.
injuries (Peel et al., 2018).
   To understand the risk of ship strike to whales, it is                  Species Distribution Model
necessary to understand both distribution and densities of whales          The distribution and densities of humpback whales in the
and shipping. We provide a spatially explicit ship strike risk             GBR from the 2012 and 2014 aerial surveys were modeled
framework using humpback whales on their breeding grounds in               using the method described in Hedley and Buckland (2004).
the multiple-use GBRMP. We modeled relative ship strike risk               This requires a detection function fitted to the sighting data
for whales involved in two different reproductive behaviors of             to estimate the “effective strip width,” to create a detection-
calving (groups containing the presence of a calf) and mating              adjusted density surface model using generalized additive models
(groups without a calf present), to determine whether there were           (GAM’s). Detection probabilities, and corrections for perception
spatial differences in risk related to reproductive behavior. We           bias, were estimated using Mark-Recapture Distance Sampling
compare ship strike risk before and after the formalization of             models as described in Laake and Borchers (2004) and Burt
the two-way inner shipping route, to evaluate the effect that              et al. (2014) using the MRDS package (Laake et al., 2015) in
defined lanes of ship traffic has on risk to the whales. Finally, we       R (R Development Core Team, 2015). To improve detection
modeled future projected risk of ship strike to humpback whales            function fit, perpendicular sighting distances were left truncated
based on an annual rate of whale population increase for several           at 0.2 km and right truncated at 4 km, and sightings of
growth rates in ship traffic. The quantitative risk assessment of          uncertain species identification were excluded from the analyses.
ship strike to whales allowed an evaluation of current measures            A final detection function was selected using Akaike Information
of protection for humpback whales in the multiple-use marine               Criterion (AIC) and examining model diagnostics. A density
park and potential mitigation measures available to reduce risk.           surface model was then developed using a GAM model by
                                                                           segmenting track lines into pre-defined lengths of approximately
                                                                           10 km to capture adequate environmental variability using
METHODOLOGY                                                                functions for spherical geometry from the R “geosphere” library
                                                                           (Hijmans, 2016). Values of each environmental covariate were
Aerial Surveys                                                             converted into rasters in ArcMap 10.1 (ESRI) and matched to the
The GBRWHA is a large area (348,000 km2 ), which makes                     midpoints of each along-track segment. The numbers of whale
systematic surveys of the entire area prohibitively costly. Based          groups and total animals (including the presence and number
on a predictive spatial habitat model that was developed using             of calves) were then summed and a total effective strip area
opportunistic presence-only whale sighting data (Smith et al.,             estimated for each segment. These models use a smooth over
2012), line transect aerial surveys were undertaken in 2012                geographical space, informative environmental covariates and an
and 2014. The aerial surveys sub-sampled specific regions of               offset term provided by the effective strip area of each segment.
the GBRWHA according to their own specific objectives. The                 A Tweedie distribution was used to account for over-dispersion
2012 aerial survey was designed to validate the predictive                 in the counts of groups per segment. Collinearity in the various
spatial habitat model by surveying three main areas predicted              spatial/environmental covariates were assessed using multi-panel
to have low, medium and high habitat suitability, at a time                scatterplots and Pearson correlation coefficients. All sightings
representing peak whale abundance during the breeding season.              that were included in the distance analyses were used to fit the
The aerial survey was undertaken over 8 days (3rd to 10th                  spatial models. Uncertainty in the estimation of the detection
August) with a total areal coverage of 63,723 km2 ; Mackay                 function was incorporated into the variance of the spatial model
(34,626 km2 ), Townsville (17,126 km2 ) and Port Douglas                   using a method described in Williams et al. (2011) and Miller
(11,971 km2 ). On-effort flight time was 15.75 h, of which                 et al. (2013). This procedure involves fitting the density surface
97.1% of time conditions were in Beaufort sea-state ≤3. The                model with an additional random effect term that characterizes
objective of the 2014 aerial survey was to determine the coastal           the uncertainty in the estimation of the detection function, via
distribution of humpback whales around major coastal/port                  the derivatives of the probability of detection with respect to
areas within a region in the GBRWHA of high whale density                  their parameters.
later in the breeding season, past peak whale abundance when                  Physiographic variables of water depth, seabed slope, and
there are more females with newborn calves. The survey was                 (geodesic) distances to the nearest coastline and reef features
undertaken offshore of Gladstone and Mackay over 11 days                   were estimated for the midpoints of each along-track segment.
(26th August – 5th September), with a total areal coverage of              Monthly mean values of dynamic remotely sensed environmental
72,752 km2 . On-effort flight time was 18.3 h, of which 98.8%              predictor variables were interpolated to the midpoint of each
of time was undertaken in Beaufort sea-state ≤3. The aerial                along-track segment. Daily sea surface temperature (Integrated
surveys were undertaken using a Partenavia Observer P-68B 6-               Marine Observing System [IMOS], 2015a; in ◦ C, gridded at
seater, twin engine, high-wing aircraft and a double platform              0.02◦ ), sea surface height anomaly (IMOS, 2015b; in meters,
observer configuration. Rear observers were acoustically and               gridded at 0.58◦ >0.51◦ ), and sea surface chlorophyll a (IMOS,
visually (using curtains) isolated from the front observers to             2015c; mg m-3, gridded at 0.01◦ ) values for the GBR region were
allow perception bias to be calculated. Whale sightings included           averaged at each grid point for the month of August in 2012 and
species identification, declination (using a Suunto PM-5/360PC             August and September in 2014. Predictions of whale densities

Frontiers in Marine Science | www.frontiersin.org                      4                                       February 2020 | Volume 7 | Article 67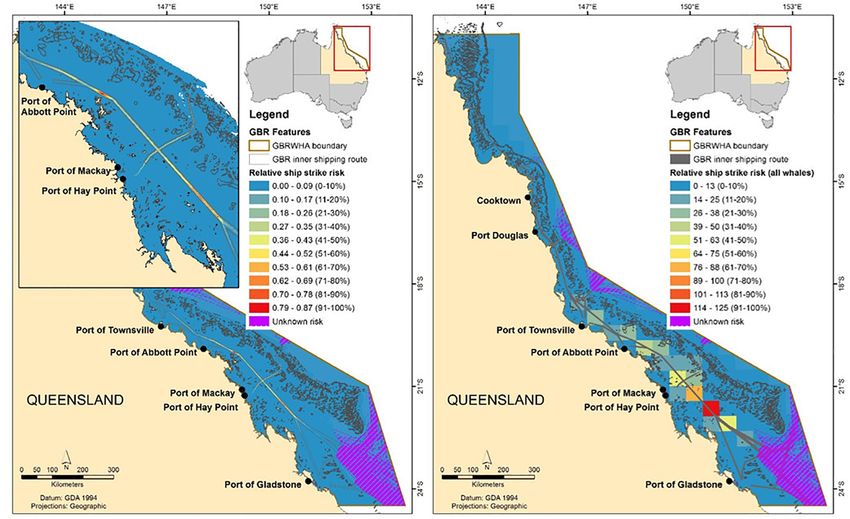
Smith et al.                                                                                                           Whale Ship Strike Risk in GBR

across the GBR were undertaken at a 1 × 1 km grid cell resolution           Risk Modeling Framework
to produce density models for three different whale groups: (1)             To quantify relative risk of ship strike we calculated the Relative
all whales, (2) groups that contained a calf (hereafter, calf groups)       Expected Fatality (REF) of a whale from the risk of a ship strike.
and (3) groups in which a calf was not present (hereafter, non-             This incorporates a measure of co-occurrence of a whale and ship
calf groups). Sightings and modeled distributions of calf groups            in a given grid cell (Redfern et al., 2013), and uses vessel beam
are used as a proxy to identify likely calving areas and non-calf           as an exposure factor and the equation from Conn and Silber
groups to identify potential mating areas. A 1 × 1 km grid cell size        (2013) to estimate the probability of a lethal whale strike given
was chosen to provide enough spatial resolution to distinguish              vessel speed. This approximates the risk of a fatal ship strike
a specific shipping lane and to avoid the issue of vessels and              more accurately than co-occurrence alone, because the severity
animals not in close proximity being classed as co-occurring and            of a ship strike is related to the speed of a vessel. A whale risk
contributing to risk within the spatial risk assessment.                    index was calculated by multiplying the ship and whale density
                                                                            with the mean vessel beam and the probability of a lethal whale
Shipping Data                                                               strike given the mean vessel speed for each grid cell for each
All large vessels transiting through the GBRWHA are monitored               of the years 2013 to 2016. We summarized the risk for each
with AIS by the REEFVTS and ships are only permitted to                     year and three whale group categories (all whale groups, calf and
transit through Designated Shipping Areas. In December 2014,                non-calf groups). The cumulative total, mean, minimum, and
the IMO formalized a two-way shipping route in the GBR that                 maximum risk observed were calculated and the estimates were
extends from the Torres Strait in the north and terminates at               then standardized to account for differences in the number of
the southern boundary of the GBRMP (Figure 1). The two-                     vessels between years by dividing the risk estimates by the total
way shipping route follows pre-existing traffic patterns through            km’s traveled by all vessels in the GBR. Relative risk was also
the GBR and now encourages shipping to follow well-defined                  summarized at a decreased resolution of 50 × 50 km grid cells to
northbound and southbound lanes, although it is not mandatory               identify risk patterns at the broader regional scale. To investigate
to travel within these lanes.                                               whether there was a change in the risk of ship strike to humpback
    AIS data were obtained from AMSA in the form of their craft             whales due to the IMO formalization of the inner GBR two-way
tracking system (CTS) product, which provides processed ship                shipping route, relative risk was compared before (2013/2014 ship
locational data sampled to a 5 min frequency. AIS data were                 data) and after (2015/2016 ship data) the formalization.
analyzed for each year between 2013 and 2016, which covered the
time period when systematic aerial surveys for humpback whales              Projected Future Risk of Ship Strike
were undertaken and the formalization of the two-way shipping               Predicting future relative risk based on projected growth rates
route. Shipping data were restricted to Class “A” cargo, tanker and         can be difficult because it is uncertain how increases in shipping
passenger vessels ≥80 m in length for 3 months of the humpback              and whale population size will change temporally or spatially. To
whale breeding season (July, August, and September). Only                   predict future relative risk we assumed that there are no changes
vessels ≥80 m were included for the following reasons: vessels of           to the spatial distribution of ships or whales, which is likely to
this size and larger predominantly inflict fatal or severe injuries         be more uncertain for whales due to an increasing population
(Laist et al., 2001), larger vessels traverse predictable routes, AIS       size (e.g., through range expansion) than for shipping that follow
data provides relatively accurate ship positional data and previous         formalized shipping lanes. We calculated future risk for each
risk assessments of ship strike to whales (e.g., Redfern et al.,            grid cell by multiplying an annual proportional increase of whale
2013) have focused on larger vessel size classes. The AIS data              abundance (11%) and five ship traffic growth rates around a
did not have navigational status of the vessel available, which             3.5% expected mean growth rate, from 1.5 to 5.5%. The expected
can be used to filter out vessels not underway (e.g., anchored).            growth rate of the whale population can be considered robust
Consequently, we applied a filter of >0.4 knots to the data to              due to surveys since the 1990s producing consistent estimates of
remove stationary/anchored vessels that will have limited risk              approximately 11% per year (Noad et al., 2016). The Australian
for ship strike.                                                            Bureau of Resources and Energy Economics (BREE) predicted
    To use the AIS data in the risk assessment framework, we                the average annual growth in coal ship traffic between 2011
created trackline data from the point data representing 5-min               and 2025 in the GBR, according to a range of likely scenarios;
AIS positions of each individual vessel based on a unique ship-             optimistic was 6.31, 5.12% was moderate, 3.71% low and 3.06%
related identifier, the Maritime Mobile Service Identity (MMSI).            the most conservative case (Braemar Seascope, 2013).
This converts the data in each cell from time to distance data.
Trackline data were created by joining contiguous unique point
positions of ship locations less than 60 min apart, with the                RESULTS
exception of positions separated in time between 30 and 60 min
with a change in ship’s course over ground greater than 5                   Humpback Whale Distribution Model
degrees (due to uncertainty of the ship’s path of travel). Positions        There were a total of 637 sightings of humpback whale
greater than 60 min apart were excluded. The 1 × 1 km whale                 groups from the combined aerial surveys, 365 group sightings
density grid over the entire GBRWHA region was used to                      (589 individuals) in 2012 and 272 (461 individuals) in 2014
summarize the distance traveled by ships within each grid cell              (Figure 2). The breakdown of calf groups between years and
from the trackline data.                                                    mean whale encounter rates are in Table 1. There was a lower

Frontiers in Marine Science | www.frontiersin.org                       5                                        February 2020 | Volume 7 | Article 67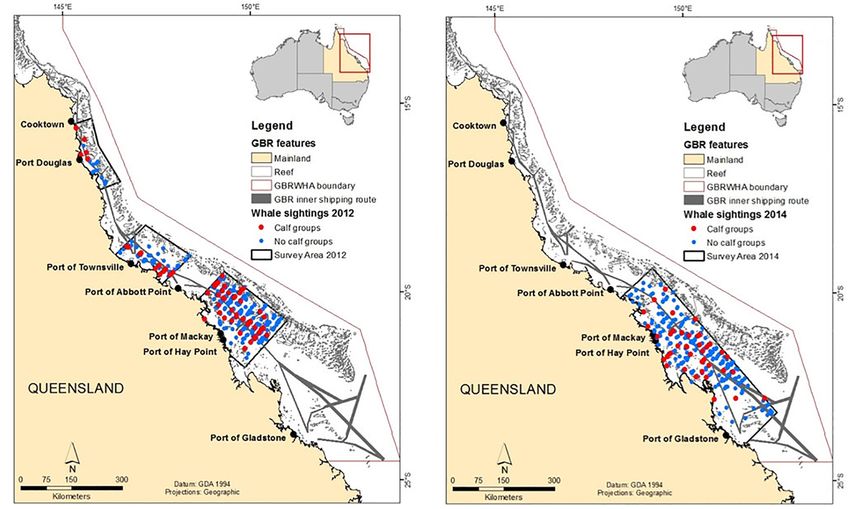
Smith et al.                                                                                                                           Whale Ship Strike Risk in GBR

  FIGURE 2 | Distribution of humpback whale sightings of calf and non-calf groups during the (A) 2012 and (B) 2014 aerial surveys.

relative abundance of whales in 2014 compared to 2012 due to                          there does not appear to be any distinct separation of calving
undertaking the aerial survey later in the breeding season, past                      versus mating areas. The highest number of whale sightings
the expected peak of whale abundance. The detection function                          was in the southern GBR region, although the northern GBR
was fit using sighting data pooled across both survey years and                       region offshore of Cairns had a proportionally higher calf-to-
a total 561 sightings remained after truncation of the data were                      adult ratio (1:4) compared to the southern GBR offshore of
used for density surface modeling.                                                    Mackay (1:7.9) (Figure 2). In 2014, there was a significant change
   The prediction from the best density surface model of                              in the distribution of calf groups closer to the coast compared to
humpback whale density for each of the three reproductive                             non-calf groups (Figures 2, 3). If we compare the distribution of
categories are in Supplementary Figure S2. Due to only a small                        calf groups in 2012 to those in 2014 (Figures 3B,D) and assume
amount of survey effort in bathymetric values of 90 m and                             little inter-annual variation in whale distribution, the predicted
deeper (only 122 km of a total of 6650 km across both survey                          distribution suggests that groups with a calf move closer to the
years), no density predictions were made for waters deeper than                       coast later in the breeding season.
90 m. The most significant parameters in describing humpback
whale distribution and density were depth and SST. The models                         Shipping Data
predicted higher densities of humpbacks in shallow water (e.g.,                       There was a slight increase in the number of ships per year
20–60 m deep) and within a sea surface temperature range                              between 2013 (N = 1466) to 2016 (N = 1687) and no detectable
between 21 and 23◦ C.                                                                 within year variation, such that the 3 months within the year
   The predicted distribution of whale densities for all whale                        were comparable. The majority of class A vessels (≥80 m in
groups combined in the GBR followed a similar pattern for both                        length) used in the analysis over the four years were cargo
2012 and 2014 (Supplementary Figure S1). Two main areas of                            vessels (87%), followed by Tankers (12%) and a small number
higher whale density during peak whale abundance are located                          of passenger vessels (1%). There was a consistent pattern in
approximately 120 km to the north and southeast of Mackay                             the length of the vessels across all years that ranged from 80
(Figure 3). The modeled distribution of calving areas (sightings                      (the minimum cut-off) to 300 m, with a higher frequency of
of groups with a calf present) in 2012, and to a lesser extent in                     vessel length closer to larger sized ships (mean = 205 m and
2014, occurred throughout the length of the GBR whereas mating                        median = 222 m). There was also a consistent pattern in vessel
areas (groups without a calf) were predominantly restricted to                        beam with a mean and median of 32 m (range = 10–50 m).
the southern GBR (Figure 3). However, given calf groups were                          The average vessel speed was 12.6 knots (median = 12.4 knots,
sighted among non-calf groups in inshore and offshore waters,                         max = 25 knots) with 85% of vessel transits faster than 10 knots

Frontiers in Marine Science | www.frontiersin.org                                 6                                              February 2020 | Volume 7 | Article 67
Smith et al.                                                                                                                         Whale Ship Strike Risk in GBR

TABLE 1 | The number of sightings, relative abundance and mean encounter rates for groups of all whales and groups containing a calf during the 2012 and 2014
aerial surveys.

                                                                  2012                                                               2014

                                               All whales                      Calf groups                        All whales                        Calf groups

Total number of sightings                           365                             100                              272                                 59
Total number of individuals                         589                             121                              461                                218
Relative abundance                                  7487                            2440                             3627                               648
Mean encounter rate (SE)                     0.143 (SE 0.003)               0.033 (SE 0.0009)                  0.122 (SE 0.004)                  0.016 (SE 0.0007)

and 11% faster than 15 knots (74% >10 knots ≤15 knots).                             GBR lagoon, offshore of the Port of Hay Point and Mackay
Vessel speeds greater than 15 knots occurred in specific areas of                   (Figures 5A,B). However, as the breeding season progresses
the GBRMP, specifically the Whitsunday Islands offshore Abbott                      there was a change in the spatial distribution of groups
Point port and Gladstone port.                                                      with a calf from offshore to inshore waters (Figures 3B,D).
                                                                                    This resulted in a spatial change in risk to a greater area
Relative Ship Strike Risk Maps                                                      of overlap with the shipping lane and coastal waters. While
Formalization of IMO Two-Way Shipping Route                                         the area of ship strike risk for groups with calves increased
Given there was little change in shipping numbers between years                     later in the breeding season (Figures 5B,D), there was a
and a higher relative abundance of whales in 2012 compared                          reduction in the level of risk due to a decrease in relative
to 2014, there was a higher average relative risk of ship strike                    whale abundance.
(two-fold increase) at the peak abundance of the season in 2012
compared to later in the breeding season in 2014 (Supplementary                     Projected Ship Strike Risk
Figure S3). A comparison of ship strike risk to whales pre- and                     The population of whales is increasing at an exponential rate
post-formalization of the inner shipping route shows minimal                        and concurrently there are current and projected increases
difference in the risk to whales (Supplementary Figure S3).                         in shipping in the GBR. We calculated a projected risk
Fundamentally, the two-way route formalized existing traffic                        of ship strike to humpback whales over a 10-year period
patterns into well-defined shipping lanes, such that there was                      based on an 11% annual increase in whale population size
little variation in shipping traffic distributions pre and post the                 (Noad et al., 2016). We used four different shipping traffic
IMO formalization.                                                                  growth rates based on a conservative (1.5%) to optimistic
                                                                                    (5.5%) estimate and projected forward to 2028. Based on
Spatial Risk of Ship Strike to Humpback Whales                                      the different shipping traffic growth rates, there is predicted
At the time of peak whale abundance on the breeding grounds                         to be between a three (conservative ship growth) and five-
(2012 whale model), the areas of higher relative risk of ship strike                fold increase (optimistic ship growth) in the risk of ship
to humpback whales occur in areas where shipping traverses                          strike to humpback whales in the GBR within the next
two areas of higher predicted whale density (Figures 3A,B,                          10 years (Figure 6).
4) in the southern GBR. All patterns of risk were consistent
across all years of shipping data, due to negligible differences
in ship numbers between years. At the finer spatial resolution                      DISCUSSION
(1 × 1 km) several areas of high ship strike risk (>80%)
were identified, including offshore of the Port of Abbott Point                     Management of multiple-use marine parks and World Heritage
and Port of Mackay/Hay Point (Figure 4). At the coarser                             Areas requires a balance between conservation and socio-
spatial resolution (50 × 50 km), the areas of high risk (>80%)                      economic demands for development. Spatially explicit
were restricted to the one location offshore of the Port of                         risk assessments provide the ability to manage multiple
Mackay/Hay Point thus corresponding to a greater area of high                       users of the marine environment, reduce environmental
risk (Figure 4).                                                                    impacts and reduce conflict among users (Hope, 2006).
   Overall, cumulative risk of ship strike for humpback whales                      Within the GBRWHA, there is considerable overlap between
at the group level is higher for non-calf groups compared                           shipping lanes and the breeding aggregation of humpback
to groups with a calf, due to there being significantly more                        whales for which shipping traffic and whale population size
sightings of non-calf groups (75%) compared to calf-groups                          are both increasing. Furthermore, the expansive physical
(25%). However, when standardized for the total number of                           structure of the GBR limits the ability to segregate these
whales in each group, the risk was consistently higher for                          two uses of the Marine Park and implement a common
groups containing females with a dependent calf in both 2012                        mitigation measure of re-routing shipping channels away
and 2014 (Supplementary Figure S4). During peak abundance                           from Biologically Important Areas. It is unlikely that ship
within the breeding season (using the 2012 whale model), there                      strikes will have a population-level effect on the whales
was consistency in the areas of high risk of ship strike for                        given the population is increasing close to its maximum
both calf and non-calf groups in areas located in the southern                      potential rate (∼11% per annum). However, there is concern

Frontiers in Marine Science | www.frontiersin.org                               7                                              February 2020 | Volume 7 | Article 67
Smith et al. Whale Ship Strike Risk in GBR FIGURE 3 | Modeled distribution and densities of humpback whale (A) non-calf groups and (B) calf groups in August 2012 and (C) non-calf groups and (D) calf groups in September 2014 in the Great Barrier Reef Marine Park with the overlayed inner shipping route. for a potential increase in whale fatalities from ship strikes, areas within the GBRMP of higher relative risk of ship and welfare concerns arising from non-fatal injuries, due strike to whales from large commercial ships. This should to greater interaction between breeding whales and ships. provide the basis to evaluate the level of threat to whales The spatially explicit risk assessment has identified specific from ship strike and focus future research areas to aid Frontiers in Marine Science | www.frontiersin.org 8 February 2020 | Volume 7 | Article 67
Smith et al.                                                                                                                      Whale Ship Strike Risk in GBR

  FIGURE 4 | Relative ship strike risk for all humpback whale groups in the GBRWHA based on the 2012 whale model and 2016 shipping data at (A) 1 × 1 km and
  (B) 50 × 50 km grid cell resolution.

informed management decisions on the types of mitigation                          resolution coarser (e.g., 50 × 50 km) than what AIS shipping
measures necessary.                                                               data necessitates (e.g., 1 km). Finer spatial resolution in the data
                                                                                  might be required for localized, small-scale applications such as
                                                                                  port developments, whereas regional management planning and
The Importance of Spatial Resolution on
                                                                                  zoning would necessitate coarser resolution.
Risk Estimates                                                                       We quantified risk at a fine scale (1 × 1 km) and coarse
To understand the risk of ship strike to whales, it is necessary                  scale (50 × 50 km) and Figure 4 demonstrates the effect that
to understand both the distribution and densities of whales                       spatial resolution can have on identifying areas of risk. At the
and shipping. Generally, there will be a degree of uncertainty                    finer spatial resolution, several areas of high ship strike risk
when quantifying both of these. Accurately identifying whale                      (>80%) were identified, including the area offshore of Abbott
distribution and density within and between years for a mobile                    Point. While this is an area of high risk, the extent of it covered
marine species’ is difficult without considerable sampling effort,                approximately 20 km of the shipping lane and consequently at
and shipping traffic can vary based on specific port activities and               the coarser spatial resolution it did not comprise an adequate
global economic factors. This is an important consideration when                  proportion of the area as high risk. Consequently, the areas of
undertaking spatially explicit risk assessments and identifying                   high risk were restricted to the one location offshore of the Port
an appropriate spatial resolution for the data. Often shipping                    of Mackay/Hay Point.
lanes are only several km’s in width and necessitate high-
resolution data (e.g., 1 × 1 km). However, uncertainty in whale
distribution data may not support such high resolution. In our                    Higher Ship Strike Risk to Females With
study we sub-sampled whale distribution within the GBRMP                          Calves
then modeled, and extrapolated on 2 years of survey data, which                   The relative risk of ship strike differed for whales of different
incorporates a certain degree of uncertainty in whale distribution.               reproductive class, with groups without calves having a higher
The spatial resolution also depends on the spatial scale over which               overall cumulative risk of ship strike. This was due to there
management decisions are being conducted (e.g., tens, hundreds                    being significantly more non-calf groups (75% in total) than
or thousands of km). In the case of the GBRMP, we advocate the                    groups with calves (25%). However, when risk is standardized
large area of the Marine Park (344,000 km2 ), covering 14 degrees                 for the total number of whales in each group type, the risk is
of latitude, requires undertaking the spatial risk assessment at a                higher throughout the GBRMP for groups with a female and

Frontiers in Marine Science | www.frontiersin.org                             9                                             February 2020 | Volume 7 | Article 67
Smith et al. Whale Ship Strike Risk in GBR FIGURE 5 | Relative ship strike risk for humpback whale (A) non-calf groups and (B) calf groups in August 2012 and (C) non-calf groups and (D) calf groups in September 2014 based on 2016 ship data at a 50 × 50 km grid cell resolution. dependent calf compared to non-calf groups. While there was the southern GBR (Figure 2). This northern GBR had a higher no distinct separation of calving versus mating areas, given calf calf-to-adult ratio (1:4) compared to the southern GBR (1:8) groups were sighted among non-calf groups in both inshore and offshore of Mackay. offshore waters, calving areas (based on sightings of groups with During peak whale abundance within the breeding season, calves) occurred throughout the length of the GBR and mating areas of relative high ship strike risk to calf and non-calf whale areas (groups without a calf) were predominantly restricted to groups were consistently identified in the southern GBR lagoon Frontiers in Marine Science | www.frontiersin.org 10 February 2020 | Volume 7 | Article 67
Smith et al. Whale Ship Strike Risk in GBR
from the formalization of the two-way route. Implementation
of the formalized shipping lane had the greatest change to the
distribution of shipping traffic offshore of Gladstone, in the
area of unknown risk. This area could not be modeled due to
insufficient whale data, although is likely a high risk area for ship
strike given the large export volume of LNG from Gladstone port
and the multiple shipping routes crossing a high density of whales
undergoing a constrained migration movement in this region
(Smith et al., 2012).
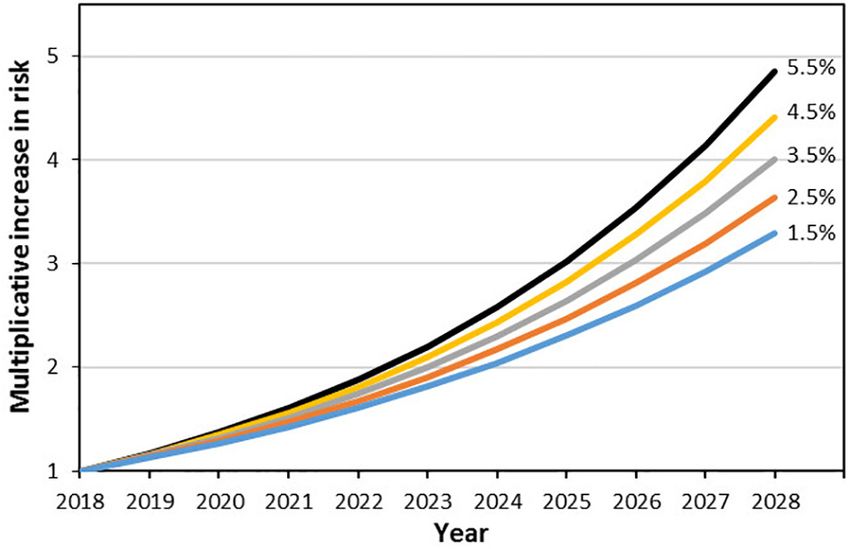
Future estimates of shipping volume in the GBR suggests a
potential increase of 4–5% annual growth rate, based on Qld port
industry forecasts over the period 2012–2032 for all vessels and
ports (PGM Environment, 2012). Projected ship strike risk based
on conservative (1.5%) to optimistic (5.5%) ship traffic growth
FIGURE 6 | Projected increase in relative expected fatality based on an
annual 11% increase in whale population size and various projected annual
rates show a three to five-fold increase in risk to whales over
shipping traffic increases (colored lines). the next 10-year period (Figure 6). Over this time period, there
is a potential doubling of the humpback whale population size
from the current estimate of 25,000 whales (Noad et al., 2008;
offshore of the Port of Mackay and Hay Point (Figures 4A,B). Bejder et al., 2016; Noad et al., 2016). The current population
Later in the breeding season when more females have given birth size is estimated to have reached over 50% of pre-exploitation
and the southward migration away from the breeding ground has levels, with estimates of recovery ranging between 58–98% due to
started, the relative abundance of whales decreases and there is a uncertainty of the historical abundance (Noad et al., 2008; Bejder
shift in the distribution by groups with females and a dependent et al., 2016; Noad et al., 2016). Of particular interest over the
calf from offshore to coastal, inshore waters (Figures 2, 3D). This next 10 years for the East Australian population of humpback
assumes minimal inter-annual variation in whale distribution, whales is the population recovery trajectory, with the possibility
which seems plausible given non-calf groups in 2014 occurred in of a population leveling to an uncertain carrying capacity
a similar area to non-calf and calf groups in 2012. Females with between 26,000 to 42,000 whales (Ross-Gillespie et al., 2015).
calves from several other populations of humpback whales (e.g., This highlights the necessity for understanding natural versus
Ecuador, Hawaii, Brazil) also display a preference for coastal, anthropogenic impacts on the recovery of whale populations.
shallow water habitat on their breeding grounds (Félix and The relative ship strike risk maps identified the southern half
Botero-Acosta, 2011; Craig et al., 2014; Guidino et al., 2014; of the GBRMP from Townsville to north of Gladstone (approx.
Gonçalves et al., 2018; Pack et al., 2018). The shift in distribution 19◦ S–22◦ S), including the east-west Hydrographers Passage route
of calf groups to inshore waters resulted in greater overlap with offshore of Mackay, to have the largest relative risk within all
the shipping lane, and an increase in the area of higher (>80%) of the Marine Park (Figure 4). The whale density models show
ship strike risk. However, the level of risk was considerably lower these areas correspond to where shipping traverses two higher
in September compared to peak whale abundance in July/August predicted whale density areas (Figure 3). This encompasses four
(Figure 5) due to a lower relative abundance. Currently, the major trading ports and likely to also include Gladstone. These
ship strike risk framework does not incorporate whale behavioral five ports make up the majority of export trade, particularly of
data that could differ among age and social classes (e.g., vessel natural resources such as coal, along the GBR coast representing
avoidance). Estimates of risk will be affected if certain classes of 78% ($51.75 billion) the total throughput of all Qld. ports
whales exhibit behavioral attributes that make them more or less (Queensland Government Statistician’s Office, 2017). The Qld.
susceptible to ship strike. For example, calf groups could be more commodity market is currently, and into the future, dominated
at risk of ship strike compared to non-calf groups if they have a by the trade of coal and liquefied natural gas (LNG), with
higher level of exposure to a ships’ strike zone as a consequence Australia currently the second largest global exporter of LNG.
of dive behavior e.g., frequent shallow dives. The risk framework Consequently, the risk to whales is only likely to increase unless
does not incorporate time spent at the surface due to insufficient there is significant downturn in coal and LNG exports. This
behavioral data. highlights the importance of an informed understanding of the
threats to the population (e.g., ship strike).
Formalization of Two-Way Shipping
Route and Projected Ship Strike Risk
From December 2014, the IMO formalized the inner two- Conservation Implications and Current
way shipping route through the GBR. While the route in the Protective Measures
northern GBR was existing, a new section was added to the Ship strike of whales is a global issue that has resulted
southern GBR that corresponded to existing shipping traffic in various management measures aimed at reducing the
patterns. Therefore, patterns in shipping traffic through the risk to whales. A spatial management approach commonly
GBR predominantly remained unchanged. Consequently, there implemented involves the establishment of time and area
has been little difference in ship strike risk to whales resulting specific modifications, for example Seasonal Management Areas
Frontiers in Marine Science | www.frontiersin.org 11 February 2020 | Volume 7 | Article 67Smith et al. Whale Ship Strike Risk in GBR FIGURE 7 | Map of the whale protection area and modelled distribution and density of ‘all whale’ humpback whale groups during August 2012, with red areas indicating high whale density. and Traffic Separation Schemes (TSS) (Silber et al., 2012). because the extensive reef structure of the GBR constrains Vessel routing and speed restrictions have both been shown to ship traffic movement between the reef and the coastline. reduce the probability and severity of ship strikes (Vanderlaan This significantly limits the viability of re-routing measures and Taggart, 2006; Vanderlaan and Taggart, 2009; Wiley due to the limited space within the Designated Shipping et al., 2011; Conn and Silber, 2013; Laist et al., 2014). Area (Figure 1). Furthermore, there is a dynamic temporal Within the GBRMP, mitigation options are more limited component to the distribution of whales throughout the Frontiers in Marine Science | www.frontiersin.org 12 February 2020 | Volume 7 | Article 67
Smith et al.                                                                                                          Whale Ship Strike Risk in GBR

breeding season, with movement of calf groups from offshore                DATA AVAILABILITY STATEMENT
to inshore waters.
    A feasible management option within the GBRMP is the                   The datasets generated for this study are available on request to
designation of a Special Management Area (SMA) for which                   the corresponding author.
there is provision under the Great Barrier Reef Marine Park
Regulations 2019 for purposes outlined in the Great Barrier Reef
Zoning Plan 2003, which include the conservation of a particular           ETHICS STATEMENT
species or resource e.g., aggregation sites. Species Conservation
areas are a type of SMA that have been implemented for                     The animal study was reviewed and approved by the Murdoch
dugongs in the GBRMP to restrict human activities and minimize             University Animal Ethics Committee permits ((O2487/12
disturbance. Currently, a Whale Protection Area (WPA) (which               and O2680/14).
is not an SMA) exists for whales in the Whitsunday area to
restrict the distance that vessels can approach breeding whales            AUTHOR CONTRIBUTIONS
and minimize disturbance. However, this area was primarily
established to manage tourism vessels involved in whale watching           JS conceived the fieldwork design, collected the data, and led the
and other tourism activities. The WPA clearly does not cover               writing of the manuscript. JS, NK, SC, DP, JR, and TM analyzed
the areas of highest density of whales and greatest risk of                the data. All authors contributed critically to the drafts and gave
ship strike to breeding whales in the GBR (Figure 7). The                  final approval for publication.
relative risk maps have identified areas that represent sufficient
risk to breeding humpback whales and warrants consideration
of suitable mitigation to reduce the risk. Current legislation             FUNDING
provides the opportunity to establish a Species Conservation
area as part of a SMA that could help focus management                     We acknowledge the Australian Marine Mammal Centre Grant
effort. Specific mitigation options could be the focus of further          Program as our primary funder and the International Fund
research into understanding the magnitude of the threat of ship            for Animal Welfare Oceania Office for supporting funds. The
strike to humpback whales and could range from voluntary                   funding bodies had no involvement in the study design, in the
reporting of whale sightings by onboard observers to mandatory             collection, analysis and interpretation of data, in the writing of
speed restrictions. AMSA in partnership with the IMO could                 the report and in the decision to submit the article for publication.
impose seasonal speed restrictions in targeted areas to reduce
ship strike risk. Speed restrictions could be a viable and cost-
effective management option given the evidence that vessel
                                                                           ACKNOWLEDGMENTS
speed reductions of large vessels to ≤10 knots significantly               We are extremely grateful to many people and organizations
reduces the risk of ship strike (Vanderlaan and Taggart, 2006)             who have aided in the development of this project. Specifically,
and many vessels already travel close to that speed in the                 we would like to acknowledge the Australian Marine Mammal
GBRMP (74% of vessel transits are between 10 and 15 knots and              Centre and the International Fund for Animal Welfare Oceania
only 11% >15 knots).                                                       Office, in particular Isabel McCrea, Matt Collis, and Sharon
    Currently, the ship strike framework provides a relative               Livermore from IFAW for their support of the project. To Mark
metric across the study area useful for comparing relative                 Read and Andrew Simmons at GBRMPA for their support of
risk, although cannot be inferred as an estimation of actual               the project, providing advice and access to data. The Australian
mortality. Calculating absolute risk is currently problematic              Maritime Safety Authority have been supportive of the project
due to insufficient knowledge on many parameters associated                and helpful with access to AIS data, especially Ross Henderson.
with ship strike (e.g., response/avoidance behavior of whales              The professional and experienced flying of Brad Welch from
to vessels), large uncertainty/variance related to species spatial         aerial charter company Observair was invaluable for successfully
distributions (e.g., intra- and inter-annual variability) and              undertaking aerial surveys and thanks to the aerial survey team in
unknown parameters that have not been modeled (e.g.,                       2012 (Susan Sobtzick, Natalie Schmitt, Verity McCorkill, Louise
survivorship from blunt force trauma). The framework does                  Bennett, and Amanda Hodgson) and 2014 (Louise Bennett, Maria
enable managers to assess different scenarios of speed restrictions        Jedjenso, Shannon McKay, Kylie Mackenzie, and Amy James) for
and its effect on risk, due to incorporating vessel speed as               their dedicated work. This work was undertaken under GBRMPA
a factor in the risk calculation. To improve the ship strike               permits (G12/35027.1 and 14/37113.1) and Murdoch University
framework, incorporation of different vessel characteristics (e.g.,        Ethics permits (O2487/12 and O2680/14).
vessel draught and potential depth of strike zones including
hydrodynamic effects) and whale behavior (e.g., time at surface
and avoidance) are required, if and when, data are available.              SUPPLEMENTARY MATERIAL
While the true relationship between relative and absolute
risk remains unknown, these data provide the best source of                The Supplementary Material for this article can be found online
information to aid in the identification of potential hotspots of          at:     https://www.frontiersin.org/articles/10.3389/fmars.2020.
high interactions between whales and shipping in the GBR.                  00067/full#supplementary-material

Frontiers in Marine Science | www.frontiersin.org                     13                                        February 2020 | Volume 7 | Article 67
Smith et al. Whale Ship Strike Risk in GBR
REFERENCES Laist, D. W., Knowlton, A. R., and Pendleton, D. (2014). Effectiveness
of mandatory vessel speed limits for protecting North Atlantic
Bejder, M., Johnston, D. W., Smith, J. N., Friedlaenderd, A., and Bejder, right whales. Endang. Spec. Res. 23, 133–147. doi: 10.3354/esr
L. (2016). Embracing conservation success of recovering humpback 00586
whale populations: evaluating the case for downlisting their conservation Miller, D. L., Burt, M. L., Rexstad, E. A., and Thomas, L. (2013). Spatial
status in Australia. Mar. Policy 66, 137–141. doi: 10.1016/j.marpol.2015. models for distance sampling data: recent developments and future
05.007 directions. Methods Ecol. Evol. 4, 1001–1010. doi: 10.1111/2041-210X.
Braemar Seascope (2013). North Queensland ship traffic growth study. 12105
Supplementary Report. 71. Available at: https://docplayer.net/17070612- Noad, M. J., Dunlop, R. A., Bennett, L., and Kniest, H. (2016). Abundance estimates
North-queensland-ship-traffic-growth-study-supplementary-report-for-public of the east Australian humpback whale population (BSE1): 2015 survey and
-release.html (accessed March 22, 2013). update. Paper Presented at SC/66b/SH21 Submitted for Consideration by the
Bureau of Infrastructure, Transport and Regional Economics [BITRE] (2017). IWC Scientific Committee, Impington.
Australian Sea Freight 2014–15. Canberra, ACT: BITRE. Noad, M. J., Dunlop, R. A., Paton, D. A., and Cato, D. H. (2008). “An update of
Burt, M. L., Borchers, D. L., Jenkins, K. J., and Marques, T. A. (2014). the east Australian humpback whale population (E1) rate of increase. Paper
Using mark-recapture distance sampling methods on line transect Presented at SC/60/SH31 Submitted for Consideration by the IWC Scientific
surveys. Methods Ecol. Evol. 5, 1180–1191. doi: 10.1111/2041-210X. Committee, Impington.
12294 Pack, A. A., Herman, L. M., Craig, A. S., Spitz, S. S., Waterman, J. O., Herman,
Cates, K., DeMaster, D. P., Brownell, R. L. Jr., Silber, G., Gende, S., Leaper, E. Y. K., et al. (2018). Comparing depth and seabed terrain preferences of
R., et al. (2017). Strategic Plan To Mitigate The Impacts Of Ship Strikes individually identified female humpback whales (Megaptera novaeangliae), with
On Cetacean Populations: 2017-2020. Cambridge: International Whaling and without calf, off Maui, Hawaii. Mar. Mamm. Sci. 34, 1097–1110. doi: 10.
Commission. 1111/mms.12495
Conn, P. B., and Silber, G. K. (2013). Vessel speed restrictions reduce risk of Panigada, S. G., Pesante, G., Zanardelli, M., Capoulade, F., Gannier, A., and
collision-related mortality for North Atlantic right whales. Ecosphere 4:43. doi: Weinrich, M. T. (2006). Mediterranean whales at risk from fatal ship
10.1890/ES13-00004.1 strikes. Mar. Pollut. Bull. 52, 1287–1298. doi: 10.1016/j.marpolbul.2006.
Craig, A. S., Herman, L. M., Pack, A. A., and Waterman, J. O. (2014). 03.014
Habitat segregation by female humpback whales in Hawaiian waters: Peel, D., Smith, J. N., and Childerhouse, S. (2018). Vessel strike of whales in
avoidance of males? Behaviour 151, 613–631. doi: 10.1163/1568539X-000 Australia: the challenges of analysis of historical incident data. Front. Mar. Sci.
03151 5:69. doi: 10.3389/fmars.2018.00069
Erbe, C., Marley, S. A., Schoeman, R. P., Smith, J. N., Trigg, L. E., and Embling, C. B. PGM Environment (2012). Great Barrier Reef Shipping: Review of Environmental
(2019). The effects of ship noise on marine mammals–a review. Front. Mar. Sci. Implications. Safety Bay, WA: PGM Environment.
6:606. doi: 10.3389/fmars.2019.00606 Queensland Government Statistician’s Office (2017). Trade data – Overseas Exports
Félix, F., and Botero-Acosta, N. (2011). Distribution and behaviour by Port of Loading, Commodity (3-digit SITC revision 3) and Country of
of humpback whale mother–calf pairs during the breeding season Destination, Queensland and Australia, 2006–07 to 2016–17. Brisbane City
off Ecuador. Mar. Ecol. Prog. Ser. 426, 277–287. doi: 10.3354/meps QLD: Queensland Government Statistician’s Office.
08984 R Development Core Team (2015). R: A Language and Environment for Statistical
Gonçalves, M. I. C., Sousa-Lima, R. S., Teixeira, N. N., Morete, M. E., Carvalho, Computing. Vienna: R Foundation for Statistical Computing.
G. H., Ferreira, H. M., et al. (2018). Low latitude habitat use patterns of a Redfern, J. V., Mckenna, M. F., Moore, T. J., Calambokidis, J., Deangelis, M. L.,
recovering population of humpback whales. J. Mar. Biol. Assoc. U. K. 98:1087. Becker, E. A., et al. (2013). Assessing the risk of ships striking large whales
doi: 10.1017/S0025315418000255 in marine spatial planning. Conserv. Biol. 27, 292–302. doi: 10.1111/cobi.
Guidino, C., Llapapasca, M. A., Silva, S., Alcorta, B., and Pacheco, A. S. (2014). 12029
Patterns of spatial and temporal distribution of humpback whales at the Ross-Gillespie, A., Butterworth, D. S., and Johnston, S. J. (2015). Assessment Results
southern limit of the southeast pacific breeding area. PLoS One 9:e112627. for Humpback Breeding Stocks D, E1 and Oceania Following Recommendations
doi: 10.1371/journal.pone.0112627 from SC 65a. Korea: IWC Scientific Committee.
Hedley, S. L., and Buckland, S. T. (2004). Spatial models for line transect Silber, G. K., Vanderlaan, A. S. M., Arceredillo, A. T., Johnson, L., Taggart,
sampling. J. Agric. Biol. Environ. Statist. 9, 181–199. doi: 10.1198/10857110 C. T., Brown, M. W., et al. (2012). The role of the international maritime
43578 organization in reducing vessel threat to whales: process, options, action
Hijmans, R. J. (2016). Geosphere: Spherical Trigonometry. – R Package Version 1.5-7. and effectiveness. Mar. Policy 36, 1221–1233. doi: 10.1016/j.marpol.2012.
Hope, B. K. (2006). An examination of ecological risk assessment and 03.008
management practices. Environ. Intern. 32, 983–995. doi: 10.1016/j.envint.2006. Smith, J. N., Grantham, H. S., Gales, N., Double, M. C., Noad, M. J., and
06.005 Paton, D. (2012). Identification of humpback whale breeding habitat in the
Integrated Marine Observing System [IMOS] (2015a). SRS Satellite – SST L3S – great barrier reef. Mar. Ecol. Prog. Ser. 447, 259–272. doi: 10.3354/meps
1 Day Composite – Day and Night Time. Available at: https://imos.aodn.org.au/ 09462
imos123/home (accessed April 1, 2015). Tournadre, J. (2014). Anthropogenic pressure on the open ocean: the growth of
Integrated Marine Observing System [IMOS] (2015b). Gridded Sea Level Anomaly- ship traffic revealed by altimeter data analysis. Geophys. Res. Lett. 7924–7932.
Delayed Mode. Available at: https://imos.aodn.org.au/imos123/home (accessed doi: 10.1002/2014GL061786
April 1, 2015). UNCTAD (2018). 50 Years of Review of Maritime Transport, 1968–2018 - Reflecting
Integrated Marine Observing System [IMOS] (2015c). SRS Satellite-OC MODIS – on the Past, Exploring The Future. Geneva: UNCTAD.
1 day –Chlorophyll a Concentration Algorithm. Available at: https://imos.aodn. UNCTAD (2019). Review of Maritime Transport 2018. Review of Maritime
org.au/imos123/home (accessed April 1, 2015). Transport (RMT). Geneva: UNCTAD.
Kelleher, G. (1999). Guidelines for Marine Protected Areas. Gland: IUCN. UNESCO (2012). Mission Report Reactive Monitoring Mission to Great Barrier Reef
Laake, J. L., Borchers, D., Thomas, L., Miller, D., and Bishop, J. (2015). MRDS: (Australia). WHC-12/36.COM. Available at: http://whc.unesco.org/en/list/154/
Mark-Recapture Distance Sampling. pp. (MRDS): R Package. documents/
Laake, J. L., and Borchers, D. L. (2004). Methods for Incomplete Detection at Vanderlaan, A. S. M., and Taggart, C. T. (2006). Vessel collisions with whales: the
Distance Zero. Oxford: Oxford University Press. probability of lethal injury based on vessel speed. Mar. Mamm. Sci. 23, 144–156.
Laist, D. W., Knowlton, A. R., Mead, J. G., Collet, A. S., and Podesta, M. (2001). doi: 10.1111/j.1748-7692.2006.00098.x
Collisions between ships and whales. Mar. Mamm. Sci. 17, 35–75. doi: 10.1111/ Vanderlaan, A. S. M., and Taggart, C. T. (2009). Efficacy of a voluntary
j.1748-7692.2001.tb00980.x area to be avoided to reduce risk of lethal vessel strikes to endangered
Frontiers in Marine Science | www.frontiersin.org 14 February 2020 | Volume 7 | Article 67You can also read