Brier Creek Watershed Management Plan - Thomson, Georgia - Environmental Protection Division
←
→
Page content transcription
If your browser does not render page correctly, please read the page content below
Brier Creek Watershed Management Plan
Thomson, Georgia
Developed by Phinizy Center for Water Sciences in cooperation with
Georgia EPD and Thomson-McDuffie County Government

2014-2015

Introduction

Purpose of the Watershed Management Plan

     In 2014, the GAEPD contracted with the City of Thomson to build on earlier efforts to restore Brier
Creek by developing a Watershed Management Plan (WMP) to more effectively address USEPA’s Nine
Elements of Watershed Planning. USEPA’s “Handbook for Developing Watershed Plans to Restore and
Protect Our Waters” and GAEPD’s “Watershed Planning Guidance” were used as resources in the planning
process. According to USEPA and GAEPD guidelines, Watershed Management Plans are intended as
platforms for evaluating and tracking water quality protection and restoration. These plans are designed
to accommodate continual updates and revisions as new conditions and information warrant. In addition,
field verification of watershed characteristics and listing data has been built into the preparation of the
plans. The overall goal of the plans is to define a set of actions that will help achieve water quality
standards in the State of Georgia.

    This management plan for the Brier Creek watershed provides identification of causes and sources of
impairments; an estimate of the expected load reductions; assessment of the NPS management measures
needed and the critical areas where they need to be implemented; an estimate of the amount of technical
and financial assistance needed to implement the plan and the sources of this assistance; a plan for an
education and information component; a schedule for implementation; interim measureable milestones
for NPS management measure implementation; criteria for evaluating progress toward load reductions;
and a long-term monitoring strategy to correlate the previous two items. While the context of this water
quality improvement effort encompasses the Brier Creek Watershed, HUC 10 #0306010801, this plan
specifically focuses on the nonpoint sources (NPS) of fecal coliform bacteria in the HUC 12 #030601080103
watershed area located upstream of the confluence of Brier Creek and Sweetwater Creek, which is just
downstream of the US Hwy 17 crossing.

Page | 1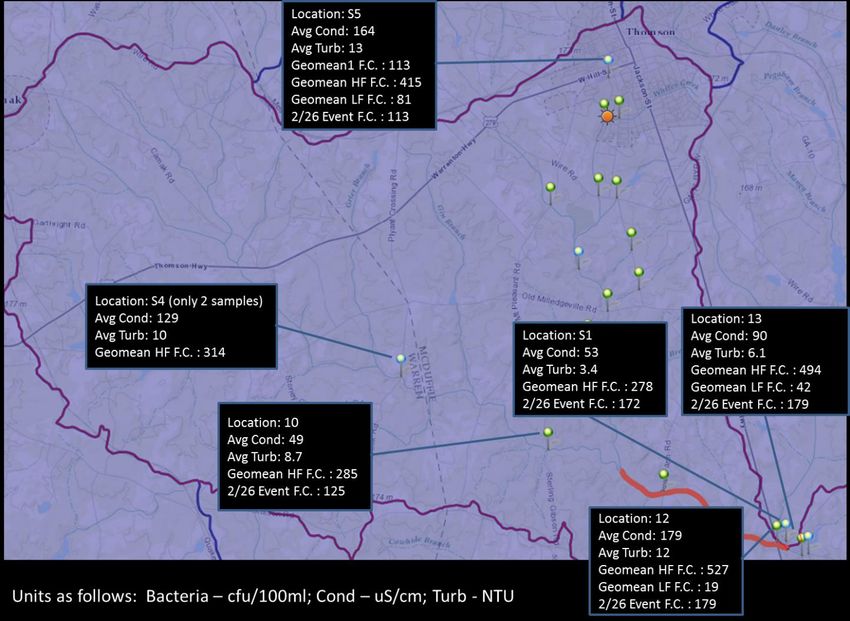
Background
Three miles of Brier Creek from White’s Creek to Sweetwater Creek near Thomson (formerly Big Brier
Creek to Sweetwater Creek) have been classified as “impaired” under Section 303(d) of the Federal Clean
Water Act for not supporting the designated use of fishing due to excessive fecal coliform levels. Water
quality samples collected in 2002 are not meeting the Georgia standards for bacteria:
Geometric mean of 200 per 100 ml (May-October)
Geometric mean of 1000 per 100 ml (November-April)
Single sample of 4000 per 100 ml (Nov-April)
A Total Maximum Daily Load (TMDL) written in 2005 required a reduction of 57% in fecal coliform
loadings from nonpoint sources in order for the segment to resume assimilative capacity. A Revised TMDL
Implementation Plan and a Watershed Improvement Plan were written in 2007 and 2010, respectively,
aimed at restoring Brier Creek to its designated use. The Thomson Water Pollution Control Plant (WPCP)
discharges into White’s Creek (latitude 33.3824 and longitude -82.5037). White’s Creek is a tributary of
Brier Creek entering at the upstream end of the impaired reach and extending north while the main stem
of Brier Creek extends west.
The Savannah River Basin is located primarily in eastern Georgia and western South Carolina and
defines the state boundary between Georgia and South Carolina. The Savannah River flows for more than
300 miles to the Atlantic Ocean, beginning in the Blue Ridge Mountains of North Georgia. Supplying
drinking water to cities such as Augusta, Savannah, Hilton Head, and Beaufort, SC, and many smaller
municipalities, along with hydropower and a large port, the Savannah River is among the most highly
impacted of southeastern rivers. The lower Savannah River watershed encompasses more than 10,577
square miles and supports extremely high species biodiversity, including the greatest number of native
fish species of any river draining into the Atlantic. As salt water intrudes into the aquifers near the coast,
the Savannah River is ever more important as a source of drinking water. Despite its scenic beauty and
natural diversity, the ecological health of the river system from the headwaters to the estuary requires
constant management. The construction of dams and reservoir systems just 50 years ago has negatively
altered the natural flow patterns that support the wildlife and natural communities of the Savannah River,
its floodplain and its estuary. Additionally, large-scale timbering, municipal water needs and harbor
dredging and expansion are contributing to the degradation of the entire ecosystem. (Savannah River
Basin Management Plan, 2001).
The Savannah River Basin is located within three physiographic provinces: the Blue Ridge, Piedmont,
and the Coastal Plan provinces. The Blue Ridge and Piedmont provinces, which constitute approximately
60 percent of the Savannah River Basin, are underlain by crystalline metamorphic and igneous rocks.
Coastal Plain sediments constitute approximately 40 percent of the Savannah River basin. Approximately
80 percent of the sediments are sands and clays. The rest include calcareous sediments and Quaternary
alluvium. The Coastal Plain sediments overlap the southern edge of the Piedmont Province at the Fall Line
and are dominantly marine in origin, consisting of sand, kaolinitic sand, kaolin, and pebbly sand. These
Page | 2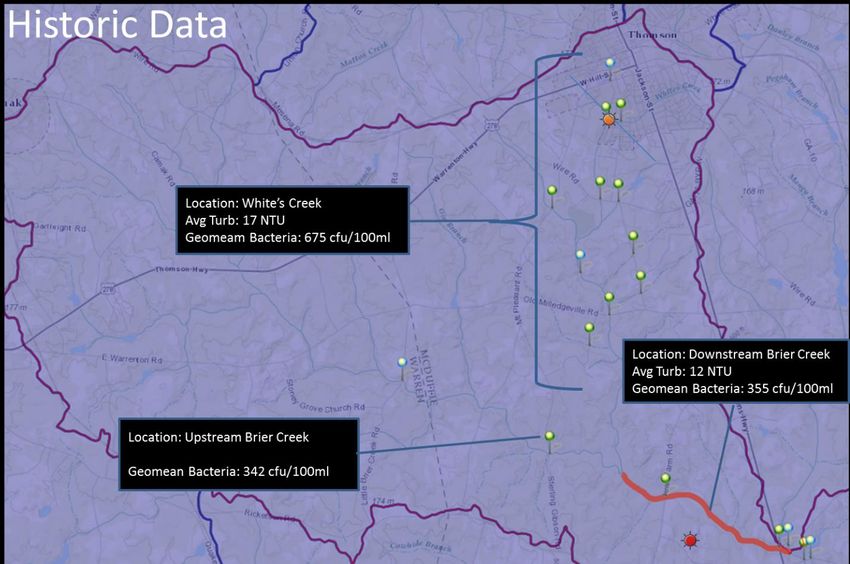
sediments host the major kaolin deposits in Georgia with many of these deposits found within the
Savannah River basin.

    Much of the southeastern Piedmont is covered by deeply weathered bedrock called saprolite. Average
saprolite thickness in the Piedmont rarely exceeds 20 meters, but the thickness can vary widely within a
short distance. A considerable amount of ground water flows through the saprolite and recharges streams
in the Piedmont. Saprolite is easily eroded when covering vegetation and soil are removed. Extensive
erosion of soil and saprolite caused by during the 1800s and early 1900s contributed a vast quantity of
sediments into stream valleys, choking the streams and raising the base flow level. As conservation
practices stabilized erosion, streams began to reestablish grade and to cut into the thick accumulations of
sediments, remobilizing them into the major rivers and eventually into reservoirs (Savannah River Basin
Management Plan, 2001).

Watershed Description

    The Savannah River Basin is divided into 7 sub-basins or Hydrologic Unit Codes (HUC). Each sub-basin
or HUC 8 is divided further into HUC 10s and HUC 12s. Brier Creek is located in HUC 8 #03060108 as shown
in the map (Figure 1) and extends into parts of Glascock County, McDuffie County and Warren County,
Georgia. The 3-mile impaired stream segment of Brier Creek (Whites Creek to Sweetwater Creek near
Thomson - formerly Big Brier Creek to Sweetwater Creek) is located in HUC 10 #0306010801 and
contained entirely within McDuffie County, Georgia (Figure 2).

Page | 3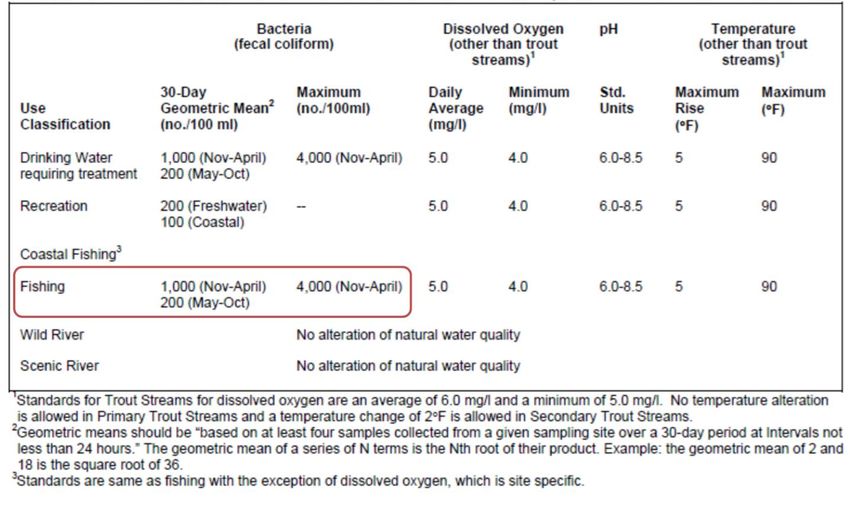
Figure 1. Brier Creek Watershed

Page | 4
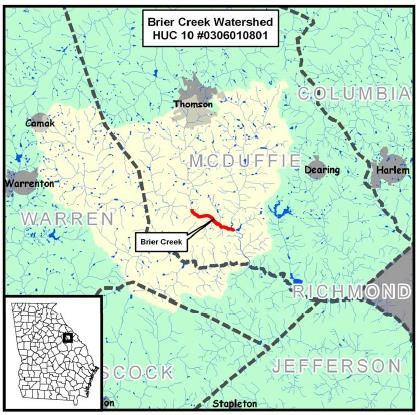
Figure 2. Impaired Reach of Brier Creek in McDuffie County

     Brier Creek itself is a riverine watercourse traversing much of eastern Georgia between the Ogeechee
River and the Savannah River. It arises between Warrenton in Warren County and Thomson in McDuffie
County in the lower portion of the Piedmont. The upper portion of the creek is surrounded by open pit
kaolin mines as it passes through the fall line. This waterway has a length of approximately 80 miles (130
kilometers). In many places along the length of its course it is 30 to 50 feet (9 to 16 meters) in width. Near
its mouth it is sometimes as broad as 80 feet (25 meters). In many ways it is more a river than a creek by
the time it reaches the Savannah. The joining of Brier Creek with the Savannah River forms a significant
geographic constraint upon movement in that area between the forks formed by the creek and river. The
land surrounding the creek and river is often swampy, and movement across both waterways is greatly
constrained.

     The impaired stream segment of Brier Creek (Whites Creek to Sweetwater Creek near Thomson -
formerly Big Brier Creek to Sweetwater Creek) is contained in McDuffie County. It is approximately three
miles long from Sterling Gibson Road to Georgia Highway 17 south of the City of Thomson. The TMDL
segment is listed as not supporting its designated use of fishing due to excess fecal coliform bacteria (Table
1). The data that put the segment on the 303(d) list were collected in 2002.

Page | 5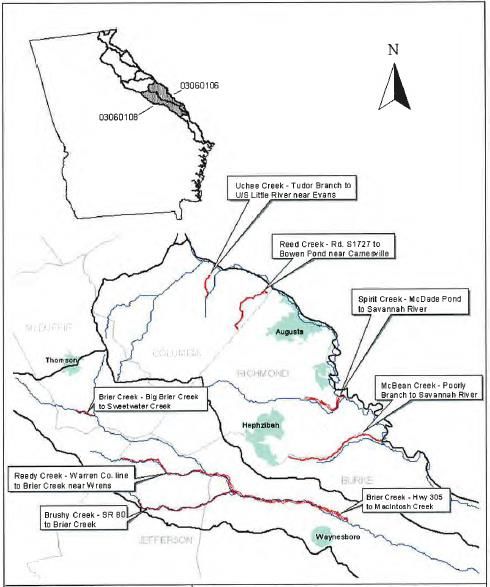
The land use characteristics of the HUC 10 and impaired segment drainage areas are provided below
in Tables 2 and 3. Information on the livestock (NRCS, 2003) and septic system characteristics of the
counties is given in Tables 4 and 5. Livestock populations, particularly cattle, in all McDuffie county are
estimated at 27.6 animals per square mile, which can be compared to the estimated deer density of 44
animals per square mile (GADNR, 2005). This is above the optimal 35 deer per square miles for herd
management (GADNR, 2005) and the 15-20 deer per square mile that is considered optimal for the
ecosystem (USFS, 2012). Therefore, the watershed has a relative high density of both livestock and
wildlife, which could be contributing to decreased water quality if not managed carefully.

Page | 6
Table 2. Land Use Summary for the HUC10 Watershed

                Table 3. Land Use Summary for Brier Creek

Page | 7
Table 4. Estimated Livestock Densities for the Counties in the Watershed
Estimated Density of Livestock Animals by County (per sq mile)
Beef Dairy Total
County Cattle Cattle Cattle Goats Horses Hogs Sheep
Glascock 28 0 28 3.5 0.4 1.0 0.0
McDuffie 19 3 21 2.3 3.1 0.4 0.8
Warren 29 5 34 6.9 7.7 3.7 0.0
Table 5. Estimated Septic Systems for the Counties in the Watershed
Estimated Density of Septic Systems (per sq mile)
Existing in Existing in Repaired
County 1990 2002 1990-2002
McDuffie 18 27 0.7
Warren 5 6 0.3
Glascock 5 6 0.0
Page | 8Identification of Impairment Causes and Pollutant Sources
In order to meet recommended Georgia Water Quality Standards (Table 6), a 57% reduction in fecal
coliform bacteria loadings has been recommended to restore the water body to supporting the beneficial
use classification of fishing.
Table 6: Georgia State Water Quality Standards
The 2005 Savannah River Basin TMDL determined that this watershed was predominantly rural with
agriculture being the primary land use (Table 2). Data from 2008 shows that the watershed is still
predominantly agricultural and most residential development is scattered. Average parcel size is greater
than 20 acres and many parcels are comprised of hundreds of acres. Agricultural land use consists of
livestock (horses and cattle), limited poultry, and pasture; however, the majority of the land is in timber.
The 2005 TMDL established for the stream segment indicates possible sources of fecal coliform
contamination in Brier Creek are nonpoint sources due to, but not limited to, wildlife, agriculture, and
urban development. Fecal coliform bacteria are an indicator organism used to track the presence of
possible pathogens in water instead of analyzing the pathogens themselves. Indicator organisms, or
coliforms such as fecal coliform or E. coli, are bacteria that occur along with pathogens in human and
animal waste, but are easier to collect and count. The importance of wildlife as a source of fecal coliform
bacteria in streams varies considerably, depending on the animal species present in the sub watersheds.
Fecal coliform bacteria contributions from deer to water bodies are generally considered less significant
than that of waterfowl, raccoons, and beavers. Feces deposited on the land surface can result in the
introduction of fecal coliform to streams during rain events. It should be noted that between storm events
considerable decomposition of the fecal matter might occur, resulting in a decrease in the associated fecal
coliform numbers. This is especially true in the warm, humid environments typical of the southeast.
Page | 9Agricultural livestock are also a potential source of fecal coliform to streams in the Savannah River
Basin. The animals grazing on pastureland deposit their feces onto land surfaces, where it can be
transported during storm events to nearby streams. Animal access to pastureland varies monthly,
resulting in varying fecal coliform loading rates throughout the year. Beef cattle spend all of their time in
pastures, while dairy cattle and hogs are periodically confined. In addition, agricultural livestock will often
have direct access to streams that pass through their pastures and can impact water quality in a more
direct manner (USDA, 2002). Brier Creek is surrounded by pastures where livestock graze and have access
to streams.
A portion of the fecal coliform in the Savannah River Basin may also be attributed to failure of septic
systems and illicit discharges of raw sewage. Table 5 gives estimates of the number of septic systems in
each county of in the Brier Creek Watershed existing in 1990, based on U.S. 1990 Census Data, and the
number existing in 2002, based on the Georgia Department of Human Resources, Division of Public Health
data. In addition, an estimate of the number of septic systems installed and repaired during the twelve-
year period from 1990 to 2002 is given. Since 1990, Georgia has seen a substantial increase in the number
of septic systems in most of its counties. This is generally a reflection of population increases outpacing
the expansion of sewage collection systems during this period. The table compares the number of septic
tanks existing in 1990 to those existing in 2002, as well as the number of repairs between 1990 and 2002.
Pollutant Source Assessment
Baseline Watershed Assessment
The hydrology of this watershed is characterized by three data sources. The first is the Brier Creek
USGS gage near Waynesboro, GA, near the middle of Burke County (Figure 3, 5). This gage is located
downstream of the study region in Brier Creek (Figure 3) and measures a drainage area of 473 square
miles. This 473 square miles include the 61 square miles of the study region. While the study area does
not have its own USGS gage site, Brushy Creek (Figure 3, 5), another tributary of Brier Creek, does. This
gage is the second data source that can be accessed to characterize the hydrology of Brier Creek
watershed. Brushy Creek is also included in the Waynesboro gage drainage area, contributing
approximately 22 square miles of the drainage area.
Page | 10Figure 3. Brier Creek Watershed
The third data set to describe the hydrology of the pertinent drainage area is a 2004 study by Chasman
and Associates (Chasman, 2004). In this study, the authors identified that the WPCP located in the
upstream portions of White’s Creek provides a significant portion of the flow in the channel that would
otherwise not be present during dry weather conditions. Thus, according to Chasman, the presence of the
WPCP likely creates the hydrologic conditions necessary for the designated use of fishing for at least a
large portion of White’s Creek, if not portions of Brier Creek as well (Figure 4). Observations by the authors
confirm this based on tributaries of similar drainage area being dry, while the portion directly below the
WPCP had flow. These tributaries are the branches of White’s Creek directly east and west of the portion
into which the WPCP drains. The Chasman study also indicated that during the time of the study, the
Page | 11WPCP was responsible for almost 21% of the flow in Brier Creek at US Hwy 17, which is the downstream
end of the impaired reach. However, the watershed upstream of the WPCP in White’s Creek represents
less than 4% of the drainage area to that point at US Hwy 17 on Brier Creek.
This hydrology indicates the disproportionate influence of White’s Creek due to the volume of WPCP
effluent over the portion of Brier Creek upstream from the confluence of White’s Creek and Brier Creek.
Therefore, even if the upstream reaches of Brier Creek had similar bacteria concentrations to White’s
Creek, White’s creek would still be the major contributor since it is responsible for a large percentage of
the flow but is a small percentage of the watershed.
WPCP
US Hwy 17
Crossing
Figure 4. Watershed for the Impaired Reach of Brier Creek with impaired reach highlighted in red.
Page | 12Figure 5. 2013 hydrology data from Brier Creek downstream of the study area Page | 13
Figure 6. 2013 hydrology data from Brushy Creek, a nearby common tributary to Brier Creek

        Historic Bacteria Data

    Hydrology is not the only reason to focus on White’s Creek instead of upstream Brier Creek. Bacteria
data also indicate its dominant influence. This is likely the reason why the Chasman study focused most
of the data collection and analysis on the White’s Creek watershed. As discussed below, in addition to the
inordinately high flow, the bacteria concentrations in White’s Creek are consistently higher than those
upstream in Brier Creek.

    Past data on pathogen indicator bacteria (Fecal Coliform and E. Coli) in Brier Creek also comes from
three sources: USGS monitoring (EPA Storet Archive, 2014), Adopt-A-Stream citizen monitoring (GA AAS
Database, 2014), and a Nutter and Associates contracted study (Watershed Assessment for City of
Thomson, 2010; Figure 7). The data from upstream of the confluence with White’s Creek comes from the
Adopt-A-Stream monitoring during July to September of 2011. The data from in-stream White’s Creek
comes from the Nutter and Associates study during August to October of 2008 and May to June of 2013
and the Adopt-A-Stream data during July to September of 2011. The data from below the confluence
comes primarily from the USGS throughout the year during 1997 and 2002. All three data sets indicate a
Page | 14
potential to exceed regulatory criteria (Figure 7), while the values from the White’s Creek confluence and below are notably higher than those in Brier Creek above the confluence. This further supports the focus of this study on the White’s Creek watershed. It is also noteworthy that the data from White’s Creek seem to group into higher and lower values (blue diamonds on Figure 7). However, there was no explanatory variable observed for this grouping. The historic data are also summarized graphically in figure 8. Figure 7. Prior Data on Fecal Coliform and/or E. coli in Brier Creek Page | 15
Figure 8. Summary of Historic Data on Fecal Coliform and/or E. coli in Brier Creek

    Supporting Water Quality Information

    The Chasman study, which looked at stream chemistry, macroinvertebrate populations, and fish
populations, seems to indicate that the WPCP is either neutral or of a slightly positive net benefit to the
stream ecology. The same study did find periodic instances of toxicity from the WPCP, but the source
proved very difficult to identify and no significant effects on stream ecology could be seen to coincide
with the periodic instances of high toxicity. GAEPD data (Figures 9 and 10) from 2012, accessed through
Storet, indicate dissolved oxygen levels very close to the regulatory limit during July and August. This is
supported by relatively high total phosphorus concentrations during summer months, indicating a
relationship to season that might be explained by seasonal release from in-stream stores or seasonal land
application and runoff. Seasonal algal growth is a possible explanation. These seasonal trends weigh
against wastewater as a source of nutrients or low DO. BOD levels are low and not otherwise noteworthy.

Page | 16
Figure 9. Dissolved oxygen data from 2001-2003
Figure 10. Total phosphorus data from 2001-2003
Quantify the Present Extent Needing Improvement
The available historic data indicates that White’s Creek supplies much more bacterial load to the
impaired reach then the upstream portion of Brier Creek for the following reasons: 1) White’s Creek
supplies a disproportional amount of the water to the impaired reach; 2) there are higher indicator
bacteria concentrations in White’s Creek compared to upstream of the confluence in Brier Creek; and 3)
there is not a noticeable increase in indicator bacteria concentrations in the impaired portion of Brier
Creek above those observed in White’s Creek.
Given the observed situation in this watershed, the following tool has been designed to look at
possible stressor-impact-impairment scenarios. This watershed impact schematic (Figure 11), used along
with the data, will allow stakeholders to evaluate the most likely scenarios that are causing the majority
of impact to the water quality of the stream. In this schematic, a yellow outline is used to denote a link in
the scenario chain where a BMP might be used to interrupt the chain and prevent pollutant loading. The
Page | 17additional data collected during this report, presented below and included as Appendix C, will allow refinement of the options and a narrowing down of the most likely impact scenarios. Figure 11. Watershed impact schematic for White’s Creek indicating possible scenarios for elevated bacterial concentrations in the impaired reach. Page | 18
Estimation of Load Reductions Expected from Management Measures
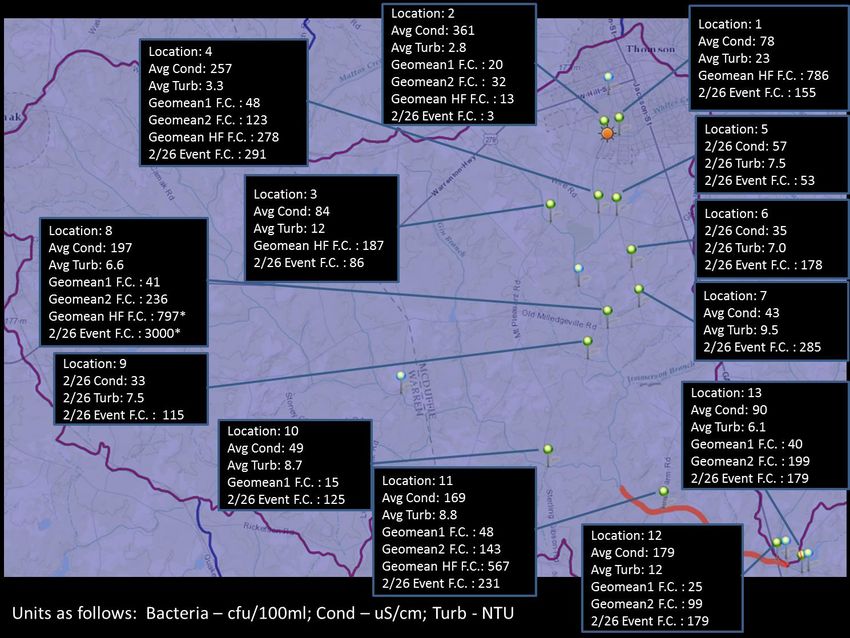
High Spatial Density Sampling (Tributary Level Sampling)
In order to refine both the most probable sources of bacteria and the specific locations of entry into
the water body, Phinizy Center undertook an additional data collection effort of high spatial density
sampling to narrow down the locations where bacteria are entering the stream. Phinizy uses a sampling
strategy that is data intensive, spatially dense, and sensitive to flow and travel time. This approach to
sampling is described more fully in Appendix B. Phinizy Center and City of Thomson collected
approximately 100 samples from 16 different sampling sites. Sites locations were chosen to separately
identify contributions from the various branches of the streams. Data were collected over four months in
a variety of flow conditions. Geomean1 and Geomean2 values represent summer and winter Geomean
calculations based on four samples spread out over a 30-d period. Geomean HF (high flow) or Geomean
LF (low flow) include at least three samples collected during separate sampling events unless otherwise
noted. The Geomean 1 flows were all low flow conditions, while the Geomean 2 conditions included some
higher flow conditions. All means given are geometric means, while event concentrations are single
sample values. The results (Figures 12-13) provide the following information about the sources of bacteria
in this watershed:
1. Geomean values indicate that for the impaired reach, and for many other locations in the
watershed, the stream is likely meeting state standards, at least during lower flow conditions.
2. Due to the enhanced flow and Fecal Indicator Bacteria (FIB) concentrations being consistently
higher in White’s Creek at site 8 than in upstream Brier Creek at site 10, White’s Creek can be
considered the dominant source of FIB loading into the impaired reach of Brier Creek. Also, a
comparison of the FIB concentrations at site 8 and sites 11 and 12 indicates that most of the
loading found in the impaired reach is originating in White’s Creek.
3. Data indicate that the tributaries entering the main channel of White’s Creek below the City of
Thomson are minor contributors of FIB to the stream.
4. Data from sites S5 and 1 indicate that FIB concentrations from the urban area of Thomson are
high during high flow periods. However, they are a minor contributor to overall bacterial load due
to low flow. There may be some opportunity for BMP implementation in the city to reduce these
high flow FIB concentrations from city runoff, but they are a minor impact on the impairment in
Brier Creek.
5. WPCP effluent is not a problem and the large quantity of low FIB concentration water coming
from the WPCP is likely attenuating the concentrations, even during high flow events.
6. The area where most of the increase in FIB concentrations was observed is between sites 2 and 8
on the mainstem of White’s Creek. Below site 8 the concentrations tend to level out or decrease
on average. This means that the majority of the source of the impaired portion of Brier Creek
appears to be limited to about 3 miles of White’s Creek and the adjoining land areas, where sites
2-4 comprise 1 mile and sites 4-8 represent 2 miles. Considering land use within 0.5 miles on both
sides of the stream to be most pertinent, there are just 3 square miles of area to consider out of
a 60 square-mile contributing area. Furthermore, under most conditions, the majority of this
increase is between sites 4 and 8, further reducing the target area.
7. Comparing the high flow FIB concentrations at site 12 (end of the impaired reach) with site S1
(Sweetwater Creek entering Brier Creek below the impaired reach) indicates that the FIB
concentrations are similar or slightly lower on average for Sweetwater Creek.
Page | 198. Comparison of sites S4 and 10 indicate that at least during higher flows the FIB load that was
observed at site 10 is probably coming mostly from Warren County, and not from Gin Branch in
McDuffie County.
9. Low turbidity values, even during high flows, indicate that subsurface flow or direct additions
instead of surface runoff might be more responsible for high concentrations.
10. Also, during the monitoring activities, Phinizy observed several instances of animal carcass
disposal in the stream. These carcasses included a dog and several deer and/or deer gut piles.
There was some indication that these disposal areas were elevating FIB concentrations, but the
effect was difficult to isolate. Regardless, it is safe to say that dumping the intestines of warm
blooded animals directly into the stream is a problem, and steps need to be identified to curtail
this practice. The areas where this was observed included site 8, site 10, and site 11. These were
all bridge crossings, making it likely the disposal occurred from a vehicle. While the dog could
potentially have been injured by a passing car and traveled to the stream, the deer and gut piles
were almost certainly disposed of intentionally by hunters. BMP chosen to address this watershed
should probably address this issue.
Figure 12. Main Data from High Density Sampling in Whites and Brier Creek
Page | 20Figure 13. Additional Supplementary Data from High Density Sampling in Whites and Brier Creek
Estimating Load Reductions
Based on the assessment above, the most likely location of bacteria entry above the impaired
reach is between sites 2 and 8 on the main channel of White’s Creek. This is below the WPCP down
to Old Milledgeville Road. Based on the two geometric means, and a mean of the samples taken during
high flow periods, the added load between sites 2 and 4 results in increases in geomean
concentrations between 28 and 265 mg/L, with higher flows generally resulting in higher numbers.
The added load between sites 4 and 8 results in increases in geomean concentrations between 0 and
519 mg/L. While there are few flow measurements to accompany this data, there are some
approximations that could be used to help estimate the bacterial load. For instance, the WPCP
released an average of 1.9 cfs during these measurements. Also, the Chasman study included data for
the US 17 crossing (site 12) with flows of 5.1 cfs to 11 cfs between December, 1997 and August, 1998
(average of 8 cfs), or 4.0 cfs to 9.9 cfs without the WPCP effluent. Thus, the average flow from the
watershed would be 7 cfs. Flow conditions at the various sites can then be estimated by using this
average flow, the percentage of the overall watershed for each site, and an assumption of equally
Page | 21distributed rainfall. These areas and the associated average flows are listed in Table 7. Note that the
load based on the state standard of 200 cfu/100ml at 8 cfs would be 40 billion cfu/d. If the range of
flows is applied to the state standard the values would be 25 billion cfu/d at lower flows and 55 cfu/d
at higher flows. The same technique can give estimates for the contributions of White’s and upstream
Brier Creek to the impaired reach. Table 7 shows that the upstream portion of Brier contributes more
flow than White’s Creek because these estimates are inclusive of higher flows. At baseflow White’s
Creek contributes more flow than upstream Brier, and even in this inclusive estimate, White’s Creek
contributes a disproportionate amount compared to its drainage area.
Table 8 provides the contributions for the critical areas between sites 2 and 8. Notice the
combined loading of up to 56 billion cfu/d, a value over the state standard for the entire watershed,
in just this three-mile reach. An estimated 77% load reduction from BMP in the critical reach is
necessary to enable the 57% reduction across the watershed as specified in the TMDL. With this 77%
load reduction, we may expect a range of fecal bacteria concentrations in the impaired reach of 8.4-
73 billion cfu/d. Much of this range would fall below the state standard. These data indicated that if
it is necessary to reduce stream concentrations of fecal bacteria to below state standards over the
entire range of flow conditions, reductions must be above the 57% predicted in the TMDL, and will
probably also need to include upstream Brier Creek at some level.
Table 7. Estimated Flows and Bacterial Loading for Various Portions of the Watershed
Site Percent of Estimated Average Estimated Estimated Range of
Watershed Average Flow Flow from Average Flow Fecal Coliform Load
without WPCP WPCP with WPCP (in billion cfu/d)
2 4% 0.3 cfs 1.9 cfs 2.2 cfs 1.1-1.7
4 6.5% 0.5 cfs 1.9 cfs 2.4 cfs 2.8-17
8 15.6% 1.1 cfs 1.9 cfs 3.0 cfs 3.0-58
All White’s 26% 1.8 cfs 1.9 cfs 3.7 cfs 8.1-84
Creek
All 65.6% 4.7 cfs 0.0 cfs 4.7 cfs 1.7-33
Upstream
Brier Creek
Table 8. Estimated Load Contributions for Critical Reaches of the Watershed
Reach Between Estimated Load BMP Effectiveness Estimated Load
Sampling Sites Contribution (percent Reduction
(in billion cfu/d) reduction) (in billion cfu/d)
2-4 1.7-15 77% 1.3-12
4-8 0.2-41 77% 0.1-32
Page | 22Appropriate NPS Management Measures and the Critical Areas where BMPs Need
to be Implemented
Survey of Critical Area by Remote Imagery
Survey was conducted of the critical area between sites 2 and 8 as identified by the fecal bacteria
data. Remote imagery, municipal land records, and driving survey were used to inform an understanding
of the possible best management practices that would have the most benefit to reducing fecal bacteria
load to the stream. This identification process was also informed by the watershed impact schematic
prepared for this watershed. Potential sources are organized in Table 9 by land use on the creek frontage
in the critical area.
Table 9. Land Use and Creek Frontage Area for the Critical Area
Land Use Designation Creek Frontage (ft) % of Total Frontage
Agriculture-Forestry 13,000 48%
Undeveloped 4,600 17%
Agriculture-Livestock 2,700 10%
Rural Residential 2,200 8%
Golf Course 2,000 7%
High Density Residential 1,400 5%
Agriculture-Row Crop 1,400 5%
Forested and Undeveloped Land - Wildlife - Fecal bacteria sources identified for these properties
would include wildlife concentrated near streams as there is known to be a high density in this area and
also improper animal carcass disposal practices related to hunting. However, the animal carcass disposal
issue may be more closely related to stream crossings on roads than the actual hunting areas. Wildlife are
not considered to be a major contributor to the elevated concentrations in this critical area since there
are similar habitats in the rest of the watershed and wildlife contributions should be relatively
homogenous at this scale with similar habitat.
Agriculture - Livestock Waste Management - Survey of the critical area by remote imagery
identified between 5-7 livestock operations in close proximity to the stream. One of these was between
sites 2 and 4, while the remainder were between sites 4 and 8. While it is difficult to determine with much
certainty from remote imagery, it is possible that these operations lack stream buffer and/or waste
management systems. In at least one instance there appears to be ditches or other channels that could
drain directly from feeding areas to the stream. Overall, the survey suggests that there is a good chance
that livestock could be a significant source of fecal bacteria loading to the stream.
Rural Residential & Golf Course - Septic Systems - Survey of the critical area by land records
identified four locations with septic systems representing 4-7 individual systems that could be impacting
the stream. One of these systems is between sites 2 and 4, while the remainder are between sites 4 and
8. Predicted failure rates of septic systems vary by the study. An Ohio study predicted an overall average
failure rate of 31% (Ohio Department of Health, 2013). A Purdue University publication (2005) reports a
25% failure rate. In either case, these percentages indicate that at least one of the identified systems in
the White’s Creek watershed is likely failing and could be a source of fecal bacteria to the stream. In
Page | 23addition to the onsite septic system, the golf course could also be contributing fecal bacteria through
wildlife concentrated near water on the property.
High Density Residential and Row Crops - These land uses probably have less risk of fecal bacteria
sourcing in this case and survey does not reveal any reason to focus on them for BMP.
Best Management Practice Selection
In Figure 14, portions of the watershed impact schematic have been highlighted to denote the
areas identified through survey where BMP are needed to address fecal bacteria loading to streams. Table
9 was also used with the available data to select the best alternatives for this watershed. Tables 10 and
11 provide a catalog of possible BMP choices, along with criteria designed to aid in their selection and
measure their effectiveness if chosen.
Figure 14. Watershed Impact Schematic with critical pathways highlighted.
Page | 24Table 10: Structural BMP options
Effectiveness
Monitoring
Criteria for
Estimating
Metric for
BMP
Best Management Practice Measurement
1. Cattle Exclusion from Streams
and/or Ponds
a. current bacteria concentrations in ponds with cattle access x
b. current bacteria concentrations in stream below these areas x
c. before and after monitoring of pond bacteria concentrations x
d. before and after assessment of riparian zone conditions x
2. Alternative Water Sources for
Cattle
a. hotspots identified in high spatial density monitoring x
b. review of current practices x
c. before and after monitoring downstream x
d. monitoring of stream above and below BMP x
3. Livestock Waste Management
Systems
a. presence of livestock in close proximity to critical stream areas x
b. current bacteria concentrations in stream below these areas x
c. before and after monitoring of pond bacteria concentrations x
d. before and after assessment of riparian zone conditions x
4. Wetlands, Basins, Buffer
Strips, etc.
a. current conditions in the stream x
b. inability to prevent contamination upstream x
c. documented performance and applicability of the systems x
d. before and after monitoring of stream below BMP x
e. monitoring of stream above and below BMP x
5. Pasture Soil/Vegetation
Restoration for Erosion Reduction
a. current TSS/turbidity concentrations x
b. documented or measured sediment bacteria concentrations x
c. TSS/Turbidity measurements in stream before and after x
6. Renovations to WPCP
a. current effluent concentrations x
b. documented performance of potential upgrades x
c. effluent monitoring x
d. before and after monitoring above and below outfall x
7. Septic Tank
Repair/Replacement
a. number of systems in the target area x
b. documentation on likely number failing x
c. proximity of systems to stream and soil classifications x
d. before and after monitoring of stream below repairs x
8. Sanitary Sewer Line
Repair/Replacement
a. frequency of currently reported SSOs x
b. visual survey of stream x
c. Locations of any hotspots in high spatial density monitoring x
d. before and after monitoring of stream below repairs x
e. receiving volume comparison at WPCP x
9. Sanitary Sewer Line Extension
Projects
a. cost/benefit analysis of septic program versus sewer extension x
b. potential magnitude of septic contributions x
c. before and after monitoring of stream below project x
10. Animal Carcass Disposal
Program and Composting Facilities
a. Prevalence of improper disposal practices x
b. potential magnitude of load contributions x
c. Monitoring for decrease in improper animal carcass disposal x
Page | 25Table 11: Non-structural BMP options
Monitoring BMP
Effectiveness
Performance
Criteria for
Estimating
Metric for
Best Management Practice Measurement
1. Fat, Oil, and Grease Program
a. review of current policies and practices x
b. incidence and location of reported SSOs x
c. reported incidence of SSO events before and after x
2. Septic System Inventory
a. number of systems in the target area x
b. documentation on likely number failing x
c. proximity of systems to stream and soil classifications x
d. before and after monitoring downstream x
e. number of systems pumped x
3. Septic System Educational Program
a. number of systems in the target area x
b. documentation on likely number failing x
c. proximity of systems to stream and soil classifications x
d. documentation of effectiveness of educational messaging x
e. before and after monitoring downstream x
f. increase in calls for septic system businesses x
4. Pet Waste Educational Program
a. estimate of households with pets x
b. review of current practices x
c. documentation of effectiveness of educational messaging x
d. before and after monitoring downstream x
5. Livestock Management Educational
Program
a. estimate of households with livestock x
b. review of current practices x
c. documentation of effectiveness of educational messaging x
d. before and after monitoring downstream x
6. Local Adopt-A-Stream Chapter (looking
for failing systems, monitoring for problem
areas, educating others, raising awareness)
a. documentation on effectiveness in other communities x
b. local attitudes toward starting a chapter x
c. before and after monitoring downstream x
d. number of issues identified x
e. amount of monitoring done x
7. Consider Local Ordinances to Regulate
Problem Practices
a. estimate of the magnitude of the contribution to impairment for the issue to be regulated x
b. estimate of the inability of other bmp to be effective in handing the issue x
c. documentation of the effectiveness in other communities x
d. before and after monitoring downstream x
e. number of citations issued x
8. Carcass Disposal Education Program
a. Prevalence of improper disposal practices x
b. potential magnitude of load contributions x
c. Monitoring for decrease in improper animal carcass disposal x
9. Overgrazing Prevention for Erosion
Reduction
a. current TSS/turbidity concentrations x
b. documented or measured sediment bacteria concentrations x
c. TSS/Turbidity measurements in stream before and after x
Page | 26Selected BMP
The BMP in Tables 10 and 11 were evaluated and prioritized based on the following:
1. effectiveness criteria listed in Tables 10 and 11 to the extent it was available,
2. results of land records and remote imaging survey,
3. potential impact based on the percent of creek frontage, and
4. cost of BMP and availability of funding.
The process for evaluating each BMP began with looking at the effectiveness criteria and their valuations
with the data available. BMP that could be beneficial were included. Next, this list was passed through the
survey information to eliminate those BMP with minimal applicability and prioritize those with most
applicability. Finally, the BMP priorities were further refined by the frontage to which they would apply,
the cost, and the availability of funding.
Based on these criteria the following BMP are recommended for this watershed in order of priority:
1. septic tank inventory, along with repair or replacement if necessary,
2. livestock exclusion from streams and ponds that flow to the stream,
3. adequate vegetated buffer strips between critical source areas (golf course, pasture land, septic
drain fields) and the stream (including small tributaries),
4. animal carcass disposal facility and program, including education,
5. pasture restoration and overgrazing prevention educational program, and
6. stormwater constructed wetlands for critical areas.
Description of BMP
Septic tank inventory will start with the County Health Department assessing the age and condition
of the systems in question. Homeowners may be contacted regarding this assessment. Once the condition
has been determined there will be discussion of whether the problems can be required to be fixed by the
homeowner, or whether the city/county will offer some assistance, likely through a grant, to correct any
problems, or update systems that are very old or possibly installed improperly.
Livestock exclusion such as that historically implemented in Georgia through the EQIP program has
traditionally meant fencing livestock out of perennial streams and providing alternative water sources.
This type of BMP has been considered somewhat inaccessible to smaller operations due to the expense
of fencing. However, some studies have indicated that simply providing alternative water sources and
comfort stations can significantly reduce the use of the stream by cattle (Zeckoski et al., 2012). In addition,
ephemeral stream beds or ponds that drain to the stream during rain events may not be included in fence-
out programs. The use of livestock exclusion in this watershed management plan is meant to consider
these solutions as well. If ponds are found with cattle access that have very high concentrations, fencing
or alternative water sources might be considered even if livestock do not currently have access to the
stream itself. Also, implementation of alternative water sources and/or comfort stations without fencing
may be considered as a more economical option for some landowners.
Vegetated buffer strips are a well-studied and highly-used BMP for managing the quality of surface
runoff. Where surface runoff is considered to be a significant source of pollution to streams, placing
vegetated buffers between the stream and the source can create a way to prevent pollution from reaching
the stream. In this case, we are considering implementing wide, 200-ft buffers adjacent to the stream and
any tributaries to reduce the impact of bacteria in surface runoff to the stream. Implementation should
Page | 27be prioritized in areas within the critical area, where known sources are located, and where current stream
bank conditions are not adequately vegetated. In addition to improving the quality of surface runoff,
improved soil conditions may also reduce bacteria in subsurface flow by improving the ecology of the soil
environment. Riparian improvements may also be a general benefit to stream ecology that may result in
reduced bacteria concentrations instream. This is based on the idea that bacteria will be more likely to
thrive in an ecologically diminished conditions without natural streambank vegetation where there is less
competition for resources. Continuing in this idea, this BMP might also include enhancements to instream
ecology directly as a means of increasing competition for resources and decreasing bacteria
concentrations. These enhancements might resemble some done in stream restoration activities.
In addition to educating the public of the dangers of disposing of animal carcasses in streams and
offering better solutions for private disposal, the animal carcass disposal facility and program would
provide a way for hunters or others in possession of an animal carcass to drop off that carcass at an
approved location where it can be disposed of properly. This program might be modeled after several
successful and related projects such as that described in a Virginia Transportation Research Council Report
(2010). Such a program would also serve the community to provide a more cost-effective way to manage
animals killed by vehicles on local roads and likely an overall benefit to public health.
Since bacteria will often associate with soil particles, erosion of sediment from fields can often be tied
to other pollutants, including pathogens. Healthy pastures in terms of soil and grass along with rotational
grazing should reduce the amount of bacteria reaching streams from livestock feces. Where pastures are
in poor condition or are being overgrazed, resulting in erosion, the proposal is to discuss measures with
landowners to improve the quality of pasture and implement rotational grazing to the extent possible.
While there is little literature available to directly support the reduction of fecal coliform from this
management scenario, a study by the Minnesota Land Stewardship Project (LSP, 2001) found that using a
year-round cover scenario (including rotational grazing) reduced sediment transport to nearby streams
by 49% over intensive row-cropping. Since bacteria associate with soil particles, this might be a reasonable
estimate of reduction in fecal bacteria.
Constructed wetlands have proved to be a highly effective means of reducing a wide variety of
pollutants in water, including pathogens. In a case where an even smaller particular area can be identified
within the currently identified critical area as a dominant source, and it is not possible to eliminate the
source, constructed wetlands could be a good way to reduce the level of the bacteria before it reaches
the stream. This can be a much more expensive option, but a variety of constructed wetland designs are
available, and depending on the situation the cost could be reduced below those typically cited.
Estimated reductions from selected BMP
The BMP are meant to address the following three sources of bacteria: livestock waste in runoff,
failing septic systems, and improper animal carcass disposal. It is also understood that there are other
natural background sources including wildlife that make up a portion of the load added between sites 2
and 8. Based on the data available we estimate that these sources (livestock, septic, animal carcass
disposal, and natural background) are responsible for approximately 35%, 35%, 10%, and 20%,
respectively, of the bacterial load added in this reach. This estimate is based on the overall number of
sites pertinent to each source category, the stream frontage represented by each, and the likelihood of
impact from each source. Natural background is assumed to represent 150 cfu/100ml, or 75% of the state
standard. Livestock has been reduced in likelihood compared to the frontage it represents based on the
Page | 28low turbidity values indicating minimal erosion from the land surface. These numbers represent a rough
estimate and might be revised in the future as additional data provides more clarity.
Repair and/or replacement of failing septic systems are likely to provide 99% reduction in the bacterial
load from these sources. BMP intended to reduce livestock runoff might reduce the bacterial load
anywhere from 60% for livestock exclusion, 49% less for pasture restoration and overgrazing education
to 75% for buffer strips (Coyne et al., 1998). Constructed wetlands, have also been used for agricultural
waste with reported efficiencies of between 70% and 99% (Hathaway and Hunt, 2008; Smith et al., 2005).
Of note, cattle exclusion may not necessitate fencing. Studies have shown that providing alternative water
sources and comfort areas for livestock can greatly reduce usage of streams for drinking or comfort
(Osmond et al., 2007; Zeckoski et al., 2012). Results from implementing several of the BMP for this source
should be additive as they address different levels of the pathway to contamination including filtration of
bacteria before it enters the stream, reduction in erosion and transport of bacteria associated with soil
particles, and reduction in the amount of bacteria deposited to the soil. Full implementation of 2-3 of
these BMP would likely result in at least 80-85% reduction in bacterial load.
BMP intended to reduce bacteria from improperly disposed animal carcasses would likely result in
99% reduction to the extent that the facilities are universally utilized for disposal. However, since some
of those who dispose improperly will likely continue to do so, reductions in practice will probably not
reach that level. A survey of Augusta, GA residents related to pet waste disposal indicated that about a
third did not pick up pet waste at all, even though most have heard that it is recommended. Therefore,
perhaps half to a third of those involved in inappropriate disposal of carcasses would be convinced to use
the disposal facility. In this case we might expect a 40% reduction in this source. In summary, Table 12
provides the expected reduction from the selected BMP.
Table 12. Selected BMP Reductions in Fecal Sources
BMP Percent Reduction from Source as Percent of Percent Reduction in
Target Source Total Load Stream
Septic Repair and 99% 35% 35%
Replace
Animal Carcass Disposal 40% 10% 4%
Program and Facility
Pasture Restoration and 49% 35% 17%
Overgrazing Reduction
Livestock Exclusion 60% 35% 21%
Vegetated Buffer Strips 75% 35% 45%
Stormwater 85% 35% 26%
Constructed Wetlands
Page | 29Estimated Amounts of Technical and Financial Assistance, Associated Costs, and
Identification of Sources / Authorities Committed to Implement the Plan
Responsible Parties
The responsible parties regarding the implementation of this watershed management plan include
the combined McDuffie County-City of Thomson government, GAEPD, the McDuffie County Health
Department, and a representative of the Georgia Cooperative Extension and the USDA NRCS program.
The entire impacted stream segment of Brier Creek lies within McDuffie County, GA. GAEPD derives
authority to require activities associated with the TMDL, NPDES, and MS4 programs to move the stream
toward compliance with Georgia water quality standards for fecal coliform bacteria. The McDuffie County
Health Department may also play a role of responsibility as it relates to problems determined to originate
from failing septic systems. If there are new or existing regulations on watershed activities that require
enforcement, these entities would be relevant parties. There are also portions of the upstream watershed
that are contained in Warren County. While this portion of the watershed is not the priority for this plan,
Warren County government may play a role in addressing any sources of impairment that are determined
to originate in that portion of the watershed.
Watershed Advisory Council
This group was directly involved in the development and approval of this watershed management
plan.
1. Lamar Fain Wastewater Director, City of Thomson
2. George Lokey Chair, Water-Sewer Commission, City of Thomson
3. Don Powers Thomson City Administrator
4. Tony Greco Nutter and Associates
5. Vic VanSant Retired GADNR Representative
6. Charlie Newton McDuffie County Commission Chair
7. Kenneth Usry Mayor, City of Thomson
8. Teddy Reese Watershed Landowner
9. Oscar Flite CEO, Phinizy Center for Water Sciences
Page | 30Zoning and Development Agencies
In addition to the McDuffie County Planning Commission, the Central Savannah River (CSR) Resource
Conservation and Development Council may be available to facilitate planning and development needs.
Code and Regulation Evaluation
The City of Thomson-McDuffie County government will hold the authority to make determinations on
implementation of particular codes, regulations, and other recommendations resulting from this plan.
Implementation Resources
The implementation resources for this project consist mainly of those entities or organizations that
are represented in the stakeholder group. They include the McDuffie County Board of Commissioners;
GAEPD; City of Thomson Administrative Office, Water-Sewer Commission, Wastewater Department,
Mayor’s Office; local landowners, the kaolin mining industry; the Phinizy Center for Water Science; Nutter
and Associates Environmental Consultant Firm; McDuffie County Health Department; Thomson Rotary
Club; Augusta-Richmond County Utilities; Columbia County Water Utility; McDuffie County Cooperative
Extension Agent; Richmond County Cooperative Extension Agent; and the Central Savannah River Area
(CSRA) Land Trust. Based on the particular sources that have been identified, the participation of local
landowners will likely be critical to the success of the project in this case. Agricultural agencies will also
likely play a key role, as will the health department and transportation and utilities departments. It may
also be necessary to involve an Engineering firm for the implementation of certain structural BMP.
Funding
The funding for implementation of the Brier Creek Watershed Management Plan will primarily come
through a combination of additional 319(h) Grants and financial resources available through City of
Thomson and McDuffie County, as well as watershed landowners. Estimated cost for the various BMP
proposed are found in Table 13. These costs may not necessarily include all personnel costs associated
with contracted work. The total cost for implementation of all necessary BMP would probably fall within
the range of $200,000-$600,000, but could be more depending on which BMP are selected.
Page | 31Table 13. Cost Estimates for Proposed BMP
BMP Range of Intended Funding Source Notes
Implementation Cost Options
Septic Repair and $2,000-$30,000 one- City of Thomson*/319 $1,000-$15,000 for
Replace time Grant Program/GEFA Loan repair/replace on 4-
7 systems with 25%
failure rate
Animal Carcass $10,000-$12,000 City of Thomson*/319 Assuming free
Disposal Program annually Grant Program/Cost Share compost material,
and Facility with Surrounding Counties free land use, 1 city
employee at 4hrs/d,
100 days per year,
$50/d fuel usage
Pasture Restoration $4,000-$7,500 City of $15/acre for grazing
and Overgrazing Thomson*/Landowners/319 rotation and
Reduction Grant Program $170/acre for critical
area planting from
NRCS (2014), 20-40
acres.
Livestock Exclusion $50,000-$90,000 over 1- City of $12,400/farm
3 years Thomson*/Landowners/319 average cost from
Grant Program/EQIP Zeckoski et al.
Program (2012), 5-7 farms
Vegetated Buffer $350,000-$400,000 over City of $2,550/acre from
Strips 25 years (DNREC) Thomson*/Landowners/319 dnrec.delaware.gov,
Grant Program/Community $270/acre from
$50,000-$100,000 NRCS Development Block Grant NRCS (2014), 150
acres, 200-ft buffer,
3 miles of stream
Stormwater City of Thomson*/319 $26,000-$55,000 per
Constructed $600,000-$1,500,000 Grant Program/ Community acre from USEPA
Wetlands one-time Development Block Grant (1999), 1% of the
livestock watershed
area for wetlands,
~20 acres
* City of Thomson funding might include Community Development Block Grants, reserves from Water and
Sewer Enterprise Fund, or Capital Improvements SPLOST funding.
Page | 32Education and Information Component
See Appendix A for general guidelines that Phinizy Center uses for education components for
watersheds with pathogen impaired streams. Initiatives explained in the guidelines that are key to this
watershed include targeting and micro-targeting for the appropriate audience, creating multisensory
educational experiences, and measuring success. A narrated PowerPoint presentation has been custom
made for this watershed (Appendix D), to be presented at public meetings and/or events. It was presented
during the development of this management plan to an audience of stakeholders. A poster on animal
carcass disposal has been developed as well (Appendix E) and should be used as a part of the animal
carcass disposal educational program. Two public meetings were held on the watershed management
plan (April 1, 2015 and June 10, 2015) which included a description of the current conditions and possible
BMP to reduce the impairment.
Schedule for Expeditious Implementation of BMPs
A timeline for implementation of BMP is shown in the following Gantt chart (Table 14). Note that
not all BMP will likely be implemented for all source types. For instance, while there is only one option for
septic system and animal carcass sources, there are several for livestock runoff. Most likely only one or
two would be implemented. More are included as landowner feedback and buy-in throughout the process
will be important to achieve results, and project management will require more than one possible path
forward to reach the desired outcome.
Page | 33Table 14. Timeline for Implementation of BMP and Achievement of Key Milestones
BMP Milestones Q1 Q2 Q3 Q4 Q1 Q2 Q3 Q4 Q1 Q2 Q3 Q4 Q1 Q2 Q3 Q4
2016 2016 2016 2016 2017 2017 2017 2017 2018 2018 2018 2018 2019 2019 2019 2019 2020 2021 2022 2023
Septic Repair and Replace
identify funding source
identify landowners and determine
if systems need repair
contract and complete repair work
monitor results
Animal Carcass Disposal Facility
identify funding source
secure land and equipment
train personnel
advertise and educate hunting
community
monitor deliveries and compliance
Pasture Restoration and Overgrazing Reduction
identify landowners and assess the
scale of the need
identify funding source
provide educational program to
landowners
provide cost-share for any
restoration or fencing needed
monitor completion and results
Livestock Exclusion
identify landowners and assess the
scale of the need
identify funding source
provide landowner workshops
provide cost-share for fencing,
alternative water sources, or
alternative comfort stations
monitor completion and results
Buffer Strips
identify landowners and assess the
scale of the need
identify funding source
conduct survey, design, and acquire
necessary permits
construction/planting
monitor completion and results
Livestock Waste Management System
identify landowners and assess
interest in program
identify funding source for planning
provide landowner workshops
decide on optimal components for
the system
acquire funding for construction
provide cost-sharing system
monitor completion and results
Stormwater Constructed Wetlands
identify landowners and assess
interest in program
identify funding source
identify contractor
conduct survey, design, and acquire
necessary permits
construction/planting
monitor completion and results
Page | 34You can also read