A TALE OF THREE NEXT GENERATION SEQUENCING PLATFORMS: COMPARISON OF ION TORRENT, PACIFIC BIOSCIENCES AND ILLUMINA MISEQ SEQUENCERS
←
→
Page content transcription
If your browser does not render page correctly, please read the page content below
Quail et al. BMC Genomics 2012, 13:341
http://www.biomedcentral.com/1471-2164/13/341

 RESEARCH ARTICLE                                                                                                                               Open Access

A tale of three next generation sequencing
platforms: comparison of Ion Torrent, Pacific
Biosciences and Illumina MiSeq sequencers
Michael A Quail*, Miriam Smith, Paul Coupland, Thomas D Otto, Simon R Harris, Thomas R Connor, Anna Bertoni,
Harold P Swerdlow and Yong Gu

  Abstract
  Background: Next generation sequencing (NGS) technology has revolutionized genomic and genetic research. The
  pace of change in this area is rapid with three major new sequencing platforms having been released in 2011: Ion
  Torrent’s PGM, Pacific Biosciences’ RS and the Illumina MiSeq. Here we compare the results obtained with those
  platforms to the performance of the Illumina HiSeq, the current market leader. In order to compare these platforms,
  and get sufficient coverage depth to allow meaningful analysis, we have sequenced a set of 4 microbial genomes
  with mean GC content ranging from 19.3 to 67.7%. Together, these represent a comprehensive range of genome
  content. Here we report our analysis of that sequence data in terms of coverage distribution, bias, GC distribution,
  variant detection and accuracy.
  Results: Sequence generated by Ion Torrent, MiSeq and Pacific Biosciences technologies displays near perfect
  coverage behaviour on GC-rich, neutral and moderately AT-rich genomes, but a profound bias was observed upon
  sequencing the extremely AT-rich genome of Plasmodium falciparum on the PGM, resulting in no coverage for
  approximately 30% of the genome. We analysed the ability to call variants from each platform and found that we
  could call slightly more variants from Ion Torrent data compared to MiSeq data, but at the expense of a higher
  false positive rate. Variant calling from Pacific Biosciences data was possible but higher coverage depth was
  required. Context specific errors were observed in both PGM and MiSeq data, but not in that from the Pacific
  Biosciences platform.
  Conclusions: All three fast turnaround sequencers evaluated here were able to generate usable sequence.
  However there are key differences between the quality of that data and the applications it will support.
  Keywords: Next-generation sequencing, Ion torrent, Illumina, Pacific biosciences, MiSeq, PGM, SMRT, Bias, Genome
  coverage, GC-rich, AT-rich

Background                                                                            fragments with specific adapter sequences are linked to
Sequencing technology is evolving rapidly and during                                  and then clonally amplified by emulsion PCR on the sur-
the course of 2011 several new sequencing platforms                                   face of 3-micron diameter beads, known as Ion Sphere
were released. Of note were the Ion Torrent Personal                                  Particles. The templated beads are loaded into proton-
Genome Machine (PGM) and the Pacific Biosciences                                      sensing wells that are fabricated on a silicon wafer and se-
(PacBio) RS that are based on revolutionary new                                       quencing is primed from a specific location in the adapter
technologies.                                                                         sequence. As sequencing proceeds, each of the four bases
  The Ion Torrent PGM “harnesses the power of semi-                                   is introduced sequentially. If bases of that type are incor-
conductor technology” detecting the protons released as                               porated, protons are released and a signal is detected pro-
nucleotides are incorporated during synthesis [1]. DNA                                portional to the number of bases incorporated.
                                                                                         PacBio have developed a process enabling single mol-
* Correspondence: mq1@sanger.ac.uk
                                                                                      ecule real time (SMRT) sequencing [2]. Here, DNA poly-
Wellcome Trust Sanger Institute, Hinxton, UK                                          merase molecules, bound to a DNA template, are
                                        © 2012 Quail et al.; licensee BioMed Central Ltd. This is an Open Access article distributed under the terms of the Creative
                                        Commons Attribution License (http://creativecommons.org/licenses/by/2.0), which permits unrestricted use, distribution, and
                                        reproduction in any medium, provided the original work is properly cited.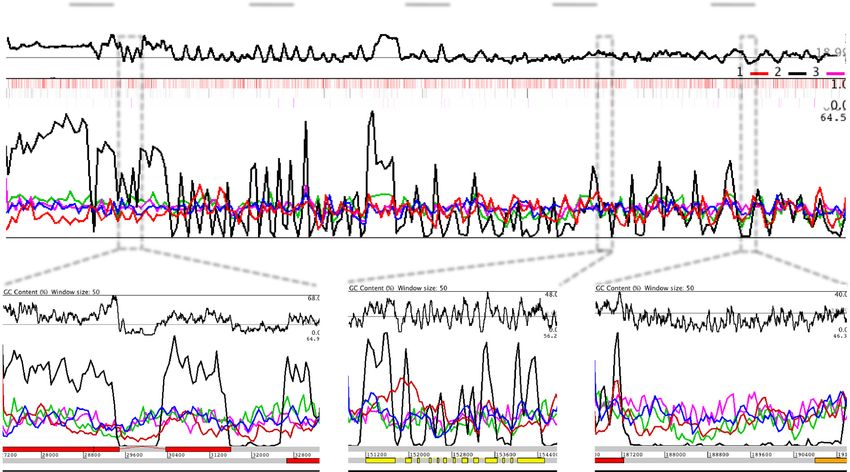
Quail et al. BMC Genomics 2012, 13:341                                                                                                            Page 2 of 13
http://www.biomedcentral.com/1471-2164/13/341

attached to the bottom of 50 nm-wide wells termed                                Pullorum (52% GC), Staphylococcus aureus (33% GC)
zero-mode waveguides (ZMWs). Each polymerase is                                  and Plasmodium falciparum (19.3% GC, with some
allowed to carry out second strand DNA synthesis in the                          regions close to 0% GC content). We routinely use these
presence of γ-phosphate fluorescently labeled nucleo-                            to test new sequencing technologies, as together their
tides. The width of the ZMW is such that light cannot                            sequences represent the range of genomic landscapes
propagate through the waveguide, but energy can pene-                            that one might encounter.
trate a short distance and excite the fluorophores                                  PCR-free [4] Illumina libraries were uniquely bar-
attached to those nucleotides that are in the vicinity of                        coded, pooled and run on a MiSeq flowcell with paired
the polymerase at the bottom of the well. As each base                           150 base reads plus a 6-base index read and also on a
is incorporated, a distinctive pulse of fluorescence is                          single lane of an Illumina HiSeq with paired 75 base
detected in real time.                                                           reads plus an 8-base index read (Additional file 1: Table
  In recent years, the sequencing industry has been                              S1). Illumina libraries prepared with amplification using
dominated by Illumina, who have adopted a sequencing-                            Kapa HiFi polymerase [5] were run on a single lane of
by-synthesis approach [3], utilizing fluorescently labeled                       an Illumina GA IIx with paired 76 base reads plus an 8-
reversible-terminator nucleotides, on clonally amplified                         base index read and on a MiSeq flowcell with paired 150
DNA templates immobilized to an acrylamide coating                               base reads plus a 6-base index read. PCR-free libraries
on the surface of a glass flowcell. The Illumina Genome                          represent an improvement over the standard Illumina li-
Analyzer and more recently the HiSeq 2000 have set the                           brary preparation method as they result in more even
standard for high throughput massively parallel sequen-                          sequence coverage [4] and are included here alongside
cing, but in 2011 Illumina released a lower throughput                           libraries prepared with PCR in order to enable compari-
fast-turnaround instrument, the MiSeq, aimed at smaller                          son to PacBio which has an amplification free workflow.
laboratories and the clinical diagnostic market.                                    Ion Torrent libraries were each run on a single 316
  Here we evaluate the output of these new sequencing                            chip for a 65 cycles generating mean read lengths of
platforms and compare them with the data obtained                                112–124 bases (Additional file 1: Table S2). Standard
from the Illumina HiSeq and GAIIx platforms. Table 1                             PacBio libraries, with an average of 2 kb inserts, were
gives a summary of the technical specifications of each                          run individually over multiple SMRT cells, each using
of these instruments.                                                            C1 chemistry, and providing ≥20x sequence coverage
                                                                                 data for each genome (Additional file 1: Table S3).
Results                                                                             The datasets generated were mapped to the corre-
Sequence generation                                                              sponding reference genome as described in Methods.
Platform specific libraries were constructed for a set of                        For a fair comparison, all sequence datasets were ran-
microbial genomes Bordetella pertussis (67.7% GC, with                           domly down-sampled (normalized) to contain reads
some regions in excess of 90% GC content), Salmonella                            representing a 15x average genome coverage.

Table 1 Technical specifications of Next Generation Sequencing platforms utilised in this study
Platform                        Illumina MiSeq       Ion Torrent PGM                 PacBio RS                    Illumina GAIIx        Illumina HiSeq 2000
Instrument Cost*                $128 K               $80 K**                         $695 K                       $256 K                $654 K
Sequence yield per run          1.5-2Gb              20-50 Mb on 314 chip,           100 Mb                       30Gb                  600Gb
                                                     100-200 Mb on 316 chip,
                                                     1Gb on 318 chip
Sequencing cost per Gb*         $502                 $1000 (318 chip)                $2000                        $148                  $41
Run Time                        27 hours***          2 hours                         2 hours                      10 days               11 days
Reported Accuracy               Mostly > Q30         Mostly Q20                       Q30          Mostly > Q30
Observed Raw Error Rate         0.80 %               1.71 %                          12.86 %                      0.76 %                0.26 %
Read length                     up to 150 bases      ~200 bases                      Average 1500 bases****       up to 150 bases       up to 150 bases
                                                                                     (C1 chemistry)
Paired reads                    Yes                  Yes                             No                           Yes                   Yes
Insert size                     up to 700 bases      up to 250 bases                 up to 10 kb                  up to 700 bases       up to 700 bases
Typical DNA requirements        50-1000 ng           100-1000 ng                     ~1 μg                        50-1000 ng            50-1000 ng
* All cost calculations are based on list price quotations obtained from the manufacturer and assume expected sequence yield stated.
** System price including PGM, server, OneTouch and OneTouch ES.
*** Includes two hours of cluster generation.
**** Mean mapped read length includes adapter and reverse strand sequences. Subread lengths, i.e. the individual stretches of sequence originating from the
sequenced fragment, are significantly shorter.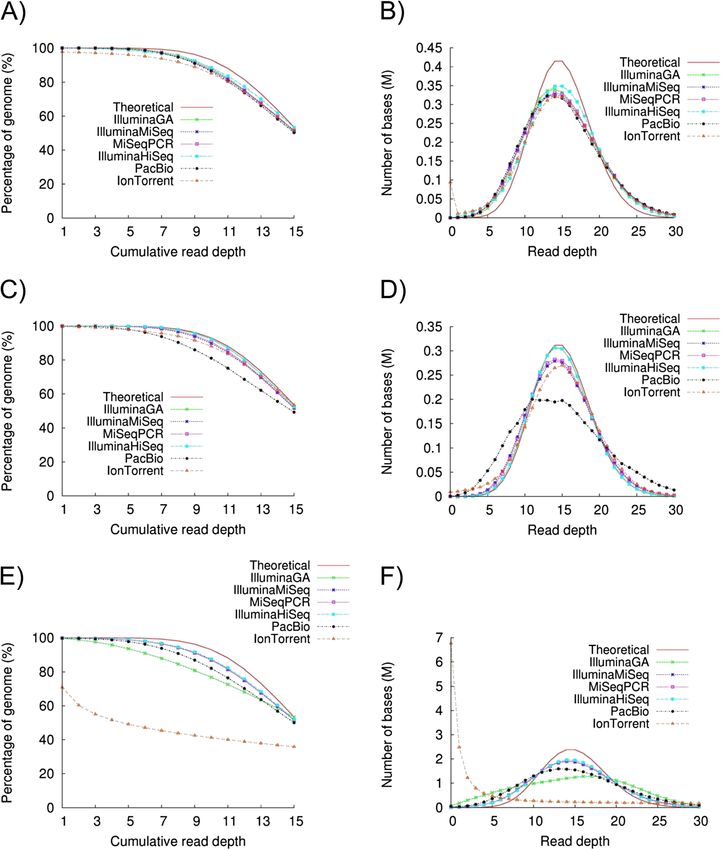
Quail et al. BMC Genomics 2012, 13:341                                                                      Page 3 of 13
http://www.biomedcentral.com/1471-2164/13/341

Workflow                                                        The most dramatic observation from our results was
All the platforms have library preparation protocols that     the severe bias seen when sequencing the extremely AT-
involve fragmenting genomic DNA and attaching spe-            rich genome of P. falciparum on the PGM. The result of
cific adapter sequences. Typically this takes somewhere       this was deeper than expected coverage of the GC-rich
between 4 and 8 hours for one sample. In addition, the        var and subtelomeric regions and poor coverage within
Ion Torrent template preparation has a two hour emul-         introns and AT-rich exonic segments (Figure 2), with ap-
sion PCR and a template bead enrichment step.                 proximately 30% of the genome having no sequence
  In the battle to become the platform with the fastest       coverage whatsoever. This bias was observed with librar-
turnaround time, all the manufacturers are seeking to         ies prepared using both enzymatic and physical shearing
streamline library preparation protocols. Life Technolo-      (Additional file 2: Figure S1).
gies have developed the Ion Xpress Fragment Library Kit         In a recent study to investigate the optimal enzyme
that has an enzymatic “Fragmentase” formulation for           for next generation library preparation [5], we found
shearing starting DNA, thereby avoiding the labour of         that the enzyme used for fragment amplification during
physical shearing and potentially enabling complete li-       next generation library preparation can have a signifi-
brary automation. We tested this kit on our four gen-         cant influence on bias. We found the enzyme Kapa
omes alongside the standard library kit with physical         HiFi amplifies fragments with the least bias, giving
shearing and found both to give equal genomic repre-          even coverage, close to that obtained without amplifi-
sentation (see Additional file 2: Figure S1 for results       cation. Since the PGM has two amplification steps,
obtained with P. falciparum). Illumina purchased Epi-         one during library preparation and the other emulsion
centre in order to package the Nextera technology with        PCR (emPCR) for template amplification, we reasoned
the MiSeq. Nextera uses a transposon to shear genomic         that this might be the cause of the observed bias. Sub-
DNA and simultaneously introduce adapter sequences            stituting the supplied Platinum Taq enzyme with Kapa
[6]. The Nextera method can produce sequencing ready          HiFi for the nick translation and amplification step
DNA in around 90 minutes and gave us remarkably even          during library preparation profoundly reduced the
genome representation (Additional file 2: Figures S2 and      observed bias (Figure 3). We were unable to further
Additional file 2: Figure S3) with B. pertussis and S. aur-   improve this by use of Kapa HiFi for the emPCR
eus, but produced a very biased sequence dataset from         (results not shown).
the extremely AT-rich P. falciparum genome.                     Of the four genomes sequenced, the P. falciparum
                                                              genome is the largest and most complex and contains a
Genome coverage and GC bias                                   significant quantity of repetitive sequences. We used P.
To analyse the uniformity of coverage across the genome       falciparum to analyse the effect of read length versus
we tabulated the depth of coverage seen at each position      mappability. As the PacBio pipeline doesn’t generate a
of the genome. We utilized the coverage plots described       mapping quality value and to ensure a fair comparison,
by Lam et al., [7] that depict; the percentage of the gen-    we remapped the reads of all technologies using the k-
ome that is covered at a given read depth, and genome         mer based mapper, SMALT [9], and then analysed cover-
coverage at different read depths respectively, for each      age across the P. falciparum genome (Additional file 3:
dataset (Figure 1) alongside the ideal theoretical cover-     Table S4). This data confirms the poor performance of
age that would be predicted based on Poisson behaviour.       Ion Torrent on the P. falciparum genome, as only 65%
   In the context of the GC-rich genome of B. pertussis,      of the genome is covered with high quality (>Q20) reads
most platforms gave similar uniformity of sequence            compared to ~98-99% for the other platforms. Whilst
coverage, with the Ion Torrent data giving slightly more      the mean mapped readlength of the PacBio reads with
uneven coverage. In the S. aureus genome the PGM              this genome was 1336 bases, average subread length (the
performed better. The PGM gave very biased coverage           length of sequence covering the genome) is significantly
when sequencing the extremely AT-rich P. falciparum           less (645 bases). The short average subread length is due
genome (Figure 1). This affect was also evident when          to preferential loading of short fragment constructs in
we plotted coverage depth against GC content (Additional      the library and the effect of lag time (non-imaged bases)
file 2: Figure S4). Whilst the PacBio platform gave a         after sequencing initiation, the latter resulting in
sequence dataset with quite even coverage on GC and           sequences near the beginning of library constructs not
extremely AT-rich contexts, it did demonstrate slight but     being reported.
noticeable unevenness of coverage and bias towards GC-          As the median length of the PacBio subreads for this
rich sequences with the S. aureus genome. With the GC-        data set are just 600 bases, we compared their coverage
neutral S. Pullorum genome all platforms gave equal           with an equivalent amount of in silico filtered reads of
coverage with unbiased GC representation (data not            >620 bases. This led to a very small decrease in the per-
shown).                                                       centage of bases covered. Using paired reads on the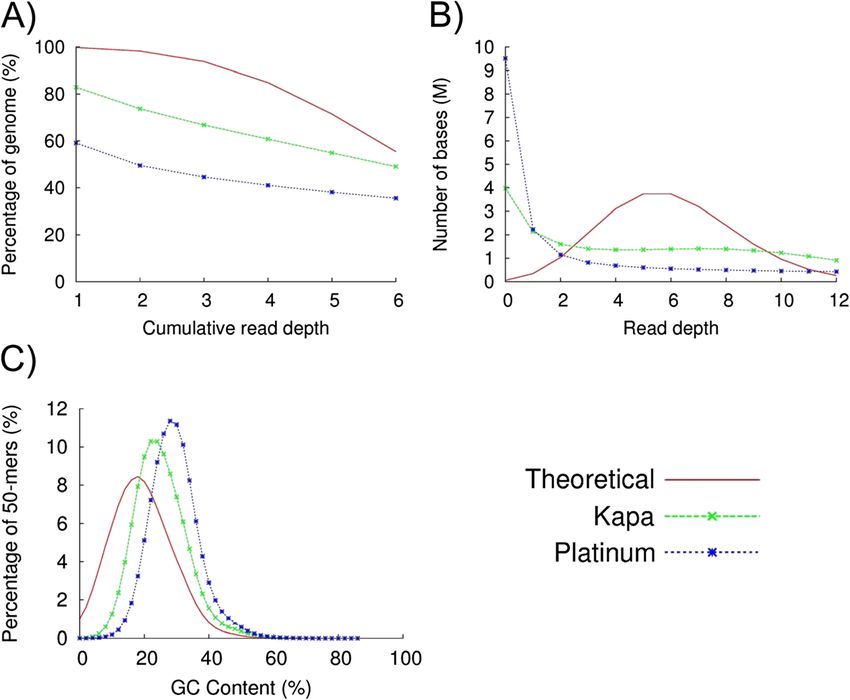
Quail et al. BMC Genomics 2012, 13:341                                                                                             Page 4 of 13
http://www.biomedcentral.com/1471-2164/13/341

 Figure 1 Genome coverage plots for 15x depth randomly downsampled sequence coverage from the sequencing platforms tested.
 A) The percentage of the B. pertussis genome covered at different read depths; B) The number of bases covered at different depths for B.
 pertussis; C) The percentage of the S. aureus genome covered at different read depths; D) The number of bases covered at different depths for
 S. aureus; E) The percentage of the P. falciparum genome covered at different read depths; and F) The number of bases covered at different
 depths for P. falciparum.

Illumina MiSeq, however, gave a strong positive effect,                  after long (> 20-base) homopolymer tracts [10]
with 1.1% more coverage being observed from paired-                      (Figure 4A).
end reads compared to single-end reads.                                    Also evident in the MiSeq data, were strand errors due
                                                                         to the GGC motif [11]. Following the finding that the
Error rates                                                              motif GGC generates strand-specific errors, we analyzed
We observed error rates of below 0.4% for the Illumina                   this phenomenon in the MiSeq data for P. falciparum
platforms, 1.78% for Ion Torrent and 13% for PacBio se-                  (Additional file 4: Table S5). We observed that the error
quencing (Table 1). The number of error-free reads,                      is mostly generated by GC-rich motifs, principally
without a single mismatch or indel, was 76.45%, 15.92%                   GGCGGG. We found no evidence for an error if the
and 0% for, MiSeq, Ion Torrent and PacBio, respectively.                 triplet after the GGC is AT-rich. Other MiSeq datasets
The error heatmap in Figure 2A shows that the PacBio                     also showed this artifact (data not shown). In addition to
errors are distributed evenly over the chromosome. We                    this being a strand-specific issue, it appears that this is a
manually inspected the regions where Ion Torrent and                     read-specific phenomenon. Whilst there is a quality drop
Illumina generated more errors. Illumina produced errors                 in the first read following these GC-rich motifs, there is
Quail et al. BMC Genomics 2012, 13:341 Page 5 of 13
http://www.biomedcentral.com/1471-2164/13/341
A) PacBio PGM GAII HISeq MIseq
50.1
%GC
7.5
Coverage Depth
B) C) D)
%GC
Coverage Depth
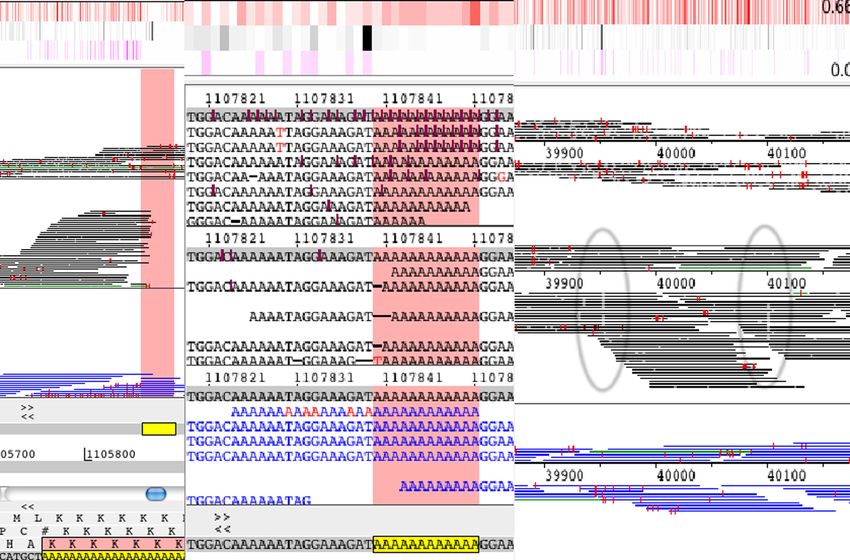
Figure 2 Artemis genome browser [8] screenshots illustrating the variation in sequence coverage of a selected region of P. falciparum
chromosome 11, with 15x depth of randomly normalized sequence from the platforms tested. In each window, the top graph shows the
percentage GC content at each position, with the numbers on the right denoting the minimum, average and maximum values. The middle
graph in each window is a coverage plot for the dataset from each instrument; the colour code is shown above graph a). Each of the middle
graphs shows the depth of reads mapped at each position, and below that in B-D are the coordinates of the selected region in the genome with
gene models on the (+) strand above and (−) strand below. A) View of the first 200 kb of chromosome 11. Graphs are smoothed with window
size of 1000. A heatmap of the errors, normalized by the amount of mapping reads is included just below the GC content graph (PacBio top line,
PGM middle and MiSeq bottom). B) Coverage over region of extreme GC content, ranging from 70% to 0%. C) Coverage over the gene
PF3D7_1103500. D) Example of intergenic region between genes PF3D7_1104200 and PF3D7_1104300. The window size of B, C and D is 50 bp.
a striking loss of quality in read 2, where the reads have compared the SNPs called against those obtained by
nearly half the mean quality value compared to the read aligning the reference sequences of the two genomes
1 reads for GC-rich triplets that follow the GGC motif. (Figure 5 and Additional file 5: Table S6). In order to
We could observe this low quality in read 2 in all our create a fair comparison we initially used the same ran-
analysed Illumina lanes. For AT-rich motifs the ratio is domly normalized 15x datasets used in our analysis of
nearly 1 (1.03). genome coverage, which according to the literature [3]
Ion Torrent didn’t generate reads at all for long (> 14- is sufficient to accurately call heterozygous variants but
base) homopolymer tracts, and could not predict the found that that was insufficient for the PacBio datasets
correct number of bases in homopolymers >8 bases where a 190x coverage was used.
long. Very few errors were observed following short Overall the rate of SNP calling was slightly higher for
homopolymer stretches in the MiSeq data (Figure 4B). the Ion Torrent data than for Illumina data (chi square
Additionally, we observed strand-specific errors in the p value 3.15E-08), with approximately 82% of SNPs
PGM data but were unable to associate these with any being correctly called for the PGM and 68-76% of the
obvious motif (Figure 4C). SNPs being detected from the Illumina data (Figure 5A).
Conversely, the rate of false SNP calls was higher with
SNP calling Ion Torrent data than for Illumina data (Figure 5B). SNP
In order to determine whether or not the higher error calling from PacBio data proved more problematic, as
rates observed with the PGM and PacBio affected their existing tools are optimized for short-read data and not
ability to call SNPs, we aligned the reads from the S. for high error-rate long-read data. We were reliant on
aureus genome, for which all platforms gave good se- SNPs called by the SMRT portal pipeline for this ana-
quence representation, against the reference genome of lysis. Our results showed that SNP detection from Pac-
the closely related strain USA300_FPR3757 [12], and Bio data was not as accurate as that from the otherQuail et al. BMC Genomics 2012, 13:341 Page 6 of 13
http://www.biomedcentral.com/1471-2164/13/341
Figure 3 The effect of substituting Platinum HiFi PCR supermix with Kapa HiFi in the PGM library prep amplification step.
A) The percentage of the P. falciparum genome covered at different read depths. The blue line shows the data obtained with the recommended
Platinum enzyme and the green line with Kapa HiFi. The red line depicts ideal coverage behavior. B) The number of bases covered at different
depths. C) Sequence representation vs. GC-content plots.
platforms, with overall only 71% of SNPs being detected reasons. To obtain maximum throughput, users must
and 2876 SNPs being falsely called (Additional file 5: consider the whole process, potentially investing in an-
Table S6). cillary equipment and robotics to create an automated
Amongst the datasets obtained from the Illumina pipeline for the preparation of large numbers of samples.
sequencers, the percentage of correct SNP calls was To process large numbers of samples quickly, a facility’s
higher for the MiSeq (76%) than the GAIIx (70%) instrument base must be large enough to avoid sample
data than for that obtained from the HiSeq (69%), backlogs. With this in mind, manufacturers are seeking
despite the same libraries being run on both MiSeq to develop more streamlined sample-prep protocols that
and HiSeq. The use of Nextera library preparation will facilitate timely sample loading. Here we have tested
gave similar results with 76% of SNPs being correctly two such developments: enzymatic fragmentation and
called. It should be noted that we found the inbuilt the Nextera technique. We conclude that these methods
automatic variant calling inadequate on both MiSeq can be very useful, but users must carefully evaluate the
and PGM, with MiSeq reporter calling just 6.6% of methods they use for their particular applications and
variants and Torrent suite 1.5.1 calling only 1.4% of for use with genomes of extreme base composition to
variants. avoid bias.
Whilst the data generated using the Ion Torrent PGM
Discussion platform has a higher raw error rate (~1.8%) than Illu-
A key feature of these new platforms is their speed. De- mina data (Quail et al. BMC Genomics 2012, 13:341 Page 7 of 13
http://www.biomedcentral.com/1471-2164/13/341
A) B) C)
P
I
M
Figure 4 Illustration of platform-specific errors. The panels show Artemis BAM views with reads (horizontal bars) mapping to defined regions
of chromosome 11 of P. falciparum from PacBio (P; top), Ion Torrent (I; middle) and MiSeq (M; bottom). Red vertical dashes are 1 base differences
to the reference and white points are indels. A) Illustration of errors in Illumina data after a long homopolymer tract. Ion torrent data has a drop
of coverage and multiple indels are visible in PacBio data. B) Example of errors associated with short homopolymer tracts. Multiple insertions are
visible in the PacBio Data, deletions are observed in the PGM data and the MiSeq sequences read generally correct through the homopolymer
tract. C) Example of strand specific deletions (red circles) observed in Ion Torrent data.
Interestingly, the mappability didn’t increase signifi- employed to make the predictions will change the results
cantly with longer reads, although a beneficial effect was substantially. As such, the rate of both true SNP and
obtained from having mate-pair information. Current false positive calling provided here are purely indicative
PacBio protocols favor the preferential loading of smaller and results obtained with each sequencing platform will
constructs, resulting in average subread lengths that are vary. For any particular application using a specific se-
significantly shorter than the often quoted average read quencing method, optimisation of the SNP- and indel-
lengths. Further development is therefore required to calling algorithm would always be recommended.
avoid having excess short fragments and adapter-dimer We sequence many isolates of the malaria parasite P.
constructs in the library and reducing their loading effi- falciparum as it represents a significant health issue in
ciency into the ZMWs. developing countries; this organism leads to several mil-
Whilst one would normally use higher coverage than lion deaths per annum. There are several active large se-
used here for confident SNP detection (i.e., 30-40x quencing programs (e.g. MalariaGEN [13]) that are
depth), we were limited to 15x depth due to the yield of currently aiming to sequence thousands of clinical mal-
some of the platforms. Nonetheless, at least for the hap- aria samples. As the malaria genome has a GC content
loid genome, S. aureus, 15x coverage should be a reason- of only 19.4% [14], we use it as one of our test genomes,
able quantity for SNP detection and even in the human representing a significant challenge to most sequencing
genome, 15x coverage has been shown to be sufficient to technologies. Based on the present study, use of Illumina
accurately call heterozygous SNPs [3]. sequencing technology with libraries prepared without
Variant calling is a highly subjective process; the par- amplification [4] leads to the least biased coverage across
ticular software chosen as well as the specific parameters this genome. Ion Torrent semiconductor sequencing isQuail et al. BMC Genomics 2012, 13:341 Page 8 of 13
http://www.biomedcentral.com/1471-2164/13/341
A) Percentage of correctly called true SNPs
90.00
80.00
70.00
60.00
50.00
40.00
30.00
20.00
10.00
0.00
Ion Torrent Ion Torrent, GAII MiSeq HiSeq Nextera library PacBio 190x
SAMtools on MiSeq
All SNPs Excluding mobile elements and indels
B) Number of incorrect SNP calls
3500
3000
2500
2000
1500
1000
500
0
Ion Torrent Ion Torrent, GAII MiSeq HiSeq MiSeq_Nextera PacBio 190x
Samtools
Total false positives Excluding mobile elements and indels
Figure 5 Accuracy of SNP detection from the S. aureus datasets generated from each platform, compared against the reference
genome of its close relative S. aureus USA300_FPR3757. Both the Torrent server variant calling pipeline and SAMtools were used for Ion
Torrent data; SAMtools was used for Illumina data and SMRT portal pipeline for PacBio data. A) The percentage of SNPs detected using each
platform overall (blue bar), and outside of repeats, indels and mobile genetic elements (red bar). B) The number of incorrect SNP calls for each
platform overall (blue bar), and outside of repeats, indels and mobile genetic elements (red bar).
not recommended for sequencing of extremely AT-rich semiconductor sequencing. Also, the Ion Torrent plat-
genomes, due to the severe coverage bias observed. This form currently employs fragment lengths of 100 or 200
is likely to be an artifact introduced during amplification. bases; without a mate-pair type library protocol, these
Therefore, avoidance of library amplification and/or insert sizes are too short perhaps to enable accurate
emPCR, or use of more faithful enzymes during emPCR, de novo assemblies such as that demonstrated using
may eliminate the bias. ALLPATHS-LG for mammalian genomes using Illu-
Illumina sequencing has matured to the point where mina data [25]. Conversely, Illumina sequencing on
a great many applications [15-24] have been developed the HiSeq or MiSeq instruments requires heteroge-
on the platform. Since the PGM is also a massively neous base composition across the population of
parallel short-read technology, many of those applica- imaged clusters [26]. In order to sequence monotem-
tions should translate well and be equally practicable. plates (where most sequenceable fragments have
There are a few obvious exceptions; techniques exactly the same sequence), it is often necessary to
involving manipulations on the flow cell such as FRT- significantly dilute or mix the sample with a complex
seq [21] and OS-Seq [22] will be impossible using genomic library to enable registration of clusters.Quail et al. BMC Genomics 2012, 13:341 Page 9 of 13
http://www.biomedcentral.com/1471-2164/13/341
Semiconductor sequencing does not suffer this (Covaris Inc.) with the following settings: Duty cycle 20,
problem. Intensity 5, cycles/burst 200, 45 seconds.
The DNA-input requirements of PacBio can be pro- Sheared DNA was purified by binding to an equal vol-
hibitory. Illumina and PGM library preparation can be ume of Ampure beads (Beckman Coulter Inc.) and
performed with far less DNA; the standard PGM eluted in 32 μl of 10 mM Tris–HCl, pH8.5. End-repair,
IonEXpress library prep requires just 100 ng DNA and A-tailing and paired-end adapter ligation were per-
Illumina sequencing has been performed from sub- formed (as per the protocols supplied by Illumina, Inc.
nanogram quantities [27]. The yield, sample-input using reagents from New England Biolabs- NEB) with
requirements and amplification-free library prep of purification using a 1.5:1 ratio of standard Ampure to
PacBio potentially make it unsuitable for counting sample between each enzymatic reaction. PCR-free li-
applications and for applications involving significant braries were constructed according to Kozarewa et al.
prior enrichment such as exome sequencing [15] and [4]. After ligation, excess adapters and adapter dimers
ChIP-seq [18]. The PacBio platform, by virtue of its were removed using two Ampure clean-ups, first with a
long read lengths, should however have application in 1.5:1 ratio of standard Ampure to sample, followed by a
de novo sequencing and may also benefit analysis of 0.7:1 ratio of Ampure beads. PCR free libraries were
linkage of alternative splicing and in of variants across then used as is. Libraries prepared with amplification
long amplicons. Furthermore, the potential for direct were diluted to 2 ng/μl and 1 μl was used as template
detection of epigenetic modifications has been demon- for PCR amplification with Kapa HiFi [5] 2 x mastermix
strated [28]. (KK2601, Kapa Biosystems). PCR reactions were per-
Finally, it should be noted that thus study represents a formed in 0.2 μl thin-wall microtubes on an MJ tetrad
point in time, utilising kits and reagents available up thermal cycler with the following conditions: 94°C −2
until the end of 2011. Ion Torrent and Pacific Bios- minutes; 14 cycles of 94°C −20 seconds, 65°C −30
ciences are relatively new sequencing technologies that seconds, 72°C −30 seconds; 72°C - 3 minutes with
have not had time to mature in the same way that the 200nM final concentration of standard PE1.0 and modi-
Illumina technology has. We anticipate that whilst some fied multiplexing PE2.0 primers [5].
of the issues identified may be intrinsic, others will be After PCR, excess primers and any primer dimer were
resolved as these platforms evolve. removed using two Ampure clean-ups, with a 1.5:1 ratio
of Ampure then with a 0.8:1 ratio of Ampure beads. All
Conclusion libraries were quantified by real-time PCR using the
The limited yield and high cost per base currently pro- SYBR Fast Illumina Library Quantification Kit (Kapa
hibit large scale sequencing projects on the Pacific Bios- Biosystems) and pooled so as to give equal genome
ciences instrument. The PGM and MiSeq are quite coverage from each library.
closely matched in terms of utility and ease of workflow.
The decision on whether to purchase one or the other Illumina sequencing
will hinge on available resources, existing infrastructure Each multiplexed library pool was sequenced on: i) an
and personal experience, available finances and the type Illumina GAIIx instrument for 76 cycles from each end
of applications being considered. plus an 8 base-index sequence read, using version 2
chemistry, ii) an Illumina MiSeq for 151 cycles from
each end plus an 8 base-index sequence read, iii) an Illu-
Methods mina HiSeq 2000 instrument for 75 cycles from each
Genomic DNA end plus an 8 base-index sequence read, using version 3
P. falciparum 3D7 genomic DNA was a gift from Prof chemistry. Summary sequencing statistics are given in
Chris Newbold, University of Oxford, UK. Bordetella Additional file 1: Table S1. All runs had error rates, and
pertussis ST24 genomic DNA was a gift from Craig associated sequence quality, that surpassed the mini-
Cummings, Stanford University School of Medicine, CA. mum Illumina specifications.
Staphylococcus aureus TW20 genomic DNA was a gift
from Jodi Lindsay, St George’s Hospital Medical School, Ion torrent library preparation sequencing
University of London. S. Pullorum S449/87 genomic For the B. pertussis, S. aureus and P. falciparum gen-
DNA was prepared at the Wellcome Trust Sanger Insti- omes, library preparation was carried out using the Ion
tute, UK. Xpress™ Fragment Library Kit, with 100 ng of DNA.
Adapter ligation, size selection, nick repair and amplifi-
Illumina library construction cation (8 cycles for B. pertussis and S. aureus, 6 cycles
DNA (0.5 μg in 120 μl of 10 mM Tris–HCl pH8.5) was for P. falciparum) were performed as described in the
sheared in an AFA microtube using a Covaris S2 device Ion Torrent protocol associated with the kit (IonQuail et al. BMC Genomics 2012, 13:341 Page 10 of 13
http://www.biomedcentral.com/1471-2164/13/341
Xpress™ Fragment Library Kit - Part Number 4469142 (Part Number 001-322-716) and incubated for 15 min at
Rev. B). For the S. Pullorum genome, library preparation 25°C prior to another 0.6X AMPure XP clean up, eluting
was undertaken using the Ion Fragment Library Kit with in 30 μl EB. Blunt adapters were ligated before exonucle-
5 μg of DNA. The DNA was fragmented by adaptive fo- ase incubation was carried out in order to remove all
cused acoustics using a Covaris S2 (Covaris Inc.) with un-ligated adapters and DNA. Finally, two 0.6X AMPure
AFA tubes as described in the protocol (Part Number bead clean ups are performed - removing enzymes and
4467320 Rev. A). End repair, adapter ligation, nick repair adapter dimers – the final “SMRT bells” being eluted in
and amplification (8 cycles) were also performed as 10 μl EB. Final quantification was carried out on an Agi-
described in the Ion Torrent protocol. Size selection was lent 2100 Bioanalyzer with 1 μl of library.
performed using the LabChip XT (Caliper LifeSciences) Using the SMRT bell concentration (ng/μl) and insert
and the LabChip XT DNA750 Assay Kit (Caliper Life- size previously determined, the PacBio-provided calcula-
Sciences), with collection between 175 bp and 220 bp. tor was used to calculate the amounts of primer and
The Agilent 2100 Bioanalyzer (Agilent Technologies) polymerase used for the binding reaction. Using the Pac-
and the associated High Sensitivity DNA kit (Agilent Bio DNA/Polymerase Binding Kit 1.0 (Part Number
Technologies) were used to determine quality and con- 001-359-802), primers are annealed and the proprietary
centration of the libraries. The amount of library polymerase is bound forming the “Binding Complex”.
required for template preparation was calculated using The Binding Complex can be stored as a long-term stor-
the Template Dilution Factor calculation described in age mix at −20°C or diluted for immediate sequencing.
the protocol. The quantity of SMRT bell determines whether a long-
Emulsion PCR and enrichment steps were carried out term storage mix can be used. In this instance, there was
using the Ion Xpress™ Template Kit and associated ample genomic DNA from the four test genomes to
protocol (Part Number 4469004 Rev. B). Ion Sphere Par- allow long-term storage.
ticle quality assessment was carried out as outlined in an
earlier version of this protocol (Part Number 4467389 PacBio sequencing
Rev. B) for all samples because no benefit was seen with Long-term storage mixes were diluted to the required
using the Ion Sphere Quality Control Kit as recom- concentration and volume with the provided dilution
mended in the later version of the protocol. The oligos buffer and loaded into 96-well plates. These are loaded
used for this analysis were purchased from IDT (Inte- onto the instrument, along with DNA Sequencing Kit
grated DNA Technologies Inc.). Assessment of the Ion 1.0 (Part Number 001-379-044) and a SMRT Cell 8Pac.
Sphere Particle quality was undertaken between the In all sequencing runs, 2x45 min movies were captured
emulsion PCR and enrichment steps only. for each SMRT Cell loaded with a single binding com-
plex. Primary filtering analysis was performed on the
Ion torrent sequencing Blade Center server provided with the RS instrument,
Sequencing was undertaken using 316 chips in all cases before this data was transferred off the Blade Center for
and barcoding was not used for these samples. The Ion secondary analysis in SMRT Portal using the SMRT ana-
Sequencing Kit v2.0 was used for all sequencing reac- lysis pipeline version 1.2.0.1.81002. Summary sequencing
tions, following the recommended protocol (Part Num- statistics are given in Additional file 1: Table S3.
ber 4469714 Rev. B) and Torrent Suite 1.5 was used for
all analyses. Summary sequencing statistics are given in
Additional file 1: Table S2. Reference genomes
Each reference genome was created using capillary se-
PacBio library construction quence data with manual finishing and are available to
DNA (2.0-10 μg in 200 μl 10 mM Tris–HCl pH8.5) was download from http://www.sanger.ac.uk/resources/
sheared in an AFA clear mini-tube using a Covaris S2 downloads/. The methods used to sequence the genomes
device (Covaris Inc.) with the following settings: Duty of P. falciparum [14] and S. aureus TW20 [29] have
cycle 20, Intensity 0.1, cycles/burst 1000, 600 seconds. been published.
Sheared DNA was purified by binding to 0.6X volume of
pre-washed AMPure XP beads (Beckman Coulter Inc.), Data processing
as per PacBio protocol 000-710-821-DRAFT (five times After sequencing, reads were mapped to each genome refer-
in purified water, one time in EB, reconstituted in ori- ence sequence using the manufacturers’ alignment tools,
ginal supernatant) and eluted in EB to >60 ng/μl. The tmap for PGM and blasr for PacBio (http://www.pacific-
sheared DNA was quantified on an Agilent 2100 Bioana- biosciences.com/products/software/algorithms). BWA [30]
lyzer using the 7500 kit. 1 μg of sheared DNA was end- was used for mapping reads from the Illumina GAIIx,
repaired using the PacBio DNA Template Prep Kit 1.0 MiSeq and HiSeq. SAMtools [31] was then used toQuail et al. BMC Genomics 2012, 13:341 Page 11 of 13
http://www.biomedcentral.com/1471-2164/13/341
generate pileup and coverage information from the SNPs from the PacBio reads were called using PacBio’s
mapping output. SMRT Portal software version 1.2.3. Each SMRT cell
was selected for analysis against the S. aureus
Genome coverage USA300_FPR3757 reference genome (accession number
We counted the number of bases in the genome that CP000255), imported into the PacBio secondary analysis
were not covered by any reads (Coverage = 0) and those protocol; the parameters can be altered for filtering,
with less than 5x read coverage (CoverageQuail et al. BMC Genomics 2012, 13:341 Page 12 of 13
http://www.biomedcentral.com/1471-2164/13/341
representation versus GC content. Figure S2. Genome coverage device enabling non-optical genome sequencing. Nature 2011,
uniformity plots for 15x depth randomly normalized sequence coverage 475(7356):348–352.
from sequencing libraries prepared using standard and Nextera Library 2. Eid J, Fehr A, Gray J, Luong K, Lyle J, Otto G, Peluso P, Rank D, Baybayan P,
preparation methods. A) The percentage of the B. pertussis genome Bettman B, et al: Real-time DNA sequencing from single polymerase
covered at different read depths; B) The number of bases covered at molecules. Science 2009, 323(5910):133–138.
different depths for B. pertussis; C) The percentage of the S. aureus 3. Bentley DR, Balasubramanian S, Swerdlow HP, Smith GP, Milton J, Brown
genome covered at different read depths; D) The number of bases CG, Hall KP, Evers DJ, Barnes CL, Bignell HR, et al: Accurate whole human
covered at different depths for S. aureus; E) The percentage of the P. genome sequencing using reversible terminator chemistry. Nature 2008,
falciparum genome covered at different read depths; and F) The number 456(7218):53–59.
of bases covered at different depths for P. falciparum. Figure S3. 4. Kozarewa I, Ning Z, Quail MA, Sanders MJ, Berriman M, Turner DJ:
Sequence representation versus GC content for 15x depth randomly Amplification-free Illumina sequencing-library preparation facilitates
normalized sequence coverage from sequencing libraries prepared using improved mapping and assembly of (G + C)-biased genomes. Nat
standard and Nextera Library preparation methods. Genome coverage Methods 2009, 6(4):291–295.
uniformity plots for 15x depth randomly normalized sequence coverage 5. Quail MA, Otto TD, Gu Y, Harris SR, Skelly TF, McQuillan JA, Swerdlow HP,
from sequencing libraries prepared using the Illumina Nextera Library Oyola SO: Optimal enzymes for amplifying sequencing libraries. Nat
preparation kit (blue line) compared to those prepared using a standard Methods 2011, 9(1):10–11.
Illumina library preparation with Kapa HiFi for library amplification (green 6. Syed F, Grunenwald H, Caruccio N: Next-generation sequencing library
line), on: A) B. pertussis; B) S. aureus and C) P. falciparum genomes. Figure preparation: simultaneous fragmentation and tagging using in vitro
S4. Sequence representation versus GC content for 15x depth randomly transposition. Nature Methods Application Note 2009, 10:782.
normalized sequence coverage from the sequencing platforms tested, 7. Lam HYK, Clark MJ, Chen R, Chen R, Natsoulis G, O’Huallachain M, Dewey
on: A) B. pertussis; B) and C) P. falciparum genomes. FE, Habegger L, et al: Performance comparison of whole-genome
sequencing platforms. Nat Biotechnol 2012, 30(1):78–82.
Additional file 3: Table S4. Comparison of sequence coverage for data
8. Carver T, Harris SR, Berriman M, Parkhill J, McQuillan JA: Artemis: An
generated with PacBio, PGM and MiSeq across the P. falciparum genome.
integrated platform for visualisation and analysis of high-
Reads from randomly normalized 15x datasets were remapped with
throughput sequence-based experimental data. Bioinformatics 2012,
SMALT to have a uniform mapping score. To analyse the utility of long
28(4):464–469.
reads, read length and mate-pair read analysis was also performed on
9. Ponsting N, Ning Z: SMALT alignment tool. . (manuscript in preparation). 2012.
15x datasets comprising PacBio reads longer than 620 bases, and MiSeq
software download http://www.sanger.ac.uk/resources/software/smalt/.
paired- and single-end datasets with 150-base, 100-base and 50-base
10. Otto TD, Sanders M, Berriman M, Newbold C: Iterative Correction of
read lengths.
Reference Nucleotides (iCORN) using second generation sequencing
Additional file 4: Table S5. Ratios of the occurrence of quality loss after technology. Bioinformatics 2010, 26(14):1704–1707.
specific sequence triplets following the GGC motif. For each strand, the 11. Nakamura K, Oshima T, Morimoto T, Ikeda S, Yoshikawa H, Shiwa Y, Ishikawa
occurrence and subsequent mapping quality is tabulated for the GGC S, Linak MC, Hirai A, Takahashi H, et al: Sequence-specific error profile of
motif and for comparison another GC-rich motif GCC and the neutral Illumina sequencers. Nucleic Acids Res 2011, 39(13):e90.
motif ATG. Ratios are then given for the sequence quality observed on 12. Diep BA, Gill SR, Chang RF, Phan TH, Chen JH, Davidson MG, Lin F, Lin J,
the forward and reverse strands following the GGC triplet and ratios of Carleton HA, Mongodin EF, et al: Complete genome sequence of USA300,
mapping quality on the same strand following GCC and ATG triplets an epidemic clone of community-acquired meticillin-resistant
when compared to the GGC triplet. Staphylococcus aureus. Lancet 2006, 367(9512):731–739.
Additional file 5: Table S6. SNP detection statistics for S. aureus 13. Achidi EA, et al: A global network for investigating the genomic
datasets versus S. aureus USA300_FPR3757. epidemiology of malaria. Nature 2008, 456(7223):732–737.
14. Gardner MJ, Hall N, Fung E, White O, Berriman M, Hyman RW, Carlton
JM, Pain A, Nelson KE, Bowman S, et al: Genome sequence of the
Abbreviations human malaria parasite Plasmodium falciparum. Nature 2002,
NGS: Next-generation sequencing; PGM: Personal genome machine; 419(6906):498–511.
SMRT: Single molecule real time; PCR: Polymerase chain reaction; 15. Choi M, Scholl UI, Ji W, Liu T, Tikhonova IR, Zumbo P, Nayir A, Bakkaloglu A,
emPCR: Emulsion PCR; PE: Paired-end; qPCR: Quantitative PCR; QC: Quality Ozen S, Sanjad S, et al: Genetic diagnosis by whole exome capture and
Control; SNP: Single nucleotide polymorphism; Q10: 1 error in 10; Q20: 1 massively parallel DNA sequencing. Proc Natl Acad Sci U S A 2009,
error in 100; Q30: 1 error in 1000. 106(45):19096–19101.
16. Down TA, Rakyan VK, Turner DJ, Flicek P, Li H, Kulesha E, Graf S, Johnson N,
Competing interests Herrero J, Tomazou EM, et al: A Bayesian deconvolution strategy for
The authors declare no competing financial interests. immunoprecipitation-based DNA methylome analysis. Nat Biotechnol
2008, 26(7):779–785.
17. Giresi PG, Kim J, McDaniell RM, Iyer VR, Lieb JD: FAIRE (Formaldehyde-
Authors’ contributions
Assisted Isolation of Regulatory Elements) isolates active regulatory
MQ, MS, PC and AB performed the experiments and performed primary data
elements from human chromatin. Genome Res 2007, 17(6):877–885.
analysis. MQ, MS, PC and HPS designed the experiments. MQ wrote the
18. Johnson DS, Mortazavi A, Myers RM, Wold B: Genome-wide mapping of
manuscript. TDO, YGU, SH and TC carried out bioinformatics analysis. All
in vivo protein-DNA interactions. Science 2007, 316(5830):1497–1502.
authors read and approved the final manuscript.
19. Langridge GC, Phan MD, Turner DJ, Perkins TT, Parts L, Haase J, Charles I,
Maskell DJ, Peters SE, Dougan G, et al: Simultaneous assay of every
Acknowledgements Salmonella Typhi gene using one million transposon mutants. Genome
The authors thank the Wellcome Trust Sanger Institute core sequencing and Res 2009, 19(12):2308–2316.
informatics teams. This work was supported by the Wellcome Trust [grant 20. Licatalosi DD, Mele A, Fak JJ, Ule J, Kayikci M, Chi SW, Clark TA, Schweitzer
number 098051]. TDO was supported by the European Union 7th framework AC, Blume JE, Wang X, et al: HITS-CLIP yields genome-wide insights into
EVIMalaR. brain alternative RNA processing. Nature 2008, 456(7221):464–469.
21. Mamanova L, Andrews RM, James KD, Sheridan EM, Ellis PD, Langford CF,
Received: 16 March 2012 Accepted: 12 July 2012 Ost TW, Collins JE, Turner DJ: FRT-seq: amplification-free, strand-specific
Published: 24 July 2012 transcriptome sequencing. Nat Methods 2010, 7(2):130–132.
22. Myllykangas S, Buenrostro JD, Natsoulis G, Bell JM, Ji HP: Efficient targeted
References resequencing of human germline and cancer genomes by
1. Rothberg JM, Hinz W, Rearick TM, Schultz J, Mileski W, Davey M, Leamon JH, oligonucleotide-selective sequencing. Nat Biotechnol 2011,
Johnson K, Milgrew MJ, Edwards M, et al: An integrated semiconductor 29(11):1024–1027.Quail et al. BMC Genomics 2012, 13:341 Page 13 of 13
http://www.biomedcentral.com/1471-2164/13/341
23. Shao NY, Hu HY, Yan Z, Xu Y, Hu H, Menzel C, Li N, Chen W, Khaitovich P:
Comprehensive survey of human brain microRNA by deep sequencing.
BMC Genomics 2010, 11:409.
24. Wang Z, Gerstein M, Snyder M: RNA-Seq: a revolutionary tool for
transcriptomics. Nat Rev Genet 2009, 10(1):57–63.
25. Gnerre S, Maccallum I, Przybylski D, Ribeiro FJ, Burton JN, Walker BJ, Sharpe T,
Hall G, Shea TP, Sykes S, et al: High-quality draft assemblies of mammalian
genomes from massively parallel sequence data. Proc Natl Acad Sci U S A
2011, 108(4):1513–1518.
26. Levin JZ, Yassour M, Adiconis X, Nusbaum C, Thompson DA, Friedman N, Gnirke
A, Regev A: Comprehensive comparative analysis of strand-specific RNA
sequencing methods. Nat Methods 2010, 7(9):709–715.
27. Adey A, Asan, Xun X, Kitzman JO, Turner EH, Stackhouse B, MacKenzie AP,
Caruccio NC, Zhang X, et al: Rapid, low-input, low-bias construction of
shotgun fragment libraries by high-density in vitro transposition.
Genome Biol 2010, 11(12):R119.
28. Flusberg BA, Webster DR, Lee JH, Travers KJ, Olivares EC, Clark TA, Korlach J,
Turner SW: Direct detection of DNA methylation during single-molecule,
real-time sequencing. Nat Methods 2010, 7(6):461–465.
29. Holden TG, Lindsay JA, Corton C, Quail MA, Cockfield JD, Pathak S, Batra R,
Parkhill J, Bentley SD, Edgeworth JD: Genome Sequence of a Recently
Emerged, Highly Transmissible, Multi-Antibiotic- and Antiseptic-Resistant
Variant of Methicillin-Resistant Staphylococcus aureus, Sequence Type
239 (TW). J Bacteriology 2010, 192(3):888–892.
30. Li H, Durbin R: Fast and accurate short read alignment with Burrows-Wheeler
transform. Bioinformatics 2009, 25(14):1754–1760.
31. Li H, Handsaker B, Wysoker A, Fennell T, Ruan J, Homer N, Marth G, Abecasis
G, Durbin R: The Sequence Alignment/Map format and SAMtools.
Bioinformatics 2009, 25(16):2078–2079.
32. Angiuoli SV, Salzberg SL: Mugsy: fast multiple alignment of closely related
whole genomes. Bioinformatics 2011, 27(3):334–342.
doi:10.1186/1471-2164-13-341
Cite this article as: Quail et al.: A tale of three next generation
sequencing platforms: comparison of Ion Torrent, Pacific Biosciences
and Illumina MiSeq sequencers. BMC Genomics 2012 13:341.
Submit your next manuscript to BioMed Central
and take full advantage of:
• Convenient online submission
• Thorough peer review
• No space constraints or color figure charges
• Immediate publication on acceptance
• Inclusion in PubMed, CAS, Scopus and Google Scholar
• Research which is freely available for redistribution
Submit your manuscript at
www.biomedcentral.com/submitYou can also read