Customized optical mapping by CRISPR-Cas9 mediated DNA labeling with multiple sgRNAs
←
→
Page content transcription
If your browser does not render page correctly, please read the page content below
Published online 24 November 2020                                                                      Nucleic Acids Research, 2021, Vol. 49, No. 2 e8
                                                                                                                            doi: 10.1093/nar/gkaa1088

Customized optical mapping by CRISPR–Cas9
mediated DNA labeling with multiple sgRNAs
Heba Z. Abid 1,† , Eleanor Young 1,† , Jennifer McCaffrey1 , Kaitlin Raseley1 ,
Dharma Varapula 1 , Hung-Yi Wang1 , Danielle Piazza1,2,3 , Joshua Mell2,3 and
Ming Xiao 1,3,*
1
  School of Biomedical Engineering, Science and Health Systems, Drexel University, Philadelphia, PA, USA,
2
  Department of Microbiology and Immunology, College of Medicine, Drexel University, Philadelphia, PA, USA and
3
  Center for Genomic Sciences, Institute of Molecular Medicine and Infectious Disease, Drexel University,

                                                                                                                                                                  Downloaded from https://academic.oup.com/nar/article/49/2/e8/5999906 by guest on 06 February 2021
Philadelphia, PA, USA

Received July 02, 2020; Revised October 16, 2020; Editorial Decision October 21, 2020; Accepted October 27, 2020

ABSTRACT                                                                                 INTRODUCTION
Whole-genome mapping technologies have been de-                                          Restriction mapping has been applied in human genomics
veloped as a complementary tool to provide scaf-                                         for physical mapping of genome fragments based on re-
folds for genome assembly and structural varia-                                          striction enzyme cutting and was used extensively during
tion analysis (1,2). We recently introduced a novel                                      the Human Genome Project to guide genome assembly (3–
                                                                                         5). However, traditional restriction mapping is highly labor-
DNA labeling strategy based on a CRISPR–Cas9
                                                                                         intensive and requires large amounts of sample. More im-
genome editing system, which can target any 20bp
                                                                                         portantly, a traditional restriction map provides a ‘finger-
sequences. The labeling strategy is specifically use-                                    print’ of the genomic DNA, rather than an ordered se-
ful in targeting repetitive sequences, and sequences                                     quence of restriction sites. A solution to the sequence as-
not accessible to other labeling methods. In this re-                                    sembly challenge that overcomes the drawbacks of tradi-
port, we present customized mapping strategies that                                      tional restriction mapping is optical mapping (6). The op-
extend the applications of CRISPR–Cas9 DNA label-                                        tical mapping method has been used to construct ordered
ing. We first design a CRISPR–Cas9 labeling strat-                                       restriction maps for whole genomes (7–9) and continues
egy to interrogate and differentiate the single al-                                      to be very useful in providing scaffolds for shotgun se-
lele differences in NGG protospacer adjacent motifs                                      quence assembly and validating sequence assemblies (10–
(PAM sequence). Combined with sequence motif la-                                         12). More recently, a similar optical mapping technique has
                                                                                         been introduced by combining sequence-specific labeling,
beling, we can pinpoint the single-base differences
                                                                                         along with consistent linearization of extremely long DNA
in highly conserved sequences. In the second strat-                                      molecules in nanochannel arrays (1). This provides an accu-
egy, we design mapping patterns across a genome                                          rate, high-throughput, and robust whole-genome mapping
by selecting sets of specific single-guide RNAs (sgR-                                    technique, and optical mapping has been widely applied in
NAs) for labeling multiple loci of a genomic region                                      assisting genome assembly, the detection and characteriza-
or a whole genome. By developing and optimiz-                                            tion of complex structural variants, and microbial compar-
ing a single tube synthesis of multiple sgRNAs, we                                       ative genomics (13–15).
demonstrate the utility of CRISPR–Cas9 mapping                                              The primary genome mapping strategy is based on mea-
with 162 sgRNAs targeting the 2Mb Haemophilus                                            suring distances between short (6–8 bp) sequence motifs
influenzae chromosome. These CRISPR–Cas9 map-                                            across the genome (16,17). However, the distribution of
ping approaches could be particularly useful for ap-                                     motifs is fixed for any given genome, which results in un-
plications in defining long-distance haplotypes and                                      even spacing for different genomic regions. Often, there
                                                                                         are no appropriate motifs within repetitive genomic re-
pinpointing the breakpoints in large structural vari-                                    gions, which results in large unmappable genomic intervals
ants in complex genomes and microbial mixtures.                                          (14,18). Another challenge resides in detecting and typing
                                                                                         specific structural variants for clinical diagnostic applica-
                                                                                         tions. Targeted variant-specific labeling is required to obtain

* To   whom correspondence should be addressed. Tel: +1 215 895 2690; Fax: +1 215 895 4983; Email: ming.xiao@drexel.edu
†
    The authors wish it to be known that, in their opinion, the first two authors should be regarded as Joint First Authors.

C The Author(s) 2020. Published by Oxford University Press on behalf of Nucleic Acids Research.
This is an Open Access article distributed under the terms of the Creative Commons Attribution-NonCommercial License
(http://creativecommons.org/licenses/by-nc/4.0/), which permits non-commercial re-use, distribution, and reproduction in any medium, provided the original work
is properly cited. For commercial re-use, please contact journals.permissions@oup.com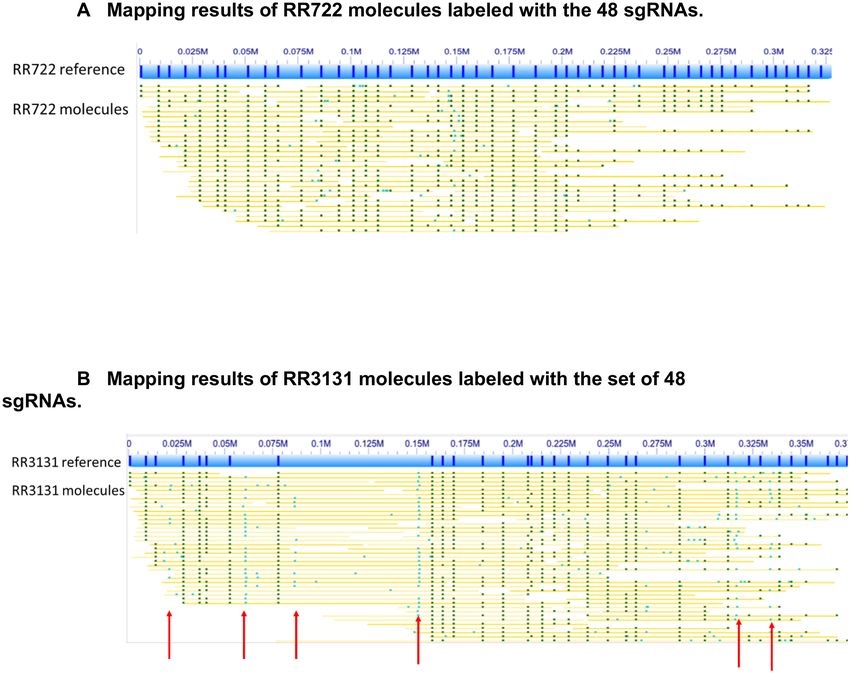
e8 Nucleic Acids Research, 2021, Vol. 49, No. 2 PAGE 2 OF 11
accurate breakpoints, but this cannot be achieved by motif- These CRISPR–Cas9 mapping approaches could be par-
mapping alone (19). In microbial comparative analyses, se- ticularly powerful in defining long-distance haplotypes and
quences with high similarities are often involved (20). Se- pinpointing breakpoints of large structural variants in com-
quence motif mapping generally results in similar patterns plex genomes (30,31), and they may enable microbial com-
in these regions. In principle, another important application parative analyses (17,32).
of optical mapping could be long-range inference of haplo-
type structure, but use of motif-specific labels restricts anal- MATERIALS AND METHODS
ysis to polymorphisms that happen to impact genomic mo-
tifs. High-molecular-weight DNA extraction
Recently, we introduced a novel labeling strategy based Two Haemophilus influenzae strains with complete genome
on a CRISPR–Cas9 genome editing system using the nick- sequences were used: the standard lab strain Rd KW20
ing Cas9-D10A protein to address the above issues. This la- (RR722, NC 000907) and a marked derivative of clinical
beling strategy can target almost any 20 bp sequence (21). isolate 86-028NP (RR3131, NC 007416.2, carrying novo-
The method is especially powerful in targeting repetitive se- biocin and nalidixic acid resistance alleles, NovR and NalR )
Downloaded from https://academic.oup.com/nar/article/49/2/e8/5999906 by guest on 06 February 2021
quences or other sequences that rely on the distribution of (27,33,34). Bacterial culture followed standard protocols;
restriction site motifs in the DNA. Since its introduction, cells were grown to stationary phase (OD600 nm = 1.2)
the method has found many applications, including single- in supplemented brain-heart infusion (10 g/ml hemin 2
molecule telomere length measurements via fluorescent tag- g/ml NAD) shaking at 37◦ C, and then cells were har-
ging of telomere repeats with guide RNA (gRNA) (22,23), vested by centrifugation at 4000 rpm for 5 min before DNA
global characterization of repeat-rich human subtelomere extractions (35,36). Purification of ultra-high MW DNA
regions (24,25), mapping and identifying large-scale struc- fragments followed the Bionano Prep Cell Culture DNA
tural variants such as at acrocentric chromosomes (14), and Isolation Protocol. Briefly, cells were: (a) resuspended in
identifying antibiotic resistance encoding plasmids present cell buffer (∼5 × 10⁹ CFU/ml); (b) embedded in 2% low-
in bacterial isolates (26). melt agarose (BioRad) plugs to minimize shearing forces;
In this report, we present a couple of customized map- (c) lysed using Bionano cell lysis buffer supplemented with
ping strategies by CRISPR–Cas9 mediated DNA labeling. 167 l Proteinase K (Qiagen) rocking overnight at 50◦ C; (d)
We demonstrate the overall effectiveness of the new map- RNase treatment by adding 50 l of RNase A solution and
ping strategies using the bacterium Haemophilus influen- incubating the plugs for 1 h at 37◦ C (Qiagen) and (e) wash-
zae strains as a model system, the standard lab strain Rd ing in TE buffer with intermittent mixing. Finally, DNA
KW20 (RR722, NC 000907), and a marked derivative of was purified from low-melt agarose plugs by drop dialysis.
clinical isolate 86-028NP (RR3131, NC 007416.2) (27,28). Plugs were melted at 72◦ C, then incubated with 2 l Agarase
In the first strategy, we enable the CRISPR–Cas9 labeling (Thermo Fisher Scientific) for 45 min. Melted plugs were di-
to interrogate and differentiate the single allele difference in alyzed into TE buffer using 0.1 m Millipore membrane fil-
the NGG protospacer adjacent motif (PAM sequence). The ters for 45 min at a ratio of 15 ml buffer per ∼200 l sample.
same 20 base locus in two strains was either labeled or not DNA was allowed to homogenize overnight at room tem-
depending on if an alternative allele other than G is present perature before fluorometric quantification using the Qbit
in PAM. Combining with sequence motif labeling, we can dsDNA BR kit (Thermo Fisher Scientific).
pinpoint the single-base differences in highly conserved se-
quences.
dsDNA synthesis
In the second strategy, we use a custom panel of sequence-
specific sgRNAs to label multiple loci of a genomic region sgRNA oligos. sgRNAs were encoded on 55 nt
or a whole genome. Since nearly any 20mer sequence can DNA oligos with a 5 T7 promoter sequence
be targeted (constrained only by the need for a 3 -NGG (5 -TTCTAATACGACTCACTATAG-3 ), followed
protospacer adjacent motif, or PAM) (21), one can design by the target 20mer sequence, complementary to the
mapping patterns across a genome by selecting sets of spe- target gDNA sequence, and finally an overlap sequence
cific single-guide RNAs (sgRNAs) for features of interest. (5 -GTTTTAGAGCTAGA-3 ). Individually synthesized
To make this strategy viable and expand its utility requires: sgRNA oligos were then pooled into an equimolar mixture.
(a) reduced cost of sgRNA synthesis (a sgRNA still costs sgRNA complementary oligo: An 80 nt long oligo was
∼$100 through commercial sources); (b) optimization of designed with the 3 end complementary to the overlap se-
the total number of sgRNAs that can be combined into a quence and remainder encoded the Cas9 binding sequence
single labeling reaction. By addressing the above issues, we (5 -AAAAGCACCGACTCGGTGCCACTTTTTCAAG
first optimized and developed a sgRNA synthesis method TTGATAACGGACTAGCCTTATTTTAACTTGCTAT
based on T7 RNA transcription to generate a mixture of TTCTAGCTCTAAAAC-3 ). All oligos were obtained
multiple sgRNAs in a single tube reaction (29), reducing from Integrated DNA Technology. The sgRNA oligo mix
synthesis costs by an order magnitude or greater. We then was hybridized to the sgRNA complementary oligo (at 10
designed 162 sgRNAs targeting different chromosomal sites M each) in 1× NEBuffer2 (New England BioLabs, NEB)
in the lab strain Rd and in vitro synthesized all of them in a with 2 mM dNTPs at 90◦ C for 15 s followed by 43◦ C for
single tube reaction. This mixture was then used to label two 5 min. To complete dsDNA synthesis, the hybridization
bacterial strains, followed by single-molecule optical map- mixture was incubated at 37◦ C for 1hr with 5 U of Klenow
ping. Optical reads were successfully aligned to the custom- Fragment 3 →5 exo- (NEB). To degrade linear ssDNA
designed sgRNA map. remaining, the dsDNA was then treated with Exonuclease I
PAGE 3 OF 11 Nucleic Acids Research, 2021, Vol. 49, No. 2 e8
in 1× Exonuclease I reaction buffer (NEB) for 1 h at 37◦ C. model. An overlap graph was generated based on the pair-
Finally, dsDNA was purified using QIAquick Nucleotide wise comparison of all molecules as input. Redundant and
Removal Kit (Qiagen) and eluted in 30 ul elution buffer. spurious edges were removed. The assembler outputs the
Quality and concentration were assessed using agarose gel longest path in the graph and consensus maps were derived.
electrophoresis and the Synergy H1Hybrid Multi-Mode Consensus maps are further refined by mapping single-
Reader (Bio Tek). molecule maps to the consensus maps and label positions
are recalculated. Refined consensus maps are extended by
sgRNA synthesis mapping single molecules to the ends of the consensus and
calculating label positions beyond the initial maps. After the
sgRNA was synthesized using HiScribe T7 High Yield merging of overlapping maps, a final set of consensus maps
RNA Synthesis Kit (NEB) following the Standard RNA was output and used for subsequent analysis. RefAligner
Synthesis protocol. In summary, 1 g dsDNA was incu- works similarly but compares molecules directly to an in sil-
bated with 1× reaction buffer, 10 mM NTPs and T7 RNA ico nicked reference instead of first forming contigs. These
polymerase enzyme mix at 37◦ C for 2 h followed by DNase maps were then opened in Irsyview visualization software
Downloaded from https://academic.oup.com/nar/article/49/2/e8/5999906 by guest on 06 February 2021
I treatment at 37◦ C for 15 min to remove dsDNA from the from BioNano Genomics.
reaction. sgRNA was then purified using RNA Clean &
Concentrator Kits (Zymo Research). The concentration of RESULTS AND DISCUSSION
the purified sgRNA was assessed using Synergy H1Hybrid
Multi-Mode Reader (Bio Tek). Using CRISPR–Cas9 labeling to interrogate individual base,
and tag specific genomic region of interest
CRISPR–Cas9 labeling of chromosomal DNA The main strategy for long-range optical mapping is based
on measuring the distances between the short sequence mo-
For DNA nicking using the 48 and 162 sgRNA mix (sup-
tifs recognized by nicking endonucleases (6–8 bp) on single
plementary Tables S1 and S2),1.25 M of the synthesized
long DNA molecules. The key information is the pattern
sgRNA was first incubated with 125 nM of Cas9 D10A
of distances between motifs. Current labeling strategies can
(NEB) in 1× NEBuffer 3.1 (NEB) at 37◦ C for 15 min to
only detect single-base differences at polymorphisms that
form a sgRNA-Cas9 complex. 300 ng of the DNA sample
happen to coincide with nickase motifs, which has limited
was then added to the sgRNA–Cas9 complex mixture and
the potential applications of optical mapping. For example,
incubated at 37◦ C for 60 min. For DNA nicking with both
the H. influenzae strains RR722 and RR3131 share a 100 kb
Cas9 and Nt.BspQI, 2.5 M gRNA was first incubated with
region (819–916 kb of RR722, NC 000907, and 884–981 kb
63 nM of Cas9 D10A in 1X NEBuffer 3.1 at 37◦ C for 15min.
of RR3131, NC 007416) with 99% sequence similarity. The
After that, 300 ng of DNA and 5 U of Nt.BspQI (NEB)
Nt.BspQI sequence motif maps for the two strains are al-
were added to the sample mixture and incubated at 37◦ C for
most identical for this region, except for one extra nick of
2 h. The nicked DNA samples were then labeled using 5 U
the RR3131 genome, due to an adenine single-nucleotide
Taq DNA Polymerase (NEB), 1× thermopol buffer (NEB),
difference from RR722, thus the nicking enzyme labels the
266 nM free nucleotides mix (dATP, dCTP, dGTP (NEB)
RR3131’s allele but not RR722’s allele (Figure 1).
and Atto-532-dUTP (Jena Bioscience)) at 72◦ C for 60 min.
We devised a strategy to use multiplexed CRISPR–Cas9
The labeled sample was then treated with Proteinase K at
labeling to distinguish single-nucleotide variants affecting
56◦ C for 30min and 1uM IrysPrep stop solution (BioNano
3 -NGG PAM sites since the editing system has a strong
Genomics) was added to the reaction.
requirement for the PAM immediately following the 20 bp
recognition sequences. Genetic variation impacting PAM
DNA loading and imaging sites (i.e. if one of the G bases of a PAM in one genome is
Labeled DNA samples were stained and prepared for load- variant in another) is expected to strongly impact labeling,
ing on an Irys Chip (BioNano Genomics) following man- even if they share the 20 bp recognition sequence. Thus, we
ufacturer instructions. The sample was then linearized and predicted that strong differential labeling at gRNA-guided
imaged. The stained samples were loaded and imaged in- PAM variants could reliably differentiate the single base dif-
side the nanochannels following the established protocol. ference between two genomes over long distances.
Each Irys Chip contains two nanochannel devices, which To demonstrate single-base resolution of multiplexed
can generate data from >60 Gb of long chromosomal DNA CRISPR–Cas9 labels at variation affecting PAM sites, we
fragments (>150 kb). The image analysis was done using designed gRNAs targeting three distinct 20mer recognition
BioNano Genomics commercial software (IrysView 2.5) for sequences, but for each one of the two H. influenzae strains
segmenting and detecting DNA backbone YOYO-1 stain- lacked a 3 -NGG PAM signal due to single nucleotide vari-
ing, similar to early optical mapping methods, and localiz- ation (Table 1). Labeling by both Nt.BspQI and CRISPR–
ing the green labels by fitting the point-spread functions. Cas9 were performed in a single tube reaction, and the re-
sults of optical mapping are shown in Figure 1.
Single-base variation away from either G in the PAM
Data analysis
nearly eliminated the corresponding labeling. At ‘locus 1’
Single-molecule maps were de novo assembled and aligned (NTHI0914-hypothetical protein of RR3131 and HI 0755-
to the reference as described in previous work (37). Briefly, conserved hypothetical protein of RR722), the two strains
the assembler is a custom implementation of the overlap- share the same 20 bp recognition sequence (5 -AAAAATT
layout-consensus paradigm with a maximum likelihood GCTGCATCTTCTT-3 ) as the gRNA, but RR3131 has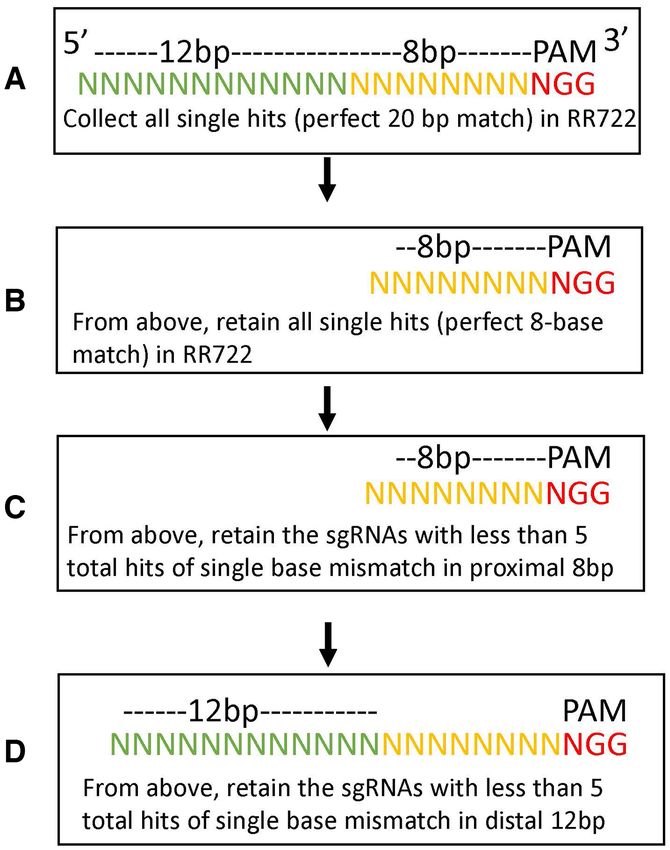
e8 Nucleic Acids Research, 2021, Vol. 49, No. 2                                                                                     PAGE 4 OF 11

                                                                                                                                                        Downloaded from https://academic.oup.com/nar/article/49/2/e8/5999906 by guest on 06 February 2021
Figure 1. Interrogation of individual bases with CRISPR–Cas9 labeling. Yellow lines indicate single molecules. The thick blue bars represent Nt.BSPQI
reference map. The narrower blue bar represent consensus map of combined Nt.BSPQI CRISPR–Cas9 labeling. Red arrows and bases indicate the single
base differences between the two strains. Additional details can be found in the Table 1.

Table 1. sgRNA target sequences used for single base differentiation in Figure 1
Strains                Locations                Loci                         Target sequence                               gRNA sequence
RR722                   819899                    1            AAAAATTGCTGCATCTTCTTTGA                            AAAAATTGCTGCATCTTCTT
RR3131                  885289                    1            AAAAATTGCTGCATCTTCTTTGG
RR722                   828196                    2            AACCATTCAAACGGCGATTGCGG                            AACCATTCAAACGGCGATTG
RR3131                  893590                    2            CACTATTCAAACGGCTATTGCTG
RR722                   903309                    3            AATATCCTTGCCTTGAGAGAACG                            AATATCCTTGCCTTGAGAGA
RR3131                  968698                    3            AATATCCTTGCCTTGAGAGAAGG

The differing bases are shown in red for three locations.

a 3 -TGG PAM sequence, while RR722 has a TGA se-                              molecules were labeled if there is an alternative allele in the
quence instead. CRISPR–Cas9-mediated optical mapping                           PAM sequences. This is in contrast to the variable label-
clearly shows high-efficiency labeling at position 885289 in                   ing efficiencies seen for different mismatches from the 20
RR3131 (∼90% labeling), whereas RR722 molecules totally                        nt recognition sequences in the sgRNA experiments below.
lacked labels (0%) at position 819899 (red arrow at ‘locus                     These results suggest that a customized optical mapping
1’ in Figure 1). Similarly, at ‘locus 3’ (NTHI0947-50S ri-                     using gRNAs to target many of these polymorphisms (or
bosomal protein L29 of RR3131), the labeling difference                        ‘PAM SNPs’) could be an effective means to define long-
between two strains can only be explained by the presence                      distance haplotype structure in human genomes. It could
of alternative alleles in the two strains, in which RR3131                     also be applicable in other sample types, particularly mixed
becomes labeled at 98698 with a perfect AGG PAM se-                            microbial specimens. The new DLE labeling strategy (6bp
quence; RR722 is not labeled at the syntenic position be-                      motif) from BioNano genomics provides 50% more label-
cause of an ACG variant non-PAM sequence. At ‘locus 2’                         ing sites than Nt.BspqI labeling (7 bp motif) in the human
(ribB), the sgRNA matches RR722 at 828196 with a CGG                           genome, which may resolve some haplotype features. How-
PAM sequence, and correspondingly, over 90% of molecules                       ever, the density of 1 SNP per megabase in these motifs
spanning the position were labeled (red arrow at ‘locus 2’                     is still insufficient to construct whole-genome haplotypes,
in Figure 1). In RR3131, no labeling was seen at the best-                     even given long average DNA read length of 300 kb.
matching genomic position (893590), but in addition to a                          We performed an in silico analysis of whole genomes from
non-PAM 3 -end (CTG), the first and third positions were                      the 1000 genomes project (38,39) to determine the poten-
also mismatched.                                                               tial number and distribution of heterozygous PAM SNPs in
   In summary, labeling efficiency was over 90% for gRNAs                      the human genome, Out of 161 million NGG sites in hg38,
with an NGG PAM sequence, whereas almost none of the                           on average, there are 220 000 heterozygous PAM SNPs in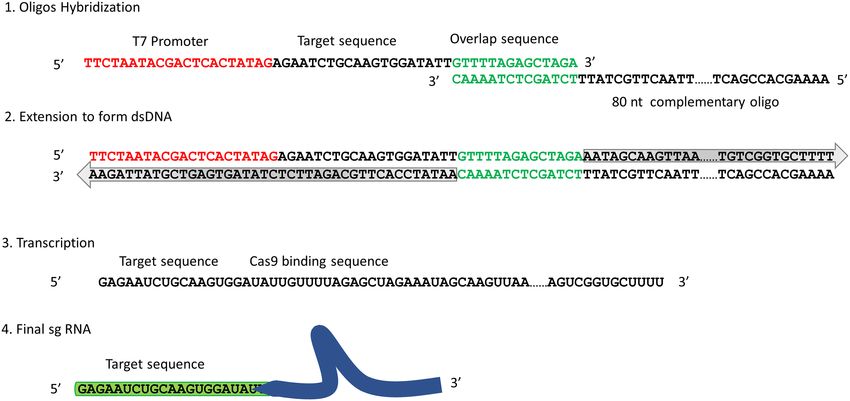
PAGE 5 OF 11 Nucleic Acids Research, 2021, Vol. 49, No. 2 e8
Downloaded from https://academic.oup.com/nar/article/49/2/e8/5999906 by guest on 06 February 2021
Figure 2. The workflow of sgRNA synthesis. The multiple oligos with a promoter sequence (red) and an overlap sequence (green) on either side of the
target sequence are hybridized with a single complementary oligo that shares the overlap sequence.
a single diploid human genome. In addition, there are on Multiplexed sgRNA optical mapping
average 40 000 heterozygous indels (>4 bp) within poten-
In the second customized mapping strategy, we customized
tial CRISPR–Cas9 recognition sequences (20 bp + NGG);
the mapping patterns across a genome by selecting sets of
>2 bp heterozygous indels within the 20 bp gRNA recogni-
specific single-guide RNAs (sgRNAs) for features of inter-
tion sequence preferentially target the matching allele. To-
est. This is particularly useful in designing different patterns
gether, the genomic density of these sites is ideal to generate
to differentiate similar genomes or conserved sequences be-
long-distance haplotypes using CRISPR–Cas9 labeling of
tween strains or haplotypes. In designing the patterns, it is
PAM sites with single molecules in these experiments longer
critical to avoid evenly distributed sgRNAs, because only
than 100 kb.
long molecules across the entire pattern can be uniquely
aligned. To test this, we first designed two custom optical
mapping patterns using the different H. influenzae bacterial
Multiplexed sgRNA preparation in a single tube reaction
strains, lab strain Rd KW20 (RR722), and a marked deriva-
We adapted the previously described method to synthesize tive of clinical isolate 86-028NP (RR3131) as the model sys-
multiple sgRNAs in a single tube reaction (29). Figure 2 tems.
shows the synthesis scheme and workflow. The key differ- 48 sgRNAs were designed to target a 300 kb re-
ence between our approach and the available commercial kit gion of RR722 (0–350 kb of NC 000907), which shares
(EnGen® sgRNA Synthesis Kit, S. pyogenes from NEB) is high sequence similarity with RR3131 strain (0–315 kb
that we have a separate step to generate the dsDNA before NC 007416). Each sgRNA was designed to have a single
the RNA transcription reaction. The mixture of multiple perfect match of 20 bases upstream of PAM NGGs based
sgRNA oligos and the sgRNA complementary oligo was on the Rd reference genome (Supplementary Table S1).
first mixed at a 1:1 ratio in reaction buffer. After Klenow These 48 sgRNAs are evenly distributed across the 300 kb
exo- extension to generate dsDNA, the reaction was treated region of RR722 (RR722 reference map in Figure 3A).
with Exonuclease I to remove extra ssDNA. The purity Dark lines on the blue bar indicate predicted sgRNA lo-
and size of dsDNA were further confirmed with gel elec- cations. Out of 48 sgRNAs, 33 sgRNAs also have a single
trophoresis before purification with PCR cleanup column. perfect match of 20 bases upstream of a PAM NGG on the
We typically get 5 g dsDNA at 0.2 g/l concentration. RR3131 strain. However, the predicted targeting locations
After sgRNA synthesis using T7 RNA polymerase, the sam- of these 33 sgRNAs form an unevenly distributed mapping
ple was treated with DNaseI to remove dsDNA and purified pattern (RR3131 reference map in Figure 3B), indicative of
with an RNA cleanup column. We normally obtain 40g structural variation between the genomes.
sgRNA at 2 g/l concentration. This is enough to run We then generated a single mixture of 48 sgRNAs, which
∼230 CRISPR–Cas9 labeling reactions with 300 ng target was used to label and map targeted regions in both the
DNA sample each time. The purity and correct size of the RR722 and RR3131 genomes. The individual molecules are
dsDNA are critical to the synthesis of multiple sgRNAs. We indicated as yellow lines that are aligned to blue references
successfully synthesized 162 sgRNAs in a single tube reac- in Figure 3. The two data sets show similar characteris-
tion. tics with an average molecule length of 255 and 249 kb fore8 Nucleic Acids Research, 2021, Vol. 49, No. 2 PAGE 6 OF 11
Downloaded from https://academic.oup.com/nar/article/49/2/e8/5999906 by guest on 06 February 2021
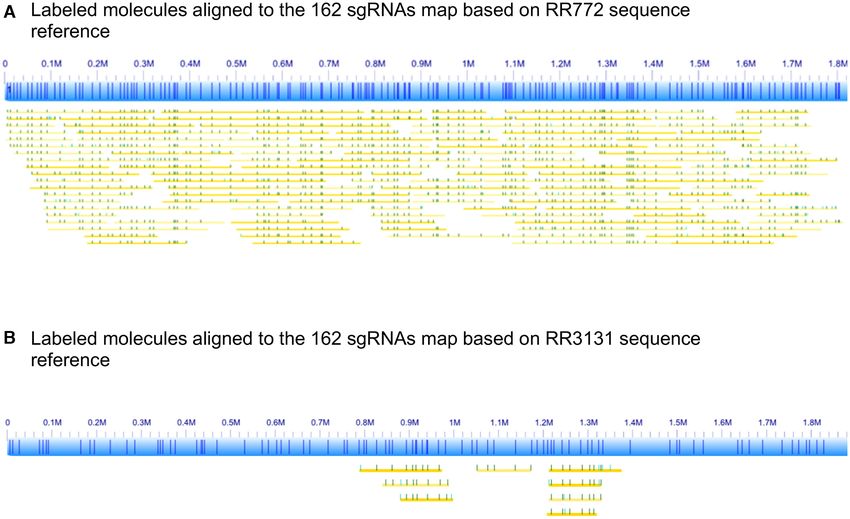
Figure 3. (A) Mapping results of RR722 molecules labeled with the 48 sgRNAs (Supplementary Table S1). The lines in the blue bar (designed reference
map of RR722) represent the locations of the 48 sgRNAs on RR722. The yellow lines below the reference are labels with dark green dots representing where
labels matched to the reference and light green dots representing labels not found in the reference. (B) Mapping results of RR3131 molecules labeled with
the set of 48 sgRNAs (Supplementary Table S1). The lines in the blue bar (designed reference map of RR3131) represent the locations of the 48 sgRNAs
on RR3131. The yellow lines below the reference are labels with dark green dots representing where labels matched to the reference map and light green
dots representing labels not found in the reference map. The red arrows indicate the off-target labeling.
RR722 and RR3131 respectively. But with the same amount (20 base recognition sequence) against the RR3131 refer-
of raw data, three times more molecules could be uniquely ence. Fifteen sgRNAs out of the above 48 sgRNAs that have
aligned to the RR3131 strain than the RR722 strain, even imperfect matches to the RR3131 genome. Some of them
though RR3131 has fewer perfectly matched sgRNAs (Fig- result in off-target labeling in RR3131. In Figure 3B, many
ure 3A and B, respectively). This is due to the fact that single molecules show off-target labels (light green dots)
the shorter molecules will generate ambiguous alignments at six different locations, which are present in the RR722
to the evenly distributed patterns. Longer molecules are genome, but not present in RR3131, therefore absent from
needed to map across the whole evenly distributed reference, the reference map.
which results in fewer molecules aligned to RR722 sgRNA Seven of these 15 sgRNAs show several partial matches
map. This clearly shows that an unevenly distributed map- (PAGE 7 OF 11 Nucleic Acids Research, 2021, Vol. 49, No. 2 e8
Table 2. The off-target labeling of RR3131
Strains Locations Labeling Target sequence
RR722 21722 GCTTTTTAGGATATCGTCCCNGG
RR3131 21698 off target GCTTTTTAAGATATCGTCCCAGG
RR722 59529 GCGGTATCCACCCCCACTGCNGG
RR3131 60913 off target GCAGTATCCACCCCCACTGCAGG
RR722 86065 GTTACATTACACACAAACTTNGG
RR3131 86656 off target GTTACATTACACACAAATTTTGG
RR722 94393 GGGGCGTAAATTCTTAACATNGG
RR3131 151264 off target GGAGCGTAAATTCTTAACATTGG
RR722 253327 CGAAGGGATAAATATTGCGANGG
RR3131 316470 off target TGAAGGGATAAATATTGCGATGG
RR722 270963 TAGCACTTAAAAGAGGAATGNGG
RR3131 334078 off target TGGCACTTAAAAGAGGAATGGGG
RR722 219206 TTGTTTTACGATATAATACGNGG
Downloaded from https://academic.oup.com/nar/article/49/2/e8/5999906 by guest on 06 February 2021
RR3131 281336 no label TTGTTTTGCGATATAATACGAGG
RR722 296956 TAATCAAGCATTAGATAGCTNGG
RR3131 359914 no label GCGTAAAGCATTAGATAGCTTGG
Two rows are shown for each of eight probes that did not have a perfect hit in the RR3131 genome. The second row is the designed probe named for its hit
location on the RR722 genome. The upper row is the sequence found in the RR3131 strain, and named for its location. Bold indicates a PAM sequence
motif (NGG). Red indicates a base that does not match the designed probe. The last two probes did not have a label seen consistently in the aligned data.
of the 15 did not produce a label in RR3131 and are listed ning the full RR722 genome in a series of four stepwise fil-
as ‘No label’. Of the two, the sgRNA at 219206 of RR722 ters: a) We first collected all possible sgRNAs with a single
(TTGTTTTACGATATAATACGNGG) also shows a sin- perfect match to the RR722 reference (all 20mers followed
gle base mismatch on RR3371 strain, but did not result by a 3 PAM NGG that occur only once in RR722); 40 870
in off-target labeling. The sgRNA at 323878 of RR722 such possible sgRNAs were available. (b) From those, we
(TAATCAAGCATTAGATAGCTNGG) has several mis- collected only the 8-base seeding sequences proximal to the
matches close to the 5 end and also did not result in off- PAM with single perfect hits to the reference. If an 8-base
target labeling. seed had multiple perfect hits to the reference, it was dis-
All six sgRNAs that caused high-frequency off-target la- carded since these had a high chance of contributing to off-
beling had a single mismatch to the target sequences of target labeling. The remaining sgRNAs (15 339) all had a
RR3131. Five of six had the single mismatch close to the 5 single perfect hit of 20 bases and a single perfect hit of the
end, distal from the PAM sequences, except the sgRNA at 8-base seeding sequences. (c) Since all eight base-seeding se-
86065 of RR722 (GTTACATTACACACAAACTTNGG) quences have multiple hits with a single mismatch, we then
with the single mismatch at the 3rd base upstream of PAM. applied a third filter to minimize the number of hits in the
For example, the sgRNA at 21722 of RR722 (GCTTTTTA 8-base seeding sequences with single mismatches to RR722.
GGATATCGTCCCNGG) is designed to target the RR722 This resulted in 1507 gRNAs withe8 Nucleic Acids Research, 2021, Vol. 49, No. 2 PAGE 8 OF 11
a high cost. In general, obtaining accurate long sequence
reads is dramatically more informative than only measuring
spacings between short sequence motifs on long DNA frag-
ments. Long-read sequencing will be the future. However,
optical mapping provides a useful tool to infer extremely
long-range haplotype information at a low cost, especially
with the new ability to design custom labeling patterns. The
average fragment length of optical reads can be ∼300 kb,
and the long tail of extremely long fragments is correspond-
ingly much larger (36). In turn, both mapping molecules to
reference sequences and assembly-based inference can span
much longer haplotype structures, especially in the regions
containing long complex repetitive element arrays, and re-
quiring less overall yield. This capability allows the optical
Downloaded from https://academic.oup.com/nar/article/49/2/e8/5999906 by guest on 06 February 2021
mapping to detect large/complex SVs (>10 kb), which se-
quencing technologies would potentially miss (13). Optical
mapping also provides an important independent valida-
tion tool for identifying misassemblies (47).
Here, we show for the first time that individual alleles
can be differentiated at arbitrary loci by genome-scale opti-
cal mapping using CRISPR–Cas9 fluorescent labeling. Ap-
propriately designed probe sets could provide an effective
means to define long-distance haplotype structure in target
regions of complex genomes like that of humans or to dis-
tinguish among strains and haplotypes in mixed microbial
samples.
Traditionally, genome-scale optical mapping is based on
measuring distances between short (6–8 bp) sequence mo-
Figure 4. sgRNA design flow-chart. tifs across the genome, which were labeled either via re-
striction enzyme cutting, or fluorescent tagging with nick-
ase or methyltransferase. However, the distribution of mo-
target labels (>30%) were observed in this 162 set of sgR- tifs is fixed for any given genome. Here we also showed
NAs. We then aligned the same set of 162 sgRNAs to the for the first time that one can customize the mapping pat-
RR3131 reference sequence, only 90 of 162 perfect hits re- terns by designing a custom set of multiple sgRNAs to flu-
mained, and these form the RR3131 reference map shown orescently tag any 20bp sequences with the CRISPR–cas9
in Figure 5B. When we aligned the labeled RR722 molecules genome editing system. This will greatly expand the appli-
to the RR3131 reference map, only 8 molecules aligned. cations of genome mapping in targeting specific features
These are shorter molecules around 100 kb that are aligned of interests, clinically relevant structural variants, repeti-
to two highly conserved regions, 884–981 kb of RR3131 tive regions, and other inaccessible regions by sequence
(819–916 kb of RR722, NC 000907 and 884–981 kb of motif labeling. Moreover, one added benefit is that our
RR3131, NC 007416.02) and 1211–1254 kb of RR3131 multiple sgRNAs provide more sequence information than
(1177–1220 kb of RR722, NC 000907 and 1211–1254 kb of motif mapping since they define multiple 20mers instead
RR3131, NC 007416) respectively. If we apply the normal of the same 6–8mer. This will greatly increase the accu-
filter of molecules longer than 150 kb as shown in Figure racy of pinpointing the breakpoints of structural variants
5A, none of the molecules aligns to RR3131 sgRNA map. and other specific genomic features. We have performed
This clearly demonstrated that the custom-designed sgR- in silico mapping of repetitive elements such as ALU and
NAs can uniquely identify the genomic structure of the two SINE-1 in the human genome assembly, and we estimate
strains. that one sgRNA from ALU and one from LINE-1 will re-
sult in ∼90% coverage of the human genome. This cover-
age is similar to that of existing optical mapping schemes
CONCLUSION
with Nt.Bspq1 and DLE labeling offered by Bionano Ge-
Long-read sequencing technologies like Oxford nanopore nomics, although understanding on- and off-target cutting
and Pacific Biosciences can routinely reach an average of by these gRNAs will be complicated. Thus, rational probe
10–30 kb read lengths and can provide assembled hap- design might allow a small number of probes to interro-
lotype structures with N50 exceeding a Megabase and gate long-range haplotype and repeat structures in complex
at single-base resolution (44). Recent advancements with genomes.
DNA preparation and Oxford nanopore can have 50% of Since optical mapping does not rely on reading single
read lengths exceed 100 kb (45) and rare sequences can be base information, the cost of obtaining ultra-long optical
more than a Megabase (45,46); in combination with Pacific reads is likely to remain low, although at the expense of full
Biosciences Sequel2 HiFi reads, this can generate fully con- sequence information. Targeted enrichment of a single 0.3–
tiguous human chromosome sequences (47), albeit still at 1 Mb region for long-read sequencing remains challengingPAGE 9 OF 11 Nucleic Acids Research, 2021, Vol. 49, No. 2 e8
Downloaded from https://academic.oup.com/nar/article/49/2/e8/5999906 by guest on 06 February 2021
Figure 5. Mapping results of RR722 molecules labeled with the 162 sgRNAs (Supplementary Table S2). (A) The lines in the blue bar (designed reference
map of RR722) represent the locations of the 162 sgRNAs on RR722. The yellow lines below the reference are labels with dark green dots representing
where labels matched to the reference and light green dots representing labels not found in the reference. (B) Alignment results to RR3131.
and costly. Our custom-designed optical maps require no SUPPLEMENTARY DATA
target enrichment to define long-distance haplotype struc-
Supplementary Data are available at NAR Online.
ture across target regions while maintaining a low cost at
about $500 per diploid human genome. In targeted optical
mapping, the cost can be further reduced by combining sets ACKNOWLEDGEMENTS
of sgRNAs designed to haplotype different regions. Care-
ful design of sgRNA probes to target repetitive elements We thank Rosemary J. Redfield for bacterial strains.
can further expand coverage and reduce probe costs. Thus, Authors’ contributions: H.A., J.M., D.P., K.R. and D.V. gen-
this expanded flexibility of genome-scale optical mapping erated data. H.A., J.M., D.P., K.R. J.C.M., D.V. and M.X.
shows it can continue to fill an important role for dissect- analyzed data. E.Y., J.C.M. and M.X. wrote the manuscript.
ing complex genomes and genomic variation, as long-read M.X. designed and supervised the project. All authors have
sequencing technologies continue to advance. read and approved the manuscript.
The custom-designed genomic labeling strategies de-
scribed here could find wide applications for analyzing com- FUNDING
plex genomes like humans’, including determining long-
range haplotype structure, higher precision breakpoint call- US National Institutes of Health (NIH) [HG005946, in
ing for complex structural variants, and improved resolu- part]; the funders provided the financial support to the re-
tion of complex repeat arrays. These strategies may also find search but had no role in the design of the study, analysis,
applications in microbial comparative or community anal- interpretations of data and in writing the manuscript. Fund-
yses since one can design gRNAs to identify characteristic ing for open access charge: US National Institutes of Health
markers on large genomic fragments of different microor- (NIH) [HG005946, in part].
ganisms (e.g. pathogenic species) and virulence genes (e.g. Conflict of interest statement. None declared.
antibiotic resistance genes and alleles) (15).
REFERENCES
DATA AVAILABILITY 1. Lam,E.T., Hastie,A., Lin,C., Ehrlich,D., Das,S.K., Austin,M.D.,
Deshpande,P., Cao,H., Nagarajan,N., Xiao,M. et al. (2012) Genome
All additional data is available in the supplementary sec- mapping on nanochannel arrays for structural variation analysis and
tion. sequence assembly. Nat. Biotechnol., 30, 771–776.e8 Nucleic Acids Research, 2021, Vol. 49, No. 2 PAGE 10 OF 11
2. Samad,A., Huff,E.J., Cai,W.W. and Schwartz,D.C. (1995) Optical target-specific fluorescent labeling of double strand DNA for whole
mapping - a novel, single-molecule approach to genomic analysis. genome mapping and structural variation analysis. Nucleic Acids
Genome Res., 5, 1–4. Res., 44, e11.
3. Gillett,W., Hanks,L., Wong,G.K.-S., Yu,J., Lim,R. and 22. McCaffrey,J., Young,E., Lassahn,K., Sibert,J., Pastor,S.,
Olson,M.V.J.G. (1996) Assembly of high-resolution restriction maps Riethman,H. and Xiao,M. (2017) High-throughput single-molecule
based on multiple complete digests of a redundant set of overlapping telomere characterization. Genome Res., 27, 1904–1915.
clones. Genomics, 33, 389–408. 23. Abid,H.Z., McCaffrey,J., Raseley,K., Young,E., Lassahn,K.,
4. Olson,M.V. (1993) The human genome project. PNAS, 90, Varapula,D., Riethman,H. and Xiao,M. (2020) Single-molecule
4338–4344. analysis of subtelomeres and telomeres in Alternative Lengthening of
5. Wong,G.K.-S., Yu,J., Thayer,E.C. and Olson,M.V. (1997) Telomeres (ALT) cells. BMC Genomics, 21, 485.
Multiple-complete-digest restriction fragment mapping: generating 24. Young,E., Abid,H.Z., Kwok,P.Y., Riethman,H. and Xiao,M. (2020)
sequence-ready maps for large-scale DNA sequencing. PNAS, 94, Comprehensive analysis of human subtelomeres by whole genome
5225–5230. mapping. PLoS Genet., 16, e1008347.
6. Jing,J., Reed,J., Huang,J., Hu,X., Clarke,V., Edington,J., 25. Young,E., Pastor,S., Rajagopalan,R., McCaffrey,J., Sibert,J.,
Housman,D., Anantharaman,T.S., Huff,E.J. and Mishra,B. (1998) Mak,A.C.Y., Kwok,P.-Y., Riethman,H. and Xiao,M. (2017)
Automated high resolution optical mapping using arrayed, fluid-fixed High-throughput single-molecule mapping links subtelomeric
Downloaded from https://academic.oup.com/nar/article/49/2/e8/5999906 by guest on 06 February 2021
DNA molecules. PNAS, 95, 8046–8051. variants and long-range haplotypes with specific telomeres. Nucleic
7. Church,D.M., Goodstadt,L., Hillier,L.W., Zody,M.C., Goldstein,S., Acids Res., 45, e73.
She,X., Bult,C.J., Agarwala,R., Cherry,J.L. and DiCuccio,M.J. 26. Muller,V., Rajer,F., Frykholm,K., Nyberg,L.K., Quaderi,S.,
(2009) Lineage-specific biology revealed by a finished genome Fritzsche,J., Kristiansson,E., Ambjornsson,T., Sandegren,L. and
assembly of the mouse. PLoS Biol., 7, e1000112. Westerlund,F. (2016) Direct identification of antibiotic resistance
8. Wu,C.-W., Schramm,T.M., Zhou,S., Schwartz,D.C. and Talaat,A.M. genes on single plasmid molecules using CRISPR/Cas9 in
(2009) Optical mapping of the Mycobacterium avium subspecies combination with optical DNA mapping. Sci. Rep., 6, 37938.
paratuberculosis genome. BMC Genomics, 10, 25. 27. Fleischmann,R.D., Adams,M.D., White,O., Clayton,R.A.,
9. Zhou,S., Wei,F., Nguyen,J., Bechner,M., Potamousis,K., Kirkness,E.F., Kerlavage,A.R., Bult,C.J., Tomb,J.-F., Dougherty,B.A.
Goldstein,S., Pape,L., Mehan,M.R., Churas,C. and Pasternak,S. and Merrick,J.M. (1995) Whole-genome random sequencing and
(2009) A single molecule scaffold for the maize genome. PLos Genet., assembly of Haemophilus influenzae Rd. Science, 269, 496–512.
5, e1000711. 28. Hong,W., Mason,K., Jurcisek,J., Novotny,L., Bakaletz,L.O. and
10. Dong,Y., Xie,M., Jiang,Y., Xiao,N., Du,X., Zhang,W., Swords,W.E. (2007) Phosphorylcholine decreases early inflammation
Tosser-Klopp,G., Wang,J., Yang,S. and Liang,J. (2013) Sequencing and promotes the establishment of stable biofilm communities of
and automated whole-genome optical mapping of the genome of a nontypeable Haemophilus influenzae strain 86-028NP in a chinchilla
domestic goat (Capra hircus). Nat. Biotechnol., 31, 135–141. model of otitis media. Infect. Immun., 75, 958–965.
11. Latreille,P., Norton,S., Goldman,B.S., Henkhaus,J., Miller,N., 29. Gagnon,J.A., Valen,E., Thyme,S.B., Huang,P., Ahkmetova,L.,
Barbazuk,B., Bode,H.B., Darby,C., Du,Z. and Forst,S. (2007) Pauli,A., Montague,T.G., Zimmerman,S., Richter,C. and Schier,A.F.
Optical mapping as a routine tool for bacterial genome sequence (2014) Efficient mutagenesis by Cas9 protein-mediated
finishing. BMC Genomics, 8, 321. oligonucleotide insertion and large-scale assessment of single-guide
12. Teague,B., Waterman,M.S., Goldstein,S., Potamousis,K., Zhou,S., RNAs. PLoS One, 9, e98186.
Reslewic,S., Sarkar,D., Valouev,A., Churas,C. and Kidd,J.M. (2010) 30. Frazer,K.A., Ballinger,D.G., Cox,D.R., Hinds,D.A., Stuve,L.L.,
High-resolution human genome structure by single-molecule Gibbs,R.A., Belmont,J.W., Boudreau,A., Hardenbol,P., Leal,S.M.
analysis. PNAS, 107, 10848–10853. et al. (2007) A second generation human haplotype map of over 3.1
13. Chaisson,M.J.P., Sanders,A.D., Zhao,X., Malhotra,A., Porubsky,D., million SNPs. Nature, 449, 851–861.
Rausch,T., Gardner,E.J., Rodriguez,O.L., Guo,L., Collins,R.L. et al. 31. Xiao,M., Wan,E., Chu,C., Hsueh,W.-C., Cao,Y. and Kwok,P.-Y.
(2019) Multi-platform discovery of haplotype-resolved structural (2009) Direct determination of haplotypes from single DNA
variation in human genomes. Nat. Commun., 10, 1784. molecules. Nat. Methods, 6, 199–201.
14. Levy-Sakin,M., Pastor,S., Mostovoy,Y., Li,L., Leung,A.K.Y., 32. Nagarajan,N., Read,T.D. and Pop,M. (2008) Scaffolding and
McCaffrey,J., Young,E., Lam,E.T., Hastie,A.R., Wong,K.H.Y. et al. validation of bacterial genome assemblies using optical restriction
(2019) Genome maps across 26 human populations reveal maps. Bioinformatics, 24, 1229–1235.
population-specific patterns of structural variation. Nat. Commun., 33. Mell,J.C., Lee,J.Y., Firme,M., Sinha,S. and Redfield,R.J. (2014)
10, 1025. Extensive cotransformation of natural variation into chromosomes of
15. Bogas,D., Nyberg,L., Pacheco,R., Azevedo,N.F., Beech,J.P., naturally competent Haemophilus influenzae. G3: Genes Genomes
Gomila,M., Lalucat,J., Manaia,C.M., Nunes,O.C., Tegenfeldt,J.O. Genetics, 4, 717–731.
et al. (2017) Applications of optical DNA mapping in microbiology. 34. Mell,J.C., Shumilina,S., Hall,I.M. and Redfield,R.J. (2011)
BioTechniques, 62, 255–267. Transformation of natural genetic variation into Haemophilus
16. Lukinavicius,G., Lapiene,V., Stasevskij,Z., Dalhoff,C., Weinhold,E. influenzae genomes. PLoS Pathog., 7, e1002151.
and Klimasauskas,S. (2007) Targeted labeling of DNA by 35. Poje,G. and Redfield,R.J. (2003) General methods for culturing
methyltransferase-directed transfer of activated groups (mTAG). J. Haemophilus influenzae. Methods Mol. Med., 71, 51–56.
Am. Chem. Soc., 129, 2758–2759. 36. Poje,G. and Redfield,R.J. (2003) Transformation of Haemophilus
17. Xiao,M., Phong,A., Ha,C., Chan,T.F., Cai,D.M., Leung,L., Wan,E., influenzae. Methods Mol. Med., 71, 57–70.
Kistler,A.L., DeRisi,J.L., Selvin,P.R. et al. (2007) Rapid DNA 37. Mak,A.C.Y., Lai,Y.Y.Y., Lam,E.T., Kwok,T.-P., Leung,A.K.Y.,
mapping by fluorescent single molecule detection. Nucleic Acids Res., Poon,A., Mostovoy,Y., Hastie,A.R., Stedman,W., Anantharaman,T.
35, e16. et al. (2016) Genome-wide structural variation detection by genome
18. Feuk,L., Carson,A.R. and Scherer,S.W. (2006) Structural variation in mapping on nanochannel arrays. Genetics, 202, 351–362.
the human genome. Nat. Rev. Genet., 7, 85–97. 38. McVean,G.A., Altshuler,D.M., Durbin,R.M., Abecasis,G.R.,
19. Demaerel,W., Mostovoy,Y., Yilmaz,F., Vervoort,L., Pastor,S., Bentley,D.R., Chakravarti,A., Clark,A.G., Donnelly,P., Eichler,E.E.,
Hestand,M.S., Swillen,A., Vergaelen,E., Geiger,E.A., Coughlin,C.R. Flicek,P. et al. (2012) An integrated map of genetic variation from
et al. (2019) The 22q11 low copy repeats are characterized by 1,092 human genomes. Nature, 491, 56–65.
unprecedented size and structural variability. Genome Res., 29, 39. Sudmant,P.H., Rausch,T., Gardner,E.J., Handsaker,R.E.,
1389–1401. Abyzov,A., Huddleston,J., Zhang,Y., Ye,K., Jun,G., Hsi-Yang
20. Tringe,S.G., Von Mering,C., Kobayashi,A., Salamov,A.A., Chen,K., Fritz,M. et al. (2015) An integrated map of structural variation in
Chang,H.W., Podar,M., Short,J.M., Mathur,E.J. and Detter,J.C. 2,504 human genomes. Nature, 526, 75–81.
(2005) Comparative metagenomics of microbial communities. 40. Anderson,E.M., Haupt,A., Schiel,J.A., Chou,E., Machado,H.B.,
Science, 308, 554–557. Strezoska,Z., Lenger,S., McClelland,S., Birmingham,A.,
21. McCaffrey,J., Sibert,J., Zhang,B., Zhang,Y.G., Hu,W.H., Vermeulen,A. et al. (2015) Systematic analysis of CRISPR–Cas9
Riethman,H. and Xiao,M. (2016) CRISPR-CAS9 D10A nickasePAGE 11 OF 11 Nucleic Acids Research, 2021, Vol. 49, No. 2 e8
mismatch tolerance reveals low levels of off-target activity. J. 44. Amarasinghe,S.L., Su,S., Dong,X., Zappia,L., Ritchie,M.E. and
Biotechnol., 211, 56–65. Gouil,Q. (2020) Opportunities and challenges in long-read
41. Cho,S.W., Kim,S., Kim,Y., Kweon,J., Kim,H.S., Bae,S. and Kim,J.S. sequencing data analysis. Genome Biol., 21, 30.
(2014) Analysis of off-target effects of CRISPR/Cas-derived 45. Jain,M., Koren,S., Miga,K.H., Quick,J., Rand,A.C., Sasani,T.A.,
RNA-guided endonucleases and nickases. Genome Res., 24, 132–141. Tyson,J.R., Beggs,A.D., Dilthey,A.T., Fiddes,I.T. et al. (2018)
42. Mali,P., Aach,J., Stranges,P.B., Esvelt,K.M., Moosburner,M., Nanopore sequencing and assembly of a human genome with
Kosuri,S., Yang,L.H. and Church,G.M. (2013) CAS9 transcriptional ultra-long reads. Nat. Biotechnol., 36, 338–345.
activators for target specificity screening and paired nickases for 46. Payne,A., Holmes,N., Rakyan,V. and Loose,M. (2018) BulkVis: a
cooperative genome engineering. Nat. Biotechnol., 31, 833–838. graphical viewer for Oxford nanopore bulk FAST5 files.
43. Zhang,Y.L., Ge,X.L., Yang,F.Y., Zhang,L.P., Zheng,J.Y., Tan,X.F., Bioinformatics, 35, 2193–2198.
Jin,Z.B., Qu,J. and Gu,F. (2014) Comparison of non-canonical PAMs 47. Miga,K.H., Koren,S., Rhie,A., Vollger,M.R., Gershman,A.,
for CRISPR/Cas9-mediated DNA cleavage in human cells. Sci. Rep., Bzikadze,A., Brooks,S., Howe,E., Porubsky,D., Logsdon,G.A. et al.
4, 5405. (2020) Telomere-to-telomere assembly of a complete human X
chromosome. Nature, 585, 79–84.
Downloaded from https://academic.oup.com/nar/article/49/2/e8/5999906 by guest on 06 February 2021You can also read