Road Safety Framework for Wales - July 2013 - GOV.WALES
←
→
Page content transcription
If your browser does not render page correctly, please read the page content below
Road Safety Framework for Wales
                       July 2013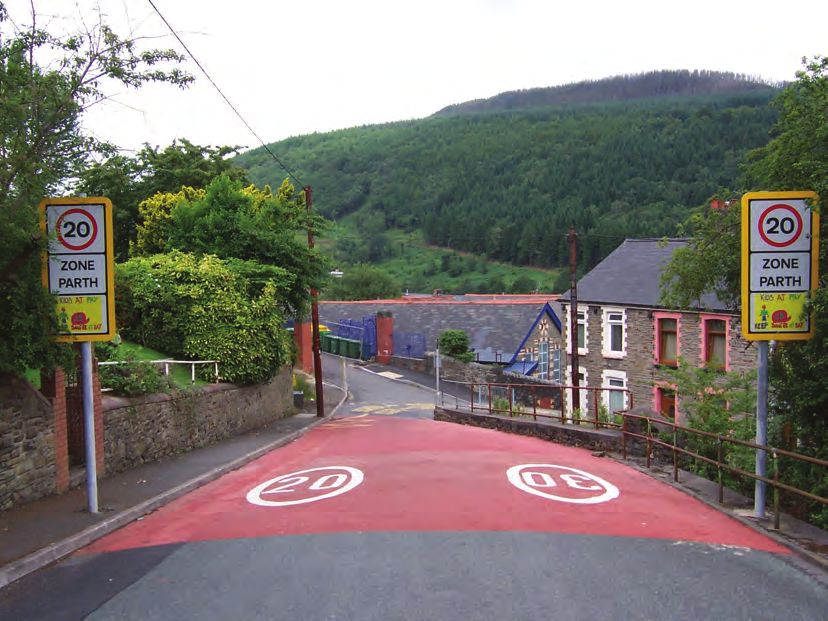
© Crown copyright 2013
WG19278 / G/MH/4871 / 0713
Contents

Foreword from the Minister for Economy, Science and Transport

1.   Introduction                                               1
     What outcome do we want?
     How do we want to achieve this?
     Current situation

2.   Vulnerable Groups                                          9
     Motorcyclists
     Young people
     Older drivers
     Children
     Pedestrians
     Cycling
     Active Travel
     Poverty
     Driving for Work
     Equestrianism
     Road workers

3.   Collision Causation                                        16
     Drink and drug driving
     Speed
     Careless driving and distraction

4.    Safer Roads                                               20
     Route analysis
     Passive safety

5.   How do we deliver effective road safety?                   24
     Who are our partners?
     Working flexibly
     The Strategic Framework for Road Safety
     Outcome-based approach
     Evidence and evaluation
     Joint delivery
     Governance
6.    Present and Future Funding Arrangements   29

Annex A – Targets to 2020
Annex B – Results Based Accountability Model
Annex C – Governance Structure
Annex D – Summary of Actions

Foreword from the Minister for Economy, Science and Transport

Road traffic injuries happen every day on Welsh roads. They can potentially have
tragic consequences for those involved and their families, but are almost entirely
avoidable. I believe that we all have a responsibility to try and stop these
unnecessary deaths and injuries.

Wales’ roads are amongst the safest in the world and we can all be rightly proud of
this. However, I do not think that we should settle for what has been achieved to
date. That is why I am pleased to publish this Road Safety Framework for Wales.
The Framework sets out the Welsh Government’s priorities for road safety and
focuses on casualty reduction, which should be at the heart of all road safety
interventions.

I want all partners who are concerned with road safety to share in this Framework
and work towards achieving the objectives within it. Working together I believe we
can improve upon the progress made and ensure that everyone is safe on Welsh
roads.

Edwina Hart MBE CStJ AM
Minister for Economy, Science and Transport
1.      Introduction

1.     Any death or serious injury on Welsh roads should be avoidable. Nobody
should assume that such incidents are an inevitable consequence of road transport,
and all members of society have a contribution to make to reduce the likelihood of
road traffic collisions. Each collision can potentially have tragic consequences for
those involved and their families, and the economic impact is also well documented 1 .

2.     The Welsh Government is committed to improving road safety and reducing
the number of people killed and seriously injured on Welsh roads. The Programme
for Government includes a commitment to “target high-risk road users (motorcyclists,
young drivers and vulnerable road users) through a combination of measures
including education, engineering and enforcement” 2 , and the National Transport Plan
states that we will “continue to improve the safety of the road network, with special
emphasis on reducing casualty rates of vulnerable users” 3 .

3.    We are also committed to tackling poverty 4 – understanding the links between
road casualties and social deprivation, and seeking to address this.

4.    There has been a great deal of progress in road safety in recent years, with
the number of people killed and seriously injured falling considerably. However, we
must avoid complacency and recognise that there is significant scope for further
improvements.

5.     We have developed the Road Safety Framework for Wales with the
assistance of partners – taking their views on board and drawing on their expertise.
We want this document to help all partners to deliver effective road safety
interventions and target the right areas, in the right way, to reduce deaths and
serious injuries in particular.

What do we want to achieve?

6.     The outcome we want to see is that all people are safe on Welsh roads. We
believe that all road safety activity undertaken by the Welsh Government and all
partners should be concerned with achieving this outcome.

7.      Our vision is:

          “A continued reduction in the number of people killed and
          seriously injured on Welsh roads, with the ultimate aspiration of
          no fatalities.”

1
  The Accident Sub-Objective: TAG Unit 3.4.1, Department for Transport, April 2011 and ‘A valuation of road
accidents and casualties in Great Britain in 2010’ in “Reported Road Casualties in GB: 2010 Annual Report”
Department for Transport, September 2011
2
  http://wales.gov.uk/about/programmeforgovernment/?lang=en
3
  http://wales.gov.uk/topics/transport/publications/ntp/?lang=en
4
  http://wales.gov.uk/topics/socialjustice/publications/tacklepovactionplan

                                                     1
8. It may be unrealistic to achieve zero fatalities, but we should aspire to tackle
avoidable deaths such as road traffic collisions and do all that we can to avert them.
9. This is not a target for casualty reduction and should not be considered as
such. It reflects our view that road deaths should not be an acceptable consequence
of travel. We view this ambitious vision as an acknowledgement of this and want all
key partners to share in and work towards making it a reality.
How do we want to achieve this?
10. The most useful measure of progress in road safety is the number of people
killed or seriously injured on Welsh roads.
11. We believe that targets in respect of road casualty reduction are the right way
to measure achievements. A target-driven approach to road safety has become
commonplace in recent years. People are familiar with this approach and there is
national and international evidence that points to success.
12. Targets allow us to gauge progress over time towards our collective
objectives and help to ensure accountability for public monies spent towards the
achievement of these objectives. They also ensure that funding is focused in specific
areas and on specific high risk groups.
13. There is widespread support for the principle of targets amongst our road
safety partners, and we consider them to be challenging but achievable. We want all
partners to focus on contributing to their success.
14. Our proposed targets, compared to the average figures for Wales between
2004-08, are:
i. A 40% reduction in the total number of people killed and
seriously injured on Welsh roads by 2020, meaning 562 fewer
killed and seriously injured casualties.
ii. A 25% reduction in the number of motorcyclists killed and
seriously injured on Welsh roads by 2020, meaning 64 fewer
motorcyclist killed and seriously injured casualties.
iii. A 40% reduction in the number of young people 5 (aged 16-24) killed
and seriously injured on Welsh roads by 2020, meaning 139 fewer
young people killed and seriously injured casualties.
15. We are targeting the total killed and seriously injured figure because it is
important that all partners focus road safety activity on reducing these casualties for
all road users. We have included specific targets for motorcyclists and young people
because they are two of the most high risk groups of road users. The problems in
respect of these groups are Wales-wide and broadly prevalent in all regions.
5
By ‘young people’ we mean all 16-24 year olds killed or seriously injured on the roads, including drivers,
passengers, pedestrians, cyclists and motorcyclists. Broadly, all road users in this age group are
disproportionately at risk of becoming involved in a road traffic collision.
216. The rationale behind these targets and indicators of interim progress towards
successfully meeting them are at Annex A.
17. We will review progress towards the achievement of these targets in 2016 to
ascertain the likelihood of success. If we are well on course to meet the targets, we
will consider increasing the percentage casualty reduction we want to achieve.
18. We are not advocating the abandonment of spending on all other areas of
road safety, but we expect all partners to focus on casualty reduction, and to
consider what specific interventions will support these targets. It is appropriate that
funding is directed to where the statistical and research evidence shows that it is
needed most.
Casualty Data
19. Data on road casualties is derived from Stats19 forms completed by the police
following road traffic collisions.
20. During the consultation on this document a number of respondents expressed
reservations about accuracy of this data and the potential impact this has on the
targets we are setting and wider analysis of road casualty statistics.
21. We know that there have been some issues and discrepancies with the data
in recent years. We also acknowledge the operational difficulties the police face in
collecting and verifying this information, although it is imperative that this is carried
out.
22. We are committed to working with the police, NHS Cymru and other partners
to ensure that data is accurate and we can all have confidence in it.
Current Situation
23. The previous targets for road casualty reduction were set in 2000. Figure 1
shows that by 2010 we had achieved and exceeded these targets, and this
demonstrates the progress that has been made in road safety.
Figure 1 – Casualty targets to 2010 and achievements
Classification 2010 Target Achievement
Total number of killed or seriously injured 40% reduction* 46% reduction*
Total number of children killed or seriously 50% reduction* 63% reduction*
injured
Slight casualties per 100 million vehicle 10% reduction* 40% reduction*
kilometres travelled
*than the average for 1994-98 baseline.
3Figure 2 – Index of casualties by severity, Wales 1994-2011
120
100
80
1994-98 average = 100
60
40
1994-98 average
Slightly injured
20
Seriously injured
Killed
0
1994
1995
1996
1997
1998
1999
2000
2001
2002
2003
2004
2005
2006
2007
2008
2009
2010
2011
24. We cannot collectively settle for the improvements that have been made.
Figure 2 illustrates the progress that has been made across all types of casualties,
but also highlights the significant remaining numbers of casualties and the further
scope for improvements.
Figure 3 - Proportion of total KSI casualties by broad groupings of contributory
factors (CFs) associated with the road traffic collisions, Wales 2011
Error! Not a valid link.
25. Figure 3 demonstrates that poor observation or driving were the most
important causation factors that led to collisions. This data, which is derived and
interpreted from Stats19 forms, does not necessarily give a full picture of all factors
that led to a collision. For example, without witnesses it can be impossible to know
whether someone was looking at their mobile phone or how fast they were going.
However, this does show us that human error is often the cause of collisions. We
must examine how we can best prevent mistakes occurring, or mitigate the
consequences, through education, training, engineering and enforcement.
4Figure 4 – Rate of KSI casualties by age band and type of casualty: All casualties:
Wales 2011
60
KSI casualties per 100,000 population
Car, taxi and minibus users
50 TWMV users
Pedestrian
40 Pedal cyclist
30
20
10
0
80 or over
0-4
5 to 7
8 to 11
12 to 15
16 to 19
20 to 24
25 to 29
30 to 34
35 to 39
40 to 44
45 to 49
50 to 54
55 to 59
60 to 64
65 to 69
70 to 74
75 to 79
Age band
26. Figure 4 highlights the hugely disproportionate number of young people
injured in road traffic collisions compared to other age groups, particularly in cars. It
also shows the rise in casualty rates as people grow older, and the increased
likelihood of two-wheeled motor vehicle (TWMV) casualties when people initially
pass their test and during middle age.
52. High Risk and Vulnerable Groups
27. Discrete high risk and vulnerable groups should be specifically targeted by
road safety interventions to reduce the number of collisions they are involved in.
28. We have made the distinction between high risk and vulnerable groups
because motorcyclists and young people are at disproportionate statistical risk
compared to others.
29. In this section we have identified some of those groups and the actions we
believe are necessary to reduce vulnerability and casualties. We recognise that
those groups considered ’high risk’ or ‘vulnerable’ can change over time, but it is
likely that the groups identified will continue to warrant attention.
30. The actions within this document are not exhaustive.
High Risk Groups
Motorcyclists
31. In 2011, despite only accounting for 1% of the road traffic in Wales,
motorcyclists account for 37% of those killed or seriously injured in motor vehicle
road traffic collisions. This fact alone highlights the importance of trying to reduce the
number of collisions involving motorcyclists.
32. Although motorcyclist casualties have reduced in the last decade, they have
not seen the significant falls of other road user groups. Clearly motorcyclists are
physically more vulnerable than car users, but even taking this into account the
statistics are worrying.
33. Motorcyclists are not necessarily at fault for collisions they are involved in, but
their vulnerability means that they are far more likely to be seriously injured.
34. Whilst a diverse range of motorcyclists are involved in collisions, a
disproportionate number of these casualties are men, riding on rural roads in the
drier months6 . To achieve the significant improvements we want, it is important to
specifically target this group.
35. There are a significant number of young motorcyclist casualties – 16-19 year
olds are the second largest group of motorcyclist casualties by age.
36. Currently, a large amount of work is done by a number of agencies to try and
reduce motorcyclist casualties. The Welsh Government provides funding for
advanced rider courses, publicity and enforcement across Wales. It is important to
understand the existing activities that are having a positive effect on rider behaviour
and whether they are targeting the right groups of riders who are those more likely to
be involved in collisions.
6
‘Motorcyclist Casualties 2011’, Welsh Government
6We will:
i. Introduce a specific target for a 25% reduction in the number of
motorcyclists killed or seriously injured by 2020.
ii. Consider the needs and vulnerabilities of motorcyclists when
designing new roads and implementing safety features on existing
roads.
iii. Continue to support interventions to achieve reductions in
motorcyclist casualties.
iv. Monitor the casualty trends amongst different age groups, types of
riders and the nature of collisions, and make subsequent
recommendations to target interventions appropriately.
We expect our partners to:
v. Seek to engage with ‘hard to reach’ motorcyclists, who are
potentially more at risk. As a first step, we expect partners to
communicate with representatives of motorcycling groups and try to
understand what actions will be most effective.
vi. Evaluate the effectiveness of existing activities and build evaluation
into any new activities that are developed.
vii. Consider which communication methods are most appropriate for
engaging with motorcyclists (whilst acknowledging the broad
spectrum of people riding bikes) and ensure that these methods are
adopted across Wales.
viii. Highlight the vulnerable nature of motorcyclists to drivers.
ix. Consider the needs and vulnerabilities of motorcyclists when
designing new roads and implementing safety features on existing
roads.
x. Specifically target enforcement at those riders who break the law.
Young Drivers and Passengers 7 (16-24 years old)
37. Young drivers are disproportionately at risk of being killed or seriously injured
on the roads and are the most at-risk age group (see Figure 4), making up 11% of
driving licence holders but 23% of casualties in 2011.
38. It is encouraging that the number of young drivers involved in collisions has
fallen significantly over the last decade (by 41% in 2011, based on the 1994-98
average). However, young people continue to be at proportionately greater risk than
any other age group.
39. Evidence suggests that young people are more likely to be involved in a
collision during the first six months after they pass their test due to a lack of
experience.
7
Our target of a 40%reduction in young people fatal and serious injuries on the roads also includes other types
of young road users, who are covered elsewhere in this document.
740. Young drivers are more inclined to drive inappropriately because of a lack of
experience, when their peers are in the vehicle and/or at night time. Some have
advocated the introduction of Graduated Driver Licensing – adding an intermediate
phase between learner and full licences with potential restrictions to include
passengers, night driving and engine size.
41. Young passengers should be able to distinguish between good and bad
driving amongst their peers and make educated choices about who they travel with.
42. There is evidence to suggest that targeting learner and pre-learner drivers
through education and training can help people develop better driving habits. We
recognise the potential value of the learning and the impact it could have on young
driver casualties, but we are also aware of the difficulties road safety professionals
face in gaining access to this group through schools.
43. The Welsh Government currently supports a number of young driver
interventions, including subsidising Pass Plus Cymru which is a voluntary post-test
course involving practical and theoretical teaching. We also support targeted social
and mainstream media campaigns through local authorities.
We will:
i. Introduce a specific target for a 40% reduction in the number of
young people killed or seriously injured in road traffic collisions by
2020.
ii. Support local authorities and other bodies to help them gain access
to young people through schools.
iii. Examine the case for Graduated Driver Licensing in the context of
devolved powers.
iv. Engage with the insurance industry to explore incentivisation, the
growing use of in-car technology and the best ways to reduce the
risk of collisions.
v. Continue to support interventions that are proven to achieve
reductions in young people casualties.
vi. Evaluate the effectiveness of Pass Plus Cymru and make any
necessary changes to the scheme as a result.
We expect our partners to:
vii. Specifically target young people in terms of education and, if appropriate,
enforcement.
viii. Evaluate the effectiveness of their young driver interventions and ensure
that they are communicating with this group in the best way.
ix. Target young passengers through education and publicity.
8Vulnerable Groups
Older Drivers (70+ years old)
44. Wales has, and is projected to continue to have, the most aged population in
the UK. This causes a number of challenges, including implications for road safety.
Research shows that driving performance does reduce with increasing age, but that
this is only significant over 80 years old 8 .
45. The proportion of older drivers is rising and has not seen comparable
reductions in casualties that other groups have 9 .
46. Older drivers have often held their licence for many years and the vast
majority will not have undertaken any further training since passing their test, despite
significant changes in driving conditions and, potentially, their own ability.
47. Many older drivers will effectively self-regulate their driving as they get older –
avoiding certain locations and not driving at certain times of the day/night.
48. However, there are proactive things we should do to help older drivers retain
the independence a car gives them, whilst also ensuring that those continuing to
drive do so safely. The Welsh Government currently funds older driver assessment
schemes which aim to support this.
We will:
i. Continue to support initiatives that target older drivers through
voluntary training and ensure the take-up is maximised.
ii. Seek to identify best practice amongst the existing older driver
training schemes and recommend a consistent approach across
Wales.
We expect partners to:
iii. Specifically target older drivers through education.
iv. Work with the voluntary sector representing the elderly and training
providers to ensure that training is available for older people and
properly evaluated to establish whether it is fit for purpose.
Children
49. Children are potentially amongst the most vulnerable road users because of
their age and lack of experience in certain situations.
8
The Ageing Driver, Department for Transport, Research Compendium 2004/5
9
http://wales.gov.uk/topics/statistics/headlines/transport2012/120703/?lang=en
950. There has been a considerable reduction in the number of children being
killed and seriously injured in Wales in the last decade. Whilst this is very positive,
there is much that can be done to achieve further reductions.
51. The value of road safety education for children is well-documented, but we
also want to ensure that the resources invested are achieving their objectives
through robust evaluation.
52. The Welsh Government provides funding for numerous interventions,
including Kerbcraft which is delivered across Wales and designed to teach 5 to 7
year olds pedestrian skills through practical road-side training.
53. We recognise the importance of having safe school transport for all learners.
The safety record of dedicated school transport in Wales is very good – we must
work to ensure that this remains the case.
54. Whilst a great deal of road safety education is delivered in primary schools,
relatively little is done in secondary schools with those aged between 11-15 years
old.
We will:
i. Continue to fund education programmes for children that are proven to
work.
ii. Proceed with the introduction of compulsory seatbelts on all dedicated
school transport in Wales by October 2014. As well as consider the
introduction of statutory risk assessment for all school routes.
iii. Support efforts to target 11-15 year olds with road safety education.
We expect partners to:
iv. Develop and share best practice in respect of education programmes
and activities, and collaborate with one another to ensure a
consistency of approach where appropriate.
v. Look for evidence of best practice across the UK and adopt a proven
approach where applicable.
Pedestrians
55. The total number of pedestrian casualties has declined in recent years, but
their vulnerability means they are more than twice as likely as car occupants to be
killed or seriously injured when an incident occurs. Pedestrians accounted for 21% of
those killed or seriously injured on the roads in 2011.
56. The risk of being killed or seriously injured as a pedestrian is highest amongst
those aged 8-15. This risk then drops with age until rising sharply in those aged 75
and over.
1057. The Welsh Government is committed to increasing the number of people
walking because of the health and environmental benefits this can bring.
58. Pedestrians under the influence of alcohol are more likely to make errors of
judgement and to behave in a manner that leads them to become involved in, or to
cause, a road traffic accident. In 2011, 29% of fatal pedestrian casualties were
impaired by alcohol, with those aged between 16 and 29 years old most at risk.
59. Research shows that reducing speed on the roads dramatically reduces the
severity of collisions and encourages more people to walk. There are approximately
560 20mph speed limits and zones in Wales, many of which have been funded by
the Welsh Government.
We will:
i. Continue to provide funding to improve infrastructure to promote
and encourage walking safely.
ii. Monitor statistical information to ascertain whether alcohol
impairment continues to be a significant and increasing contributory
factor in pedestrian casualties, and consider what action can be
taken to prevent this.
We expect partners to:
iii. Consider introducing 20mph schemes where there is evidence to
support them.
iv. Make links with public health and charitable bodies that are
concerned with alcohol-related issues and assess the ways in
which we can work with them to reduce road casualties amongst
pedestrians impaired by alcohol.
Cycling
60. The number and severity of collisions involving cyclists rose significantly in
Wales in 2011. Whilst we should not look at a single year in isolation, this is
disappointing and we must work to reduce this.
61. Research shows that reducing speed on the roads dramatically reduces the
severity of collisions and encourages more people to cycle.
We will:
i. Continue to provide funding to improve infrastructure to promote
and encourage cycling safely.
ii. Analyse the collisions involving cyclists and ascertain whether there
are any underlying similarities, and take appropriate action as a
result.
iii. Continue to support children’s cycle training and consider whether
there is an evidence-base to support more adult cycle training.
11We expect partners to:
iv. Consider introducing 20mph schemes where there is evidence to
support them.
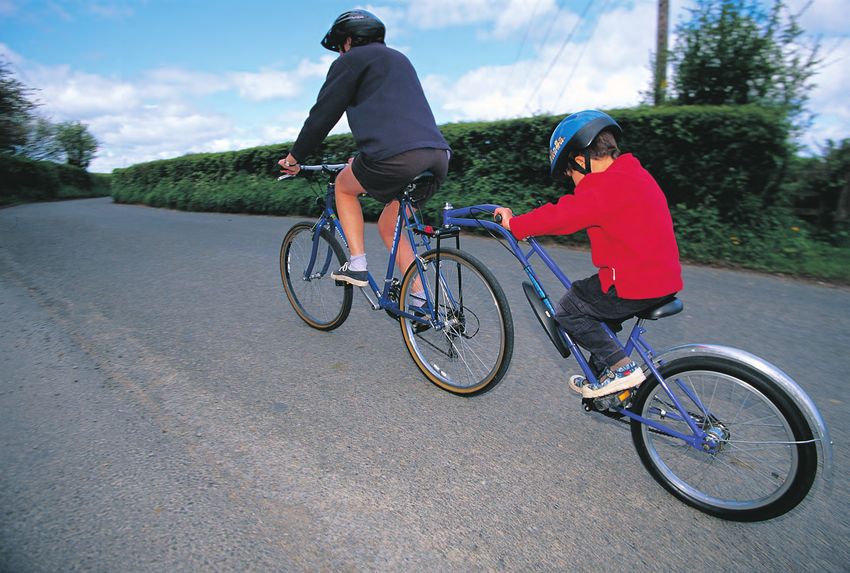
Active Travel
62. Walking and cycling are collectively termed ‘active travel’. We are committed
to increasing active travel, but understand that this potentially carries with it a greater
risk of involvement in a road traffic collision.
63. We want to minimise this risk by ensuring that there is appropriate
infrastructure in place to promote active travel in a safe environment.
We will:
i. Introduce the Active Travel Bill that will look to encourage people to
walk and cycle more regularly, placing a duty on local authorities to
map safe and appropriate walking and cycling routes, make
enhancements for pedestrians and cyclists as part of new road
schemes and make continuous improvements in walking and
cycling. The Bill will also consider the safety implications and the
infrastructure that must also be in place to support this.
ii. Develop design guidance for walking and cycling infrastructure.
This will become the standard which we will use and encourage
local authorities to also adopt the guidance.
Deprived communities
64. Although we have seen a significant reduction in the number of children
involved in road traffic collisions, research suggests that child pedestrians from the
lowest socio-economic groups are over four times more likely to be killed or seriously
injured on the roads. Up to 36% of collisions occurred in the most deprived areas of
Wales in 2011.
65. Around three-quarters of children involved in collisions in deprived areas lived
in those areas and were close to their homes. The majority of child pedestrian
collisions take place away from schools.
66. The Welsh Government is committed to tackling poverty and child poverty,
and to improving the lives of people living in poverty, as set out in the Tackling
Poverty Action Plan.
67. We have provided local authorities with over £36 million through the Safe
Routes in Communities Grant which aims to improve accessibility and safety in
communities, and many schemes concerned with ensuring children can walk or
cycle to school safely.
12We will:
i. Adapt the Safe Routes in Communities Grant assessment criteria to
specifically target areas of social deprivation to support work in
communities where it is needed most.
ii. Ensure that the Active Travel Bill contributes to addressing poverty
by offering people a viable and cheaper alternative to private
transport.
iii. Specifically analyse statistical information on collisions in deprived
communities and use this information to inform the action we will
take.
We expect partners to:
iv. Allocate greater resources to deprived communities if there are
more casualties occurring in these areas and/or amongst people
who reside in these areas.
Driving for Work
68. Between a quarter and a third of all road deaths and injuries are incurred
during work time. There is evidence that more workers are killed in at-work road
collisions than in all other occupational accidents 10 .
69. Employers have a legal duty of care for employees and can be prosecuted for
road traffic collisions that occur on work-related journeys. They should seek to
minimise the risk to their workforce through their health and safety frameworks, risk
assessment and any other practical measures that ensure road safety is actively
championed.
70. Research suggests that car drivers with a higher proportion of journeys as
part of work have a greater risk of injury collisions than other drivers of similar age,
gender, annual mileage and percentage of mileage done on motorways. This is due
to a susceptibility to fatigue and drowsiness, driving under time pressure and
conducting potentially distracting in-car tasks such as eating and drinking.
We will:
i. Work with employers and other organisations to highlight the risks
of ‘at work’ road collisions.
ii. Promote the importance of managing occupational road risk and
ensure that the Welsh Government’s policies and procedures are
robust.
iii. Engage with road user and safety organisations to encourage the
management of occupational road risk.
10
Safety Culture and Work-Related Road Accidents, Department for Transport, 2004
13iv. Facilitate the establishment of a driving for work forum for
companies with large numbers of drivers and trade organisations.
We expect partners to:
v. Adopt robust occupational road risk policies.
Equestrian road users
71. Horses and their riders (as well as carriage drivers) are vulnerable on the road
network. A collision between a horse and a vehicle can have life threatening
consequences for the horse, rider and those in a vehicle.
72. There is evidence to suggest that the number of road traffic collisions
involving horses is underreported in casualty data 11 .
73. Horse riding is more prevalent (particularly on roads) in certain parts of the
country. Rural areas have larger numbers of horse riders, who make a significant
contribution to the rural economy.
We will:
i. Work with representatives of the horse riding community to
understand their road safety concerns and facilitate engagement
with other partners.
We expect partners to:
ii. Actively engage with the horse riding community and consider
whether any road safety interventions should be introduced, where
there are significant numbers of horse riders and/or road traffic
collision involving horses.
Road Workers
74. There are many people working directly on Welsh roads everyday, including
construction and road maintenance workers, breakdown services and emergency
services.
75. Between 2005 and 2011 15 people were killed or seriously injured whilst
working on a Welsh motorway or A road.
76. The Highways Agency in England has established the Road Workers Safety
Forum which includes key stakeholders.
11
NHS data suggests that there are significantly more horse riding road collisions than is recorded in Stats 19
data.
14We will
i. Continue to participate in Road Workers Safety Forum and share
research studies and examples of good practice.
ii. Consider replicating the Road Workers Safety Forum model at a
Welsh level to provide similar benefits and initiatives aimed at
reducing the risk to road workers both on our own networks and as
examples of good / best practice on local networks.
iii. Work closely with our own supply chains to encourage a risk
managed approach to activities undertaken on our behalf.
153. Collision Causation
77. More than half of all road deaths are associated with one or more of the
following causation factors.
Drink and Drug Driving
78. In 2011, around a third of car drivers killed in road collisions on Welsh roads
were over the drink drive limit, whilst for every seven collisions where the driver was
impaired by alcohol, there was around one collision where he/she was ‘impaired by
drugs’, both illegal and medicinal.
79. There have been substantial reductions in the number of people convicted of
drink driving in the last 20 years, as it has become more socially unacceptable
amongst the majority of the population. The work of drink drive campaigns and
enforcement play a significant role in this.
80. However, there remains a significant minority who break the law, putting
themselves and others at risk. There is no evidence that this minority tend to drink
drive during certain periods of the year
81. The Welsh Government is, in principle, in favour of reducing the drink drive
limit as part of on-going efforts to combat the problem of drink driving.
82. For those who are convicted of a drink drive offence there is the option of
attending the Drink Drive Rehabilitation Scheme, which has been proved to
dramatically reduce the risk of reoffending 12 .
83. The issue of drug driving is more complex, as there is no reliable testing
equipment yet available. We note and support the UK Government’s commitment to
provide the police with appropriate tools to enforce this effectively.
We will:
i. Press the UK Government to reduce the drink drive limit.
ii. Seek powers from the UK Government to set drink drive limits in
Wales.
iii. Continue to support co-ordinated drink drive campaigns and
enforcement activity.
iv. Work with the police and other partners to maintain anti-drink drive
activities throughout the year.
v. Make changes to the Drink Drive Rehabilitation Scheme to maintain
its high quality and ensure that the take-up of the course is high.
12
TRL Report No 613: The Drink-Drive Rehabilitation Scheme: Evaluation and Monitoring – Final
Report, LR Smith, G Buckle, M Keigan, S Butters & J Stone, September 2004
16We expect partners to:
vi. Continue to focus enforcement, education, training and publicity on
drink and drug driving, and actively work to reduce the number of
people breaking the law.
vii. Support the evaluation of existing practices to determine their
effectiveness in preventing drink driving.
Speed
84. In 2010 a total of 68,000 Fixed Penalty Notices were issued for speed limit
offences in Wales. In addition, there were 10,000 speed limit offences dealt with by
Magistrates’ Courts.
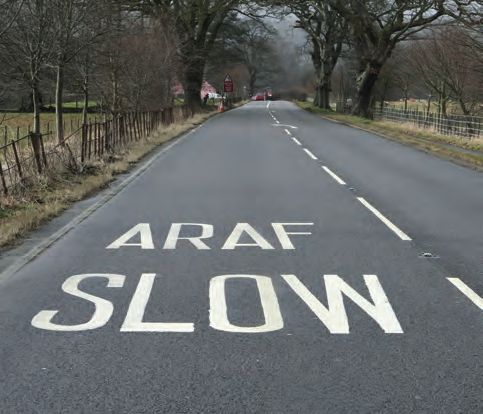
85. There is overwhelming evidence that the frequency and severity of collisions
rises with speed. We issued guidance to local authorities on the setting of local
speed limits in 2009, stressing the importance of consistency and transparency in
setting speed limits to encourage compliance.
86. The Wales Road Casualty Reduction Partnership are responsible for all
mobile, fixed and red light camera enforcement sites. We work with the Partnership
and other partners on targeted campaigns to remind people of their responsibility to
drive within speed limits and the potential consequences of a failure to do so.
87. The Welsh Government is currently undertaking a review of all speed limits on
the trunk road network to ensure that they are appropriate. We recommend that all
local authorities do the same on their A and B roads by 2014.
We will:
i. Continue to work with the Wales Road Casualty Reduction
Partnership in targeting collision sites where inappropriate speed
has been identified, and adopt a consistent approach to speed
enforcement across Wales.
ii. By 2014, implement any changes to speed limits on the trunk road
network following the speed limit review.
iii. Seek powers from the UK Government to set speed limits.
We expect partners to:
iv. Adopt strategies to educate drivers about the dangers of
inappropriate speed.
v. Enforce the law in respect of speed limits, particularly at locations
where excessive speed is commonplace and there is a history of
road casualties.
vi. Implement any changes to speed limits on their roads following the
speed limit review.
17Careless Driving
88. As demonstrated in Figure 3 (page xxx), careless or poor driving is a very
significant contributory factor to road traffic collisions.
89. The UK Government has committed to the introduction of a fixed penalty
notice for careless driving to enable more people to be offered rehabilitative
education and to combat behaviour such as ‘tailgating’ or ‘undertaking’. They have
also indicated that the level of payment attached to fixed penalty notices will be
raised, subject to detailed assessment.
We will:
i. Support the UK Government’s intention to adopt a fixed penalty
notice for careless driving and raise the level of payment for these
notices.
ii. Support targeted national campaigns to raise awareness of
careless driving and the associated safety implications.
iii. Support the police in their efforts to enforce laws which, if ignored,
can result in careless driving.
We expect partners to:
iv. Evaluate the effectiveness of existing education methods around
careless driving and distraction, and consider whether these are fit
for purpose or in need of review.
Mobile Phones
90. It is illegal to use a hand held mobile phone or similar device whilst driving,
but a minority of people continue to breach the law. There is anecdotal evidence to
suggest that a significant number of collisions are caused by people being distracted
by mobile phones and similar devices.
We will:
i. Support campaigns that target people using mobile phones and
other devices.
ii. Press the police and UK Government to collect mobile phone usage
information.
We expect partners to:
iii. Continue to draw attention to the dangers of using a mobile phone
whilst driving, targeting those groups most likely to do so.
iv. Enforce the law around mobile phones through ongoing and
targeted campaigns.
18Seat Belts
91. Around one-third of car occupants killed in road collisions in Great Britain
were not wearing seat belts, despite this being illegal and clearly contributing to the
severity of injuries on the roads.
92. Most people wear a seat belt when travelling in a vehicle, but a minority
continue to break the law, placing them at greater risk of injury.
We will:
i. Support campaigns that target people using seat belts and other
devices.
We expect partners to:
ii. Enforce the law on the wearing of seat belts through ongoing and
targeted enforcement.
iii. Educate and encourage drivers to wear seat belts, particularly
ensuring that children are properly restrained in vehicles.
194. Safer Roads
93. Highway authorities are encouraged to use the collision evidence available to
develop engineering measures to positively affect road safety. We also encourage
them to keep up to date with developments in road safety analysis and engineering
solutions through sharing best practice at various existing forums and publications.
94. Road safety has been improved by treating specific sites at which there have
been clusters of personal injury collisions. Subsequently, collisions are now more
likely to be scattered along a route and less focused on specific locations. Highway
authorities are best placed to identify which collision analysis option is most
appropriate for specific parts of their network, be it cluster site analysis, mass action
or area wide analysis, or route analysis.
Reactive and Proactive Analysis
95. The number of recorded personal injury collisions decreased from 9588 in
2000, to 6850 in 2010. Whilst highway authorities are still encouraged to use
historical Stats19 data to identify collision trends which can be addressed through
engineering measures, we encourage highway authorities to take a proactive
approach to analysis.
96. Highway authorities are encouraged to link with the police in identifying
damage only collisions which can supplement the personal injury collision data in
identifying dominant trends and areas where engineering measures would be
proactive in reducing the potential for an injury collision.
97. Both personal injury and damage only collision data should be used as
evidence in analysis studies and schemes arising as part of bids for funding.
Although the priority for funding will be for schemes which address a history of
personal injury collisions.
We will:
i. Support the delivery of road safety schemes on trunk roads and
local roads where there is evidence of collisions.
We expect partners to:
ii. Continue to analyse personal injury collisions to identify trends
which may be addressed through engineering, enforcement or
education.
iii. Work together to identify locations where there is evidence of
potential for an injury collision.
20Route Analysis
98. Route analysis is the treating of a route as a whole. Treatment of a route can
offer drivers travelling along a route consistency, such that they know the behaviour
expected of them.
99. Route identification should involve consideration of the collision rate on
various routes. Analysis of previous collisions is key to selecting the package of
interventions.
100. Route safety is not restricted to the prevention of collisions; it also allows for
some measures intended to reduce the severity of collision.
We will:
i. Continue to address existing cluster sites on trunk roads and
encourage local authorities to do the same on their network.
ii. Adopt a route analysis approach to road safety on the trunk road
network and recommend that local authorities do the same.
iii. Produce guidance to support highways authorities adopting a route
based approach.
We expect partners to:
iv. Work together to identify and prioritise cluster site and route
analysis on a regional basis and agree appropriate engineering,
enforcement or education measures accordingly.
Passive Safety
101. In 2010, more than 30 people were killed or seriously injured in vehicles that
left the carriageway and collided with street furniture. In the UK it is estimated that
over 500 people are killed each year in collisions with roadside objects.
102. Passively safe ‘crash friendly’ signposts, lighting columns and traffic signal
poles are now widely used on the Welsh trunk road network where speed limits are
50mph or greater. Passively safe street furniture is now the recommended
alternative to conventional larger signposts, lighting columns and traffic signal poles
safeguarded by safety barrier on the trunk road network.
103. The use of passively safe street furniture is proven to save lives and this is
transferable to the wider application on the local road network.
104. Street furniture protected by safety barriers presents a particular risk to
motorcyclists as the posts are a dangerous continuous obstacle for dismounted and
sliding motorcyclist. Barriers and barrier products are now available which provide
lower level screening and allow motorcyclists to slide along the barrier without hitting
the posts.
21105. It is also now possible to protect signs with padded crash cushions. These
cushions have demonstrated their performance to protect motorcyclists in impacts
with street furniture which would otherwise be serious or fatal.
We will:
i. Encourage and promote the use of passively safe street furniture on
the trunk road and local road networks.
ii. Consider the use of motorcycle safe barriers, barrier products and
padded crash cushions around street furniture at sites where there
is a history of motorcycle collisions on the trunk road and local road
networks.
We expect partners to:
iii. Consider the use of passively safe safety fencing where risk
assessment indicates that it would be of benefit in collision and
casualty severity reduction.
Scheme Design
106. As part of the planning stage of any highway improvement or new road
schemes on the trunk road network, we analyse the impact the scheme will have on
collisions. We undertake Road Safety Impact Assessments and encourage local
authorities to do the same as part of highway improvement schemes.
107. Engineers are encouraged to identify high risk and vulnerable groups (see
Chapter 2) at specific locations or on routes through analysis of collisions and traffic
flow make up to inform road safety engineering schemes.
108. Road Safety Audits evaluate highway improvement schemes during design
and at the end of construction to identify potential road safety problems that may
affect any users of the highway and suggest measures to mitigate those problems.
Road Safety Audits are a standard requirement on all highway improvement
schemes on the trunk road and motorway network in Wales.
109. The Design Manual for Roads and Bridges includes design standard and
advice for undertaking Non-Motorised User Audits which encourages the
consideration of the needs of pedestrians, cyclists and equestrians as part of the
design of trunk road highway schemes.
110. Specific guidance is available from the Institution of Highway Incorporated
Engineers on designing highway schemes with motorcyclists in mind.
111. We will introduce the Active Travel Bill and prepare a design guide for
highway authorities to adopt as their design standards.
22We will:
i. Continue to apply the standards available on non-motorised user
audits and Road Safety Audits on trunk road improvement
schemes.
ii. Encourage trunk road agents and local authorities to use guidance
on designing for motorcyclists, cyclists and pedestrians.
iii. The work to produce this national design standard for walking and
cycling in Wales is ongoing and it is envisaged that the guidance
will be finalised at the end of 2013.
We expect partners to:
iv. Undertake Road Safety Impact Assessments as part of highway
improvement schemes.
v. Give due consideration to the benefits of Road Safety Audits on
local highway schemes, and develop a policy on when they shall be
undertaken.
vi. Utilise guidance available on designing specifically for
motorcyclists, cyclists and pedestrians.
235. How do we deliver effective road safety?
112. In this section we have set out the approach and governance arrangements
that we believe will best support effective road safety in Wales.
Who are our partners?
113. Throughout this document we refer to ‘partners’. This refers to any groups or
organisations who are concerned with road safety and reducing casualties. These
groups come from across the public, private and third sectors. There are too many to
refer individually to the multiple organisations involved in road safety within this
document.
114. We are keen to work with organisations that contribute to improving road
safety.
115. We have referred to actions on partners throughout this document. We expect
organisations to tailor their activities to reflect the objectives set out in this document.
Working Flexibly
116. We must all look at some of the emerging trends in road traffic collisions to try
and proactively address issues before they become a serious problem.
117. Whilst this document highlights a number of vulnerable groups and causation
factors that we should all work together to address, it is not exhaustive. All partners
should be prepared to work flexibly, although all activity should be based on robust
data and focused on achieving casualty reductions. We must identify and respond to
emerging vulnerable groups, unforeseen trends and technological changes that may
impact on the delivery of effective road safety.
The UK Strategic Framework for Road Safety
118. In May 2011 the UK Government published its Strategic Framework for Road
Safety 13 , which set out their approach to road safety and the actions they will take to
reduce casualties.
119. Aspects of the UK Framework, particularly in areas which are non-devolved
such as enforcement and sanctions, affect Wales. Among other things, the UK
Framework has already or will:
Introduce a new fixed penalty for careless driving.
Increase the level of fixed penalty notices for traffic offences.
Increase the range of educational courses available in place of fixed
penalty notices.
Reform the regime for re-testing disqualified drivers.
Improve the enforcement of drink and drug driving through a range
of measures, including the introduction of drug screening kits and
consideration of a new drug driving offence.
13
http://www.dft.gov.uk/publications/strategic-framework-for-road-safety/
24We will work closely with the UK Government to ensure that the changes introduced
are as effective as possible.
120. The Welsh Government support and share the objective of reducing
casualties with the UK Government and the other devolved administrations in
Scotland and Northern Ireland. We will share good practice and collaborate on
policies.
121. Some of the actions within this Delivery Plan complement UK Government
proposals. However, we do have a Welsh approach to road safety delivery and this
Plan reflects what best suits Wales.
Outcome-based approach
122. We fully recognise that the Welsh Government cannot achieve casualty
reduction alone. We need all partners to work together, using their different
resources and expertise, and adopting a similar approach to road safety
interventions.
123. We expect all partners, including the Welsh Government, to target road safety
interventions at the achievement of road casualty reductions. We believe all activity
should be based on achieving this.
124. We support an outcome-based approach and its application to road safety.
125. We want to establish a focus on results – aligning processes and activities to
the delivery of key outcomes (in road safety – casualty reduction). It emphasises the
importance of focusing on impact and effectiveness, not how much is being done.
So, for example, we should be asking:
Training schemes – did we change people’s behaviour? (not how
many people were trained)
Advertising campaigns – did the message resonate with target
audience and persuade them to take different action?
Engineering schemes – did we reduce or prevent casualties at that
location? (not how many schemes have been completed)
126. We believe that this provides a common-sense approach to thinking through
and focusing effort to address road safety issues, ensuring that decisions made are
informed by an understanding of their potential impact on the key outcome of
casualty reduction. Annex B highlights how Results Based Accountability™ can help
us apply these principles to road safety.
127. We expect the Welsh Government and all partners involved in road safety,
when considering undertaking education, publicity, training, engineering works or
enforcement activity, to ask questions such as:
What evidence is there to support the intervention?
What effect will the intervention have on casualty reduction?
How will we evaluate the outcomes of the intervention?
25 Does this represent the best option available?
128. The Welsh Government will not fund any activity that is not based on
evidence, subject to evaluation and focused on achieving casualty reduction.
Evidence and evaluation
129. It is important to recognise that some interventions will not work, and, as we
all try to reduce casualties, inevitably some things will be more effective than others.
If results are not forthcoming within a reasonable period, then changes should be
made, or the activity abandoned. We can all learn lessons from both successful and
unsuccessful activities, making sure we share our experiences with one another. We
want to replicate successful approaches and avoid repeating mistakes.
130. All engineering/enforcement activity should be based on quantitative collision
and casualty data and be evaluated to establish effectiveness in reducing casualties
and collisions.
131. It is more difficult to ascertain the affect education has on casualty reduction.
However, there are evaluation approaches that can be used and these should
always be part of delivery. We support the use of the Department for Transport and
the Royal Society for the Prevention of Accidents’ (RoSPA’s) E-valu-it Toolkit 14 when
developing education, training and publicity to help evaluate effectiveness. We would
also encourage partners to use resources from across Wales, the UK and
internationally that have been subject to evaluation and been proven to be effective.
There are a number of resources for sharing results and evaluation in the UK which
can support this 15 .
132. The ‘three Es’ (education, engineering and enforcement) remain central to
reducing road casualties. The adoption of an outcome-based approach underpins
this with evidence and evaluation.
Joint Delivery
133. Effective and meaningful joint delivery between key partners is fundamental to
reducing casualties. In the current financial climate it is imperative that we use the
resources we have to best effect. There are already examples of collaboration and
partnership working in Wales. We believe that we can work together more efficiently
and effectively to deliver better outcomes.
134. The nature of road safety intervention, where a number of bodies are involved
in delivery, means that there remains some avoidable duplication of effort. We
expect all partners to analyse their activities and look for ways to work together to
share resources and good practice.
14
https://www.roadsafetyevaluation.com/index.html
15
For example the Road Safety Knowledge Centre (http://www.roadsafetyknowledgecentre.org.uk) and the
European Road Safety Observatory (http://ec.europa.eu/transport/road_safety/specialist/index_en.htm)
26135. We want to adopt governance arrangements that best support collaboration;
facilitating best practice, sharing expertise and avoiding unnecessary duplication.
Governance
136. Road safety is a complex area with multiple organisations, agencies,
authorities, partnerships, lobbying groups and charities. All have an important role to
play in delivering casualty reduction.
137. We want Wales to adopt a structure where partners are accountable for the
policies and practices they adopt. Equally, we want to avoid excessive numbers of
meetings and bureaucracy that stifles ‘doing the job’.
Figure 5 – Governance structure for road safety delivery in Wales
Strategic Road Safety
Group
National Coordination: Regional Delivery:
Education – Road Safety Wales Education, enforcement &
Enforcement – Police & Wales engineering – Regional Road
Road Casualty Reduction Safety Groups (through the
Partnership four Regional Transport
Engineering – CSS Wales Consortia)
138. Figure 5 shows the structure we are proposing to adopt for road safety
delivery in Wales. Roles and responsibilities in different areas of the structure are set
out in detail at Annex C.
139. We have focused on key partners in Wales, but acknowledge the necessity of
working closely with UK Government, other devolved administrations and other
organisations with an interest in road safety. We must all work together if we are to
achieve the desired outcome of significant and sustained casualty reduction.
140. The groups, agencies and areas of activity (education, engineering and
enforcement) identified in Annex C are not mutually exclusive. All areas of road
safety overlap and must work collaboratively – partners are expected to take the
initiative and actively engage with each other.
141. We believe that the Strategic Road Safety Group should be responsible for
coordinating the effective delivery of the actions within this plan and the strategic
Welsh approach to road safety in general. The Group will also make
27recommendations to groups/partners about the most effective means of delivering
effective road safety, where appropriate.
142. We will review this structure periodically to ensure that it remains the most
appropriate mechanism for road safety activities.
286. Present and future funding arrangements
143. The Welsh Government provides significant funding for road safety
interventions to local authorities (through the Regional Transport Grant), the Wales
Road Casualty Reduction Partnership, and the Royal Society for the Prevention of
Accidents. The total value of this funding is over £120m since 2000, and we believe
that it has made an important contribution to the reductions in casualty numbers we
have seen in recent years.
144. This funding has been used for a wide range of interventions, which are
undertaken and administered by our partners.
Figure 6 – examples of road safety interventions funded by the Welsh
Government
Intervention Description
Engineering:
20mph zones/speed There are approximately 560 20mph speed limits and zones in
limits Wales, many of which have been funded by the Welsh
Government via the Regional Transport Grant to local authorities.
Other traffic calming A range of traffic calming measures, junction and skid resistant
and safety measures surfacing improvements are funded through the Regional
Transport Grant and undertaken by local authorities.
Local safety schemes The Trunk Road Agents, who are responsible for maintaining the
motorway and trunk road network on behalf of the Welsh
Government, bid for funding to address collision cluster sites and
review the safety of routes.
Enforcement:
Speed cameras Targeted at locations where there are significant road casualties
to reduce speed and save lives.
Variable Speed Limits Introduced on the M4 from junctions 24-28 to reduce congestion,
make journeys safer and journey times more reliable.
Average speed Currently being introduced on the A465 Heads of the Valleys road
cameras between Hirwaun and Dowlais Top.
Traffic Officers
Patrolling the M4 and A55 in marked vehicles with police powers
to stop, control and direct traffic – releasing police to tackle
emergency responses.
Education:
Motorcycle training
Courses such as BikeSafe and Dragon Rider which develop a
rider’s skill level and improve their safety on the roads.
29You can also read