First nuclear genome assembly of an extinct moa species, the little bush moa (Anomalopteryx didiformis) - bioRxiv
←
→
Page content transcription
If your browser does not render page correctly, please read the page content below
bioRxiv preprint first posted online Feb. 9, 2018; doi: http://dx.doi.org/10.1101/262816. The copyright holder for this preprint (which
       was not peer-reviewed) is the author/funder, who has granted bioRxiv a license to display the preprint in perpetuity.
                                       All rights reserved. No reuse allowed without permission.

      First nuclear genome assembly of an extinct moa species, the

                           little bush moa (Anomalopteryx didiformis)

      Alison Cloutier1,2*, Timothy B. Sackton3, Phil Grayson1,2, Scott V. Edwards1,2, Allan J. Baker4,5¶

      1
          Department of Organismic and Evolutionary Biology, Harvard University, Cambridge MA USA
      2
          Museum of Comparative Zoology, Harvard University, Cambridge MA USA
      3
          Informatics Group, Harvard University, Cambridge MA USA
      4
          Department of Ecology and Evolutionary Biology, University of Toronto, Toronto ON Canada
      5
          Department of Natural History, Royal Ontario Museum, Toronto ON Canada
      ¶
          Deceased

      *Corresponding author: alison.cloutier@mail.utoronto.ca

                                                                          1
bioRxiv preprint first posted online Feb. 9, 2018; doi: http://dx.doi.org/10.1101/262816. The copyright holder for this preprint (which
was not peer-reviewed) is the author/funder, who has granted bioRxiv a license to display the preprint in perpetuity.
All rights reserved. No reuse allowed without permission.
ABSTRACT
High throughput sequencing (HTS) has revolutionized the field of ancient DNA (aDNA)
by facilitating recovery of nuclear DNA for greater inference of evolutionary processes in extinct
species than is possible from mitochondrial DNA alone. We used HTS to obtain ancient DNA
from the little bush moa (Anomalopteryx didiformis), one of the iconic species of large, flightless
birds that became extinct following human settlement of New Zealand in the 13 th century. In
addition to a complete mitochondrial genome at 273.5X depth of coverage, we recover almost
900 Mb of the moa nuclear genome by mapping reads to a high quality reference genome for the
emu (Dromaius novaehollandiae). This first nuclear genome assembly for moa covers
approximately 75% of the 1.2 Gbp emu reference with sequence contiguity sufficient to identify
87% of bird universal single-copy orthologs. From this assembly, we isolate 40 polymorphic
microsatellites to serve as a community resource for future population-level studies in moa. We
also compile data for a suite of candidate genes associated with vertebrate limb development.
We find that the wingless moa phenotype is likely not attributable to gene loss or
pseudogenization among this candidate set, and identify potential function-altering moa coding
sequence variants for future experimental assays.
Key words: little bush moa, ancient DNA, New Zealand, ratite, flightless, microsatellite
INTRODUCTION
The extinct moa of New Zealand (Aves: Dinornithiformes) comprise nine currently
recognized species (Bunce et al. 2009) and belong to the Palaeognathae, which encompasses the
flightless ratites (ostrich, emu, cassowary, kiwi, rheas, moa, and elephant birds) and the volant,
2bioRxiv preprint first posted online Feb. 9, 2018; doi: http://dx.doi.org/10.1101/262816. The copyright holder for this preprint (which
was not peer-reviewed) is the author/funder, who has granted bioRxiv a license to display the preprint in perpetuity.
All rights reserved. No reuse allowed without permission.
or flying, tinamous. Extinction of all moa species is thought to have closely followed Polynesian
settlement of New Zealand in the late 13th century as the result of direct human exploitation
compounded by anthropogenic land-use changes and impacts associated with introduced species
(Allentoft et al. 2014; Holdaway et al. 2014).
In addition to a rich history of palaeontological study (reviewed in Worthy and Holdaway
2002), ancient DNA (aDNA) has yielded novel insights into moa biology at almost every turn
(Allentoft and Rawlence 2012; Grealy et al. 2017). Cooper et al. (1992) first used aDNA to
show that moa are not most closely related to kiwi, indicating independent arrivals of these two
lineages to New Zealand. Instead, aDNA places moa as sister to the volant tinamous, consistent
with multiple independent losses of flight in ratites (Phillips et al. 2010; Haddrath and Baker
2012; Baker et al. 2014; Cloutier et al. 2018; Sackton et al. 2018). Ancient DNA has also helped
clarify moa taxonomy (Baker et al. 2005; Bunce et al. 2009), and was instrumental in identifying
extreme reversed sexual size dimorphism that misled some morphological taxonomic
designations (Bunce et al. 2003; Huynen et al. 2003). Contributions from ancient DNA have
‘clothed’ moa by assigning feathers to their species of origin (Rawlence et al. 2009), identified
males as the likely incubating sex from eggshell aDNA (Huynen et al. 2010), and investigated
moa feeding ecology and parasites using coprolites (Wood et al. 2013a,b).
This diversity of aDNA research testifies to the wealth of relatively well-preserved moa
remains (Allentoft and Rawlence 2012). Yet, most studies have relied upon mitochondrial DNA
(mtDNA) since mtDNA occurs in high copy number per cell and is therefore more readily
recovered than nuclear DNA from subfossil substrates where aDNA is often highly degraded
(Allentoft and Rawlence 2012; Hofreiter et al. 2015; Grealy et al. 2017). High throughput
sequencing (HTS) has revolutionized the field of aDNA by allowing recovery of these short
3bioRxiv preprint first posted online Feb. 9, 2018; doi: http://dx.doi.org/10.1101/262816. The copyright holder for this preprint (which
was not peer-reviewed) is the author/funder, who has granted bioRxiv a license to display the preprint in perpetuity.
All rights reserved. No reuse allowed without permission.
segments of nuclear DNA. Unlike mtDNA, which is uniparentally inherited and represents only
a tiny fraction of the total genomic ‘blueprint’ in an individual, nuclear DNA can provide much
more detail concerning the evolutionary history and unique adaptations of extinct species
(Hofreiter et al. 2015; Grealy et al. 2017). It is therefore likely that we have only just begun to
access the available genetic information for moa.
We use high throughput sequencing to recover aDNA from the little bush moa
(Anomalopteryx didiformis). Little bush moa were distributed in lowland forests across the
North and South Islands of New Zealand and were among the smallest of moa species, reaching
heights of 50–90 centimeters (Worthy and Holdaway 2002; Bunce et al. 2009). In addition to a
complete mitochondrial genome, we report the first nuclear genome for any moa species,
assembled by mapping little bush moa reads to a high quality draft genome for the emu
(Dromaius novaehollandiae, Sackton et al. 2018). We use this moa nuclear genome to isolate
polymorphic microsatellites for future population-level studies and also recover coding sequence
for a suite of candidate genes to investigate their possible association with flightlessness in moa
and other ratites.
MATERIALS AND METHODS
DNA extraction and sequencing
DNA was extracted from a single toe bone of an Anomalopteryx didiformis specimen
from Pyramid Valley, South Island of New Zealand collected by Trevor Worthy and held in the
collections of the Royal Ontario Museum (ROM; Toronto, Canada). The HTS reads reported
here were previously used for phylogenetic analysis of palaeognath relationships (Baker et al.
2014), and PCR-based sequences obtained from this specimen have been reported by Haddrath
4bioRxiv preprint first posted online Feb. 9, 2018; doi: http://dx.doi.org/10.1101/262816. The copyright holder for this preprint (which
was not peer-reviewed) is the author/funder, who has granted bioRxiv a license to display the preprint in perpetuity.
All rights reserved. No reuse allowed without permission.
and Baker (2001), Baker et al. (2005, under sample ID A. did. OH), and Haddrath and Baker
(2012, sample TW95).
DNA extraction followed Baker et al. (2005). In brief, the outer 1–2 mm was removed
from the bone surface by microblasting with an Airbrasive System (MicroBlaster; Comco,
Burbank CA, USA), and 0.2 grams of the remaining material was ground into fine powder.
Enzymatic digestion proceeded overnight at 56°C in buffer containing final concentrations of
0.5M EDTA, 200 g/mL proteinase K, and 0.5% N-laurylsarcosine at pH 8.0 (Hagelberg 1994),
and DNA was purified using commercially available silica spin columns (DNeasy Blood &
Tissue Kit; Qiagen, Germantown MD, USA). Sample preparation occurred in a dedicated aDNA
workspace in the ROM following established best practices (Cooper and Poinar 2000; Knapp et
al. 2011).
Library preparation and sequencing was performed by The Centre for Applied Genomics,
The Hospital for Sick Children, Toronto, Canada. Library A_didi_CTTGTA was constructed
from 200–400 bp size-selected DNA sheared to 200 bp insert size followed by library
preparation with the Illumina TruSeq DNA v3 DNA Prep Kit. Paired-end sequencing (2 x 101
bp) was carried out on three lanes of a HiSeq 2500 platform using Illumina v3 chemistry. A
second TruSeq library (A_didi_GCCAAT) was prepared from the same input DNA and
sequenced on two partial lanes of a HiSeq 2500. Three additional libraries were constructed with
the Illumina Nextera XT Sample Preparation Kit. A_didi_CAGAGA and A_didi_CTCTCT used
input DNA < 500 bp with no additional shearing, while A_didi_AGGCAG used DNA 500 bp–2
Kb in size subsequently sheared to < 700 bp. These latter barcoded libraries were pooled for
sequencing on a single HiSeq 2500 lane.
Read processing and genome assembly
5bioRxiv preprint first posted online Feb. 9, 2018; doi: http://dx.doi.org/10.1101/262816. The copyright holder for this preprint (which
was not peer-reviewed) is the author/funder, who has granted bioRxiv a license to display the preprint in perpetuity.
All rights reserved. No reuse allowed without permission.
Trimmomatic v. 0.32 (Bolger et al. 2014) was run in paired-end mode for adapter
removal and quality trimming and reads with post-trimming length below 25 bp were discarded
(options ILLUMINACLIP:[adapter_file]:2:30:10:1:true SLIDINGWINDOW:10:13
MINLEN:25).
A de novo mitochondrial genome assembly was built with MITObim v. 1.8 (Hahn et al.
2013) using the published little bush moa mtDNA genome as a starting seed (GenBank accession
NC_002779, Haddrath and Baker 2001).
Nuclear sequence assembly first mapped reads to a draft genome for emu (Dromaius
novaehollandiae; Sackton et al. 2018, BioProject PRJNA433110 [accession pending]), and then
re-mapped reads to the initial moa consensus for improved recovery of short and/or variant
reads. A random subset of reads was mapped to the emu reference with Stampy v. 1.0.28
(Lunter and Goodson 2011) using default settings to estimate an appropriate substitution
parameter. The full data were then mapped to emu with Stampy and this user-specified
substitution parameter (estimated at 0.0839). Samtools v. 1.3.1 (Li et al. 2009) was used to filter
reads with mapping quality score below 30, and duplicates within each library were marked and
removed with Picard Tools v. 2.6.0 (https://broadinstitute.github.io/picard/) before merging
mapped reads across libraries. Samtools ‘mpileup’ was used to output variant call format (VCF)
files with minimum mapping quality 30 and base quality 20, and a consensus sequence was
called with BCFTools v. 1.2. Reads were re-mapped to this initial consensus with Bowtie2 v.
2.2.9 (Langmead and Salzberg 2012), with subsequent post-processing as above. Assembly
completeness was measured with BUSCO v. 2.0 and the aves_odb9 data set (Simão et al. 2015)
to search for 4,915 bird universal single-copy orthologs.
Taxonomic read profiling and assessment of DNA damage
6bioRxiv preprint first posted online Feb. 9, 2018; doi: http://dx.doi.org/10.1101/262816. The copyright holder for this preprint (which
was not peer-reviewed) is the author/funder, who has granted bioRxiv a license to display the preprint in perpetuity.
All rights reserved. No reuse allowed without permission.
Trimmed reads were queried against a custom database containing all avian, bacterial,
archaeal, plant (including algae and fungi), and viral sequences from GenBank Release 217 as
well as publicly available genomes for the chicken (Gallus gallus, galGal4 release, Hillier et al.
2004), North Island brown kiwi (Apteryx mantelli, Le Duc et al. 2015), ostrich (Struthio camelus,
Zhang et al. 2014), white-throated tinamou (Tinamus guttatus, Zhang et al. 2014), human
(reference genome GRCh38), and the draft emu assembly (Sackton et al. 2018). Reads were
mapped in BlastN mode with default parameters in MALT v. 0.3.8 (accessed from
http://ab.inf.uni-tuebingen.de/data/software/malt/download/welcome.html), and MEGAN
Community Edition v. 6.6.4 (Huson et al. 2016) was used for taxonomic clustering. Patterns of
DNA damage were assessed with mapDamage v. 2.0.7 (Jónsson et al. 2013).
Identification of polymorphic microsatellite repeats
MSATCOMMANDER v. 1.0.8 (Faircloth 2008) was used to identify all dinucleotide
microsatellites with a minimum of six repeat units and all trinucleotides with at least four repeats
in the moa nuclear assembly. Candidate loci with more than 10% uncalled bases (Ns) in the
region encompassing the microsatellite and 250 bp of flanking sequence to either side were
excluded. Reads mapped to each remaining candidate region were realigned using STR-
realigner v. 0.1.01 (Kojima et al. 2016) and genotypes were called with RepeatSeq v. 0.8.2
(Highnam et al. 2013). Heterozygous loci with minimum genotype likelihood ³ 10 and
minimum depth of coverage ³ 2 for both reference and alternate alleles were retained. Sequence
for each retained locus (repeat + flank) was used in blastn searches against draft genomes for
seven ratites from Sackton et al. (2018), and the ostrich (Zhang et al. 2014). Blastn hits with
evalue < 1e-10 were extracted from reference genomes and aligned with MAFFT v. 7.245 (Katoh
and Standley 2013).
7bioRxiv preprint first posted online Feb. 9, 2018; doi: http://dx.doi.org/10.1101/262816. The copyright holder for this preprint (which
was not peer-reviewed) is the author/funder, who has granted bioRxiv a license to display the preprint in perpetuity.
All rights reserved. No reuse allowed without permission.
Tests of selection for candidate limb development genes
Multiple sequence alignments were compiled for a set of candidate genes with
established roles in vertebrate limb development (reviewed in Zakany and Duboule 2007;
Tanaka 2013; Tickle 2015; Petit et al. 2017; listed in Table 3a) and for genes with potential
function-altering variants in the Galapagos cormorant (Phalacrocorax harrisi) hypothesized to
accompany phenotypic modifications typical of flightless birds (Burga et al. 2017, listed in Table
3b). Gene models were manually curated for ten new draft genome assemblies for palaeognaths
(Sackton et al. 2018). Moa coding sequence was obtained from pairwise whole-scaffold
alignments of moa to emu using reference emu coordinates (alignments are made available in
Dryad Digital Repository [DOI pending]). Sequences from draft palaeognath genomes were
combined with available avian sequences from GenBank and cormorant sequences from Burga et
al. (2017), and amino acid translations were aligned with MAFFT v. 7.245 (Katoh and Standley
2013). Partial (< 70% of total alignment length) and poorly aligning sequences (< 60% mean
pairwise amino acid identity) were removed, and the resulting alignment was used to guide gap
insertion in the corresponding nucleotide sequences. GenBank source information, curated gene
models, and sequence alignments are made available in Dryad Digital Repository (DOI pending).
We used the adaptive branch-site random effects likelihood model (aBSREL, Smith et al.
2015) in HyPhy v. 2.3.3 (Kosakovsky Pond et al. 2005) to test for lineage-specific selection in
moa. We used the RELAX method (Wertheim et al. 2015), also implemented in HyPhy, to test
for changes in selection intensity along specified foreground branches. We first tested for
changes in moa relative to other ratites by pruning the data set to contain only ratites and then
setting moa as the foreground branch and other flightless ratite lineages as the background.
Second, we assessed shifts in selection accompanying loss of flight by setting all flightless
8bioRxiv preprint first posted online Feb. 9, 2018; doi: http://dx.doi.org/10.1101/262816. The copyright holder for this preprint (which
was not peer-reviewed) is the author/funder, who has granted bioRxiv a license to display the preprint in perpetuity.
All rights reserved. No reuse allowed without permission.
lineages as the foreground (including the Galapagos cormorant, penguins, ratites, and inferred
flightless ancestors) and all volant lineages as the background. Multiple test correction to control
the false discovery rate at 0.05 within each analysis used the qvalue package v. 2.2.0 (Storey
2015) to control for the number of candidate genes analyzed (N= 37) as well as a more
conservative approach controlling for the expected genome-wide false discovery rate based on an
estimated N= 16,255 homologous orthologous groups of genes (HOGs) in birds identified by
Sackton et al. (2018).
Functional effects of moa sequence variants were assessed with PROVEAN v. 1.1.5
(Choi et al. 2012), using a threshold score < -5 to identify possible function-altering variants
following Burga et al. (2017). We computed PROVEAN scores for moa substitutions relative to
an emu reference sequence and additionally comparing moa to an inferred ancestral sequence for
the common moa-tinamou ancestor reconstructed in PAML v. 4.8 under the codon-based model
(Yang 2007).
RESULTS AND DISCUSSION
Library characterization and endogenous DNA content
High throughput sequencing yielded 143.4 Gbp of raw data (Table 1, available from
NCBI under SRA accession SRP132423). Most data incorporated into the mitochondrial and
nuclear genomes described below originated from library A_didi_CTTGTA (Fig. 1A), due in
part to greater sequencing effort for this library. Library A_didi_GCCAAT produced fewer
reads than expected and had a high level of sequence duplication due to suboptimal cluster
density (Table 1). Recovery of moa DNA from the three Nextera libraries was also limited, a
result that could reflect a smaller amount of input DNA used in the Nextera protocol and/or a
9bioRxiv preprint first posted online Feb. 9, 2018; doi: http://dx.doi.org/10.1101/262816. The copyright holder for this preprint (which
was not peer-reviewed) is the author/funder, who has granted bioRxiv a license to display the preprint in perpetuity.
All rights reserved. No reuse allowed without permission.
decreased amount of endogenous DNA in the size fractions assayed for these preparations.
Taxonomic profiling of reads, which represent a mixture of endogenous moa DNA and
environmental DNA, assigned taxonomy to 26–35% of reads across libraries (Fig. 1B). The
TruSeq libraries contained much higher proportions of reads assigned to Aves (e.g. all birds,
13% and 10% respectively for libraries CTTGTA and GCCAAT, Fig. 1B), with most of these
reads further assigned to Palaeognathae (Fig. 1C). Total mapping rates before duplicate removal
mirror estimated amounts of endogenous DNA in each library (Table 1, Fig. 1C), suggesting use
of a relatively divergent emu reference nevertheless recovered most of the recognizably moa
DNA within library extracts. Levels of read duplication (Table 1) further indicate that
sequencing saturation was reached to recover the maximum possible amount of endogenous
DNA.
Ancient DNA is typically degraded to fragments smaller than 500 bp and displays
characteristic post-mortem modifications leading to an excess of purines immediately preceding
strand breaks and increasing cytosine (C) to thymine (T) substitutions toward fragment ends
(Sawyer et al. 2012; Dabney et al. 2013). We cannot fully assess the extent of DNA damage
because library construction for this specimen involved DNA shearing, meaning that fragment
ends represent a mixture of naturally occurring DNA breakage as well as strand breaks induced
during library preparation. However, mean lengths of mapped reads and estimated insert sizes,
especially for the two TruSeq libraries, are consistent with well-preserved DNA (Table 1).
Consequently, while we do observe signatures of aDNA damage, the amount of damage appears
minimal (Supplemental Fig. S1). These observations are not unprecedented for well-preserved
moa specimens. Cooper et al. (2001), Haddrath and Baker (2001), and Baker et al. (2005)
successfully amplified moa PCR products 250–600 bp in length, and Cooper et al. (2001)
10bioRxiv preprint first posted online Feb. 9, 2018; doi: http://dx.doi.org/10.1101/262816. The copyright holder for this preprint (which
was not peer-reviewed) is the author/funder, who has granted bioRxiv a license to display the preprint in perpetuity.
All rights reserved. No reuse allowed without permission.
reported high endogenous DNA content and little DNA damage for samples used to sequence
complete mitochondrial genomes. Additionally, both the mitochondrial genome described below
and phylogenetic analysis of genome-wide data sets of nuclear markers for this specimen
corroborate its aDNA sequence authenticity (Baker et al. 2014; Cloutier et al. 2018; Sackton et
al. 2018).
Assembly of mitochondrial and nuclear genomes
We recovered a complete 17,043 bp mitochondrial genome at 273.5X average depth of
coverage (DoC) following duplicate removal (Fig. 2A, GenBank accession pending). This new
little bush moa assembly spans the entire 1,478 bp control region (D loop), which was not fully
represented in the published mtDNA genome assembled from PCR-based sequencing of the
same specimen (Haddrath and Baker 2001). The new HTS assembly is near identical to the
existing reference, with only 2 SNPs across 775 bp of alignable control region sequence, and five
SNPs and three single base pair indels across 15,566 bp lying outside the control region (99.9%
identity), and with all differences supported by > 70X DoC in the new HTS assembly. A
hypervariable control region 'snippet' diagnostic for moa lineages (McCallum et al. 2013)
confirms taxonomic assignment of the sequenced specimen, and a longer (382 bp) segment
spanning this region is identical to a haplotype from little bush moa sampled at multiple sites
across the South Island of New Zealand (Supplemental Fig. S2, Bunce et al. 2009).
Iterative mapping to a high quality emu reference (Sackton et al. 2018) recovered almost
900 Mbp of the little bush moa nuclear genome (BioProject PRJNA433423, accession pending),
or approximately 75% of the 1.2 Gbp emu reference (Fig. 2B, Table 2). Average depth of
coverage was 4.3X, with 87% of bases having DoC ³ 2 (Fig. 2B). Moa sequence was mapped to
1,942 of 2,882 reference emu scaffolds (Fig. 2B, Table 2), with only 0.19% of the total emu
11bioRxiv preprint first posted online Feb. 9, 2018; doi: http://dx.doi.org/10.1101/262816. The copyright holder for this preprint (which
was not peer-reviewed) is the author/funder, who has granted bioRxiv a license to display the preprint in perpetuity.
All rights reserved. No reuse allowed without permission.
assembly length occurring in scaffolds with no mapped reads. Although moa contigs are
relatively short (Table 2, maximum contig length= 12.2 Kb), the average break between contigs
is also small (Table 2, mean contig break= 218 bp). Therefore, 87.3% of BUSCO single-copy
orthologs for birds were identified in moa, with 75.1% of BUSCOs represented by complete
coding sequence (Table 2).
Identification of polymorphic microsatellite markers
Microsatellites offer an appealing option for aDNA studies since these nuclear markers
are often highly polymorphic, are spread throughout the genome, and are sufficiently short to
allow amplification in degraded samples (Selkoe and Toonen 2006). However, wet-lab
approaches for microsatellite isolation are not amenable to degraded aDNA samples, and cross-
species amplification of markers from extant taxa are often unsuccessful (Selkoe and Toonen
2006; Allentoft et al. 2009, 2011). High throughput sequencing can circumvent these difficulties
by identifying microsatellites directly from sequencing reads in the target species. This approach
was employed in moa where Allentoft et al. (2009, 2011) developed six polymorphic
microsatellites from GS FLX 454 pyrosequencing reads and demonstrated their utility for studies
of moa kinship (Allentoft et al. 2015) and population demography (Allentoft et al. 2014).
Nevertheless, individual HTS reads are often too short to provide appropriate flanking
sequence for primer design and candidate loci must still be screened for polymorphism (Allentoft
et al. 2011). We therefore use a complementary approach to isolate polymorphic microsatellites
from the little bush moa nuclear assembly. We identified 27,114 dinucleotide and 25,171
trinucleotide repeats, approximately half of which met our criteria for inclusion based on
flanking sequence contiguity (retaining 14,876 dinucleotides and 13,942 trinucleotides). From
these, we identified 40 microsatellites (28 dinucleotides and 12 trinucleotides, Suppl. Table S1)
12bioRxiv preprint first posted online Feb. 9, 2018; doi: http://dx.doi.org/10.1101/262816. The copyright holder for this preprint (which
was not peer-reviewed) is the author/funder, who has granted bioRxiv a license to display the preprint in perpetuity.
All rights reserved. No reuse allowed without permission.
that are heterozygous in the sequenced individual and hence at least minimally polymorphic in
the species as a whole. We offer the realigned BAM files for each locus and alignments to other
ratites as a community resource for future studies (Dryad digital repository [DOI pending], an
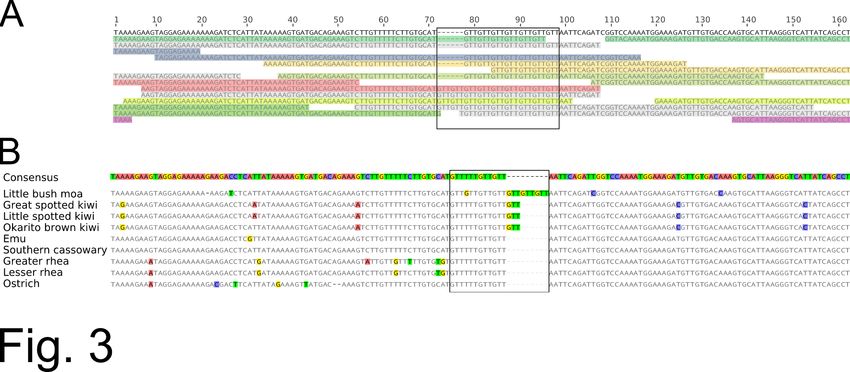
example of each data type is given in Fig. 3). Sequence information across ratites should be
especially useful for primer design in conserved regions to avoid null alleles in little bush moa
samples, and could also enable amplification of these markers across moa species.
Selection tests in candidate limb development genes
Arguably the most remarkable moa trait is the complete absence of wings. All ratites
exhibit some degree of forelimb reduction; however, moa are unique in retaining only a fused
scapulocoracoid within the pectoral girdle (Worthy and Holdaway 2002; Huynen et al. 2014).
Huynen et al. (2014) recovered moa coding sequence for the T-box transcription factor TBX5,
which plays a key role in forelimb specification and outgrowth (Tanaka 2013; Tickle 2015; Petit
et al. 2017), and demonstrated that moa TBX5 sequence activates promoters of downstream
genes in developing chicken embryos. Therefore, alterations to this coding region alone appear
unlikely to underlie the wingless moa phenotype (Huynen et al. 2014). We build upon this work
by reporting moa sequence for a more comprehensive suite of candidate genes with established
involvement in vertebrate limb development (Table 3a), as well as candidates with putative
function-altering variants in the Galapagos cormorant hypothesized to accompany forelimb
reduction in this flightless species (Burga et al. 2017, Table 3b).
We recovered moa sequence for all investigated genes, with an average 88% of coding
sequence per gene recovered from the moa assembly (Table 3). We found no frameshift
mutations and only a single in-frame stop codon in HOXD4 which, however, occurred at 1X
coverage and could represent a sequence artifact (note that this codon was masked by Ns for
13bioRxiv preprint first posted online Feb. 9, 2018; doi: http://dx.doi.org/10.1101/262816. The copyright holder for this preprint (which
was not peer-reviewed) is the author/funder, who has granted bioRxiv a license to display the preprint in perpetuity.
All rights reserved. No reuse allowed without permission.
further tests). There was no evidence for lineage-specific diversifying selection in moa, with P >
0.05 in aBSREL tests for each gene. RELAX tests also found no significant difference in the
strength of selection in moa relative to other ratites for candidate genes with established roles in
limb development (Table 3a), but identified a significant intensification of selection in moa
FAT1 and significant relaxation in GLI2 relative to other ratites among the candidates originating
from study of the Galapagos cormorant (Table 3b). However, neither of these results remains
significant under a more conservative genome-wide correction for an estimated 16,255 genes in
birds rather than correcting only for the set of 37 candidates tested here (both P > 0.05).
RELAX tests also identified seven candidates with significant selective shifts in flightless
lineages relative to other birds (Table 3). Of these, we find evidence for intensified selection in
three homeobox genes (HOXA2, HOXA4, and HOXD4), and significant relaxation in four genes
(GLI3, EVC, FAT1, and TALPID3; note that FAT1 shows intensified selection in moa relative to
other ratites, but also relaxed selection in flightless birds generally). However, only the
intensification for HOXA2 remains significant under the more stringent genome-wide false
discovery rate correction (P= 0.021).
PROVEAN analysis identified 24 moa sequence variants of possible functional relevance
compared to the emu reference (Suppl. Table S2). However, half of these variants (12 of 24) are
either shared with other species or are polymorphic in moa, with the emu residue present as an
alternative moa allele, indicating that this subset of sites is unlikely to underlie the wingless moa
phenotype. Additionally, 16 of the 24 sites display alternative residues in other birds that are
often accompanied by PROVEAN scores comparable to moa (Suppl. Table S2). Comparison to
an inferred reconstruction of the moa-tinamou common ancestor yielded broadly similar results,
with 17 of 19 potentially functionally relevant moa variants identical to those identified from
14bioRxiv preprint first posted online Feb. 9, 2018; doi: http://dx.doi.org/10.1101/262816. The copyright holder for this preprint (which
was not peer-reviewed) is the author/funder, who has granted bioRxiv a license to display the preprint in perpetuity.
All rights reserved. No reuse allowed without permission.
comparison to the emu reference (Suppl. Table S3).
Putative function-altering variants in the Galapagos cormorant are not shared with other
flightless lineages (Suppl. Table S4), indicating that any commonality in the genetic basis for
independent losses of flight involving these genes is likely not attributable to convergent or
parallel amino acid changes. Burga et al. (2017) also identified a deletion in CUX1 of the
Galapagos cormorant, with experimental assays indicating this gene acts as a transcriptional
activator of targets FAT1 and OFD1. As with the other reported Galapagos cormorant variants,
the CUX1 deletion is not shared by moa or other ratites (Suppl. Fig. S3). Altogether, we
conclude that loss of wings in moa is not attributable to gene loss or pseudogenization within this
candidate gene set, although the functional relevance of variants unique to moa requires further
experimental work.
CONCLUSION
This first nuclear genome assembly begins a new chapter in the already extensive history
of moa aDNA research. This genomic resource has already proved useful to assemble genome-
wide data sets of nuclear markers for phylogenetic inference (Baker et al. 2014; Cloutier et al.
2018; Sackton et al. 2018). Here, we further demonstrate its utility to isolate markers for
population-level studies and to investigate sequence evolution in candidate protein coding genes.
The relative contributions of coding sequence variation and mutations in noncoding regulatory
elements to phenotypic variation constitute an area of active research (Petit et al. 2017; Sackton
et al. 2018), and we anticipate that availability of a moa nuclear genome will also contribute to
study of regulatory changes associated with flightless phenotypes.
15bioRxiv preprint first posted online Feb. 9, 2018; doi: http://dx.doi.org/10.1101/262816. The copyright holder for this preprint (which
was not peer-reviewed) is the author/funder, who has granted bioRxiv a license to display the preprint in perpetuity.
All rights reserved. No reuse allowed without permission.
ACKNOWLEDGEMENTS
We thank Trevor Worthy for providing moa source material and Oliver Haddrath for
extracting moa aDNA. We thank Sergio Pereira of The Centre for Applied Genomics, The
Hospital for Sick Children, Toronto, Canada for overseeing library construction and sequencing.
Computations were performed on the GPC supercomputer at the SciNet HPC Consortium funded
by Compute Canada, the Government of Ontario, and the University of Toronto, as well as the
Odyssey cluster supported by the FAS Division of Science, Research Computing Group at
Harvard University. This work was supported by the Natural Science and Engineering Research
Council of Canada [to A.J.B.]; the Royal Ontario Museum Governors Fund [to A.J.B.]; and the
National Science Foundation [NSF grant DEB 1355343 (EAR 1355292) to A.J.B. and S.V.E.].
This work is dedicated to the memory of coauthor Allan Baker, who was the driving force
behind this project but passed away prior to its completion.
LITERATURE CITED
Allentoft ME, Heller R, Holdaway RN, Bunce M. 2015. Ancient DNA microsatellite analyses of
the extinct New Zealand giant moa (Dinornis robustus) identify relatives within a single
fossil site. Heredity 115:481 487.
Allentoft ME, et al. 2014. Extinct New Zealand megafauna were not in decline before human
colonization. Proc Natl Acad Sci U S A. 111:4922 4927.
Allentoft ME, Rawlence NJ. 2012. Moa's ark or volant ghosts of Gondwana? Insights from
nineteen years of ancient DNA research on the extinct moa (Aves: Dinornithiformes) of
New Zealand. Ann Anat. 194:36 51.
Allentoft, ME, et al. 2011. Profiling the dead: generating microsatellite data from fossil bones of
16bioRxiv preprint first posted online Feb. 9, 2018; doi: http://dx.doi.org/10.1101/262816. The copyright holder for this preprint (which
was not peer-reviewed) is the author/funder, who has granted bioRxiv a license to display the preprint in perpetuity.
All rights reserved. No reuse allowed without permission.
extinct megafauna protocols, problems, and prospects. PLoS One 6:e16670.
Allentoft ME, et al. 2009. Identification of microsatellites from an extinct moa species using
high-throughput (454) sequence data. BioTechniques 46:195 200.
Baker AJ, Haddrath O, McPherson JD, Cloutier A. 2014. Genomic support for a moa-tinamou
clade and adaptive morphological convergence in flightless ratites. Mol Biol Evol.
31:1686 1696.
Baker AJ, Huynen LJ, Haddrath O, Millar CD, Lambert DM. 2005. Reconstructing the tempo
and mode of evolution in an extinct clade of birds with ancient DNA: the giant moas of
New Zealand. Proc Natl Acad Sci U S A. 102:8257 8262.
Bolger AM, Lohse M, Usadel B. 2014. Trimmomatic: a flexible trimmer for Illumina sequence
data. Bioinformatics 30:2114 2120.
Bunce M, et al. 2009. The evolutionary history of the extinct ratite moa and New Zealand
Neogene paleogeography. Proc Natl Acad Sci U S A. 106:20646 20651.
Bunce M, et al. 2003. Extreme reversed sexual size dimorphism in the extinct New Zealand moa
Dinornis. Nature 425:172 175.
Burga A, et al. 2017. A genetic signature of the evolution of loss of flight in the Galapagos
cormorant. Science 356:eaal3345.
Choi Y, Sims GE, Murphy S, Miller JR, Chan AP. 2012. Predicting the functional effect of
amino acid substitutions and indels. PLoS One 7:e46688.
Cloutier A, et al. 2018. Whole-genome analyses resolve the phylogeny of flightless birds
(Palaeognathae) in the presence of an empirical anomaly zone. bioRxiv doi:
https://doi.org/10.1101/262949.
Cooper A, et al. 2001. Complete mitochondrial genome sequences of two extinct moas clarify
17bioRxiv preprint first posted online Feb. 9, 2018; doi: http://dx.doi.org/10.1101/262816. The copyright holder for this preprint (which
was not peer-reviewed) is the author/funder, who has granted bioRxiv a license to display the preprint in perpetuity.
All rights reserved. No reuse allowed without permission.
ratite evolution. Nature 409:704 707.
Cooper A, Poinar HN. 2000. Ancient DNA: do it right or not at all. Science 289:1139.
Cooper A, et al. 1992. Independent origins of New Zealand moas and kiwis. Proc Natl Acad Sci
U S A. 89:8741 8744.
Dabney J, Meyer M, Pääbo S. 2013. Ancient DNA damage. Cold Spring Harb Perspect Biol.
5:a012567.
Faircloth BC. 2008. MSATCOMMANDER: detection of microsatellite repeat arrays and
automated, locus-specific primer design. Mol Ecol Resour. 8:92 94.
Grealy A, Rawlence NJ, Bunce M. 2017. Time to spread your wings: a review of the avian
ancient DNA field. Genes 8:184.
Haddrath O, Baker AJ. 2012. Multiple nuclear genes and retroposons support vicariance and
dispersal of the palaeognaths, and an Early Cretaceous origin of modern birds. Proc Roy
Soc B Biol Sci. 279:4617 4625.
Haddrath O, Baker AJ. 2001. Complete mitochondrial DNA genome sequences of extinct birds:
ratite phylogenetics and the vicariance biogeography hypothesis. Proc Roy Soc B Biol
Sci. 268:939 945.
Hagelberg E. 1994. Mitochondrial DNA from ancient bones. In: Hermann B, Hummell S,
editors. Ancient DNA: recovery and genetic analysis of genetic material from
paleontological, archaeological, museum, medical, and forensic specimens. New York:
Springer-Verlag. p. 195 204.
Hahn C, Bachmann L, Chevreux B. 2013. Reconstructing mitochondrial genomes directly from
genomic next-generation sequencing reads a baiting and iterative mapping approach.
Nucleic Acids Res. 41:e129.
18bioRxiv preprint first posted online Feb. 9, 2018; doi: http://dx.doi.org/10.1101/262816. The copyright holder for this preprint (which
was not peer-reviewed) is the author/funder, who has granted bioRxiv a license to display the preprint in perpetuity.
All rights reserved. No reuse allowed without permission.
Highnam G, Franck C, Martin A, Stephens C, Puthige A, Mittelman D. 2013. Accurate human
microsatellite genotypes from high-throughput resequencing data using informed error
profiles. Nucleic Acids Res. 41:e32.
Hillier LW, et al. 2004. Sequence and comparative analysis of the chicken genome provide
unique perspectives on vertebrate evolution. Nature 432:695 716.
Hofreiter M, et al. 2015. The future of ancient DNA: technical advances and conceptual shifts.
Bioessays 37:284 293.
Holdaway RN, et al. 2014. An extremely low-density human population exterminated New
Zealand moa. Nat Commun. 5:5436.
Huson DH, et al. 2016. MEGAN Community Edition interactive exploration and analysis of
large-scale microbiome sequencing data. PLoS Comput Biol. 12:e1004957.
Huynen L, et al. 2014. Reconstruction and in vivo analysis of the extinct tbx5 gene from ancient
wingless moa (Aves: Dinornithiformes). BMC Evol Biol. 14:75.
Huynen L, Gill BJ, Millar CD, Lambert DM. 2010. Ancient DNA reveals extreme egg
morphology and nesting behavior in New Zealand's extinct moa. Proc Natl Acad Sci U S
A. 107:16201 16206.
Huynen L, Millar CD, Scofield RP, Lambert DM. 2003. Nuclear DNA sequences detect species
limits in ancient moa. Nature 425:175 178.
Jónsson H, Ginolhac A, Schubert M, Johnson PLF, Orlando L. 2013. mapDamage2.0: fast
approximate Bayesian estimates of ancient DNA damage parameters. Bioinformatics
29:1682 1684.
Katoh K, Standley DM. 2013. MAFFT multiple sequence alignment software version 7:
improvements in performance and usability. Mol Biol Evol. 30:772 780.
19bioRxiv preprint first posted online Feb. 9, 2018; doi: http://dx.doi.org/10.1101/262816. The copyright holder for this preprint (which
was not peer-reviewed) is the author/funder, who has granted bioRxiv a license to display the preprint in perpetuity.
All rights reserved. No reuse allowed without permission.
Knapp M, Clarke AC, Horsburgh KA, Matisoo-Smith EA. 2012. Setting the stage building and
working in an ancient DNA laboratory. Ann Anat. 194:3 6.
Kojima K, Kawai Y, Misawa K, Mimori T, Nagasaki M. 2016. STR-realigner: a realignment
method for short tandem repeat regions. BMC Genomics 17:991.
Kosakovsky Pond SL, Frost SDW, Muse SV. 2005. HyPhy: hypothesis testing using
phylogenies. Bioinformatics 21:67 -679.
Langmead B, Salzberg SL. 2012. Fast gapped-read alignment with Bowtie 2. Nat. Methods
9:357 359.
Le Duc D, et al. 2015. Kiwi genome provides insights into evolution of a nocturnal lifestyle.
Genome Biol. 16:147.
Li H, et al. 2009. The sequence alignment/map format and SAMtools. Bioinformatics 25:2078
2079.
Lunter G, Goodson M. 2011. Stampy: a statistical algorithm for sensitive and fast mapping of
Illumina sequence reads. Genome Res. 21:936 939.
McCallum J, et al. 2013. Highly informative ancient DNA `snippets' for New Zealand moa.
PLoS One 8:e50732.
Petit F, Sears KE, Ahituv N. 2017. Limb development: a paradigm of gene regulation. Nat Rev
Genet. 18:245 258.
Phillips MJ, Gibb GC, Crimp EA, Penny D. 2010. Tinamous and moa flock together:
mitochondrial genome sequence analysis reveals independent losses of flight among
ratites. Syst Biol. 59:90 107.
Rawlence NJ, Wood JR, Armstrong KN, Cooper A. 2009. DNA content and distribution in
ancient feathers and potential to reconstruct the plumage of extinct avian taxa. Proc Roy
20bioRxiv preprint first posted online Feb. 9, 2018; doi: http://dx.doi.org/10.1101/262816. The copyright holder for this preprint (which
was not peer-reviewed) is the author/funder, who has granted bioRxiv a license to display the preprint in perpetuity.
All rights reserved. No reuse allowed without permission.
Soc B Biol Sci. 276:3395 3402.
Sackton T, et al. 2018. Convergent regulatory evolution and the origin of flightlessness in
palaeognathous birds. bioRxiv doi: https://doi.org/10.1101/262584.
Sawyer S, Krause J, Guschanski K, Savolainen V, Pääbo S. 2012. Temporal patterns of
nucleotide misincorporations and DNA fragmentation in ancient DNA. PLoS One
7:e34131.
Selkoe KA, Toonen RJ. 2006. Microsatellites for ecologists: a practical guide to using and
evaluating microsatellite markers. Ecol Lett. 9:615 629.
Simão FA, Waterhouse RM, Ioannidis P, Kriventseva EV, Zdobnov EM. 2015. BUSCO:
assessing genome assembly and annotation completeness with single-copy orthologs.
Bioinformatics 31:3210 3212.
Smith MD, et al. 2015. Less is more: an adaptive branch-site random effects model for efficient
detection of episodic diversifying selection. Mol Biol Evol. 32:1342 1353.
Storey J. 2015. qvalue: Q-value estimation for false discovery rate control. R package version
2.0.0. http://qvalue.princeton.edu, http://github.com/jdstorey/qvalue.
Tanaka M. 2013. Molecular and evolutionary basis of limb field specification and limb initiation.
Dev Growth Differ. 55:149 163.
Tickle C. 2015. How the embryo makes a limb: determination, polarity and identity. J Anat.
227:418 430.
Wertheim JO, Murrell B, Smith MD, Kosakovsky Pond SL, Scheffler K. 2015. RELAX:
detecting relaxed selection in a phylogenetic framework. Mol Biol Evol. 32:820 832.
Wood JR, et al. 2013a. A megafauna's microfauna: gastrointestinal parasites of New Zealand's
extinct moa (Aves: Dinornithiformes). PLoS One 8:e57315.
21bioRxiv preprint first posted online Feb. 9, 2018; doi: http://dx.doi.org/10.1101/262816. The copyright holder for this preprint (which
was not peer-reviewed) is the author/funder, who has granted bioRxiv a license to display the preprint in perpetuity.
All rights reserved. No reuse allowed without permission.
Wood JR, et al. 2013b. Resolving lost herbivore community structure using coprolites of four
sympatric moa species (Aves: Dinornithiformes). Proc Natl Acad Sci U S A. 110:16910
16915.
Worthy TH, Holdaway RN. 2002. The lost world of the moa: prehistoric life of New Zealand.
Bloomington: Indiana University Press.
Yang Z. 2007. PAML 4: phylogenetic analysis by maximum likelihood. Mol Biol Evol.
24:1586 1591.
Zakany J, Duboule D. 2007. The role of Hox genes during vertebrate limb development. Curr
Opin Genet Dev. 17:359 366.
Zhang G, et al. 2014. Comparative genomic data of the avian phylogenomics project.
GigaScience 3:26.
22bioRxiv preprint first posted online Feb. 9, 2018; doi: http://dx.doi.org/10.1101/262816. The copyright holder for this preprint (which
was not peer-reviewed) is the author/funder, who has granted bioRxiv a license to display the preprint in perpetuity.
All rights reserved. No reuse allowed without permission.
Table 1 Read mapping information for little bush moa sequencing libraries
TruSeq libraries Nextera libraries
CTTGTA GCCAAT AGGCAG CAGAGA CTCTCT
Raw reads (paired) 530,099,258 59,208,990 46,836,756 35,552,367 38,311,748
Trimmed reads
Paired 486,360,442 57,743,619 45,142,645 34,079,453 36,434,453
Single 27,247,969 1,059,500 44,515 35,261 46,412
Alignment rate (MAPQ ³ 30, %) 12.9 9.4 0.3 0.4 0.3
Duplicates (% of mapped) 69.4 98.7 75.0 81.9 73.7
Mean mapped read length (bp)1
Paired 98.7 94.2 72.7 69.5 67.8
Single 84.2 69.7 86.7 63.0 49.6
Mean insert size (bp)1 206.8 274.0 90.4 78.6 74.9
1
for de-duplicated reads
Table 2 Assembly statistics for emu reference and little bush moa nuclear genomes
Emu Little bush moa
No. Scaffolds 2,882 1,942
Total scaffold length (bp, gapped) 1,192,339,227 1,190,767,405
Total ACGT bases (bp) 1,179,147,775 889,712,222
No. Contigs 18,794 1,335,004
Contig N50 (bp) 189,906 1,126
Mean contig size (bp) 62,817 673
Avg. break between contigs (bp) 738 218
Total BUSCOs 4799/4915 (97.6%) 4289/4915 (87.3%)
Complete BUSCOs 4628/4915 (94.2%) 3693/4915 (75.1%)
23bioRxiv preprint first posted online Feb. 9, 2018; doi: http://dx.doi.org/10.1101/262816. The copyright holder for this preprint (which
was not peer-reviewed) is the author/funder, who has granted bioRxiv a license to display the preprint in perpetuity.
All rights reserved. No reuse allowed without permission.
Table 3 Tests of selection for candidate limb development genes
Gene Description CDS length RELAX tests
(AA, % of total) Moa All flightless
Chicken Emu Moa K Padj K Padj
a) Candidate limb development genes
FGF8 Fibroblast growth factor 8 214 214 189 (88%) 3.912 0.991 49.994 0.081
FGF10 Fibroblast growth factor 10 212 212 204 (96%) 0.494 0.419 1.052 0.542
GLI3 GLI family zinc finger 3 1576 1575 1570 (99%) 1.491 0.389 0.359 0.006
HOXA1 Homeobox A1 320 319 308 (96%) 0.999 0.991 0.931 0.459
HOXA2 Homeobox A2 375 374 357 (95%) 0.178 0.074 3.424 < 0.001
HOXA3 Homeobox A3 413 413 414 (100%) 1.491 0.389 1.033 0.525
HOXA4 Homeobox A4 309 145† 155 (50%) 0.365 0.389 2.564 0.006
HOXA5 Homeobox A5 270 270 251 (93%) 29.348 0.289 0.633 0.215
HOXA6 Homeobox A6 231 231 231 (100%) 0.828 0.808 0.272 0.365
HOXA7 Homeobox A7 219 219 219 (100%) 28.556 0.389 1.156 0.425
HOXA9 Homeobox A9 260 261 249 (95%) 1.985 0.389 2.040 0.084
HOXA10 Homeobox A10 364 317† 289 (79%) 1.239 0.934 2.914 0.062
HOXA11 Homeobox A11 297 297 255 (86%) 0.303 0.389 1.453 0.110
HOXA13 Homeobox A13 290 290 269 (93%) 1.179 0.934 0.858 0.459
HOXD3 Homeobox D3 413 248† 247 (60%) 1.211 0.808 1.326 0.425
HOXD4 Homeobox D4 237 237 202 (85%) 1.125 0.966 9.667 0.006
HOXD8 Homeobox D8 268 147† 146 (54%) 0.607 0.497 < 0.001 0.379
HOXD9 Homeobox D9 302 299 283 (94%) 0.295 0.339 0.816 0.217
HOXD10 Homeobox D10 339 339 339 (100%) 0.923 0.991 49.998 0.152
HOXD11 Homeobox D11 280 282 272 (96%) 0.967 0.976 0.642 0.081
HOXD12 Homeobox D12 266 266 266 (100%) 1.452 0.397 1.006 0.569
HOXD13 Homeobox D13 301 82† 74 (25%) 0.926 0.991 0.939 0.525
SALL4 Spalt-like transcription factor 4 1108 1111 1023 (92%) 0.793 0.389 0.860 0.146
SHH Sonic hedgehog 425 422 398 (94%) 1.979 0.389 0.974 0.542
TBX5 T-box 5 521 538 426 (79%) 0.240 0.389 1.021 0.545
WNT2B Wnt family member 2B 385 330† 260 (68%) 0.636 0.339 1.703 0.081
b) Candidate genes from the Galapagos cormorant
DCHS1 Dachsous cadherin-related 1 3266 3267 3090 (95%) 1.094 0.389 1.006 0.554
DVL1 Dishevelled segment polarity 712 655† 633 (89%) 1.326 0.397 0.814 0.127
protein 1
DYNC2H1 Dynein cytoplasmic 2 heavy chain 1 4301 4295 3991 (93%) 1.152 0.389 0.763 0.089
EVC EvC ciliary complex subunit 1 984 927† 871 (89%) 0.169 0.389 0.654 0.023
FAT1 FAT atypical cadherin 1 4645 4644 4489 (97%) 1.493 0.013 0.880 0.024
GLI2 GLI family zinc finger 2 1528 1528 1528 (100%) 0.408 0.013 0.927 0.262
IFT122 Intraflagellar transport 122 1245 1239 1202 (97%) 0.035 0.808 1.311 0.146
KIF7 Kinesin family member 7 1412 1279† 1226 (87%) 0.683 0.389 1.204 0.146
OFD1 OFD1, centriole and centriolar 1012 1014 1002 (99%) 0.978 0.991 0.006 0.102
satellite protein
TALPID3 KIAA0586 1523 1527 1474 (97%) 0.748 0.389 0.035 0.023
WDR34 WD repeat domain 34 500 502 459 (91%) 18.909 0.251 0.776 0.102
K: Relaxation parameter (values < 1 indicate relaxed selection on foreground branches, values > 1 denote intensified selection)
Padj: Adjusted P-value (Q-value) controlling for the false discovery rate at a significance level of 0.05 based on N= 37 genes tested
†
Partial CDS recovered in the emu reference sequence
24bioRxiv preprint first posted online Feb. 9, 2018; doi: http://dx.doi.org/10.1101/262816. The copyright holder for this preprint (which
was not peer-reviewed) is the author/funder, who has granted bioRxiv a license to display the preprint in perpetuity.
All rights reserved. No reuse allowed without permission.
FIGURE CAPTIONS
Fig. 1 Endogenous DNA content across library preparations. A) Proportion of final nuclear
genome assembly attributable to sequencing reads from each library. B) MEGAN assignment of
taxonomic affiliations for individual sequencing reads. C) Proportions of reads assigned to avian
species by taxonomic profiling compared to proportions mapped to the emu reference genome.
Fig. 2 Little bush moa genome assemblies. A) De novo assembled mitochondrial genome, with
locations of annotated genes and RNAs indicated. Inward-facing plot shows per-base depth of
coverage (DoC). B) Reference-based nuclear genome assembly. Alternating gray and blue
sections along outer circle indicate individual scaffolds in order of decreasing size. Inward-
facing plot shows depth of coverage calculated in ten non-overlapping windows per scaffold.
Fig. 3 Polymorphic microsatellite repeat identified from the little bush moa nuclear genome. A)
Partial sequence for microsatellite anoDid_tri6 showing the consensus genome sequence in
black, with mapped reads below. Partners belonging to the same read pair are shaded with the
same color, while unpaired reads or those whose partner falls outside the illustrated region are
shaded in gray. The microsatellite repeat region is boxed, showing the heterozygous GTT 7/GTT9
genotype for this individual. B) Multiple sequence alignment with the corresponding genomic
region from other ratites. The microsatellite repeat region is boxed.
Suppl. Fig. S1 Patterns of DNA damage estimated for reads mapping to the little bush moa
nuclear (A, B) and mitochondrial (C, D) genomes are consistent with expectations for aDNA.
A,C) Excess of purines immediately preceding strand breaks (note that observed coordinates for
purine enrichment are shifted slightly relative to expectations likely due to some fragments
resulting from DNA shearing during library preparation). B,C) Increased C-to-T transitions
towards fragment edge.
25bioRxiv preprint first posted online Feb. 9, 2018; doi: http://dx.doi.org/10.1101/262816. The copyright holder for this preprint (which
was not peer-reviewed) is the author/funder, who has granted bioRxiv a license to display the preprint in perpetuity.
All rights reserved. No reuse allowed without permission.
Suppl. Fig. S2 Mitochondrial control region sequence corroborates taxonomic identity of the
little bush moa specimen. Sequence from the current study is shown at the top, with reference
little bush moa sequences aligned below. GenBank accessions for reference sequences are
followed by specimen identifiers from Bunce et al. (2009), and dots indicate identity with the
first alignment sequence. Samples originating from the South Island of New Zealand are shaded
in blue, those from the North Island in yellow, and the control region snippet of McCallum et
al. (2013) is boxed.
Suppl. Fig. S3 The 4 amino acid deletion in CUX1 of the Galapagos cormorant (P. harrisi)
described by Burga et al. (2017) is not shared with other flightless birds (penguins and ratites).
26A B C
ra AT
s
li b C A
r ie
ra C
40
xte di G
15
Taxonomy assigned (% of total reads)
Taxonomy assigned (% of total reads)
Ne . di
A
30
10
20
A. didi CTTGTA 5
10
0 0
CTTGTA GCCAAT AGGCAG CAGAGA CTCTCT CTTGTA GCCAAT AGGCAG CAGAGA CTCTCT
TruSeq libraries Nextera libraries TruSeq libraries Nextera libraries
Bacteria Archaea Other Aves (total) Palaeognath
Aves (total) Human Bowtie mapped (total) Bowtie mapped (MAPQ ³ 30)
Fig. 1You can also read