Assembly of Long Error-Prone Reads Using Repeat Graphs - bioRxiv
←
→
Page content transcription
If your browser does not render page correctly, please read the page content below
bioRxiv preprint first posted online Jan. 12, 2018; doi: http://dx.doi.org/10.1101/247148. The copyright holder for this preprint
 (which was not peer-reviewed) is the author/funder, who has granted bioRxiv a license to display the preprint in perpetuity.
                              It is made available under a CC-BY-NC-ND 4.0 International license.

                   Assembly of Long Error-Prone Reads Using Repeat Graphs

                       Mikhail Kolmogorov1, Jeffrey Yuan2, Yu Lin3, and Pavel. A. Pevzner1
          1
        Department of Computer Science and Engineering, University of California, San Diego
    2
     Graduate Program in Bioinformatics and Systems Biology, University of California, San Diego
                3
                  Research School of Computer Science, Australian National University

                                                               ABSTRACT

   The problem of genome assembly is ultimately linked to the problem of the characterization of all repeat
   families in a genome as a repeat graph. The key reason the de Bruijn graph emerged as a popular short
   read assembly approach is because it offered an elegant representation of all repeats in a genome that
   reveals their mosaic structure. However, most algorithms for assembling long error-prone reads use an
   alternative overlap-layout-consensus (OLC) approach that does not provide a repeat characterization. We
   present the Flye algorithm for constructing the A-Bruijn (assembly) graph from long error-prone reads,
   that, in contrast to the k-mer-based de Bruijn graph, assembles genomes using an alignment-based A-
   Bruijn graph. In difference from existing assemblers, Flye does not attempt to construct accurate contigs
   (at least at the initial assembly stage) but instead simply generates arbitrary paths in the (unknown)
   assembly graph and further constructs an assembly graph from these paths. Counter-intuitively, this fast
   but seemingly reckless approach results in the same graph as the assembly graph constructed from
   accurate contigs. Flye constructs (overlapping) contigs with possible assembly errors at the initial stage,
   combines them into an accurate assembly graph, resolves repeats in the assembly graph using small
   variations between various repeat instances that were left unresolved during the initial assembly stage,
   constructs a new, less tangled assembly graph based on resolved repeats, and finally outputs accurate
   contigs as paths in this graph. We benchmark Flye against several state-of-the-art Single Molecule
   Sequencing assemblers and demonstrate that it generates better or comparable assemblies for all analyzed
   datasets.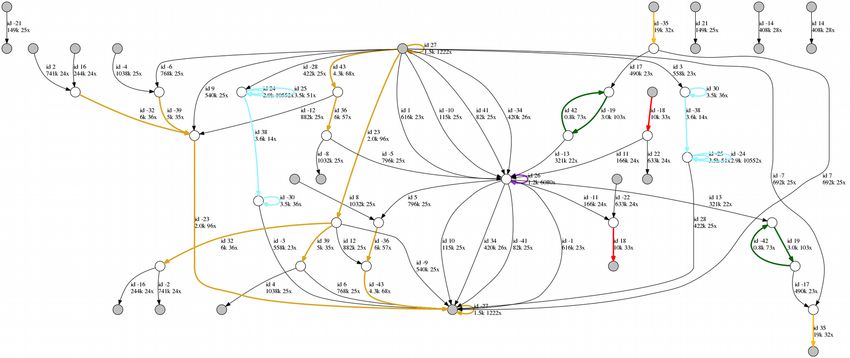
bioRxiv preprint first posted online Jan. 12, 2018; doi: http://dx.doi.org/10.1101/247148. The copyright holder for this preprint
 (which was not peer-reviewed) is the author/funder, who has granted bioRxiv a license to display the preprint in perpetuity.
                              It is made available under a CC-BY-NC-ND 4.0 International license.

                                                           INTRODUCTION

   The problem of genome assembly is ultimately linked to the repeat characterization problem, the
   compact representation of all repeat families in a genome as a repeat graph (Pevzner et al., 2004). Long
   read technologies have not made the repeat characterization problem irrelevant. Instead, they have simply
   shifted the focus from short repeats to longer repeats comparable in length to the median SMS read size;
   e.g., Kamath et al., 2017 analyzed many bacterial genomes that existing SMS assemblers failed to
   assemble into a single contig. Since even bacterial (let alone, eukaryotic) genomes have long repeats,
   SMS assemblers currently face the same challenge that short read assemblers faced a decade ago, albeit at
   a different scale of repeat lengths. To address this assembly challenge, SMS technologies are often
   complemented by contact (Ghurye et al., 2017) and optical (Weissensteiner et al., 2017) mapping data.
            The de Bruijn graph emerged as a popular short read assembly approach because it offered an
   elegant representation of all repeats in a genome. However, most long read assemblers use an alternative
   overlap-layout-consensus (OLC) approach that requires an all-against-all comparison of reads, does not
   yield a natural representation of all repeats in a genome, and does not provide optimal repeat resolution
   (Koren et al., 2012, Chin et al., 2013, Berlin et al., 2015, Chin et al., 2016, Li, 2016, Koren et al., 2017).
   Recent studies of SMS assemblies attempted to integrate the OLC approach by constructing the
   alternative de Bruijn graph of reads (referred to as the assembly graph). Although these approaches
   improved on the OLC-only bacterial assemblies (Lin et al., 2016, Kamath et al., 2017), the de Bruijn
   graph constructed from error-prone SMS reads is very noisy making it difficult to collapse various
   instances of the same repeat into a single path in the assembly graph. Developers of OLC approaches
   realized the importance of repeat characterization and attempted to improve the best overlap graph
   (BOG) representation (Miller et al., 2008) by developing the OLC-based Bogart graph for representing
   repeats (Koren et al., 2017). However, the Bogart graph is quite different from the repeat graph and, as
   acknowledged by the developers of the Canu assembler (Koren et al., 2017), it is still error-prone (see
   Kamath et al., 2017 for a discussion on the differences between the de Bruijn-based and the OLC-based
   repeat representation). As an alternative to these overlap graphs, which are riddled with unnecessary
   edges, the string graph (Meyers, 2005) approach (implemented in the Miniasm assembler) attempts to
   represent unique segments of a genome as non-branching paths. However, as discussed in Kamath et al.,
   2017, the string graph does not achieve an optimal repeat resolution either.
            The challenge of constructing the assembly graph from long reads. Most short read assemblers
   construct the de Bruijn graph based on all k-mers in reads and further transform it into an assembly graph
   using various graph simplification procedures. This approach collapses multiple instances of the same
   repeat into a single path in the assembly graph and represents a genome as a genome tour that visits each
   edge in the assembly graph. However, in the case of SMS reads, the key assumption of the de Bruijn
   graph approach (that most k-mers from the genome are preserved in multiple reads) does not hold even
   for short k-mers, let alone for long k-mers (e.g., k = 1000). As a result, various issues that have been
   addressed in short read assembly (e.g., how to deal with the fragmented de Bruijn graph, how to
   transform it into an assembly graph, etc.) remain largely unaddressed in the case of the de Bruijn graph
   approach to SMS assemblies
            Aggressive approaches to repeat resolution often produce misassemblies while conservative
   approaches lead to fragmented assemblies (Kamath et al., 2017). Construction of an assembly graph is an
   important step towards finding the balance between aggressive and conservative approaches since it
   allows one to distinguish repeats that can be resolved from those that cannot. Constructing an assembly
   graph for SMS reads improves repeat resolution as compared to various OLC assemblers (Kamath et al.,
   2017) because it is better suited for finding this balance. Also, since assembly graphs represent a special
   case of breakpoint graphs used for genome rearrangement studies (Lin et al., 2014), they are well suited
   for the analysis of genome variations using SMS reads (Chaisson et al., 2015, Nattestad et al., 2017).
            Here, we describe the Flye algorithm for constructing assembly graphs from polished contigs
   rather than from error-prone reads (as in HINGE), thus making the graph more accurate (see Appendix
   “Short read assemblers and the challenge of repeat resolution” for a discussion on contig assembly in the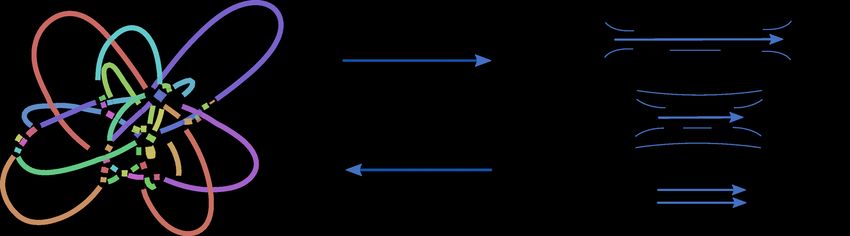
bioRxiv preprint first posted online Jan. 12, 2018; doi: http://dx.doi.org/10.1101/247148. The copyright holder for this preprint
 (which was not peer-reviewed) is the author/funder, who has granted bioRxiv a license to display the preprint in perpetuity.
                              It is made available under a CC-BY-NC-ND 4.0 International license.

   case of short read sequencing). Flye also complements HINGE by introducing a new algorithm that uses
   small differences between repeat copies to resolve unbridged repeats that are not spanned by any reads.
             Flye is built on top of the ABruijn assembler (Lin et al., 2016), which generates accurate
   overlapping contigs but does not reveal the repeat structure of the genome. In contrast to ABruijn, Flye
   initially generates inaccurate overlapping contigs (i.e., contigs with potential assembly errors) and
   combines these initial contigs into an accurate assembly graph that encodes all possible assemblies
   consistent with the reads. Flye further resolves unbridged repeats in the assembly graph thus constructing
   a new, less tangled assembly graph, and finally outputs accurate final contigs formed by paths in this
   graph. We benchmarked Flye against several state-of-the-art SMS assemblers using various datasets and
   demonstrated that it generates accurate assemblies while also providing insights into how to plan
   additional experiments (e.g., using contact or optical maps) to finish the assembly.

                                                                METHODS

   Repeat graphs. Repeats in a genome are often represented as pairwise local alignments between various
   regions of the genome and visualized as two-dimensional dot plots representing all alignment paths. This
   pairwise representation is limited since it does not contribute to solving the repeat characterization
   problem. In contrast, the repeat graph (Pevzner et al., 2004) compactly represents all repeats in a genome
   and reveals their mosaic structure. The construction of an assembly graph represents a special case of the
   repeat graph construction problem, which we discuss below.
             Consider a tour T=v1, v2, … vn of length n visiting all vertices of a directed graph G. We say that
   the i-th and j-th vertices in the tour T are equivalent if they correspond to the same vertex of the graph
   (i.e., vi=vj). The set of all pairs of equivalent vertices forms a set of points (i,j) in a two-dimensional grid
   that we refer to as the repeat plot PlotT(G) of the tour T (Figure 1). The transformation of a tour T
   traversing a known graph G into the repeat plot PlotT(G) is a simple procedure. Below, we address a
   reverse problem that is at the heart of genome assembly, repeat characterization, and synteny block
   construction: given an arbitrary set of points Plot, in a two-dimensional grid, find a graph G=G(Plot) and
   a tour T in this graph such that Plot = PlotT(G). In the case of repeat characterization, Plot consists of
   points traversed by paths representing all local self-alignments (up to a certain stringency) of a genome
   against itself. Each self-alignment reveals two instances of a repeat corresponding to genomic segments x
   and y (x and y are called the spans of the alignment). Given a genome of length n and a set of its pairwise
   self-alignments Plot, the goal is to construct a graph G and a tour T of length n in this graph (each
   segment of the genome corresponds to a subpath of the graph traversed by the tour) such that Plot =
   PlotT(G) and for each alignment with spans x and y, paths in the graph corresponding to segments x and y
   coincide.
   Generating all local self-alignments of a genome. Our goal is to represent all long repeats in a genome
   as a repeat graph (Pevzner et al., 2004). Constructing the de Bruijn graph based on long k-mers will not
   solve this problem since the differences between imperfect repeat copies mask the repeat structure of the
   genome. Constructing the de Bruijn graph based on short k-mers will not solve this problem due to the
   presence of repeating short k-mers within long repeats (these k-mers lead to a tangled repeat graph). Thus,
   while all long similar segments can be generated based on pairwise alignments and combined into a
   repeat plot Plot, it is unclear how to solve the reverse problem of combining them into the repeat graph
   G(Plot) of the genome. Although Pevzner et al., 2004 described various graph simplification procedures
   (that are now at the heart of various short read assemblers) to address this problem for short reads, it is not
   clear how to generalize these procedures to make them applicable to SMS assemblies. Below we describe
   how the concept of a punctilious repeat graph (introduced in Pevzner et al., 2004) can be modified for
   assembling SMS reads.
   From local alignments to a punctilious repeat graph. Let Alignments=Alignmentsk(Genome) be the set
   of all pairwise local alignments of length at least k between various segments of a genome Genome.
   Given a set of self-alignments Alignments of a genome Genome, we construct the punctilious repeat
   graph G(Genome, Alignments) by representing Genome as a path consisting of |Genome| vertices (Figure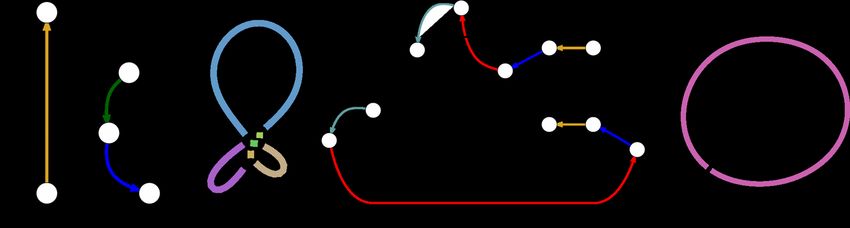
bioRxiv preprint first posted online Jan. 12, 2018; doi: http://dx.doi.org/10.1101/247148. The copyright holder for this preprint
 (which was not peer-reviewed) is the author/funder, who has granted bioRxiv a license to display the preprint in perpetuity.
                              It is made available under a CC-BY-NC-ND 4.0 International license.

   1) and simply “gluing” each pair of vertices (positions in the genome) that are aligned against each other
   in one of the alignments in Alignments (Pevzner et al., 2004). Gluing vertices v and w amounts to
   substituting them by a single vertex that is connected by edges to all vertices that either vertex v or vertex
   w is connected to. We consider branching vertices (i.e., vertices with either in-degree or out-degree
   differing from 1) in the resulting graph and substitute each non-branching path of length m between them
   by a single edge of length m. Edges in the punctilious assembly graph are classified into long (longer than
   a predefined threshold d) and short (Figure 1).

   Figure 1. Constructing the repeat plot of a tour in a graph (left) and constructing the repeat graph from a
   repeat plot (right). (Left) A tour T = …A1B2C3D4…B5C6D7E8…A9B10C11D12E13… in a graph G with red, green, and
   blue instances of a repeat. Dots represent multiple vertices that appear before, between, and after these three
   instances of the repeat. The repeat plot PlotT(G) consists of three diagonals representing the three instances of the
   repeat in the tour. The trivial self-alignment of the entire genome against itself is shown by the dotted diagonal
   (since the repeat plot is symmetric, the points below this diagonal are not shown). Since vertex A in the graph is
   visited twice in the tour T, it results in a single point (1,9) in PlotT(G). Vertex B results in points (2,5), (2,10), and
   (5,10), vertex C results in points (3,6), (3,11), and (6,11), vertex D results in points (4,7), (4,12), and (7,12), and
   vertex E results in the point (8,13). (Right) Constructing the punctilious repeat graph from the repeat plot by gluing
   vertices with indices i and j for each point (i,j) in the repeat plot. Each non-branching path in the graph is substituted
   by a single edge with length equal to the number of edges in this path. The lengths of the short edges (A,B) and
   (D,E) in the resulting graph are equal to 1 and the length of the long edge (B,D) is equal to 2 (for the edge length
   threshold d=1)..The punctilious repeat graph (second graph from the bottom) is transformed into the repeat graph
   (bottom-most graph) by contracting short edges (A,B) and (D,E).
   Figure 1 presents a simple repeat plot where the ending positions of various pairwise alignments are
   coordinated. In reality, they are typically not coordinated, e.g., three alignment paths corresponding to
   three repeat copies starting at position x, y, and z hardly ever start at points (x,y), (x,z), and (y,z) in the

   repeat plot. Because each repeat with m copies results in                   (m2 )    local alignments, there will be             (m2 )
   gluing operations for the starting positions of this repeat and the same number of gluing operations for the
   ending positions of this repeat. Note that each of these operations may form a new branching vertex in the
   punctilious repeat graph. For example, gluing the endpoints of the three diagonals in Figure 1 results in
   the branching vertices A, B, C, and D in the graph. Punctilious repeat graphs of real genomes often
   contain many branching vertices making it difficult to compactly represent repeats. We address this
   challenge by transforming the punctilious repeat graph into a simpler repeat graph.
bioRxiv preprint first posted online Jan. 12, 2018; doi: http://dx.doi.org/10.1101/247148. The copyright holder for this preprint
(which was not peer-reviewed) is the author/funder, who has granted bioRxiv a license to display the preprint in perpetuity.
It is made available under a CC-BY-NC-ND 4.0 International license.
From punctilious repeat graph to repeat graph. Since endpoints of alignment paths representing the
same repeat are not coordinated among all pairwise alignments of this repeat, these uncoordinated
alignments result in a complex repeat graph with many short edges (shorter than a predefined length
threshold d). The repeat graph G(Genome, Alignments, d) is defined as the result of contracting all short
edges in the punctilious repeat graph (Figure 1). The contraction of an edge is simply the gluing the
endpoints of this edge, followed by the removal of the loop-edge resulting from this gluing. Since the
genome represents a tour visiting all edges in the repeat graph, we define the multiplicity of an edge in the
repeat graph as the number of times this edge is traversed in the tour. Edges of multiplicity 1 are called
unique edges and edges of multiplicity more than 1 are called repeats.
An alternative approach to constructing repeat graphs. The described approach, although simple in
theory, results in various complications in the case of real genomes (see Pevzner et al., 2004), particularly
in the case of inconsistent pairwise alignments (see Appendix “Consistent alignments”). In difference
from the approach in Pevzner et al., 2004, Flye constructs an approximate version of the repeat graph that
focuses on the endpoints of alignments rather than the entire alignment paths, resulting in simpler repeat
graphs that are better suited for assembling SMS reads.
Some branching vertices in the repeat graph have arisen from the contraction of multiple vertices
in the punctilious repeat graph into a single branching vertex in the repeat graph, e.g., vertices A and B
were contracted into a single vertex A/B in the repeat graph in Figure 1. Consider the set of all vertices in
the punctilious repeat graph that gave rise to branching vertices in the repeat graph (vertices A, B, D, and
E in Figure 1) and let Endpoints = Endpoints(Genome, Alignments, d) be the set of all positions in the
genome that gave rise to these vertices (Endpoints={1,2,4,5,7,8,9,10,12,13} in Figure 1). This set of
vertices forms a set of short contiguous genomic segments that contain the endpoints of all pairwise
alignments in Alignments. As an example in Figure 1, the set Endpoints forms segments [1,2], [4,5],
[7,8,9,10], and [12,13].
Figure 2. Repeat graph construction from local alignments within a genome. (Left) Alignment paths for all local
self-alignments within a genome XABYABZBU (with three instances of a mosaic repeat: AB, AB, and B)
represented as a repeat plot. The self-alignment of the entire genome is shown by the dotted diagonal. Alignment
endpoints are clustered together if their projections on the main diagonal coincide or are close to each other (clusters
of closely located endpoints for d=0 are painted with the same color). For example, rightmost endpoints (shown in
blue) of all three alignments form a single cluster because every two of them share the same projection on the main
diagonal. This clustering reveals three clusters (yellow, purple, and blue) with eight endpoints (Top right)
Projections of the clustered endpoints on the main diagonal define eight vertices of the repeat graph. (Middle right).
Gluing endpoints that belong to the same clusters. (Bottom right) Gluing parallel edges in the resulting graph
(parallel edges are glued if there exists an alignment between their sequences), which results in the approximate
repeat graph.
Flye approximates the set Endpoints by recruiting all horizontal and vertical projections of endpoints of
alignments from Alignments to the main diagonal in the repeat plot. Figure 2 presents three alignments
resulting in eight projected points on the main diagonal. Two alignment endpoints are close if their
projections on the main diagonal are located within distance threshold d (including the case when abioRxiv preprint first posted online Jan. 12, 2018; doi: http://dx.doi.org/10.1101/247148. The copyright holder for this preprint
(which was not peer-reviewed) is the author/funder, who has granted bioRxiv a license to display the preprint in perpetuity.
It is made available under a CC-BY-NC-ND 4.0 International license.
vertical projection of one endpoint coincides or is close to a horizontal projection of another endpoint).
Flye clusters close endpoints together based on single linkage clustering, resulting in three clusters with
eight endpoints in Figure 2 (clusters for d=0 are painted with the same color). Flye further approximates
the repeat graph by gluing endpoints that belong to the same clusters as shown in Figure 2. However, the
repeat graph constructed based on the clustering of closely located endpoints may differ from the repeat
graph constructed based on the punctilious assembly graph. Appendix “Inconsistent alignments result in
incorrect clustering-based repeat graph” illustrates that mosaic repeat structures and inconsistencies of
local alignments may result in an “incorrect” clustering-based repeat graph. Below we explain how Flye
iteratively extends the set Endpoints to address this complication.
Extending the set of alignment endpoints. Given a set of alignments Alignments, Flye first projects their
endpoints onto the main diagonals in the repeat plot, resulting in the set Endpoints. Each point in an
alignment-path in the |Genome|×|Genome| grid has two projections (horizontal and vertical) on the main
diagonal. Note that projections of some internal points in an alignment path may belong to Endpoints; for
example, both projections of the middle-point of the longest alignment-path in Figure 2 belong to
Endpoints. Such internal points should be re-classified as new alignment endpoints (essentially by
breaking an alignment into two parts) to avoid inconsistencies during the construction of the repeat graph.
Below we explain how to extend the set Endpoints to address this complication.
A point in an alignment-path is called a valid point if both its projections belong to Endpoints,
and an invalid point if only one of its projections belongs to Endpoints (see Appendix: “Inconsistent
alignments result in incorrect clustering-based repeat graph” for an example of an invalid point). Invalid
points complicate the task of generating a new set of alignment endpoints (by sub-partitioning the
alignment paths) since alignment endpoints have two rather than a single projection on the main diagonal.
Flye thus iteratively adds the missing projection for each invalid point to the set Endpoints on the main
diagonal until there are no invalid points left. Afterwards, it clusters points in Endpoints that are less than
d nucleotides apart using single linkage clustering. Each resulting cluster corresponds to a segment
between its minimal and maximal positions on the main diagonal and these segments form a set
EndpointSegments. Two segments from EndpointSegments are equivalent if there exists a valid point in
one of the alignments such that one of its projections to the main diagonal falls into the first segment and
another falls into the second segment.
Flye selects a middle point from each segment in EndpointSegments and glues the two middle
points for every pair of equivalent segments. Finally, it glues together parallel edges (edges that start and
end at the same vertices) if the genome segments corresponding to these edges are aligned in Alignments,
i.e., if there exists an alignment with its x- and y-spans overlapping both these segments.
From the repeat graph of a genome to the assembly graph of contigs. ABruijn constructs a set of
contigs Contigs by implicitly “extending” paths in an (unknown) assembly graph. When the path
extension process reaches a branching vertex, ABruijn decides whether to continue or to stop the path
extension (as described in Lin et al., 2016) in order to avoid assembly errors. Since ABruijn does not
know the exact locations of branching vertices, it extends the path beyond the branching vertex by at least
a predefined threshold of minOverlap nucleotides even in the case that it decides to stop the path
extension process. As a result, various contigs constructed by ABruijn overlap. Flye uses these overlaps
for assembly graph construction and concatenates all contigs in Contigs (separated by delimiters) in an
arbitrary order into a single sequence Contigs*. It further constructs the assembly graph as the repeat
graph Graph(Contigs*, Alignments, d) of the concatenate. Pevzner et al., 2004 demonstrated that the
assembly graph of reads approximates the repeat graph of the genome. Thus, the assembly graph
constructed from accurate contigs (which can be viewed as virtual reads) also approximates the repeat
graph of the genome. Below we discuss the construction of assembly graphs from inaccurate contigs.
Constructing an accurate assembly graph from misassembled contigs. In contrast to all existing SMS
assemblers that invest significant effort into making sure that generated contigs are correctly assembled
(that they represent subpaths of the genomic tour in the assembly graph), Flye does not attempt to
construct accurate contigs (Flye contigs instead represent arbitrary paths in the assembly graph).
However, it constructs an accurate assembly graph from inaccurate contigs.bioRxiv preprint first posted online Jan. 12, 2018; doi: http://dx.doi.org/10.1101/247148. The copyright holder for this preprint
(which was not peer-reviewed) is the author/funder, who has granted bioRxiv a license to display the preprint in perpetuity.
It is made available under a CC-BY-NC-ND 4.0 International license.
Flye randomly walks in the (unknown) assembly graph to generate random paths from this graph.
Each non-chimeric read from Reads defines a subpath of a genomic tour in an (unknown) assembly
graph. Flye extends this path by switching from the current read to any other overlapping read rather than
a carefully chosen overlapping read like in Lin et al., 2016. Thus, the contig extension is greatly speed-up
since it merely selects a read that shares a sufficiently long common jump-subpath with the current read
(Lin et al., 2016) and avoids a time-consuming test to check if this selection is correct.
Since the resulting FlyeWalk algorithm (Figure 3) does not invoke the contig correctness
check, it constructs paths (sequence of overlapping reads) that do not necessarily follow the genome tour
through the assembly graph. Although it may appear counter-intuitive that inaccurate contigs constructed
by FlyeWalk result in an accurate assembly graph, note that inaccurate contigs in the de Bruijn graph (a
special case of the assembly graph) certainly result in an accurate assembly graph. Indeed, an assembly
graph constructed from arbitrary paths in a de Bruijn graph is the same as the original de Bruijn graph (as
long as these paths include all k-mers from the assembly graph). See Appendix “Flye constructs an
accurate assembly graph from inaccurate FlyeWalk contigs.”
Figure 4, left, presents a rather complex assembly graph of the SMS reads from an E. coli strain
NCTC9964 (EC9964 dataset described in the Appendix “Information about the BACTERIA datasets”).
Flye further untangles this graph into a graph with just six edges (Figure 4, middle) as described below.
FlyeWalk(AllReads, MinOverlap)
Contigs ← empty set of contigs
UnprocessedReads ← AllReads
for each Read in UnprocessedReads
Path ← ExtendRead(UnprocessedReads, Read, MinOverlap)
ContigReads ← MapReads(AllReads, Path, MinOverlap)
ContigSequence ← Consensus(AllReads, ContigReads, MinOverlap)
add ContigSequence to Contigs
remove ContigReads from UnprocessedReads
return Contigs
ExtendRead(UnprocessedReads, Read, MinOverlap)
Path ← sequence of reads consisting of a single read Read
while forever
NextRead ← FindNextRead(UnprocessedReads, Read, MinOverlap)
if NextRead = empty string
return Path
else
add NextRead to Path
Read ← NextRead
remove Overlap(Read)from UnprocessedReads
Figure 3. Pseudocode of the FlyeWalk algorithm. FlyeWalk iteratively extends each unprocessed read to form a
path formed by the selected reads. Each such path contributes to a contig and FlyeWalk outputs the set of all contigs
resulting from such path extensions. ExtendRead generates a random walk in the assembly graph, which starts at a
given read and constructs a path (sequence of overlapping reads) that contributes to a constructed contig. It
terminates when there are no unprocessed reads overlapping the current read by at least MinOverlap nucleotides.
FindNextRead finds an unprocessed read that overlaps with the given read by at least MinOverlap nucleotides and
returns an empty string if there are no such reads. MapReads finds all reads that map to a given path of reads (by at
least MinOverlap nucleotides). Consensus constructs the consensus of all reads that contribute to a given contig.
Overlap finds all reads that overlap a given read by at least MinOverlap nucleotides.
Contracted assembly graph. Flye aligns all reads to the constructed assembly graph (Appendix
“Aligning reads to assembly graph”) and classifies all edges in the assembly graph into unique and repeat
edges (Appendix “Classifying edges of the assembly graph”). It further transforms the assembly graph
into the contracted assembly graph by contracting all its repeat edges. Aligning a read to the assembly
graph induces its alignment to the contracted assembly graph, and we focus on spanning reads that align
to multiple edges in the contracted assembly graph. Untangling incident edges e=(w,v) and f=(v,u) in thebioRxiv preprint first posted online Jan. 12, 2018; doi: http://dx.doi.org/10.1101/247148. The copyright holder for this preprint
(which was not peer-reviewed) is the author/funder, who has granted bioRxiv a license to display the preprint in perpetuity.
It is made available under a CC-BY-NC-ND 4.0 International license.
contracted assembly graph amounts to substituting them by a single edge (w,u). Below we describe how
Flye uses spanning reads to untangle the contracted assembly graph.
Untangling the contracted assembly graph. A spanning read in the contracted assembly graph is
classified as an (e,f)-read if it traverses two consecutive edges e and f in this graph. For each pair of
incident edges e and f in the contracted assembly graph, we define transition(e,f) as the number of (e,f)-
reads plus the number of (f’,e’)-reads, where e’ and f’ are complementary edges for e and f, i.e., edges
representing a complementary strand.
Given a set of spanning reads in the contracted assembly graph, we construct a transition graph
as follows. Each edge e in the contracted assembly graph corresponds to vertices eh and et in the transition
graph, representing the head and tail of e, respectively (a complementary edge for e correspond to the
same vertices, but in the opposite order). Each (e,f)-spanning read defines an undirected edge between eh
and f t in the transition graph with weight equal to transition(e,f).
Note that the transition graph is bipartite for the simple case when the two subgraphs of the
contracted assembly graphs corresponding to complementary strands do not share vertices. However, it is
not necessarily bipartite in the case of genomes that contain long inverted repeats. Flye thus applies
Edmonds’ algorithm (Edmonds, 1965) to find a maximum weight matching in the transition graph and
uses this matching for untangling the contracted repeat graph. For each edge (eh,f t) in the constructed
matching, Flye additionally checks the confidence of the transition between edges e and f (see Appendix
“Additional details on untangling assembly graphs”) and untangles e and f for each edge (eh,f t) in the
transition graph that passes this check. After iterative untangling of edges in the contracted assembly
graph (and the corresponding iterative repeat resolution in the assembly graph), the assembly graph
typically contains only long unbridged repeat edges that are not spanned by any reads.
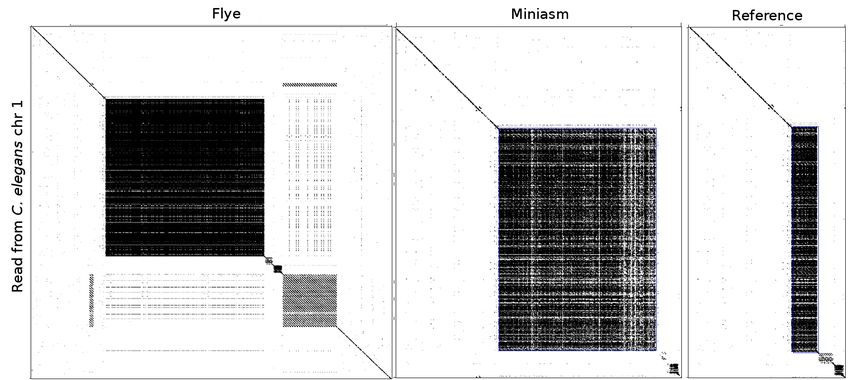
Figure 4. Resolving an unbridged repeat. (Left) An initial assembly graph of the EC9964 genome visualized with
Bandage (Wick et al., 2015). (Middle) Assembly graph (after untangling repeats in the graph on the left using
spanning reads) contains a single unbridged repeat REP (and its complement REP’) of length 22.0 kb. Two
complementary strands are fused together in a single connected component. It is unclear whether the genome
traverses the assembly graph as IN1 REP OUT1 REP’ or as IN1 REP OUT2 REP’. (Right top) The edges ending in
the initial node of the edge REP are denoted as IN1 and IN2, and the edges ending in the terminal node of the edge
REP are denoted OUT1 and OUT2. 93, 71, 75, and 76 reads overlap with both IN1 and REP, IN2 and REP, REP and
OUT1 and REP and OUT2, respectively. The span of 383 reads falls entirely within the edge REP. (Right middle)
After assigning 93 reads that overlap with both IN1 and REP to the first repeat copy, and 71 reads that overlap with
both IN2 and REP to the second repeat copy, we “move forward” into the repeat and construct two differing
consensus sequences for a prefix of REP of length 8.6 kb and divergence 9.8%. Similarly, we construct two
consensus sequences for a 6.8 kb long suffix of REP with divergence 16.8% when we “move backward” into the
repeat. The length of the repeat edge is reduced to 22.0 – 8.6 – 6.8 = 6.6 kb, resulting in the emergence of 13 + 18 =
31 spanning reads for this repeat, all of them supporting a cis transition (IN1 with OUT1 and IN2 with OUT2). (Right
bottom) Two resolved instances of the repeat with consensus sequences REP1 and REP2 with divergence 6.9%.
Resolving unbridged repeats. Resolving unbridged and nearly identical repeat instances is a difficult
problem. SMS assemblers often fail to resolve unbridged repeats longer than 10 kb that are common even
in bacterial genomes (Kamath et al., 2017). Although variations between different repeat copies allow for
the possibility of resolving such repeats (at least in theory), no algorithm for resolving them using shortbioRxiv preprint first posted online Jan. 12, 2018; doi: http://dx.doi.org/10.1101/247148. The copyright holder for this preprint
(which was not peer-reviewed) is the author/funder, who has granted bioRxiv a license to display the preprint in perpetuity.
It is made available under a CC-BY-NC-ND 4.0 International license.
reads has been successful so far. In the case of SMS reads, the problem is further complicated by high
error rates that make it difficult to distinguish repeat copies with smaller divergence than 10%.
This challenge is somewhat related to the challenge of constructing phased diploid genome
assemblies recently addressed by the developers of the Falcon and Canu assembler (Chin et al., 2016,
Koren et al., 2017), but there are important differences specific to repeat resolution, notably, that repeats
are flanked by unique edges. We leverage those differences in our approach, which we describe using the
EC9964 dataset described in the Appendices “Resolving unbridged repeats” and “Information about the
BACTERIA datasets”. For simplicity, we illustrate our algorithm using a 22.0 kb long unbridged repeat
with two copies (referred to as R22) in the EC9964 genome. Flye and HINGE constructed topologically
identical assembly graphs with this repeat unresolved (Figure 4, left), but Flye eventually resolved it
using variations between its repeat copies.
Figure 4 shows this repeat with a corrupted consensus sequence REP in the subgraph of the
assembly graph. Although it is impossible to resolve this repeat (i.e., to pair each entrance to this repeat
with the corresponding exit) if its two copies are identical, it becomes possible if there are sufficient
variations between these copies. The goal is to resolve the two distinct repeat copies and to transform the
single sequence REP into two different repeat instances REP1 and REP2 as shown in Figure 4. Appendix
“Resolving unbridged repeats” describes how Flye resolves unbridged repeats by (i) identifying the
variations between repeat copies, (ii) matching each read with a specific repeat copy using these
variations, and (iii) using these reads to derive a distinct consensus sequence for each repeat copy.
RESULTS
Datasets. We benchmarked various SMS assemblers using the following datasets:
BACTERIA dataset contains 21 datasets from the National Collection of Type Cultures
(NCTC), a project aimed at completing 3000 bacterial genomes using SMS technology
(http://www.sanger.ac.uk/resources/downloads/bacteria/nctc/). We selected these 21 out of 997
datasets because they were studied in detail in Kamath et al. (2017) and used to benchmark
various assemblers. Taking this into account, we only benchmarked Flye against HINGE on these
datasets, since HINGE outperformed the other assemblers studied in Kamath et al. (2017).
YEAST dataset contains Pacific Biosciences (PB) and Oxford Nanopore Technology (ONT)
reads from S. cerevisiae S288c genome of length 12.1 Mb (16 chr.), used in the recent
benchmarking of various SMS assemblers (Giordano et al., 2017). Similar to the original study,
we used the full set of ONT reads (31x coverage) but down-sampled PB reads from the original
120x to 31x coverage to have their coverage and reads length distribution be similar to the ONT
data.
WORM dataset contains Pacific Biosciences reads (coverage 40X) from C. elegans genome of
length 100 Mb (6 chr.) (https://github.com/PacificBiosciences/DevNet/wiki/C.-elegans-data-set ).
HUMAN and HUMAN+ datasets. The HUMAN dataset contain ONT reads (30x coverage)
from the GM12878 human cell line (Jain et al., 2017). The HUMAN+ dataset combines the
HUMAN-dataset with a dataset of ultra long ONT reads (5x coverage) generated using the
recently developed ultra-long read protocol (Jain et al., 2017). The N50 is equal to 12.5 kb and
99.7 kb for the standard and the ultra-long reads, respectively.
Benchmarking Flye, Canu, Falcon, HINGE, and Miniasm. We used QUAST version 5.0 (Mikheenko
et al., 2018) to benchmark the latest versions of all assemblers (see Appendix “Additional information on
benchmarking”). QUAST distinguishes between local and global misassemblies (such as inversions of
large segments) using a parameter minimum misassembly size. However, using the default value for this
parameter, tuned for short read assemblies, results in many local misassemblies with span below 6000
nucleotides reported by QUAST. These misassemblies often represent misalignments of long repetitive
sequences such as the Ty1 transposon in yeast. We thus decided to ignore local misassemblies by setting a
large minimum misassembly size of 6,000 bp (the minimum alignment identity was set to a low 90%).bioRxiv preprint first posted online Jan. 12, 2018; doi: http://dx.doi.org/10.1101/247148. The copyright holder for this preprint
(which was not peer-reviewed) is the author/funder, who has granted bioRxiv a license to display the preprint in perpetuity.
It is made available under a CC-BY-NC-ND 4.0 International license.
Also, since Miniasm returns assemblies with a much larger number of mismatches and indels than other
assemblers, it is not well suited for reference alignment-based quality evaluation, even with a low
minimum alignment identity threshold. To make a fair comparison for Miniasm, we ran the ABruijn
contig polishing module (Lin et al., 2016) on the Miniasm output to improve the accuracy of its contigs.
Analyzing the BACTERIA dataset. Kamath et al., 2017 analyzed various NCTC datasets to
demonstrate the advantages of the HINGE assembly graph approach. This analysis revealed that many
NCTC datasets result in complex assembly graphs with long unbridged repeats that are nearly impossible
to resolve. In contrast, various OLC assemblers attempting to resolve these repeats led to misassemblies.
We ignored small connected components in the assembly graphs (representing plasmids that do not
share repeats with chromosomes) and classified assemblies of the BACTERIA datasets into three groups:
(i) complete if the assembly graph consists of a single loop representing a circular chromosome, (ii) semi-
complete if the assembly graph contains multiple edges but there exists a single solution of the Chinese
postman problem (Edmonds and Johnson, 1973) in this graph, representing a complete circular
chromosome, and (iii) tangled if the assembly graph is neither complete nor semi-complete. While
HINGE does not distinguish between complete and semi-complete assemblies, we argue that ignoring this
separation may lead to assembly errors. Indeed, a semi-complete assembly graph results in a unique
assembly only in the case of uni-chromosomal genomes. In the case of multi-chromosomal genomes or in
the case of plasmids that share repeats with a uni-chromosomal genome, there exist multiple possible
assemblies from a semi-complete assembly graph. Since 10% of known bacterial species are multi-
chromosomal (Jha et al., 2012) and since a large fraction of uni-chromosomal genomes have plasmids
sharing repeats with the chromosome (Antipov et al., 2015), assuming that a semi-complete assembly
graph results in a complete genome reconstruction is dangerous even in the case of bacterial genomes.
Figure 5, left presents an example of a repeat that was resolved by HINGE based on the graph structure.
Figure 5. Differing assembly graphs constructed by Flye and HINGE. (Left) Flye and Hinge assembly graphs of
the KP9657 dataset. There is a single unique edge entering into (and exiting) the unresolved “yellow” repeat and
connecting it to the rest of the graph. Thus, this repeat can be resolved if one excludes a possibility that it is shared
between a chromosome and a plasmid. In contrast to HINGE, Flye does not rule out this possibility and classifies the
blue repeat as unresolved. (Right) Flye and Hinge assembly graphs of the EC10864 dataset show a mosaic repeat of
multiplicity four formed by yellow, blue, red and green edges (the two copies of each edge represent complementary
strands). HINGE reports a complete assembly into a single chromosome.
Before resolving unbridged repeats, Flye assembled genomes from the BACTERIA dataset into four
complete, one semi-complete, and 16 tangled assembly graphs. After resolving unbridged repeats, Flye
assemblies resulted in six complete, three semi-complete, and 12 tangled assembly graphs. The number of
edges in the tangled assembly graph constructed by Flye varied from 3 to 25.
Flye disagrees with HINGE on only three BACTERIA datasets: (i) HINGE reports a complete
assembly of KS11692, while Flye reports a tangled assembly graph that lacks circularization (the mean
read length of the dataset is only 3928); (ii) HINGE reports a better assembly of the EC10864 dataset
(Figure 5, right); (iii) Flye reports a better assembly of the EC9964 dataset after resolving an unbridged
repeat (Figure 4). See Appendix “Information about the BACTERIA dataset” for more details.
Analyzing the YEAST dataset. Table 1 illustrates that all tools but HINGE produced YEAST-PB
assemblies with similar NGA50 ranging from 525 kb for Falcon to 567 kb for Canu (Flye fully assembled
11 out of 16 yeast chromosomes). Assembling this dataset with the original 120x coverage (rather than thebioRxiv preprint first posted online Jan. 12, 2018; doi: http://dx.doi.org/10.1101/247148. The copyright holder for this preprint
(which was not peer-reviewed) is the author/funder, who has granted bioRxiv a license to display the preprint in perpetuity.
It is made available under a CC-BY-NC-ND 4.0 International license.
downsampled 31x coverage) results in very similar assemblies, e.g., NGA50 increased from 561 kb to
581 kb for the Flye assembly. HINGE resulted in a lower NGA50 of 328 kb. Miniasm and Flye generated
more accurate assemblies (10 misassemblies each) as compared to Canu, Falcon and HINGE (20, 26 and
25 misassemblies, respectively). Canu and Flye had the highest reference coverage (99.3% and 98.9%,
respectively) and the most accurate contigs with the same average sequence identity 99.95%. Although
Miniasm generated the least accurate contigs with only ≈90% identity with the reference, its contigs have
become almost as accurate as the Flye contigs after the ABruijn-based polishing.
The YEAST-ONT assemblies show a similar trend, with Miniasm+ABruijn, Flye, and Canu
producing the most accurate assemblies (8, 13 and 16 misassemblies, respectively). However, the Flye
assembly was more contiguous (NGA50 = 769 kb versus 545 kb for Canu and 542 kb for Miniasm).
Although most misassemblies represent small rearrangements, Miniasm and Falcon erroneously fused
two chromosomes each in the YEAST-ONT dataset. For additional information, see Appendix “Assembly
graph of the YEAST-ONT dataset”.
dataset assembler length #contigs NG50 reference reference misassemblies NGA50 (kb)
(Mb) (kb) coverage % identity
YEAST Flye 12.1 28 751 99.0% 99.95% 10 561
PB
Canu 12.2 43 588 99.3% 99.95% 20 567
Falcon 11.9 42 562 96.7% 99.81% 26 525
HINGE 12.3 45 440 97.4% 98.41% 25 325
Miniasm+ABruijn 12.0 33 542 97.9% 99.93% 10 538
YEAST Flye 12.1 25 807 98.4% 99.04% 13 773
ONT
Canu 12.0 29 774 98.6% 98.96% 16 545
Falcon 11.9 41 716 97.4% 98.81% 18 637
HINGE 12.2 64 309 94.2% 97.94% 43 292
Miniasm+ABruijn 11.6 27 756 98.0% 99.03% 8 542
WORM Flye 103 123 2,131 99.3% 99.93% 62 1,682
Canu 108 262 2,264 99.2% 99.93% 91 1,287
Falcon 101 106 2,291 98.7% 99.78% 89 1,286
HINGE 103 64 2,710 99.0% 99.51% 126 1,287
Miniasm+ABruijn 104 110 2,371 99.2% 99.93% 70 1,588
HUMAN Flye 2,803 3,262 3,558 91.2% 98.50% 587 3,194
Canu 2,646 2,883 3,103 88.5% 97.20% 748 2,244
MaSuRCA 2,877 8,773 4,670 90.5% 99.79% 8,439 3,684
HUMAN+ Flye 2,797 2,222 5,837 91.5% 98.50% 939 4,474
Canu 2,759 2,327 5,824 89.0% 97.19% 1,288 3,778
Table 1. Assembly statistics for the YEAST, WORM, and HUMAN/HUMAN+ datasets. Minimum misassembly
size was set to 6000. Since Miniasm generates error-prone contigs, we polished them using ABruijn to provide a fair
comparison.
Analyzing the WORM dataset. Flye generated contigs with the lowest number of misassemblies (62),
while other tools generated assemblies with the number of misassemblies varying from 70 for
Miniasm+ABruijn to 126 for HINGE. Flye and Miniasm+ABruijn produced the largest NGA50 of 1,682
kb and 1,588 kb, respectively, while the other assemblies produced an NGA50 of 1,287 kb. Additionally,
manual analysis of the reported misassemblies revealed the differences between the Flye assembly and
the reference genome, which might be attributed to errors in the reference (see Appendix “Reconstruction
of tandem repeats in the WORM dataset”). Miniasm+ABruijn, Flye, Canu, HINGE, and Falcon took 290,bioRxiv preprint first posted online Jan. 12, 2018; doi: http://dx.doi.org/10.1101/247148. The copyright holder for this preprint
(which was not peer-reviewed) is the author/funder, who has granted bioRxiv a license to display the preprint in perpetuity.
It is made available under a CC-BY-NC-ND 4.0 International license.
480, 781, 803, and 945 minutes to assemble the WORM dataset (see Appendix “Additional details in
benchmarking”).
Analyzing the HUMAN and HUMAN+ datasets. We compared the Canu and Flye assemblies of the
HUMAN and HUMAN+ datasets. We also downloaded a hybrid MaSuRCA assembly (Zimin et al., 2017)
using the 30x ONT reads and the Illumina reads (available at the MaSuRCA web site).
For the HUMAN dataset, Flye and Canu generated assemblies with NGA50 equal to 3.2 Mb (587
assembly errors) and 2.2 Mb (748 assembly errors), respectively. Combining the HUMAN dataset of the
ONT reads with short Illumina reads resulted in only a modest increase of NGA50 in the MaSuRCA
hybrid assembly (3.6 Mb), while increasing the number of misassemblies by an order of magnitude
(8,439 assembly errors). Manual inspection revealed that most errors in the MaSuRCA assembly were
clustered within the difficult to assemble telomeric and centromeric chromosome regions. For the
HUMAN+ dataset, Flye and Canu generated assemblies with NGA50 equal to 4.5 Mb (939 assembly
errors) and 3.8 Mb (1,249 assembly errors), respectively. Based on a comparison of NGA50 statistics for
Flye and MaSuRCA, it appears that when the coverage by long reads exceeds 30x, the contribution of
short reads may be limited to reducing the error rate in the consensus sequences (for the ONT assemblies)
rather than improving the quality of the assembly.
Flye, Canu, and MaSuRCA took 10,000, 40,000 and 50,000 CPU hours to generate assemblies of
the HUMAN dataset (as reported by Canu, and MaSuRCA authors).
DISCUSSION
In this manuscript we described the Flye algorithm for building the assembly graph of SMS reads and
showed that repeat characterization is a useful complement for genome assembly algorithms. We showed
that unbridged repeats that are not resolved with conventional read-spanning algorithms can be further
untangled using the variations between repeat copies. Additionally, repeat graphs provide a useful
framework for planning extra experiments for genome finishing.
We also compared Flye with popular long read assemblers. Flye and HINGE showed good
agreement in the structure of the resulting assembly graphs on the BACTERIA datasets; however Flye
significantly improved on HINGE on the more complex YEAST and WORM datasets. A possible
explanation could be that Flye builds the assembly graph from accurate contigs while HINGE builds it
from error-prone reads, thus limiting the graph resolution. Flye and Miniasm generated the most accurate
and contiguous assemblies of the YEAST and WORM datasets compared to Canu, Falcon, and HINGE.
Interestingly, both Miniasm and Flye (in contrast to Canu and Falcon) work with raw rather than error-
corrected reads. In summary, Flye resulted in comparable or more accurate assemblies on all datasets.
Specifically, in the case of WORM, HUMAN and HUMAN+ datasets, Flye generated significantly more
contiguous and accurate assemblies than Canu.
Acknowledgements. We are grateful to Bahar Beshaz and Sergey Nurk for their insightful comments.
Availability. Flye is freely available at http://github.com/fenderglass/Flye. The supplementary files,
including the assemblies generated by Flye are available at https://doi.org/10.5281/zenodo.1143753.bioRxiv preprint first posted online Jan. 12, 2018; doi: http://dx.doi.org/10.1101/247148. The copyright holder for this preprint
(which was not peer-reviewed) is the author/funder, who has granted bioRxiv a license to display the preprint in perpetuity.
It is made available under a CC-BY-NC-ND 4.0 International license.
REFERENCES
Antipov, D., Korobeynikov, A., McLean, J. S., & Pevzner, P. A. (2015). hybridSPAdes: an algorithm for
hybrid assembly of short and long reads. Bioinformatics, 32(7), 1009-1015.
Bankevich, A., Nurk, S., Antipov, D., Gurevich, A. A., Dvorkin, M., Kulikov, A. S., et al. (2012). SPAdes:
a new genome assembly algorithm and its applications to single-cell sequencing. Journal of
computational biology, 19(5), 455-477.
Berlin, K., Koren, S., Chin, C. S., Drake, J. P., Landolin, J. M., & Phillippy, A. M. (2015). Assembling
large genomes with single-molecule sequencing and locality-sensitive hashing. Nature
biotechnology, 33(6), 623-630.
Chaisson, M.J.P., J. Huddleston, M.Y Dennis, P. H. Sudmant, M. Malig, F. Hormozdiari, F. Antonacci, U.
Surti, R. Sandstrom, M. Boitano, J. M Landolin, J. A Stamatoyannopoulos, M. W Hunkapiller, J. Korlach,
E. E Eichler (2015) Resolving the complexity of the human genome using single-molecule sequencing.
Nature 51, 608-611
Chin, C. S., Alexander, D. H., Marks, P., Klammer, A. A., Drake, J., Heiner, C., et al. (2013). Nonhybrid,
finished microbial genome assemblies from long-read SMRT sequencing data. Nature methods, 10(6),
563-569.
Chin, C. S., Peluso, P., Sedlazeck, F. J., Nattestad, M., Concepcion, G. T., Clum, A., et al. (2016). Phased
diploid genome assembly with single-molecule real-time sequencing. Nature methods, 13(12), 1050-
1054.
Edmonds, J. (1965). Paths, trees, and flowers. Canadian Journal of mathematics, 17(3), 449-467.
Edmonds, J., & Johnson, E. L. (1973). Matching, Euler tours and the Chinese postman. Mathematical
programming, 5(1), 88-124.
Giordano, F., Aigrain, L., Quail, M. A., Coupland, P., Bonfield, J. K., Davies, R. M., et al. (2017). De
novo yeast genome assemblies from MinION, PacBio and MiSeq platforms. Scientific reports, 7.
Ghurye, Jay, Mihai Pop, Sergey Koren, Derek Bickhart, and Chen-Shan Chin. "Scaffolding of long read
assemblies using long range contact information." BMC genomics 18, no. 1 (2017): 527.
Gurevich, A., Saveliev, V., Vyahhi, N., & Tesler, G. (2013). QUAST: quality assessment tool for genome
assemblies. Bioinformatics, 29(8), 1072-1075.
Jain, M., Koren, S., Quick, J., Rand, A.C., Sasani, T.A., Tyson, J.R., Beggs, A.D., Dilthey, A.T., Fiddes,
I.T., Malla, S. and Marriott, H., 2017. Nanopore sequencing and assembly of a human genome with ultra-
long reads. BioRxiv (2017), p.128835.
Jha, J. K., Baek, J. H., Venkova-Canova, T., & Chattoraj, D. K. (2012). Chromosome dynamics in
multichromosome bacteria. Biochimica et Biophysica Acta (BBA)-Gene Regulatory Mechanisms, 1819(7),
826-829.
Kamath, G. M., Shomorony, I., Xia, F., Courtade, T. A., & David, N. T. (2017). HINGE: long-read
assembly achieves optimal repeat resolution. Genome research, 27(5), 747-756.bioRxiv preprint first posted online Jan. 12, 2018; doi: http://dx.doi.org/10.1101/247148. The copyright holder for this preprint
(which was not peer-reviewed) is the author/funder, who has granted bioRxiv a license to display the preprint in perpetuity.
It is made available under a CC-BY-NC-ND 4.0 International license.
Koren, S., Schatz, M. C., Walenz, B. P., Martin, J., Howard, J. T., Ganapathy, G., et al. (2012). Hybrid
error correction and de novo assembly of single-molecule sequencing reads. Nature biotechnology, 30(7),
693-700.
Koren, S., Walenz, B. P., Berlin, K., Miller, J. R., Bergman, N. H., & Phillippy, A. M. (2017). Canu:
scalable and accurate long-read assembly via adaptive k-mer weighting and repeat separation. Genome
research, 27(5), 722-736.
Li, H. (2016). Minimap and miniasm: fast mapping and de novo assembly for noisy long
sequences. Bioinformatics, 32(14), 2103-2110.
Y Lin, S Nurk, PA Pevzner (2014) What is the difference between the breakpoint graph and the de Bruijn
graph? BMC genomics 15 (6), S6
Lin, Y., Yuan, J., Kolmogorov, M., Shen, M. W., Chaisson, M., & Pevzner, P. A. (2016). Assembly of long
error-prone reads using de Bruijn graphs. Proceedings of the National Academy of Sciences, 113(52),
E8396-E8405.
Miller JR, Delcher AL, Koren S, Venter E, Walenz BP, Brownley A, Johnson J, Li K, Mobarry C, Sutton
G. 2008. Aggressive assembly of pyrosequencing reads with mates. Bioinformatics 24: 2818–2824.
Mikheenko A, Prjibelski A., Saveliev V, Antipov D., and Gurevich A. 2018 Versatile genome assembly
evaluation with QUAST-LG (submitted)
Myers EW. 2005. The fragment assembly string graph. Bioinformatics 21 (Suppl 2): i79–ii85.
M. Nattestad , S. Goodwin, K. Ng , T. Baslan , F. J. Sedlazeck, P. Rescheneder, T. Garvin , H. Fang, J.
Gurtowski , E. Hutton , E. Tseng , C.S. Chin , T. Beck , Y. Sundaravadanam , M. Kramer, E Antoniou , J.
D. McPherson , J. Hicks , W. R. McCombie , M. C. Schatz (2017) Complex rearrangements and oncogene
amplifications revealed by long-read DNA 2 and RNA sequencing of a breast cancer cell line. bioRxiv
doi: http://dx.doi.org/10.1101/174938
Pevzner, P. A., Tang, H., & Tesler, G. (2004). De novo repeat classification and fragment
assembly. Genome research, 14(9), 1786-1796.
Prjibelski, A. D., Vasilinetc, I., Bankevich, A., Gurevich, A., Krivosheeva, T., Nurk, S., et al. (2014).
ExSPAnder: a universal repeat resolver for DNA fragment assembly. Bioinformatics, 30(12), i293-i301.
Schwartz, E., & Schwartz, E. (2009). Microbial megaplasmids. Berlin: Springer.
Vyahhi, N., Pyshkin, A., Pham, S., & Pevzner, P. (2012). From de Bruijn graphs to rectangle graphs for
genome assembly. Algorithms in Bioinformatics, 249-261.
Weissensteiner, M. H., Pang, A. W., Bunikis, I., Höijer, I., Vinnere-Petterson, O., Suh, A., & Wolf, J. B.
(2017). Combination of short-read, long-read, and optical mapping assemblies reveals large-scale tandem
repeat arrays with population genetic implications. Genome Research, 27(5), 697-708.
Wick, R. R., Schultz, M. B., Zobel, J., & Holt, K. E. (2015). Bandage: interactive visualization of de novo
genome assemblies. Bioinformatics, 31(20), 3350-3352.
Wick RR, Judd LM, Gorrie CL, Holt KE (2017) Unicycler: Resolving bacterial genome assemblies from
short and long sequencing reads. PLoS Comput Biol 13(6): e1005595bioRxiv preprint first posted online Jan. 12, 2018; doi: http://dx.doi.org/10.1101/247148. The copyright holder for this preprint
(which was not peer-reviewed) is the author/funder, who has granted bioRxiv a license to display the preprint in perpetuity.
It is made available under a CC-BY-NC-ND 4.0 International license.
Zimin, A.V., Puiu, D., Luo, M.C., Zhu, T., Koren, S., Marçais, G., Yorke, J.A., Dvořák, J. and Salzberg,
S.L., 2017. Hybrid assembly of the large and highly repetitive genome of Aegilops tauschii, a progenitor
of bread wheat, with the MaSuRCA mega-reads algorithm. Genome Research, 27(5), pp.787-792.You can also read