Mangrove tree (Avicennia marina): insight into chloroplast genome evolutionary divergence and its comparison with related species from family ...
←
→
Page content transcription
If your browser does not render page correctly, please read the page content below
www.nature.com/scientificreports
OPEN Mangrove tree (Avicennia marina):
insight into chloroplast genome
evolutionary divergence and its
comparison with related species
from family Acanthaceae
Sajjad Asaf1,3, Abdul Latif Khan1,3*, Muhammad Numan1,2 & Ahmed Al‑Harrasi1*
Avicennia marina (family Acanthaceae) is a halotolerant woody shrub that grows wildly and cultivated
in the coastal regions. Despite its importance, the species suffers from lack of genomic datasets to
improve its taxonomy and phylogenetic placement across the related species. Here, we have aimed
to sequence the plastid genome of A. marina and its comparison with related species in family
Acanthaceae. Detailed next-generation sequencing and analysis showed a complete chloroplast
genome of 150,279 bp, comprising 38.6% GC. Genome architecture is quadripartite revealing large
single copy (82,522 bp), small single copy (17,523 bp), and pair of inverted repeats (25,117 bp).
Furthermore, the genome contains 132 different genes, including 87 protein-coding genes, 8 rRNA,
37 tRNA genes, and 126 simple sequence repeats (122 mononucleotide, 2 dinucleotides, and 2
trinucleotides). Interestingly, about 25 forward, 15 reversed and 14 palindromic repeats were also
found in the A. marina. High degree synteny was observed in the pairwise alignment with related
genomes. The chloroplast genome comparative assessment showed a high degree of sequence
similarity in coding regions and varying divergence in the intergenic spacers among ten Acanthaceae
species. The pairwise distance showed that A. marina exhibited the highest divergence (0.084) with
Justicia flava and showed lowest divergence with Aphelandra knappiae (0.059). Current genomic
datasets are a valuable resource for investigating the population and evolutionary genetics of family
Acanthaceae members’ specifically A. marina and related species.
Mangroves are woody shrub and tropical plants that grow well in the inter-tidal zones of tropical to sub-tropical
latitudes1. Globally, mangrove covers about 200,000 km2 area2,3 and belongs to family Acanthaceae that com-
prises of more than 400 species of polyphyletic group of trees4. These trees possess unique physio-morphological
adaptations and tolerance against hypersaline environment, tidal cycles, and soil c hemistry5–7. Importantly,
mangroves serve as a hub of exponential ecological resource for habituating diverse marine life by providing a
protective sanctuary to bread, shelter and grow living organisms and as a sink for continued carbon emissions.
However, overexploitation of mangroves for wood and environmental pollution have drastically affected the tree
iversity8. The evolutionary history, tolerance-based mechanisms,
population as well resulted in loss of genetic d
genetic divergence and sub-speciation are the key aspects that require in-depth studies.
Among mangroves, Avicennia marina (Forssk., Vierh., gray mangroves) is one the keystone species of the
genus and well-distributed species across different latitudes mostly through the dispersal of diasporas by sea
and wind9,10. Gray mangroves have been divided into categories based on their habitat and importance to the
community structure11. Currently, at least three sub specific or allopatric varieties of A. marina viz. var. australa-
sica, euclayptifolia and marina have been categorized to date12. The true mangroves are further distinguished as
major and minor mangroves where variations also exist in habitat exclusively in aquatic and terrestrial or both13.
However, plant scientists did not reach a consensus classification14,15. DNA based molecular markers system are
available to discriminate among population and species and perform phylogenetic analysis16–18, however, current
1
Natural and Medical Sciences Research Center, University of Nizwa, Nizwa 616, Oman. 2Department of
Biology, University of North Carolina at Greensboro, 363 Sullivan Science Building, NC 27402‑6170, USA. 3These
authors contributed equally: Sajjad Asaf and Abdul Latif Khan. *email: latifepm78@yahoo.co.uk; aharrasi@
unizwa.edu.om
Scientific Reports | (2021) 11:3586 | https://doi.org/10.1038/s41598-021-83060-z 1
Vol.:(0123456789)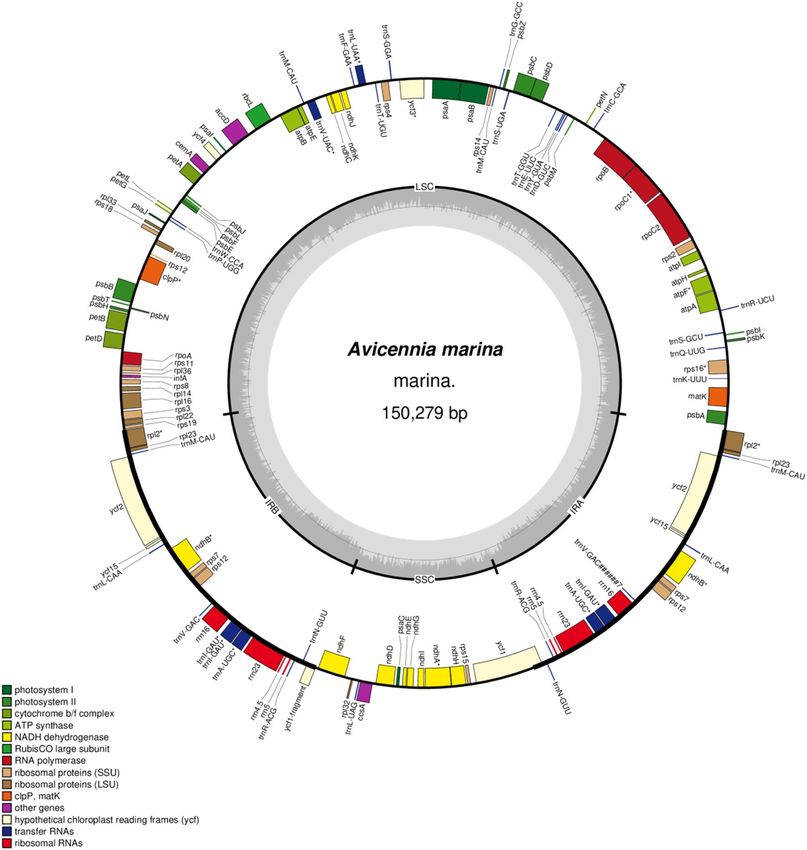
www.nature.com/scientificreports/
advancement of next-generation sequencing methods can help to understand genome architecture, structure,
content, divergence and evolutionary history that could solve many key questions related to population structure
and taxonomy19–23.
In this case, the chloroplast genome offers a highly conserved sequence due to uni-parent inheritance, hap-
loid, and non-recombinant nature24,25. To date, about 4000 chloroplast genomes have been sequenced26. The
chloroplast genome size for angiosperm is around 110-165 kb containing unigenes from 90 to 1 1027,28. Almost
all angiosperm chloroplast genomes consist of 4 regions viz. large single-copy region (LSC), followed by inverted
repeats (two complementary to each other) and a single small copy region (SSC)29. Due to these reasons, chlo-
roplast genomes sequences are most recommended and used for evolutionary studies, barcoding and phylo-
genetic analysis30,31. In case of A. marina, though recently Frilis et al.32 reported the first whole-genome data
with genome size of 456 million base pair, however, still the sequence datasets for Acanthaceae (± 400 species)
is only 15 organelle genomes. The genus suffers from lack of a comprehensive comparative genomic assessment
to understand the phylogenomic and evolutionary history of A. marina and related species. Hence, in the cur-
rent study we aimed to sequence A. marina growing in Oman and perform comparative chloroplast genome
analysis with Andrographis paniculate, Aphelandra knappiae, Clinacanthus nutans, Echinacanthus attenuates,
Echinacanthus lofouensis, Echinacanthus longipes, Echinacanthus longzhouensis, Justicia flava, Justicia leptostachya
and Strobilanthes cusiaspecies from Acanthaceae family.
Results
Chloroplast genome structure of A. marina. The length of complete chloroplast (cp) genome of A.
marina is 150,279 bp and it exhibits a typical quadripartite structure with a pair of inverted repeats 25,117 bp
that separate a large single-copy region 82,522 bp and a small single copy region 17,523 bp (Fig. 1; Table 1). The
cp genome contains overall GC contents of 38.6%. We identified 22 introns containing genes (14 protein coding
genes and 7 tRNA genes), among these genes 19 genes are single intron and two genes (ycf3 and clpP) contain
two introns. The largest intron was found in the gene trnK-UUU with 2,414 bp in size and the smallest intron
with 486 bp in gene trnL-UAA. Additionally, the largest exon was found in the gene ndhB with 775 bp and the
smallest exon was found in petB genes and was only 6 bp in size. Among the coding genes, rps12 was unequally
divided, with its 5′ exon being located in the LSC region and one copy of the 3′ exon and intron being located in
each of the IR regions, as in other angiosperms33,34.
The protein coding genes included larger and smaller subunit proteins such as rpl2, 14, 16, 20, 22, 23, 32, 33,
36 and rps2, 3, 4, 7, 8, 11, 12, 14,15 ,16, 18, 19 respectively (Table 2). Numerous groups of photosynthetic genes
were also annotated including photosynthesis I, photosynthesis II, Cytochrome b6/f complex, ATP synthase and
rubisco as shown in Table 2. The genome also contains a total of 132 genes including 87 protein coding genes,
8 ribosomal rRNA genes and 37 transfer tRNA genes. The total size for the protein coding region was found
79,321 bp (52% of the cp genome), for the ribosomal RNA (rRNA) the size is 9,054 bp (6.02%) and for the trans-
fer RNA (tRNA) it is 2,839 bp (1.88). GC contents in the coding region of the chloroplast genome was found as
43.4%. Similarly, 36.8, 32.7, 43.6, 53.1, 55.3 and 38.4% of the GC contents were found in LSC, SSC, IR, tRNA,
rRNA and protein coding genes, respectively. The GC content in the protein coding genes at first, the second
and third position of codon were 46.06, 37.87 and 32.25% respectively as shown in Table 3. The AT distribution
in chloroplast genome of A. marina was found 36.7%. The AT in LSC, SSC, IR, tRNA, rRNA and protein coding
genes were 63.2, 67.3, 56.4, 46.9, 44.8 and 61.6% respectively. Within the protein coding genes, the AT/U was
found 54.8, 62.1 and 67.8% on first, second and third position of codons as shown in Table 3. In A. marina the
most common amino acid was found as leucine (10.7%) and the least common amino acid was cysteine (1.2%).
Comparative analysis of A. marina cp genome with related species. In order to further analyze
the characteristics of the A. marina chloroplast genome, its assembled genome was compared with the chlo-
roplast genomes of 10 other species of the same family. The results revealed that A. marina (150,279 bp) cp
genome size is slightly bigger as compared to A. paniculata (150,249 bp), J. leptostachya (149,227 bp) and S. cusia
(144,133 bp). However, it has a slightly smaller cp genome size when compared to the species A. knappiae, C.
nutans, E. attenuates, E. lofouensis, E. longipes, E. longzhouensis and J. flava (Table 1).
The GC contents of A. marina (38.6%) were found almost similar for species (A. knappiae, E. longipes, E.
lofouensis and E. longzhouensis), however GC contents were found higher when compared to the species A.
paniculata (38.3%), C. nutans (38.4%), E. attenuates (38.3%), J. flava (38.2%), J. leptostachya (38.2%) and S. cusia
(38.2%). The number of genes, rRNA, tRNA, SSC size and the number of protein coding regions were found
almost similar in these studied cp genomes Table 1. The LSC analysis showed that it is almost similar in all the
species except E. longzhouensis where the size was found slightly smaller (79,203 bp) but significantly higher in
S. cusia (92,666 bp) when compared to A. marina (82,522 bp).
The synteny of A. marina cp genome with ten other species from Acanthaceae was analyzed by mVISTA.
Gene divergence was determined by determining pairwise alignment of A. marina with related species. A.
marina chloroplast genome was used for reference to determine variation and sequence identity in the chloro-
plast genomes of related species. The results showed high sequence similarities among the cp genomes of several
species, especially in protein-coding and IR regions (Figure S1).
For example, the intergenic regions between psbA-matK, rps16-psbL, atpA-atpF, atpH-atpI, rpoC1-rpoB, psbE-
petG, petN-psbM, psbD-rps14, ycf3—rps4, atpE-rbcL, accD-ycf4, psbL-petL, clpP-psbN, petD-rpl36, rpoA-rps11,
rpl22-rps8, rpl16-rps3, ycf15-ndhB, rps19-rpl23, ndhF-ccsA, ndhD-psaC, ndhI-ndhG, ndhA-ycf1 and ndhB-ycf2
were found highly divergent. Besides these intergenic regions some divergence was observed in protein-coding
genes (rps16, rpoC1, rpoC2, atpA, matK, atpF, clpP, rps12, psbN, psbB, psbT, psbH, petB, accD) in LSC region,
(petD, rpl16, rpl22, rpl36, rps3, rps8ycf2) in IR region and (ycf1, ycf15,ndhA, ndhB, ndhF and ndhH) in SSC
Scientific Reports | (2021) 11:3586 | https://doi.org/10.1038/s41598-021-83060-z 2
Vol:.(1234567890)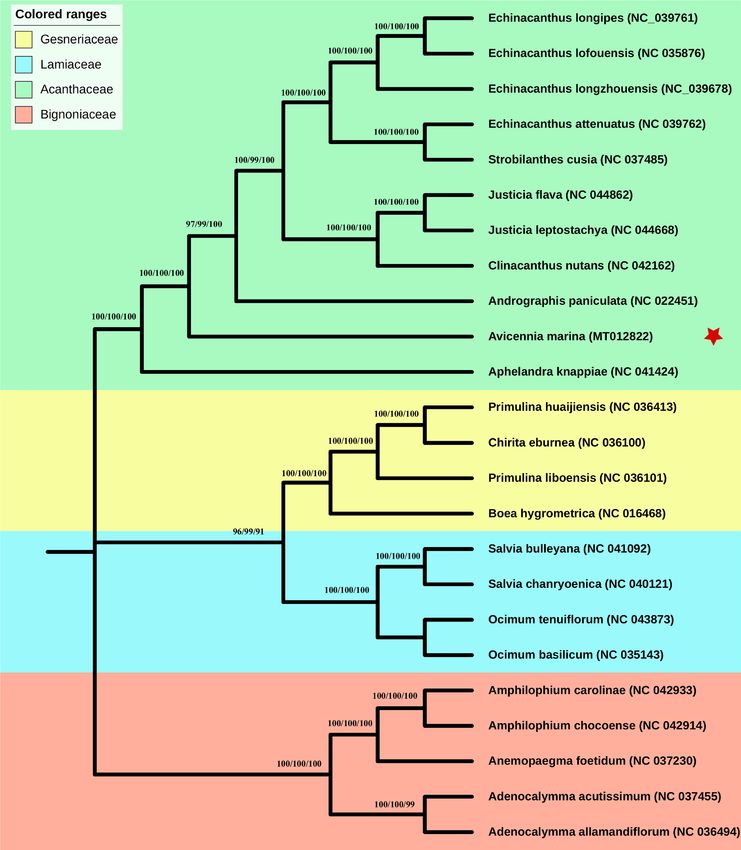
www.nature.com/scientificreports/

                                  Figure 1.  Gene map of the Avicennia marina chloroplast genome. Genes drawn inside the circle are transcribed
                                  clockwise, and those outside the circle are transcribed counterclockwise. The stars indicate the intron-containing
                                  genes. Genes belonging to different functional groups are colour-coded. The darker grey in the inner circle
                                  corresponds to GC content, and the lighter grey corresponds to AT content.

                                  region. The gene divergence was found more prominent in LSC and SSC region as compared to the IR region. In
                                  pairwise sequence divergence analysis, A. marina exhibited highest divergence (0.084) with J. flava and showed
                                  lowest divergence with A. knappiae (0.059) (Supplementary Data 1). The most divergent genes were rpl22 (J.
                                  leptostachya (0.149), rps15 in E. attenuates (0.135), ndhF A. paniculate (0.139), E. lofouensis (0.212), and matK
                                  J. leptostachya (0.139) (Fig. 2). Similarly, lowest pairwise divergence was found in genes such as, ndhB (0.003) in
                                  E. longzhouensis, psbL (0.009) in E. lofouensis, petN (0.011) in E. longipes. psaJ (0.015) in E. attenuates.

                                  Simple sequence repeat (SSR) analysis of A. marina cp genome. We determined SSRs in the cp
                                  genome of A. marina as well as in the cp genomes of the other ten related species (Fig. 3A). A total of 126
                                  SSRs were found in the chloroplast genome of A. marina. Among the predominant SSRs nucleotides such as
                                  mononucleotide, dinucleotide, trinucleotide, etc., the mononucleotide SSR was found the most abundant not

Scientific Reports |   (2021) 11:3586 |                https://doi.org/10.1038/s41598-021-83060-z                                                  3

                                                                                                                                              Vol.:(0123456789)
www.nature.com/scientificreports/
E.
A. marina A. paniculata A. knappiae C. nutans E. attenuatus E. lofouensis E. longipes longzhouensis J. flava J. leptostachya S. cusia
Size (bp) 150,279 150,249 152,457 151,669 152,672 151,333 152,644 152,385 150,888 149,227 144,133
Overall GC
38.6 38.3 38.5 38.4 38.3 38.7 38.6 38.6 38.2 38.2 38.2
contents
LSC size in bp 82,522 82,402 83,861 83,502 83,568 82,527 83,833 79,203 82,970 82,114 92,666
SSC size in bp 17,523 17,110 17,888 17,435 17,739 17,397 17,388 17,571 16,893 16,975 17,811
IR size in bp 25,117 25,397 25,354 25,366 25,662 25,688 25,691 25,434 25,500 25,069 17,328
Protein coding
regions size 79,321 78,549 78,678 68,634 78,930 62,904 72,939 79,203 79,833 78,024 71,370
in bp
tRNA size in bp 2839 2715 2793 2709 2645 2716 2646 2715 2967 2793 2800
rRNA size in bp 9054 9054 9052 9052 9058 9186 9186 9058 9048 9052 9078
Number of
132 132 131 131 129 131 131 132 137 131 129
genes
Number of
protein coding 87 87 86 83 86 85 87 87 88 86 84
genes
Number of
8 8 8 8 8 8 8 8 8 8 8
rRNA
Number of
37 37 37 36 35 36 35 36 39 37 37
tRNAs
Genes with
15 + 7 14 + 8 14 + 8 15 + 8 15 + 7 15 + 8 15 + 7 15 + 8 13 + 9 14 + 8 14 + 8
introns
Table 1. Genomic details and statistics of 11 mangrove species of the family Acanthaceae.
Category Group of genes Name of genes
Large subunit of ribosomal proteins rpl2, 14, 16, 20, 22, 23, 32, 33, 36
Small subunit of ribosomal proteins rps2, 3, 4, 7, 8, 11, 12, 14,15 , 16, 18, 19
DNA dependent RNA polymerase rpoA, B, C1, C2
Self-replication
rRNA genes rrn 4.5, rrn 5, rrn 16, rrn23
tRNA-UGC, trnC-GCA, trnD-GUC, trnE-UUC, trnF-GAA, trnfM-CAU, trnG-UCC, trnI-GAU, trnK-UUU, trnL-CAA, trnL-
tRNA genes UAA, trnL-UAG, trnM-CAU, trnN-GUU, trnP-UGG, trnQ-UUG, trnR-ACG, trnR-UCU, trnS-GCU, trnS-GGA, trnS-UGA,
trnT-GGU, trnT-UGU, trnV-GAC, trnV-UAC, trnW-CCA, trnY-GUA
Photosystem I psaA, B, C, I, J,
Photosystem II psbA, B, C, D, E, F, H, I, J, K, L, M, N, T, Z
Photosynthesis Cytochrome b6/f complex petA, B, D, G, L, N
ATP synthase atpA, B, E, F, H, I
Rubisco rbcL
Maturase matK
Protease clpP
Other genes Envelop membrane protein cemA
Subunit Acetyl- CoA-Carboxylate accD
c-type cytochrome synthesis gene ccsA
Unknown Conserved Open reading frames ycf1,2, 3, 4, 15
Table 2. Genes annotated in the chloroplast genome of A. marina.
only in A. marina but also in the other species of the current study. In this report the presence, distribution and
types of SSRs were studied (Fig. 3B). The SSRs in the IR, LSC and SSC regions of the chloroplast genomes of
above-mentioned species have been analyzed and were found distributed such as mono, di and trinucleotidies.
However, most of the SSRs in these species were found mononucleotides in the IR region. For example, mono-
nucleotides SSRs in A. marina, A. paniculata and S. Cusia were 4, in the A. knappiae and C. nutans, the number
of SSRs were found 6, in E. lofouensis, E. longipes, J. flava and J. leptostachya have 8 SSRs as mononucleotides,
in the E. attenuates and E. longzhouensis 9 and 7 mononucleotide SSRs were found. Similarly, J. flava contain 2
dinucleotide SSRs in the inverted repeat regions, in the IR region the J. leptostachya contain 1 penta and hexa
nucleotide SSR each. SSRs in LSC region were found mostly as mononucleotide and trinucleotide in all the
above-mentioned species. For example, In the A. marina 90 mononucleotides SSRs were found. In all other 10
species, in LSC, mononucleotide SSRs were found in the range of 56 to 77. For example, the E. longipes contain
2nd higher number (77 mononucleotide SSRs) after A. marina in LSC region. Similarly, the E. longzhouensis has
76 mononucleotide SSRs, A. paniculata 70, C. nutans 68, E. attenuates and S. Cusia 65, A. knappiae and J. flava
59 and J. leptostachya 56 SSRs in LSC region. In some species dinucleotide SSRs were found in LSC region such
Scientific Reports | (2021) 11:3586 | https://doi.org/10.1038/s41598-021-83060-z 4
Vol:.(1234567890)www.nature.com/scientificreports/
Genome LSC SSC IR tRNA rRNA Protein Coding genes 1st position 2nd position 3rd position
T/U
A. marina 24.9 32.5 33.7 28.2 25.2 18.8 31.1 23.8 33.0 36.5
A.paniculata 31.2 32.4 34 28.4 25.4 18.8 31.4 23.8 32.6 37.7
A.knappiae 31.1 32.3 33.5 28.1 25 18.7 31.3 23.7 32.5 37.7
C.nutans 31.1 32.3 34 28.1 25.2 18.7 31.6 23.9 32.6 38.1
E. attenuates 31.1 32.3 33.9 28.3 24.9 18.7 31.4 23.8 32.6 37.7
E. lofouensis 31 32.1 33.8 28.2 25 19 31.4 23.4 32.9 37.8
E. Longipes 31 32.1 33.8 28.2 24.9 19 31.3 23.7 32.5 37.7
E.longzhouensis 31 32.1 33.8 28.1 24.9 18.7 31.2 23.8 32.5 37.4
J. flava 31.2 32.4 33.8 28.3 25.1 18.7 31.5 23.9 32.7 38.0
J. leptostachya 31.2 32.4 33.5 28.4 25 18.7 31.5 23.9 32.6 37.9
S.cusia 31.3 32.3 33.9 27.3 25 18.7 31.4 23.6 32.9 37.8
C
A. marina 22.9 18.9 17.1 22.5 23.7 23.7 18 19.0 20.0 14.9
A.paniculata 19.5 18.7 16.7 22.5 24.2 23.7 17.9 19.1 20.4 14.1
A.knappiae 19.6 18.7 17.1 21 24.1 23.8 18 19.1 20.5 14.2
C.nutans 19.5 18.7 16.8 20.9 24.1 23.7 18.1 19.1 20.9 14.1
E. attenuatus 19.5 18.6 17 20.9 24 23.7 17.8 19.0 20.4 14.1
E. lofouensis 19.7 19 17.2 21 24.1 23.4 17.8 18.5 20.7 14.2
E. Longipes 19.6 18.8 17.2 21 24.1 23.4 18.2 19.3 20.8 14.5
E.longzhouensis 19.7 18.9 17.1 21 24.2 23.6 18 19.1 20.5 14.5
J. flava 19.5 18.6 16.7 20.9 23.6 23.7 17.8 19.0 20.5 13.9
J. leptostachya 19.4 18.6 16.9 22.4 24.5 23.7 17.8 19.1 20.5 13.8
S.cusia 19.5 18.7 17 24.2 23.6 23.6 17.9 18.8 20.6 14.2
G
A. marina 20.5 17.9 15.6 21.1 29.4 31.6 20.4 26.1 17.9 17.3
A.paniculata 18.8 17.7 15.1 21 28.8 31.6 20.3 26.5 17.9 16.5
A.knappiae 18.9 17.8 15.7 22.6 29.1 31.7 20.5 26.8 18.0 16.6
C.nutans 18.8 17.7 15.6 22.6 28.9 31.6 20.9 27.4 18.3 16.9
E. attenuatus 18.8 17.7 15.5 22.5 29.1 31.8 20.5 26.8 17.9 16.8
E. lofouensis 19 18 15.7 22.5 29 31.5 20.7 27.8 18.4 16.0
E. Longipes 19 18 15.7 22.5 29.1 31.5 20.9 27.3 18.3 17.2
E.longzhouensis 19 17.9 15.7 22.6 29 31.8 20.6 26.8 18.0 16.9
J. flava 18.8 17.6 15.5 22.5 29.3 31.6 20.4 26.6 17.9 16.6
J. leptostachya 18.7 17.6 15.6 21 28.8 31.6 20.4 26.7 17.9 16.7
S.cusia 18.7 17.9 15.3 21.5 29.5 31.8 20.5 27.3 17.9 16.3
A
A. marina 31.8 30.7 33.6 28.2 21.7 26 30.5 31.0 29.1 31.3
A.paniculata 30.5 31.2 34.2 28.2 21.7 26 30.4 30.6 29.1 31.6
A.knappiae 30.5 31.1 33.8 28.2 21.8 25.9 30.3 30.3 29.0 31.5
C.nutans 30.5 31.2 33.6 28.4 21.7 26 29.5 29.6 28.1 30.8
E. attenuatus 30.6 31.4 33.6 28.3 22 25.8 30.3 28.5 29.2 31.4
E. lofouensis 30.3 31 33.2 28.3 21.9 26 30.1 30.3 28.0 32.0
E. Longipes 30.4 31.1 33.3 28.3 21.8 26 29.5 29.7 28.3 30.6
E.longzhouensis 30.4 31.1 33.4 28.2 21.8 25.8 30.2 30.4 29.0 31.2
J. flava 30.6 31.4 34 28.4 22 26 30.3 30.5 28.9 31.6
J. leptostachya 30.7 31.4 34 28.2 21.8 26 30.3 30.4 29.0 31.6
S.cusia 30.5 31.2 33.8 27 21.9 25.9 30.2 30.2 28.5 31.7
Table 3. Base composition of the A. marina and other related species cp genome.
as 2 in A. marina, 1 in J. flava, 5 in J. leptostachya and 4 in S. cusia. Similarly, in LSC region A. marina contain 2
trinucleotides SSRs while the highest trinucleotides SSRs were 8 in the S. Cusia.
SSRs were also found in SSC region most prominently as mononucleotides and trinucleotides. For example,
in A. marina 24 mononucleotides SSRs were found, A. paniculata 26 mononucleotides SSRs, E. longzhouensis 25
mononucleotides SSRs, E. attenuates 24 mononucleotides SSRs, J. flava 22 mononucleotides SSRs, E. lofouensis,
Scientific Reports | (2021) 11:3586 | https://doi.org/10.1038/s41598-021-83060-z 5
Vol.:(0123456789)www.nature.com/scientificreports/
Figure 2. Heatmap of pairwise gene divergence in the chloroplast genome sequence of A. marina. The highly
divergent genes are represented with light and green color depending on the divergence frequency.
Scientific Reports | (2021) 11:3586 | https://doi.org/10.1038/s41598-021-83060-z 6
Vol:.(1234567890)www.nature.com/scientificreports/
A 150
SSRs in complete genome Mono Di Tri Tetra penta hexa
C
150
LSC IR SSC
100
frequencey of SSR
100
50
50
0 0
a
s
na
va
e
a
us
is
es
sis
ia
va
sis
ya
a
s
na
e
us
is
si a
es
an
ia
at
y
s
an
s
ia
ip
at
at
fla
ch
ia
en
en
ns
cu
pp
l
ip
ut
at
fla
ch
en
cu
i
ng
cu
nu
pp
ar
l
ar
ta
ou
u
ut
S.
cu
ue
na
.n
J.
ng
nu
i
fo
Lo
.m
ta
s
ou
an
te
S.
zh
C
.m
na
.n
to
J.
.k
lo
i
fo
at
lo
os
an
te
.p
ep
A
ng
E.
zh
A
E.
C
.k
lo
A
E.
A
at
pt
E.
l
lo
.p
ng
J.
A
E.
E.
le
E.
A
lo
J.
E.
B 200
A T G C AC AT ATA AAG AAT
ATT ATC ATTAA AATAA AATTG AATTAA
ATAAA AAATA ATAA AAGTAT TA TTA
frequencey of SSR motifs
TAA TAT TCT TGA TTC TAAA TCAAT
150
TTATT TTTTA TAATAT TATACT CAATA CTTTAT
100
50
0
a
s
va
na
e
ya
us
si a
is
es
sis
an
ia
at
ns
ip
at
fla
ch
en
ia
cu
pp
ul
ut
ue
ng
nu
ar
ta
ou
ic
S.
na
.n
J.
fo
Lo
.m
os
an
te
zh
C
.k
lo
at
pt
.p
A
ng
E.
A
E.
le
A
E.
lo
J.
E.
Figure 3. Simple sequence repeats (SSRs) analysis in the chloroplast genome of A. marina. (A) Numbers of SSR
types in complete chloroplast genome, (B) Number of SSRs in LSC, IR and SSC regions. (C) frequency of SSR
motifs.
E. longipes J. leptostachya and S. Cusia were fund to have 21 mononucleotides SSRs each. In A. marina no tri-
nucleotide SSRs were found, however only few species were found to have 1 or 2 trinucleotides SSRs (Fig. 3C).
Repeat sequence analysis. In the chloroplast genome of A. marina and related species forward, reverse,
palindromic and tandem repeats were analyzed. Total of 25 forward repeats, 14 palindromic repeats and 15 tan-
dem repeats were found in A. marina cp genome. Total of 16, 23, 37, 20, 17, 18, 19, 24, 21 and 16 forward repeats
were found in A. paniculata, A. knappiae, C. nutans, E. attenuates, E. lofouensis, E. longipes, E. longzhouensis, J.
flava, J. leptostachya and S. cusia respectively (Fig. 4). Furthermore, tandem repeats in these species were 15, 14,
62, 19, 14, 15, 14, 19, 21 and 21 respectively. Among these repeats in A. marina, 16 of the forward repeats were
found in the 15–29 bp, 5 repeats in 30–44 bp, 1 repeat was found in 45–59 bp, 75–79 bp and 2 repeats were found
in > 90. Similarly, in the tandem repeats, 9 repeats were found in 15–29 bp, 2 repeats were found in 30–44 bp, 1
repeat was found in 60–74 bp, and 75–79 bp and 2 repeats in > 90 bp. Among the palindromic repeats, 5 repeats
were found in the 15–29 bp, 6 repeats were found in 30–44 bp, and 1 repeat was found in 45–59 bp, 75–79 bp
and > 90 bp.
The highest number of forward repeats (37) were found in the C. nutans and the lowest number of forward
repeats (16) were found in the A. paniculate and S. cusia. Similarly, the highest tandem repeats (62) and the lowest
number of tandem repeats (14) were found in the A. knappiae, E. lofouensis and E. longzhouensis. Additionally,
among all the species, the highest number of palindromic repeats (25) were found in A. paniculate and S. cusia
and the lowest palindromic repeats (14) were found in the A. marina (Fig. 4A–D).
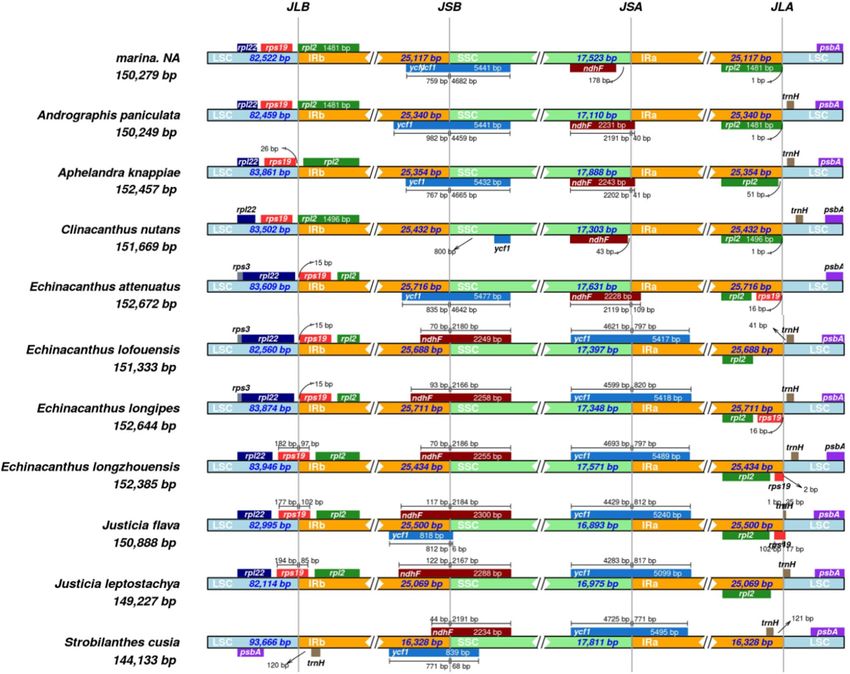
Contraction and expansion of IR region. In the current study, contraction, and expansion in the
4-junctions (JSA, and JSB, JLA, JLB) between IRa and IRb, LSC and SSC regions of A. marina and 10 related
species from the family Acanthaceae were analyzed. Size of IR regions in all the species were found almost
Scientific Reports | (2021) 11:3586 | https://doi.org/10.1038/s41598-021-83060-z 7
Vol.:(0123456789)www.nature.com/scientificreports/
A 70
Forward pilindromic tandem
B 20 15-29 30-44 45-59 60-74 75-89 >90
65
number of palindromic repeats
60
55 15
50
number of repeats
45
40
35
10
30
25
20 5
15
10
5
0 0
sis
va
a
ns
ya
a
e
us
is
si a
es
va
sis
ya
sia
a
s
a
e
us
is
es
ia
at
in
ns
an
ia
at
ip
in
a
at
ns
fla
ch
en
ip
cu
pp
at
la
ul
ch
ar
en
ut
cu
pp
ue
ul
ar
ng
ut
nu
ue
g
ta
ou
f
nu
ic
S.
.m
ta
na
.n
ou
J.
ic
n
S.
.m
fo
na
.n
J.
lo
os
an
te
fo
lo
zh
os
an
te
zh
C
.k
lo
A
at
C
.k
pt
lo
E.
A
at
.p
pt
E.
ng
.p
ng
A
E.
le
A
E.
E.
le
E.
A
lo
A
lo
J.
J.
E.
E.
C 25
15-29 30-44 45-59 60-74 75-89 >90 D 40
15-29 30-44 45-59 60-74 75-89 >90
number of forward repeats
20
number of tandem repeats
30
15
20
10
10
5
0 0
va
sis
a
s
ya
a
e
us
is
si a
es
va
sis
ya
s
a
a
e
us
is
si a
es
an
ia
at
in
an
ia
at
ns
in
ip
ns
at
la
ip
ch
en
at
fla
ch
cu
en
pp
ul
cu
ar
pp
ut
ul
ar
ut
ue
ng
f
ue
nu
ng
nu
ta
ou
ic
ta
S.
ou
.m
ic
na
S.
.n
J.
.m
na
.n
J.
fo
lo
fo
os
an
te
lo
os
an
te
zh
zh
C
.k
lo
C
.k
A
lo
at
pt
E.
A
at
pt
E.
.p
ng
.p
ng
A
E.
le
A
E.
E.
le
E.
A
lo
A
lo
J.
J.
E.
E.
Figure 4. Distribution and frequency analysis of repeated sequences in chloroplast genome of A. marina. (A)
total number of forward, palindromic and tandem repeats. (B) distribution of palindromic repeats in different
ranges of length. (C) distribution of forward repeats in different ranges of length. (D) distribution of tandem
repeats in different ranges of length.
same (25,000 bp to 25,700 bp) except in the specie S. cusia in which the IR region was found significantly lower
(16,328 bp) as compared to the other species (Table 1). Some of the genes present on the borders of IR, SSC and
LSC region were duplicated. For example, at JLB border, the rps19 gene was found in the LSC region in the spe-
cies A. marina, A. paniculata, A. knappiae and C. nutans (Fig. 5). However, this rps19 gene was found in the IRb
region about 15 bp away form JLB border in E. attenuatus, E. lofouensis and E. longipes, 19 bp in E. longipes, 97 bp
in E. longzhouensis, 102 bp in J. flava and 85 bp in the J. leptostachya. Similarly, the gene ndhF was found partly
extended in the IRb regions in some species such as E. lofouensis 70 bp, E. longipes 93 bp, E. longzhouensis 70 bp,
J. flava 117 bp, J. leptostachya 122 bp and S. cusia 44 bp extended in the IRb region at JLB junction. However, the
same gene (ndhF) was found in the SSC region in A. marina about 78 bp away for JSA border. On the other hand,
this ndhF gene is partly extended to IRa region in some species where it is located about 40 bp, 41 bp 43 bp and
109 bp in the IRa regions in (A. paniculate, A. knappiae, C. nutans and E. attenuatus). Additionally, the ycf1 gene
was found at the IRs and SSC border in E. lofouensis, E. longipes, E. longzhouensis, J. flava, J. leptostachya and S.
cusia were it extended to IRa region with (797, 820, 797, 812, 817 and 771) bp respectively (Fig. 5).
Phylogenetic relationships among A. marina and related species. To determine the phylogenetic
position of the A. marina, complete chloroplast genome was performed and compared with 24 other related
species to build the phylogenetic tree. The phylogenetic position of A. marina is established using maximum
likelihood (ML), maximum persimony (MP) and neighbour-jouining (NJ) methods in this study by utilizing 65
shared genes and complete cp genomes of related plant species. The phylogenetic trees constructed on three dif-
ferent methods shows same result and A. marina formed a clade near to A. paniculata and A. knappiae genomes
from same family Acanthaceae. Similarly, Gesneriaceae was found the closest family to Acanthaceae (Fig. 6;
Figure S2).
Scientific Reports | (2021) 11:3586 | https://doi.org/10.1038/s41598-021-83060-z 8
Vol:.(1234567890)www.nature.com/scientificreports/
Figure 5. Distance between the adjacent genes and junctions of Large single Copy (LSC), two inverted repeats
(IR) and Small Single Copy (SSC) in A. marina and 10 other related species. boxes below and above the lines
represent the genes located on the border of LSC, IR and SSC. The figure represents the changes in the length
and location of certain genes across these borders.
Discussion
A. marina belongs to the family Acanthaceae which consist of more than 400 species distributed around the
world35. The phylogenetic analysis is very important to correctly identify the taxonomic position of plants.
Recently chloroplast genome sequencing has played a major role in the phylogenetic analysis of p lants36,37.
Though the chloroplast genomes are highly conserved when the size and genomic architecture are considered,
however, the genes located on the borders of IR/SC varies tremendously in terms of size and type which make
chloroplast distinctive for phylogenetic a nalysis38,39. The chloroplast genome sequence of all the 10 related spe-
cies were also found conserved, however when compared with each other and with the chloroplast genome of
A. marina, differences were observed for the genes located on the borders of IR/SC regions.
The size of complete chloroplast genome of A. marina (150,279 bp) is greater than the previously reported
J. laptostachya (149,227 bp)40 and S. Cusia (144,133 bp)41, and almost same size of A. paniculata (150,249 bp)42
and J. flava (150,888)43. However, the size of A. marina chloroplast genome that we sequenced was found lower
than the previously reported chloroplast genomes of the related species such as A. knappiae44, C. nutans45, E.
attenuates , E. lofouensis , E. longipes46 and E. longzhouensis43. Our study also confirmed the LSC, SSC and IR
region that were almost similar in size to the previously reported chloroplast genomes of Eucalyptus globulus47,
Coffea arabica L.48 and Camellia japonica L.49. In our study, we have found that the GC contents (38.6%) of A.
marina and on the 3rd position of codons, the GC contents (32.25%) were found lower as compared to AT/U
contents (67.8%) which support previous reports of chloroplast genome sequences of C. gileadensis (37.9%) and
C. foliacea (37.8%)50. The intron containing genes (14 genes) were found in which only 2 genes were found to
contain two introns. The introns are very important in the gene expression regulations studies and it has been
observed that when present on specific sites/positions, it can positively regulate exogeneous gene e xpression51.
Thus, introns can be valuable tools in order to improve the transformation efficiencies. The intron sequences of
chloroplast DNA also has key role in the phylogenetic analysis52.
Scientific Reports | (2021) 11:3586 | https://doi.org/10.1038/s41598-021-83060-z 9
Vol.:(0123456789)www.nature.com/scientificreports/
Figure 6. Phylogenetic trees were constructed for twenty-four species from four families using three different
methods maximum likelihood (ML), maximum parsimony (MP) and neighbor -joining (NJ) by using 65 shared
genes. Numbers above the branches are the bootstrap values of ML, MP and NJ respectively. Red star represents
the position for Avicennia marina.
Similarly, the size of protein coding genes (79,321 bp), rRNA (9,054 bp), tRNA (2,839 bp) and the number
of genes (132), protein coding genes (87), rRNA (8) and tRNA (37) were found in our study that coincides
with the previously reported studies on chloroplast g enomes50. For example, in the same family (Acanthaceae),
Ding, et al.42 and Huang, et al.44 previously reported the size of protein coding genes, rRNA, tRNA, number of
genes, number of protein coding genes, number of rRNA and number of tRNA in A. paniculate and A. knappiae
Scientific Reports | (2021) 11:3586 | https://doi.org/10.1038/s41598-021-83060-z 10
Vol:.(1234567890)www.nature.com/scientificreports/
which is similar to what we found in the A. marina. Similarly, almost same results were observed in the recently
reported chloroplast genomes of C. gileadensis50, Teucrium species53, Vachellia nilotica and Senegalia senegal54.
In the chloroplast genome, microsatellites or SSRs distributed in the genome with the length of almost 1 bp
to 6 bp. Previously many studies reported SSRs at different positions in chloroplast genomes55,56. In the present
study, SSRs distributed at different locations such as IR regions, LSC and SSC region were identified in the A.
marina. Total of 126 SSRs were identified in A. marina and almost similar number of SSRs were found in the
chloroplast genomes of related species such as E. Longipes (122) and E. longzhouensis (120). Other studies on
chloroplast genomes have also confirmed the presence of uneven numbers of SSRs in the chloroplast genomes
at different l ocations50,57–59.
Additionally, the forward, tandem and palindromic repeats in the A. marina were analyzed. The number of
forward repeats were found 25, reverse repeats 11, palindromic repeats 14 and 15 tandem repeats were found
in A. marina. The number of forward, reverse, tandem and palindromic repeats were found almost similar in
the chloroplast genomes of the related species such A. paniculate42 and44. The pairwise alignment of gene in A.
marina showed divergence of various genes in the coding regions as well as in the intergenic regions. The most
divergent genes include rps16, rpoC1, rpoC2, psbH, petB and accD. Similarly the most prominent divergence in
the intergenic region was found in psbA-matK, rps16-psbL, atpA-atpF, atpH-atpI, rpoC1-rpoB, petN-psbM, psbD-
rps14, ycf3—rps4, atpE-rbcL, accD-ycf4, psbL-petL, rps12-psbN, petD-rpl36, rpoA-rps11, rpl22-rps8, rpl16-rps3,
ycf15-ndhB, rps19-rpl23, ndhF-ccsA, ndhD-psaC, ndhI-ndhG, ndhA-ycf1 and ndhB-ycf2. The gene divergence
previously studied52,60–62 in the chloroplast genomes strongly confirms our findings of gene divergence.
The difference in the size of chloroplast genome is considered a common evolutionary practice which can be
attributed to the contraction and expansion of the inverted repeats (the most conserved regions) in the g enome63.
In majority of the plants, the junctions or borders of the genome particularly in the quadripartite structure
are very conserved. However, inversion at the borders or junction can be found in some species as previously
reported64 as well as the loss of genes and the expansion and contraction which is the common cp genome event
in the angiosperms65,66. The results in our study shows that rps19 gene at JLB junction in A. marina has extended
to IRb (15 to 102 bp) while the gene ndhF partly on the IRa region (40 to 178 bp) shows similar results patterns
as previously studied by Cheon, et al.67.
The phylogenetic analysis is very important for the evolutionary and taxonomic studies. Many phylogenetic
analysis are now based on the chloroplast genomes68,69. Previously, the phylogenetic analysis of mangrove (A.
marina) were mostly based on the RAPD and other molecular markers70,71. Sahu, et al.72 reported that the role
of multiple gene in the mangrove phylogeny. However, in this study we used both whole cp genomes and con-
catenated 65 protein coding genes to infer the phylogenetic position of A. marina. Both data sets showed same
results and A. marina is closely related to A. paniculate and A. knappiae in family Acanthaceae. The present study
provides a valuable analysis of the complete plastome of A. marina and related species, which may facilitate spe-
cies identification and both biological and phylogenetic studies.
Conclusion
Complete chloroplast genome sequence of A. marina was found highly conserved in its structure and order
of genes distribution as compared to the other mangrove species in Acanthaceae. The results showed location
and distribution of SSRs as well as the sequence divergence among the chloroplast genome of A. marina and
related mangrove species. Among genes, rpl22, ndhF, rps15 and ndhA were found the most divergent genes in
the mangrove species. Additionally, the phylogenetic analysis shows that A. marina was closer to A. knappiae
and A. paniculate species. It can be concluded from this study that complete chloroplast genome sequence may
provide a better understanding of identification and phylogenetic studies of plant as compared to other strategies.
Materials and methods
Plant sample, Chloroplast DNA extraction and sequencing. A. marina seedlings were donated by
the Center for Marine Conservation, Ministry of Environment, Sultanate of Oman. After shipping it to the
greenhouse the leaves were collected in liquid nitrogen and ground to a fine powder. The powder samples of
leaves were processed for chloroplast DNA extraction. Leaves were collected from the mangrove plants and
were ground into fine powder using liquid nitrogen. Chloroplast DNA was extracted using the protocol of Khan
et al.73. Manufacturer’s instructions (Life Technologies, Carlsbad, CA, USA) were followed for the preparations
of genomic libraries. Ion Shear Plus Reagents kit was used to shear chloroplast DNA into 400 bp fragments while
Ion Xpress Plus gDNA Fragment Library kit was used for library preparation. Quantity and quality of libraries
were checked using the Qubit 3.0 fluorometer and Bioanalyzer (Agilent 2100 Bioanalyzer system; Life Tech-
nologies, Carlsbad, CA, USA). The template was amplified using Ion 520 & 530 OT2 Reagents and enriched by
using the OneTouch instrument and Ion OneTouch ES enrichment system. The final chloroplast DNA sample
was loaded into Ion S5 Sequencing (supported by Mawarid, Oman’s Animal & Plant Genetic Resource Center,
Ministry of Higher Education, Researcher & Innovation, Oman) Chip followed by sequencing through the Ion
Torrent S5 protocol34,53.
Genome assembly and annotation. A total of 2,256,283, raw reads were generated for the chloroplast
genome of A. marina. The cp genome of A. marina was mapped with other chloroplast genomes such as Andro-
graphis paniculate74, using Bowtie2 (v.2.2.3)75 in Geneious Pro (v.10.2.3) software76. For the assembly, the mean
coverage of A. marina was 99X. IR region was identified by using the MITObim (v.1.8) software50,77 was used
for the sequence length adjustment. FASTQC78,79 was performed after sequencing to check the read quality. For
biases reduction in the analysis, an in-house script was used to filter reads if less than 90% of the bases that made
Scientific Reports | (2021) 11:3586 | https://doi.org/10.1038/s41598-021-83060-z 11
Vol.:(0123456789)www.nature.com/scientificreports/
up the read were below Q20. Adopter sequences were removed using the Trimmomatic (v0.36)80. Bowtie2 in
Geneious Pro (v.10.2.3)76 were used for mapping only high quality reads.
Dual Organellar Genome Annotator (DOGMA)81 was used for the genome annotation. For the position’s
identification of transfer and ribosomal RNA and coding genes BLASTX and BLASTN were used. Furthermore,
tRNAscan-SE version 1.2182 was used for the tRNA gene annotation. In order to compare the cp genome of A.
marina with the related cp genomes, tRNAscan-SE and Geneious software were used. Intron boundaries, stop
and start codons were adjusted by comparing it to the previously reported cp genome of the related specie from
family Acanthaceae. OGDRAW83 was used for the illustrations of structural features of A. marina cp genome.
MEGA-X software84 was used for the determination of deviations in synonymous codon usage and relative syn-
onymous codon usage with amino acid composition influence. The pairwise gene divergence was determined
by mVISTA85 in Shuffle-LAGAN mode.
Identification of repetitive sequences and SSRs. The REPuter software86 was used for the identifica-
tion of forward, reverse and palindromic repeats, the sequence identity with 90% and minimum 15 bp was the
basic criteria in the identification. Microsatellite analysis of contig sequences was carried out with the MIcroS-
Atellite (MISA) identification tool87. The parameters (unit_size, min_repeats) were defined as follows: 1–10, 2–8,
3–4, 4–4, 5–3, and 6–3; the minimum distance between two SSRs was set to 100. For the identification of tandem
repeats, Tandem Repeat Finder version 4.08788 b was used for tandem repeat identification.
Sequence divergence and Phylogenetic analysis. The pairwise distance among the cp genes shared
by A. marina and related species as well as the complete cp genome of A. marina was determined. The ambigu-
ous and missing genes annotation were identified and removed by the comparative sequence analysis. Complete
cp genomes were aligned by using the MAFFT version 7.22289 and Kimura’s two-parameter (K2P) model90 was
used for calculation of pairwise sequence distance. The divergence of the new A. marina cp genomes from
VISTA85 in Shuffle-LAGAN mode and by employing
related species of family Acanthaceae was assessed using m
the new A. marina genome as reference.
For the determination of phylogenetic position of A. marina, 23 published cp genomes were downloaded
from NCBI from four different families (Gesnerianceae, Lamiaceae, Bignoniaceae and Acanthaceae) respectively.
Complete cp genomes and a separate partition containing only the 65 shared genes (concatenated) were used to
infer the phylogenetic position of A. marina. MAFFT version 7.22289, with default parameters were used for the
alignment of both complete genomes and shared genes data sets. Maximum likelihood (ML) and neighbour-
joining (NJ) methods were used to infer the phylogenetic trees with MEGA-X91 and parameters were adjusted
with a BIONJ tree with 1000 bootstrap replicates using the Kimura 2-parameter model with gamma-distributed
rate heterogeneity and invariant sites. Maximum parsimony (MP) by using P AUP92 using previously described
33,93
settings .
Data availability
All data generated or analyzed during this study are included in this published article.
Received: 7 September 2020; Accepted: 14 January 2021
References
1. Faridah-Hanum, I. et al. Development of a comprehensive mangrove quality index (MQI) in Matang Mangrove: assessing mangrove
ecosystem health. Ecol. Ind. 102, 103–117 (2019).
2. Spalding, M. World Atlas of Mangroves (Routledge, New York, 2010).
3. Himes-Cornell, A., Grose, S. O. & Pendleton, L. Mangrove ecosystem service values and methodological approaches to valuation:
where do we stand?. Front. Mar. Sci. 5, 376 (2018).
4. Wu, Y., Ricklefs, R. E., Huang, Z., Zan, Q. & Yu, S. Winter temperature structures mangrove species distributions and assemblage
composition in China. Glob. Ecol. Biogeogr. 27, 1492–1506 (2018).
5. Das, S. S., Das, S. & Ghosh, P. Phylogenetic relationships among the mangrove species of Acanthaceae found in Indian Sundarban,
as revealed by RAPD analysis. Adv. Appl. Sci. Res 6, 179–184 (2015).
6. Kathiresan, K. & Bingham, B. L. Biology of mangroves and mangrove ecosystems. Adv. Mar. Biol. 40, 84–254 (2001).
7. Sannigrahi, S. et al. Responses of ecosystem services to natural and anthropogenic forcings: a spatial regression based assessment
in the world’s largest mangrove ecosystem. Sci. Total Environ. 715, 137004 (2020).
8. dos Santos, N. M. & Lana, P. Present and past uses of mangrove wood in the subtropical Bay of Paranaguá (Paraná, Brazil). Ocean
Coast. Manag. 148, 97–103 (2017).
9. Jusoff, K. Malaysian mangrove forests and their significance to the coastal marine environment. Pol. J. Environ. Stud. 22, 979–1005
(2013).
10. Duke, N. C., Lo, E. & Sun, M. Global distribution and genetic discontinuities of mangroves–emerging patterns in the evolution
of Rhizophora. Trees 16, 65–79 (2002).
11. Nagelkerken, I. et al. The habitat function of mangroves for terrestrial and marine fauna: a review. Aquat. Bot. 89, 155–185 (2008).
12. Tomlinson, P. B. The Botany of Mangroves (Cambridge University Press, Cambridge, 2016).
13. Dahdouh-Guebas, F. et al. How effective were mangroves as a defence against the recent tsunami?. Curr. Biol. 15, R443–R447
(2005).
14. Saenger, P. Mangrove Ecology, Silviculture and Conservation (Springer, Berlin, 2002).
15. Lakshmi, M., Parani, M. & Parida, A. Molecular phylogeny of mangroves IX: molecular marker assisted intra-specific variation
and species relationships in the Indian mangrove tribe Rhizophoreae. Aquat. Bot. 74, 201–217 (2002).
16. Grover, A. & Sharma, P. Development and use of molecular markers: past and present. Crit. Rev. Biotechnol. 36, 290–302 (2016).
17. Adsul, G. G., Chaurasia, A. K., Dhake, A. V. & Kothari, R. M. RAPD analysis of phylogenetic relationships and genetic variations
in genus Allium. Biochem. Indian J. 3, 1–5 (2015).
Scientific Reports | (2021) 11:3586 | https://doi.org/10.1038/s41598-021-83060-z 12
Vol:.(1234567890)www.nature.com/scientificreports/
18. Xu, K. et al. Identification of tuna species (Thunnini tribe) by PCR-RFLP analysis of mitochondrial DNA fragments. Food Agric.
Immunol. 27, 301–313 (2016).
19. Wambugu, P. W., Brozynska, M., Furtado, A., Waters, D. L. & Henry, R. J. Relationships of wild and domesticated rices (Oryza AA
genome species) based upon whole chloroplast genome sequences. Sci. Rep. 5, 1–9 (2015).
20. Middleton, C. P. et al. Sequencing of chloroplast genomes from wheat, barley, rye and their relatives provides a detailed insight
into the evolution of the Triticeae tribe. PLoS ONE 9, e85761 (2014).
21. Raman, G. & Park, S. The complete chloroplast genome sequence of Ampelopsis: gene organization, comparative analysis, and
phylogenetic relationships to other angiosperms. Front. Plant Sci. 7, 341 (2016).
22. Yang, J. B., Li, D. Z. & Li, H. T. Highly effective sequencing whole chloroplast genomes of angiosperms by nine novel universal
primer pairs. Mol. Ecol. Resour. 14, 1024–1031 (2014).
23. Su, H.-J., Hogenhout, S. A., Al-Sadi, A. M. & Kuo, C.-H. Complete chloroplast genome sequence of Omani lime (Citrus aurantii-
folia) and comparative analysis within the rosids. PLoS ONE 9, e113049 (2014).
24. Hu, S. Phylogeny and Chloroplast Evolution in BRASSICACEAE, University of Trento, (2016).
25. Santos, C. G. Development of new tools for the identification of plants using chloroplast DNA sequences. (2018).
26. Singh, B. P., Kumar, A., Kaur, H., Singh, H. & Nagpal, A. K. CpGDB: A comprehensive database of chloroplast genomes. Bioinfor-
mation 16, 171 (2020).
27. Wu, Z. The new completed genome of purple willow (Salix purpurea) and conserved chloroplast genome structure of Salicaceae.
J. Nat. Sci 1, e49 (2015).
28. Wu, Z. The whole chloroplast genome of shrub willows (Salix suchowensis). Mitochondrial DNA Part A 27, 2153–2154 (2016).
29. Egamberdiev, S. S. et al. Comparative assessment of genetic diversity in cytoplasmic and nuclear genome of upland cotton. Genetica
144, 289–306 (2016).
30. Williams, A. V., Miller, J. T., Small, I., Nevill, P. G. & Boykin, L. M. Integration of complete chloroplast genome sequences with
small amplicon datasets improves phylogenetic resolution in Acacia. Mol. Phylogenet. Evol. 96, 1–8 (2016).
31. Fučíková, K. et al. New phylogenetic hypotheses for the core Chlorophyta based on chloroplast sequence data. Front. Ecol. Evol.
2, 63 (2014).
32. Friis, G. et al. A high-quality genome assembly and annotation of the gray mangrove, Avicennia marina. bioRxiv (2020).
33. Asaf, S. et al. Complete chloroplast genome of Nicotiana otophora and its comparison with related species. Front. Plant Sci. 7, 843
(2016).
34. Asaf, S., Khan, A. L., Khan, A. & Al-Harrasi, A. Unraveling the chloroplast genomes of two prosopis species to identify its genomic
information, comparative analyses and phylogenetic relationship. Int. J. Mol. Sci. 21, 3280 (2020).
35. Souladeth, P., Tagane, S., Zhang, M., Okabe, N. & Yahara, T. Flora of Nam Kading National Protected Area I: a new species of
yellow-flowered Strobilanthes (Acanthaceae), S. namkadingensis. PhytoKeys 81, 11 (2017).
36. Yang, L. et al. The complete chloroplast genome of Swertia tetraptera and phylogenetic analysis. Mitochondrial DNA Part B 5,
164–165 (2020).
37. Biju, V. C. et al. The complete chloroplast genome of Trichopus zeylanicus, and phylogenetic analysis with dioscoreales. Plant
Genome 12, 190032 (2019).
38. Silva, S. R. et al. The chloroplast genome of Utricularia reniformis sheds light on the evolution of the ndh gene complex of terrestrial
carnivorous plants from the Lentibulariaceae family. PLoS ONE 11, e0165176 (2016).
39. Zuo, L.-H. et al. The first complete chloroplast genome sequences of Ulmus species by de novo sequencing: Genome comparative
and taxonomic position analysis. PLoS ONE 12, e0171264 (2017).
40. Niu, Z., Huang, S., Deng, Y. & Chen, X. The complete chloroplast genome of Justicia leptostachya (Acanthaceae). Mitochondrial
DNA Part B 4, 1114–1115 (2019).
41. Chen, H. et al. Sequencing and analysis of Strobilanthes cusia (Nees) Kuntze chloroplast Genome revealed the rare simultaneous
contraction and expansion of the inverted repeat region in Angiosperm. Front. Plant Sci. 9, 324 (2018).
42. Ding, P. et al. The complete chloroplast genome sequence of the medicinal plant Andrographis paniculata. Mitochondrial DNA
Part A 27, 2347–2348 (2016).
43. Yaradua, S. S., Alzahrani, D. A., Albokhary, E. J., Abba, A. & Bello, A. Complete chloroplast genome sequence of Justicia flava:
genome comparative analysis and phylogenetic relationships among Acanthaceae. BioMed Res. Int. 2019, 4370258 (2019).
44. Huang, S., Deng, Y. & Ge, X. The complete chloroplast genome of Aphelandra knappiae (Acanthaceae). Mitochondrial DNA Part
B 4, 273–274 (2019).
45. Li, M.-N. et al. Complete plastome sequence of Clinacanthus nutans (Acanthaceae): a medicinal species in Southern China.
Mitochondrial DNA Part B 4, 118–119 (2019).
46. Jiang, M., Wang, J. & Zhang, H. Characterization and phylogenetic analysis of the complete chloroplast genome sequence of Dis-
anthus cercidifolius subsp. longipes (Hamamelidaceae), a rare and endangered wild plant species in China. Mitochondrial DNA
Part B 5, 1206–1207 (2020).
47. Steane, D. A. Complete nucleotide sequence of the chloroplast genome from the Tasmanian blue gum, Eucalyptus globulus (Myrta-
ceae). DNA Res. 12, 215–220 (2005).
48. Park, J., Kim, Y., Xi, H. & Heo, K.-I. The complete chloroplast genome of ornamental coffee tree, Coffea arabica L. (Rubiaceae).
Mitochondrial DNA Part B 4, 1059–1060 (2019).
49. Park, J. et al. The complete chloroplast genome of common camellia tree, Camellia japonica L. (Theaceae), adapted to cold environ-
ment in Korea. Mitochondrial DNA Part B 4, 1038–1040 (2019).
50. Arif Khan, S. A. et al. First complete chloroplast genomics and comparative phylogenetic analysis of Commiphora gileadensis and
C. foliacea: Myrrh producing trees. PLoS ONE 14, e0225469 (2019).
51. Xu, J. et al. The first intron of rice EPSP synthase enhances expression of foreign gene. Sci. China Ser. C Life Sci. 46, 561 (2003).
52. Kelchner, S. A. The evolution of non-coding chloroplast DNA and its application in plant systematics. Ann. Missouri Bot. Gard.
87, 482–498 (2000).
53. Khan, A. et al. Complete chloroplast genomes of medicinally important Teucrium species and comparative analyses with related
species from Lamiaceae. PeerJ 7, e7260 (2019).
54. Asaf, S., Khan, A., Khan, A. L., Al-Harrasi, A. & Al-Rawahi, A. Complete chloroplast genomes of Vachellia nilotica and Senegalia
senegal: comparative genomics and phylogenomic placement in a new generic system. PLoS ONE 14, e0225469 (2019).
55. Su, Y., He, Z., Wang, Z., Hong, Y. & Wang, T. Characterization of the complete chloroplast genome of Leptochilus decurrens
(Polypodiaceae), a least concern folk medicinal fern. Mitochondrial DNA Part B 4, 3346–3347 (2019).
56. Kumar, S. & Shanker, A. In silico comparative analysis of simple sequence repeats in chloroplast genomes of genus nymphaea. J.
Sci. Res. 64, 186–192 (2020).
57. Asaf, S. et al. The complete chloroplast genome of wild rice (Oryza minuta) and its comparison to related species. Front. Plant Sci.
8, 304 (2017).
58. Asaf, S. et al. Complete chloroplast genome sequence and comparative analysis of loblolly pine (Pinus taeda L.) with related species.
PLoS ONE 13, e0192966 (2018).
59. Khan, A. L. et al. The first chloroplast genome sequence of Boswellia sacra, a resin-producing plant in Oman. PLoS ONE 12,
e0169794 (2017).
Scientific Reports | (2021) 11:3586 | https://doi.org/10.1038/s41598-021-83060-z 13
Vol.:(0123456789)www.nature.com/scientificreports/
60. Asaf, S. et al. Comparative analysis of complete plastid genomes from wild soybean (Glycine soja) and nine other Glycine species.
PLoS ONE 12, e0182281 (2017).
61. Qian, J. et al. The complete chloroplast genome sequence of the medicinal plant Salvia miltiorrhiza. PLoS ONE 8, e57607 (2013).
62. Wang, W. & Messing, J. High-throughput sequencing of three Lemnoideae (duckweeds) chloroplast genomes from total DNA.
PLoS ONE 6, e24670 (2011).
63. Shen, X. et al. Complete chloroplast genome sequence and phylogenetic analysis of the medicinal plant Artemisia annua. Molecules
22, 1330 (2017).
64. Liu, M. et al. The complete chloroplast genome sequence of Tartary Buckwheat Cultivar Miqiao 1 (Fagopyrum tataricum Gaertn.).
Mitochondrial DNA Part B 1, 577–578 (2016).
65. Fu, P.-C., Zhang, Y.-Z., Geng, H.-M. & Chen, S.-L. The complete chloroplast genome sequence of Gentiana lawrencei var. farreri
(Gentianaceae) and comparative analysis with its congeneric species. PeerJ 4, e2540 (2016).
66. Choi, K. S., Chung, M. G. & Park, S. The complete chloroplast genome sequences of three Veroniceae species (Plantaginaceae):
comparative analysis and highly divergent regions. Front. Plant Sci. 7, 355 (2016).
67. Cheon, K.-S., Kim, K.-A., Kwak, M., Lee, B. & Yoo, K.-O. The complete chloroplast genome sequences of four Viola species (Vio-
laceae) and comparative analyses with its congeneric species. PLoS ONE 14, e0214162 (2019).
68. Munyao, J. N. et al. Complete chloroplast genomes of chlorophytum comosum and chlorophytum gallabatense: genome structures,
comparative and phylogenetic analysis. Plants 9, 296 (2020).
69. Yu, T., Huang, B.-H., Zhang, Y., Liao, P.-C. & Li, J.-Q. Chloroplast genome of an extremely endangered conifer Thuja sutchuenensis
Franch.: gene organization, comparative and phylogenetic analysis. Physiol. Mol. Biol. Plants 1–10 (2020).
70. Sabri, D. M., El-Hussieny, S. A. & Elnwishy, N. Genotypic Variations of Mangrove (Avicennia marina) in Nabq Protectorate, South
Sinai Egypt. Int. J. Agric. Biol. 20, 637–646 (2018).
71. 71Basyuni, M., Baba, S. & Oku, H. in IOP Conference Series: Materials Science and Engineering. 012247 (IOP Publishing).
72. Sahu, S. K., Singh, R. & Kathiresan, K. Multi-gene phylogenetic analysis reveals the multiple origin and evolution of mangrove
physiological traits through exaptation. Estuar. Coast. Shelf Sci. 183, 41–51 (2016).
73. Khan, A. et al. First complete chloroplast genomics and comparative phylogenetic analysis of Commiphora gileadensis and C.
foliacea: Myrrh producing trees. PLoS ONE 14, e0208511 (2019).
74. Arif, M. F., Aristya, G. R., Subositi, D., Sari, A. N. & Kasiamdari, R. S. rbcL and matK chloroplast DNA composition of green
chireta (Andrographis paniculata) from Indonesia. Biodivers. J. Biol. Divers. 20, 3575–3583 (2019).
75. Langdon, W. B. Performance of genetic programming optimised Bowtie2 on genome comparison and analytic testing (GCAT)
benchmarks. BioData Min. 8, 1 (2015).
76. Kearse, M. et al. Geneious Basic: an integrated and extendable desktop software platform for the organization and analysis of
sequence data. Bioinformatics 28, 1647–1649 (2012).
77. Gan, H. M., Schultz, M. B. & Austin, C. M. Integrated shotgun sequencing and bioinformatics pipeline allows ultra-fast mitogenome
recovery and confirms substantial gene rearrangements in Australian freshwater crayfishes. BMC Evol. Biol. 14, 19 (2014).
78. Feng, G., Yang, J. & Peng, F.-R. Characterization of complete chloroplast genome of artificial hybrid passion fruit ‘Ziyan’, Passiflora
edulis Sims× P. edulis f. edulis Sims (Passifloraceae). Mitochondrial DNA Part B 5, 1720–1721 (2020).
79. Brown, J., Pirrung, M. & McCue, L. A. FQC Dashboard: integrates FastQC results into a web-based, interactive, and extensible
FASTQ quality control tool. Bioinformatics 33, 3137–3139 (2017).
80. Bolger, A. M., Lohse, M. & Usadel, B. Trimmomatic: a flexible trimmer for Illumina sequence data. Bioinformatics 30, 2114–2120
(2014).
81. Wyman, S. K., Jansen, R. K. & Boore, J. L. Automatic annotation of organellar genomes with DOGMA. Bioinformatics 20, 3252–
3255 (2004).
82. Schattner, P., Brooks, A. N. & Lowe, T. M. The tRNAscan-SE, snoscan and snoGPS web servers for the detection of tRNAs and
snoRNAs. Nucleic Acids Res. 33, W686–W689 (2005).
83. Lohse, M., Drechsel, O. & Bock, R. OrganellarGenomeDRAW (OGDRAW): a tool for the easy generation of high-quality custom
graphical maps of plastid and mitochondrial genomes. Curr. Genet. 52, 267–274 (2007).
84. Kumar, S., Stecher, G., Li, M., Knyaz, C. & Tamura, K. MEGA X: molecular evolutionary genetics analysis across computing
platforms. Mol. Biol. Evol. 35, 1547–1549 (2018).
85. Frazer, K. A., Pachter, L., Poliakov, A., Rubin, E. M. & Dubchak, I. VISTA: computational tools for comparative genomics. Nucleic
Acids Res. 32, W273–W279 (2004).
86. Kurtz, S. et al. REPuter: the manifold applications of repeat analysis on a genomic scale. Nucleic Acids Res. 29, 4633–4642 (2001).
87. Beier, S., Thiel, T., Münch, T., Scholz, U. & Mascher, M. MISA-web: a web server for microsatellite prediction. Bioinformatics 33,
2583–2585 (2017).
88. Wirawan, A., Kwoh, C. K., Hsu, L. Y. & Koh, T. H. in International Conference on Computational Systems-Biology and Bioinformat-
ics. 151–164 (Springer).
89. Katoh, K. & Standley, D. M. MAFFT multiple sequence alignment software version 7: improvements in performance and usability.
Mol. Biol. Evol. 30, 772–780 (2013).
90. Srivathsan, A. & Meier, R. On the inappropriate use of Kimura-2-parameter (K2P) divergences in the DNA-barcoding literature.
Cladistics 28, 190–194 (2012).
91. Kumar, S., Nei, M., Dudley, J. & Tamura, K. MEGA: a biologist-centric software for evolutionary analysis of DNA and protein
sequences. Brief. Bioinf. 9, 299–306 (2008).
92. Swofford, D. L. Paup*: Phylogenetic analysis using parsimony (and other methods) 4.0. B5. (2001).
93. Wu, Z., Tembrock, L. R. & Ge, S. Are differences in genomic data sets due to true biological variants or errors in genome assembly:
an example from two chloroplast genomes. PLoS ONE 10, e0118019 (2015).
Author contributions
A.L.K., and Abdul L.K. performed experiments, S.A. and M.N. wrote the original draft, Bioinformatics analysis:
S.A., manuscript drafting and editing S.A., A.L.K., A.A.-H., supervision and arranging resources.
Funding
The funders had no role in study design, data collection and analysis, decision to publish, or preparation of the
manuscript.
Competing interests
The authors declare no competing interests.
Scientific Reports | (2021) 11:3586 | https://doi.org/10.1038/s41598-021-83060-z 14
Vol:.(1234567890)You can also read