Fight crime. Unravel incidents... one byte at a time - SANS ...
←
→
Page content transcription
If your browser does not render page correctly, please read the page content below
Fight crime.
Unravel incidents... one byte at a time.

                          Copyright SANS Institute
                          Author Retains Full Rights
  This paper is from the SANS Computer Forensics and e-Discovery site. Reposting is not permited without express written permission.

Interested in learning more?
Check out the list of upcoming events offering
"Advanced Incident Response, Threat Hunting, and Digital Forensics (FOR508)"
at http://digital-forensics.sans.orghttp://digital-forensics.sans.org/events/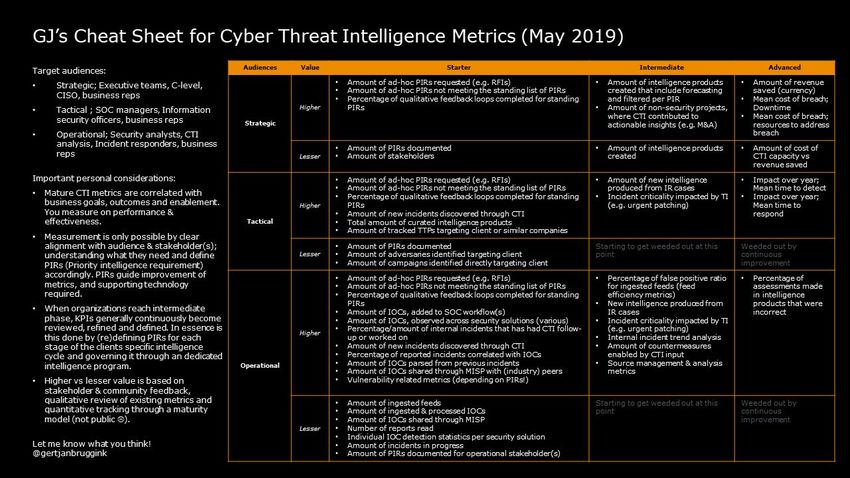
ts
                                                                                                 gh
                                                                                            Ri
                       ATT&CKing Threat Management: A Structured
                          Methodology for Cyber Threat Analysis

                                                                                         ll
                                                                                    Fu
                                                                              ns
                                                                           ai
                                        GIAC (GCFA) Gold Certification

                                                                       et
                                                                  rR
                                                      ISSE 5501

                                                             ho
                                   Author: Andy Piazza, andy.c.piazza@gmail.com
                                              Advisor: Tanya Baccam

                                                         ut
                                                    ,A
                                               Accepted: June 13, 2019
                                                te
                                           itu
                                        st
                                    In

                                                       Abstract
                             NS
                        SA

               Risk management is a principal focus for most information security programs. Executives
               rely on their IT security staff to provide timely and accurate information regarding the
                     e

               threats and vulnerabilities within the enterprise so that they can effectively manage the
                Th

               risks facing their organizations. Threat intelligence teams provide analysis that supports
               executive decision-makers at the strategic and operational levels. This analysis aids
          19

               decision makers in their commission to balance risk management with resource
     20

               management. By leveraging the MITRE Adversarial Tactics Techniques & Common
               Knowledge (ATT&CK) framework as a quantitative data model, analysts can bridge the
 ©

               gap between strategic, operational, and tactical intelligence while advising their
               leadership on how to prioritize computer network defense, incident response, and threat
               hunting efforts to maximize resources while addressing priority threats.

© 2019 The SANS Institute                                                                        Author retains full rights.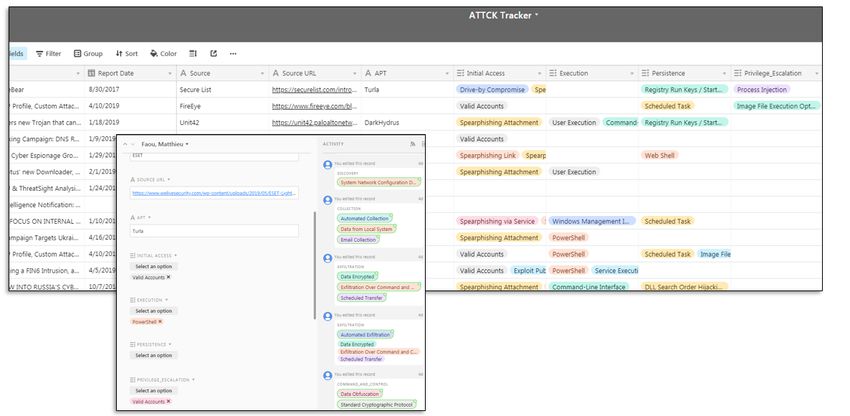
ts
                                                                  ATT&CKing Threat Management 2

                                                                                                     gh
                                                                                                 Ri
               1. Introduction

                                                                                             ll
                      Cyber threat intelligence is a daunting field and an intimidating topic for most

                                                                                        Fu
               organizations. Their analysts are overwhelmed with trying to keep up with the

                                                                                  ns
               community as it shares new hunting techniques, GitHub projects, and conference
               presentations on the latest threats. They often find themselves unable to focus on

                                                                              ai
                                                                          et
               developing basic, repeatable processes that provide long-term sustainability and value to

                                                                     rR
               the organization that they support. Organizations pump endless streams of raw data

                                                               ho
               through internal sensors, open-source collection systems, and commercial threat feeds
               while expecting their analysts to tune the feeds, react to alerts, and stay abreast of the

                                                           ut
                                                      ,A
               threat actors’ intent and capabilities. This constant flow of data leads most analytical
               shops into what is commonly known as firefighting mode, which means that they react
                                                  te
                                             itu
               and respond to the latest flare-ups and rest between events when they can. These analysts
               often focus on one or two related reports at a time to collect indicators of compromise
                                         st
                                     In

               (IOCs), identify tactics, techniques, and procedures (TTPs), and run hunts in their
               environments. The artifacts that they previously collected become forgotten items in the
                              NS

               form of incident tickets, share-drive folders, and threat intelligence platforms (TIPs).
                        SA

                      Consistently stuck at the tactical level of analysis, these analysts cannot address
                     e

               the strategic and operational level requirements of managers and executives. The
                Th

               National Institute of Standards and Technology (NIST) highlights that the “senior
          19

               management’s commitment to information security initiatives is the single most critical
     20

               element that impacts an information security program’s success” (Bowen, Chew, & Hash,
 ©

               2007). It is critical that threat analysis engages senior management and informs their
               decision-making processes at their level. IBM’s Security Intelligence group defines
               strategic threat intelligence as “analysis and information that can help organizations
               understand the type of threat they are defending against; the motivation and capability of
               the threat actor; and the potential impacts thereof” (Gourley, 2018). Additionally, threat
               analysis can identify gaps in an organization’s defense-in-depth coverage for those threat
               actors’ capabilities. At the operational level, threat analysis can inform the organization’s
               security awareness program to ensure that the training accurately describes the threat
               landscape. With operational intelligence, vulnerability management teams can prioritize
               patching to address actively exploited vulnerabilities. Intelligence analysts that are

               Andy Piazza, andy.c.piazza@gmail.com
© 2019 The SANS Institute                                                                            Author retains full rights.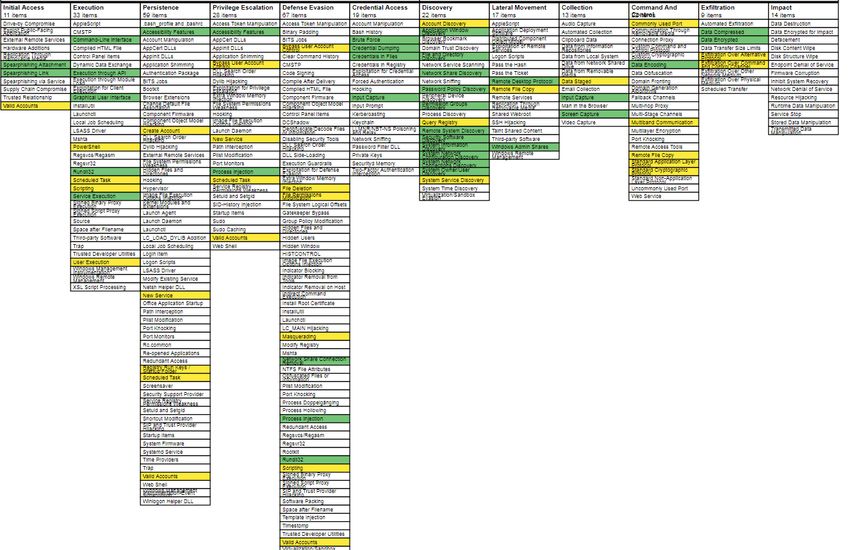
ts
                                                                   ATT&CKing Threat Management 3

                                                                                                    gh
                                                                                                Ri
               hindered by tactical level analysis cannot abandon that work to execute the strategic and
               operational requirements of their organization. Effective intelligence programs require all

                                                                                             ll
                                                                                       Fu
               three levels of analysis: tactical, operational, and strategic.

                                                                                 ns
                       Intelligence managers must develop mature processes and analytical

                                                                                 ai
               methodologies that bridge all three levels of analysis while providing analysts with

                                                                            et
               repeatable and effective procedures to collect, catalog, assess, and act on the information

                                                                      rR
               that they process. This paper will demonstrate that the MITRE Adversarial Tactics

                                                                ho
               Techniques & Common Knowledge (ATT&CK) framework can be leveraged as a

                                                            ut
               quantitative data model to prioritize resource management and security engineering

                                                       ,A
               efforts, inform computer network defense and incident response procedures, and guide
               technical threat hunts while informing decision makers at all three levels of analysis.
                                                   te
                                             itu
                                          st

               2. Literature Review
                                      In

                       While the Intelligence Community (IC) traces its roots back hundreds of years
                              NS

               and has been a constant force since World War II, cyber threat intelligence (CTI) is a
                        SA

               relatively new field that is still maturing through the work of analysts and organizations
               across both the public and private sectors. In intelligence analysis, practitioners rely on
                     e
                Th

               frameworks and data models to ensure consistency in their work and to reduce cognitive
               biases. This section discusses the existing cyber threat intelligence models and how
          19

               organizations have leveraged them historically.
     20

                       According to MITRE, ATT&CK is a “globally-accessible knowledge base of
 ©

               adversary tactics and techniques based on real-world observations” (MITRE, 2019). At
               the center of this system is the ATT&CK Matrix for Enterprise, which consists of Tactics
               as column headers and Techniques as values under those Tactics. Each Technique is a
               hyperlink to a Procedure page that provides a technical explanation of the specific
               Technique, the logs and data sources that are useful for analysis, and a list of actors that
               have previously used that Technique in an event. MITRE provides ATT&CK in the
               Structured Threat Information Expression (STIX) 2.0 JSON format via GitHub so that
               organizations can implement this data model in their STIX intelligence products and
               intelligence platforms (MITRE, 2019). Figure 1 below demonstrates how analysts can

               Andy Piazza, andy.c.piazza@gmail.com
© 2019 The SANS Institute                                                                            Author retains full rights.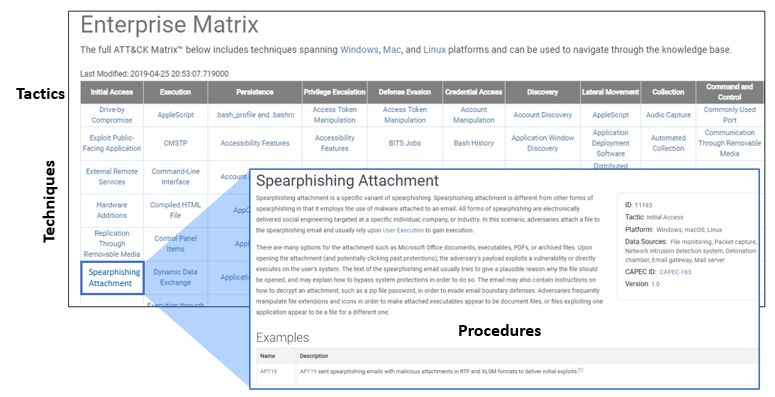
ts
                                                                 ATT&CKing Threat Management 4

                                                                                                     gh
                                                                                                Ri
               navigate through the Enterprise Matrix to view the Tactics, Techniques, and Procedures
               (TTPs).

                                                                                            ll
                                                                                       Fu
                                                                                 ns
                                                                              ai
                                                                          et
                                                                    rR
                                                               ho
                                                           ut
                                                      ,A
                                                  te
                                             itu
                                         st
                                     In

                   Figure 1: Enterprise Matrix with Tactics, Techniques, and Procedures
                              NS

                      Before the release of the MITRE ATT&CK framework, threat analysts had two
                         SA

               primary threat models for categorizing malicious activity: the Diamond Model for
                     e

               Intrusion Analysis (Caltagirone, Pendergast, & Betz, 2013) and the Lockheed Martin
                Th

               Cyber Kill Chain™ (Lockheed Martin, n.d.). These existing data models attempt to
          19

               quantify and characterize cyber intrusions by grouping the activity in threat actor
     20

               campaigns and intrusion events. These are sound intelligence models that organizations
               must not abandon while adopting the MITRE ATT&CK framework. In fact, research
 ©

               shows that these models integrate well with ATT&CK.

                      According to the debut white paper on the Diamond Model for Intrusion Analysis,
               it is “a formal method applying scientific principles to intrusion analysis - particularly
               those of measurement, testability, and repeatability - providing a comprehensive method
               of activity documentation, synthesis, and correlation” (Caltagirone, Pendergast, & Betz,
               2013). At the time of its development, the authors of the model acknowledged that it is
               “cognitive and highly manual” (Caltagirone, Pendergast, & Betz, 2013). Their choice of
               words indicates the difficulty of adopting the Diamond Model for routine analysis, and
               research shows that the adoption of the Diamond Model by security vendors is relatively

               Andy Piazza, andy.c.piazza@gmail.com
© 2019 The SANS Institute                                                                            Author retains full rights.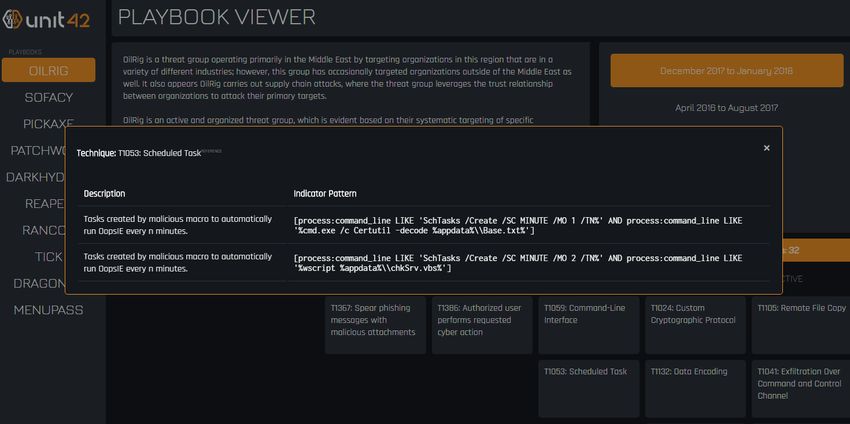
ts
                                                                 ATT&CKing Threat Management 5

                                                                                                     gh
                                                                                                Ri
               limited. ThreatConnect states that their cyber threat intelligence platform is the only TIP
               built on the Diamond Model (ThreatConnect, n.d.). Rather than serving as the underlying

                                                                                            ll
                                                                                       Fu
               data model for a security application, vendors traditionally only demonstrate how their
               tools map to the Diamond Model, which still requires manual processing by analysts to

                                                                                 ns
               implement. Recorded Future’s article “Applying Threat Intelligence to the Diamond

                                                                             ai
                                                                          et
               Model for Intrusion Analysis” is a perfect example of a vendor demonstrating the

                                                                    rR
               alignment of their categories to the Diamond Model without fully adopting the data
               model within their platform (Carreon, 2018). For example, they translate that their tool’s

                                                               ho
               “Method” category directly correlates to the Diamond Model’s Capabilities category

                                                           ut
               rather than adopting the term Capabilities within their taxonomy.

                                                     ,A
                      The Lockheed Martin Cyber Kill Chain™ is arguably more popular than the
                                                  te
                                            itu

               Diamond Model as multiple information sharing programs and threat intelligence
               organizations use it in their products and threat feeds. For example, the Department of
                                         st
                                     In

               Homeland Security’s (DHS) National Cybersecurity and Communications Integration
                              NS

               Center (NCCIC) uses the Cyber Kill Chain to categorize IOCs in their indicator
               packages, and they have used the model to catalog nation-state threat activity as well.
                        SA

               Their pivotal report, “Enhanced Analysis of GRIZZLY STEPPE” (NCCIC, 2017),
                     e

               discusses the history of the Russian government’s cyber activity through the lends of the
                Th

               Cyber Kill Chain.
          19

                      As a third option for analysts to categorize threat intelligence, the United States
     20

               Government (USG) developed the Cyber Threat Framework. According to the Director
 ©

               of National Intelligence (DNI) website, the Cyber Threat Framework “was developed by
               the US Government to enable consistent characterization and categorization of cyber
               threat events, and to identify trends or changes in the activities of cyber adversaries”
               (Office of the Director of National Intelligence, n.d.). However, neither private sector
               threat intelligence companies nor USG information-sharing organizations have adopted
               this framework in their unclassified intelligence products. The Cyber Threat Framework
               is better suited for strategic level reporting about cyber activity and does not provide any
               additional utility when compared to the Cyber Kill Chain and the Diamond Model. The
               model does very little to categorize technical indicators and malware capabilities.

               Andy Piazza, andy.c.piazza@gmail.com
© 2019 The SANS Institute                                                                            Author retains full rights.
ts
ATT&CKing Threat Management 6
gh
Ri
While all three models are used to catalog threat actor activity from incidents and
threat intelligence reporting, none of these models adequately inform decision-makers on
ll
Fu
where to invest in security controls, nor do they educate at the technical level where to
prioritize threat hunt operations. Their ability to enlighten the decision-making process is
ns
limited to the operational level during an incident and does not inform incident
ai
et
responders on where else to look within a network for known TTPs and IOCs. For
rR
example, if a SOC analyst identifies packets as belonging to the Command and Control
(C2) phase for a specific actor by using the Lockheed Martin Cyber Kill Chain™, the
ho
analyst can leverage that model to identify what historic IOCs to search for in previous
ut
stages of the kill-chain. This is beneficial because it can lead to the detection and
,A
mitigation of previously unidentified infections. This model falls short in that it does not
te
provide a taxonomy for the TTPs used by the threat actor and it does not inform the
itu
responders which logs or systems they should look at for further evidence of activity.
st
In
The ATT&CK framework stands apart from previous threat models because it is a
NS
community-based project that consistently matures and evolves to meet the infosec
community’s needs. MITRE’s open-source and cooperative approach works to ensure
SA
that the model has full buy-in from the community that uses it every day. To ensure that
e
the framework remains a collaborative effort, MITRE hosts an annual conference
Th
specifically for practitioners of ATT&CK, known as ATT&CKcon (MITRE, 2018).
19
Continuously developing the framework is a team effort that has led to the April 2019
20
release of a new tactic and hundreds of updates to techniques, actor pages, and minor
editorial modifications (MITRE, 2019). This combination of effectiveness and public
©
support ensures that the model continues to grow.
Additionally, ATT&CK is powerful at all threat levels of intelligence analysis and
reporting, which has led to broad adoption of the model by analysts and vendors alike.
Currently, the best example of using ATT&CK at the three levels of analysis is Palo Alto
Networks’ Unit 42 creation of their open-source project called the Adversary Playbook
(Unit 42, 2019). Unit 42 states that “through observation and data sharing, defenders can
create a custom version of the Adversary's playbook, and then use that playbook to better
defend their network with defensive playbooks” (Unit 42, 2019). When a researcher
initially navigates to an actor profile in the Unit 42 Playbook Viewer, they see a strategic
Andy Piazza, andy.c.piazza@gmail.com
© 2019 The SANS Institute Author retains full rights.ts
ATT&CKing Threat Management 7
gh
Ri
view of actors’ historical campaigns along with an initial description of the actor’s intent
and capability. Clicking on a specific campaign provides an understanding of the actor’s
ll
Fu
activity against a target or set of victims. This campaign view maps the ATT&CK
techniques to the Cyber Kill Chain, providing a step-by-step understanding of the attack’s
ns
progression. Viewing an individual technique presents the researcher with a technical-
ai
et
level view of the IOCs observed with that technique, as well as the appropriate hyperlinks
rR
back to the technique page on the MITRE site, as seen in Figure 2.
ho
ut
,A
te
itu
st
In
NS
SA
Figure 2: Unit 42’s Playbook Viewer (Unit 42 2019)
e
When previous models were released, such as the Diamond Model and Cyber Kill
Th
Chain, some security vendors adopted these models and used them in their platforms and
19
marketing material. These models were primarily implemented in platforms to categorize
20
the data stored in these systems, such as the previously mentioned example of the
Diamond Model being used in the ThreatConnect TIP. In the case of the MITRE
©
ATT&CK framework, vendors use it to assess the defense capabilities that their security
solutions provide to their end customers.
Additionally, MITRE conducts ATT&CK evaluations against vendors that are
willing to undergo third-party testing. These evaluations use the framework to assess the
abilities of security products and services to detect known adversary behavior (MITRE,
2018). For security vendors, the results of these tests serve as bragging rights in
marketing material, such as Carbon Black’s statement that they “demonstrated strong
results that set us apart from the rest of the security products tested” (Carbon Black,
2019). For defenders, these appraisals provide a strategic view of their network’s
Andy Piazza, andy.c.piazza@gmail.com
© 2019 The SANS Institute Author retains full rights.ts
ATT&CKing Threat Management 8
gh
Ri
defensive posture in the form of technique coverage maps. These coverage maps are a
critical component in calculating an enterprise’s defense-in-depth capability. By
ll
Fu
combining each vendor coverage map into the ATT&CK Navigator, which is a free tool
that MITRE hosts for people to create custom ATT&CK maps, organizations can get a
ns
comprehensive view into their defensive capabilities.
ai
et
Research shows that the ATT&CK framework is potent at all three levels of
rR
intelligence analysis. It is generally well received by the infosec community and is
ho
actively embraced by security vendors as a tool to evaluate their products and as a data
ut
model within their tools to categorize threat activity. However, research into the usage of
,A
the ATT&CK framework against large data sets remains underrepresented within
contemporary research. The next sections of this research will address this shortcoming
te
itu
and demonstrate how the model can go beyond merely informing all three levels of
analysis to a state of prioritizing decision-making at those levels.
st
In
NS
3. Research Methodology
SA
This research leveraged the MITRE ATT&CK framework as a quantitative
analysis methodology by focusing on four phases of analysis: Collect, Catalog, Assess,
e
Th
Act (CCAA) – a data processing model that was formerly presented by the author at a
conference in 2017 (Piazza, 2017). This methodology converts data and information into
19
intelligence. To conduct this research, reports were collected from multiple sources,
20
cataloged using ATT&CK, and then the dataset was analyzed to identify trends in the
©
techniques used by threat actors. The Act phase identifies how enterprises can leverage
these findings to improve their network visibility and inform the decision-making
processes within an organization.
In the Collect phase, reports were gathered from twenty-two distinct sources to
replicate the vast amount of data that the average threat intelligence analyst has access to
using free resources. This data included reporting at various levels of maturity- from
thorough Advanced Persistent Threat (APT) campaign reports to short blogs by infosec
researchers. This broad collection effort not only mimics the real collection efforts of an
average threat analyst, but also it ensures that the results are statistically meaningful.
Andy Piazza, andy.c.piazza@gmail.com
© 2019 The SANS Institute Author retains full rights.ts
ATT&CKing Threat Management 9
gh
Ri
The scope of the Collect phase was limited to reports that specifically discussed
threat activity that was directly observed by infosec analysts. The key scoping
ll
Fu
requirement concerning report collection was to gather original analysis and exclude
“analysis of analysis,” such as infosec blog’s discussing other security researchers’
ns
findings. While this scope includes vendor reporting, it excludes academic papers that
ai
et
focus on potential techniques, secondary analysis of another team’s findings that do not
rR
provide additional technical information, and any report that does not include multiple
tactics or techniques.
ho
ut
These reports were then Cataloged using the MITRE ATT&CK framework’s
,A
tactics and techniques, which are identified on the ATT&CK Matrix for Enterprise
website (MITRE, 2019). Using an Airtable relational database, the researcher developed
te
itu
a table with each of the eleven tactics as separate columns with their corresponding
techniques in multiselect fields. An Airtable database was chosen to replicate a threat
st
In
intelligence platform’s (TIP) ability to categorize threat reporting using ATT&CK
NS
without having to procure or develop a system for this research. Additionally, Airtable
enabled the researcher to remain technology agnostic, which leaves room for TIP vendors
SA
and in-house solutions to match this capability in their tools. The Airtable data structure
e
included the following fields:
Th
Field Name Field Type Description
19
Report Date Date Date the report was published
Report Title Short Text Title of the report
20
Report Author Description Author’s name
Report URL Short Text Source URL
©
APT Name Short Text Name of actor, if any
Initial Access Combo box | multi-select Selectable list of techniques
Execution Combo box | multi-select Selectable list of techniques
Persistence Combo box | multi-select Selectable list of techniques
Privilege Escalation Combo box | multi-select Selectable list of techniques
Defense Evasion Combo box | multi-select Selectable list of techniques
Credential Access Combo box | multi-select Selectable list of techniques
Discovery Combo box | multi-select Selectable list of techniques
Lateral Movement Combo box | multi-select Selectable list of techniques
Collection Combo box | multi-select Selectable list of techniques
Exfiltration Combo box | multi-select Selectable list of techniques
Command and Control Combo box | multi-select Selectable list of techniques
Table 1: Database field structure
Andy Piazza, andy.c.piazza@gmail.com
© 2019 The SANS Institute Author retains full rights.ts
ATT&CKing Threat Management 10
gh
Ri
Creating the table structure is tedious work in a traditional database or spreadsheet
since each combo box has anywhere from nine options to over 67 unique values.
ll
Fu
Thankfully, MITRE provides a downloadable Excel file with the ATT&CK framework
mapped by tactic and technique. This prevents analysts from having to manually copy
ns
and paste these values into a database structure or spreadsheet. Figure 3 below
ai
et
demonstrates the download button on the Navigator’s page. The second image is the
rR
downloaded spreadsheet (Figure 4).
ho
ut
,A
te
Figure 3: ATT&CK Navigator Download to Excel Button
itu
st
In
NS
SA
e
Th
Figure 4: Navigator's Downloaded Excel File
19
Airtable’s ability to create drop-down values from imported data is also critical to
20
easily implanting this data model. Users simply create a new base using their “Add a
base” function, select “Import a Spreadsheet” and then paste the Navigator’s export into
©
the “Or paste table data here” field that is in the screenshot on the left. The screenshot on
the right in Figure 5 demonstrates how Airtable interpreted the data during import.
Andy Piazza, andy.c.piazza@gmail.com
© 2019 The SANS Institute Author retains full rights.ts
ATT&CKing Threat Management 11
gh
Ri
ll
Fu
ns
ai
et
rR
ho
Figure 5: Import a Spreadsheet view without (Left) and with data (Right)
ut
,A
After importing the data, the researcher changed each field type to “Multiple
Select,” and Airtable converted the existing values into multiple choice options, as seen
te
in Figure 6. This process was repeated across all of the tactic columns. Once complete, all
itu
of the existing rows of data can be deleted to clear the database, and report cataloging can
st
In
begin. The technique options are available for selection, as seen in Figure 7.
NS
SA
e
Th
19
20
©
Figure 6: Changing Field Properties to Multiple Select
Andy Piazza, andy.c.piazza@gmail.com
© 2019 The SANS Institute Author retains full rights.ts
ATT&CKing Threat Management 12
gh
Ri
ll
Fu
ns
ai
et
rR
Figure 7: Multiple Select Example
ho
Figure 8 below presents the analyst’s view when creating a report in Airtable’s
single-record view with the system’s spreadsheet view in the background. The form view
ut
also includes tracked changes in the Activity pane in the right-hand column. This activity
,A
tracking includes which changes were made along with the user that made the changes.
te
This is beneficial to ensure appropriate change management within teams.
itu
st
In
NS
SA
e
Th
19
20
©
Figure 8: Airtable Form and Table views
Once threat reporting was cataloged using this table structure, spreadsheet
software was leveraged to develop statistics and visualizations during the Assess phase.
For example, Excel’s countif formulas were used to count how many times each
technique was cataloged in the system, and that data was sorted to display the Top 10
most used techniques observed in threat reporting. Cataloging and analysis are critical
elements in developing threat actor playbooks and their corresponding heat maps, which
Andy Piazza, andy.c.piazza@gmail.com
© 2019 The SANS Institute Author retains full rights.ts
ATT&CKing Threat Management 13
gh
Ri
were inspired by Roberto Rodriguez’s work to visualize an organization’s ability to hunt
each ATT&CK technique (Rodriguez, 2017). These heat maps provide a visual
ll
Fu
representation that informs prioritization efforts for detection, monitoring, and threat
hunting efforts during the Act phase. This visualization empowers SOC managers and
ns
security leaders to drive discussions within the Security Operations Center (SOC) for
ai
et
closer monitoring of specific malicious techniques.
rR
ho
4. Analytical Findings
ut
After processing 50 reports, the dataset consists of 122 unique Techniques with
,A
613 total categorizations. This sampling entails the activity from 41 threat actors with
te
incidents going back to 2012. This research led to several interesting findings and some
itu
critical lessons-learned with the potential to shape future analytical methodology
st
developments. This section demonstrates the value in expanding upon this analytical
In
methodology and how this type of report cataloging provides critical insight at the
NS
strategic, operational, and tactical levels of intelligence analysis and decision-making.
SA
Analysis began with an assumption that working through threat reports to catalog
them accurately for each Tactic and Technique was going to be a significant challenge.
e
Th
After all, the ATT&CK framework includes several hundred techniques with varying
levels of technical details available for each. Instead, this research identified that a few
19
threat researchers are already categorizing their threat reports using this model. They
20
often included ATT&CK tables that were already mapped to IOCs and provided specific
©
hunting suggestions, such as search strings and file paths to research, which can be seen
in Figure 9. These mapping tables are immediately actionable by threat analysts and are
the equivalent of an “Executive Summary for Threat Analysts.” They provide a quick
overview of the intrusion, the IOCs of interest, and how other analysts may detect this
activity in their environments. In highly dynamic environments, such as a SOC, the
immediacy of this threat data in a table is instantly applicable to threat analysis
procedures.
Andy Piazza, andy.c.piazza@gmail.com
© 2019 The SANS Institute Author retains full rights.ts
ATT&CKing Threat Management 14
gh
Ri
ll
Fu
ns
ai
et
rR
ho
ut
,A
te
itu
Figure 9: FireEye used ATT&CK in their Triton blog (Miller, Brubaker, Zafra,
st
& Caban, 2019)
In
The system’s usability and applicability extend beyond reports that were
NS
categorized during production by the original analysts. Indeed, the model lends itself to
SA
seamless processing of threat reports that were previously uncategorized. The example in
Figure 10 below demonstrates how intrusion reports are translated using the MITRE
e
Th
ATT&CK techniques within the Airtable ATT&CK Tracker. From the NCCIC report on
the left, it is apparent that this attacker conducted system information discovery, system
19
network configuration discovery, and many other system enumeration techniques that
20
belong in the MITRE Tactic “Discovery.” While they practice using this cataloging
©
system, analysts develop intimacy with the ATT&CK Enterprise Matrix and increase
their speed in processing threat reports. This intimacy with the system not only improves
their threat analysis skills, but also it advances their threat hunting skills as they develop a
Andy Piazza, andy.c.piazza@gmail.com
© 2019 The SANS Institute Author retains full rights.ts
ATT&CKing Threat Management 15
gh
Ri
deeper understanding of how other threat researchers have identified these techniques in
various network environments.
ll
Fu
ns
ai
et
rR
ho
ut
,A
te
Figure 10: ATT&CK Extraction from TA17-117A into the ATT&CK Tracker
itu
(NCCIC, 2017)
st
In addition to the ad-hoc hunting that typically occurs while processing threat
In
reports into a TIP, organizations conduct threat hunts in their environments to identify
NS
previously undetected malicious activity. Carbon Black defines threat hunting as “an
SA
advanced security function that combines a proactive methodology, innovative
technology, highly skilled people, and in-depth threat intelligence to find and stop the
e
Th
malicious, often hard-to-detect activities executed by stealth attackers that automated
defenses may miss before they can execute on their objective” (Carbon Black, n.d.). This
19
research provides a structured methodology to identify specific Techniques for prioritized
20
and in-depth threat hunts, as Carbon Black recommends.
©
This research led to the development of a Top Ten Reported Techniques list that
provides operational level insights into these hunting prioritizations. In Table 2 below,
MITRE Technique T1060, “Registry Run Keys/ Startup Folder,” is the most observed
technique from the sampled reporting. MITRE’s T1060 webpage lists the default registry
keys created by default in Windows and provides multiple examples of threat actors that
have leveraged these keys to establish persistence on a host (MITRE, n.d.).
Implementing a threat hunt for enterprise-wide collection and analysis of registry artifacts
is a logical next-step for organizations conducting this type of analysis. Another method
to identify hunt prioritization includes tracking “first observed” techniques, as these may
Andy Piazza, andy.c.piazza@gmail.com
© 2019 The SANS Institute Author retains full rights.ts
ATT&CKing Threat Management 16
gh
Ri
be emerging threats that are not detectable by current IDS/IPS capabilities. First-
observed mapping requires further research and analysis that is beyond the scope of this
ll
Fu
project.
ns
Rank Technique Count
1 Registry Run Keys / Startup Folder 23
ai
2 Standard Application Layer Protocol 22
et
3 Spearphishing Attachment 21
rR
4 PowerShell 20
5 Commonly Used Port 19
ho
6 Obfuscated Files or Information 19
ut
7 Command-Line Interface 18
8 System Information Discovery 17
9
,A
File and Directory Discovery 15
te
10 Remote File Copy 14
itu
11 Scripting 14
Table 2: Top “Ten” Reported Techniques
st
As part of this research, a notional defense-in-depth (DID) map is presented to
In
demonstrate the strategic value of threat actor capability maps when applied to an
NS
enterprise. The fictitious company Notional Inc. developed a hypothetical enterprise
SA
defense-in-depth map, with a leading Endpoint Detection and Response (EDR) solution,
e
an Intrusion Detection System (IDS), and an email security appliance. Collectively, this
Th
notional security stack provides monitoring coverage for the techniques highlighted in
19
green. Yellow denotes where the existing tools provide enough visibility for threat
20
hunting, but where the organization’s visibility is limited. For example, Notional Inc.’s
IDS can monitor and alert on HTTP traffic, but it is blind to TLS traffic in this notional
©
environment, so the C2 Tactics are labeled yellow.
Andy Piazza, andy.c.piazza@gmail.com
© 2019 The SANS Institute Author retains full rights.ts
ATT&CKing Threat Management 17
gh
Ri
ll
Fu
ns
ai
et
rR
ho
ut
,A
te
itu
st
In
NS
SA
e
Figure 11: Notional Inc.’s Defense-in-Depth Enterprise Security Map
Th
Using the data from this research, Notional Inc. created an actor capability map in
19
the ATT&CK Navigator. Techniques that appeared in twenty or more documents are
20
highlighted grey while those identified within ten to twenty reports are purple. This heat
©
Andy Piazza, andy.c.piazza@gmail.com
© 2019 The SANS Institute Author retains full rights.ts
ATT&CKing Threat Management 18
gh
Ri
map enables organizational leaders to visualize the most active threat actor techniques
and to make educated decisions for prioritization of projects and resources.
ll
Fu
ns
ai
et
rR
ho
ut
,A
te
itu
st
In
NS
Figure 12: Threat Activity Heat Map
At the same time, the threat activity heat map provides a visual representation of
SA
the malicious techniques that require prioritized defense-in-depth considerations within
e
the security stack and prioritized response from a SOC analyst perspective. Organizations
Th
reveal the strategic value of this analysis by overlaying this heat map on top of the
19
defense-in-depth map. This overlay procedure with this researcher’s heat map and the
20
notional enterprise map identifies that the techniques “Registry Run Keys / Startup
©
Folder” (T1060) and “Standard Application Layer Protocol” (T1071) are highly used by
threat actors but are difficult to monitor with the currently deployed toolsets. In fact, the
Notional Inc. enterprise map provides zero coverage for technique “Obfuscated Files or
Information” (T1027) and research shows that it is the sixth most popular technique with
over 19 reports referencing its usage. “Process Discovery” (T1057) and “Custom
Command and Control Protocol” (T1094) are two additional methods that are actively
used by threat actors but are not covered by the Notional Inc.’s security stack.
Andy Piazza, andy.c.piazza@gmail.com
© 2019 The SANS Institute Author retains full rights.ts
ATT&CKing Threat Management 19
gh
Ri
ll
Fu
ns
ai
et
rR
ho
ut
,A
te
Figure 13: Activity Heat Map Overlaid onto Notional Inc.’s Defense-in-Depth
itu
Map (zoomed section for clarity)
st
This simple visual is a byproduct of routine threat management processes (e.g.,
In
intelligence analysts processing reports into a TIP), and yet it has significant implications
NS
for how strategic decision-making is accomplished for resource management. From this
overlay product, the Notional Inc. management team identified multiple strategic,
SA
operational, and tactical level efforts to increase their ability to detect and defend against
e
malicious activity in their environment. At the strategic level, this overlay initiated
Th
research by the Notional Inc.’s security engineering team to identify security capabilities
19
that provide visibility into the techniques “Custom Command and Control Protocol”
20
(T1094), “Obfuscated Files or Information” (T1027), and “Process Discovery” (T1057).
©
At the operational level, SOC managers have instructed their detection and monitoring
teams to prioritize response to EDR alerts concerning techniques “Valid Accounts”
(T1078), “Scripting” (T1064), and “Registry Run Keys / Startup Folder” (T1060). At the
tactical level, the hunt team prioritized threat hunts into “Registry Run Keys / Startup
Folder” (T1060) and “PowerShell” (T1086).
5. Pushing the Research Further
Implementing MITRE ATT&CK as a structured methodology for collecting and
categorizing threat reporting within modern TIPs and analyst platforms extends the
Andy Piazza, andy.c.piazza@gmail.com
© 2019 The SANS Institute Author retains full rights.ts
ATT&CKing Threat Management 20
gh
Ri
applicability of those systems beyond basic threat indicator management. This research
identifies various ways that organizations benefit from implementing MITRE ATT&CK
ll
Fu
within their toolsets, threat management workflows, and decision-making processes.
Moving forward with this method, additional research is required to identify the best data
ns
structure for incorporating this model into a TIP.
ai
et
MITRE’s own Andy Applebaum blogged about his team’s exploration into data
rR
visualization concepts for the ATT&CK framework and how that team developed an
ho
ATT&CK Roadmap (Applebaum, 2019). Their concepts include an actor heat map that
ut
compares APT28 capabilities against APT29, a capability gap matrix, and an adversary
,A
emulation diagram for red teams to use when planning operations. All three of these
proof-of-concept diagrams are worth exploring. Specifically, threat analyst teams would
te
itu
benefit greatly from the actor heat map capability as a built-in function within their TIP,
since the development of these heat maps is quite manual and cumbersome.
st
In
One challenge that this project identified is that it is time-consuming to search
NS
across the various tactic columns to find the appropriate ATT&CK technique. It may
SA
work better to have the full list of values in a single column to search and select from
rather than stacking them under separate tactics. An unwarranted amount of time was
e
lost during research while searching for the appropriate column for each technique.
Th
Future researchers should test multiple data structures for ease-of-use prior to
19
implementation into daily processes.
20
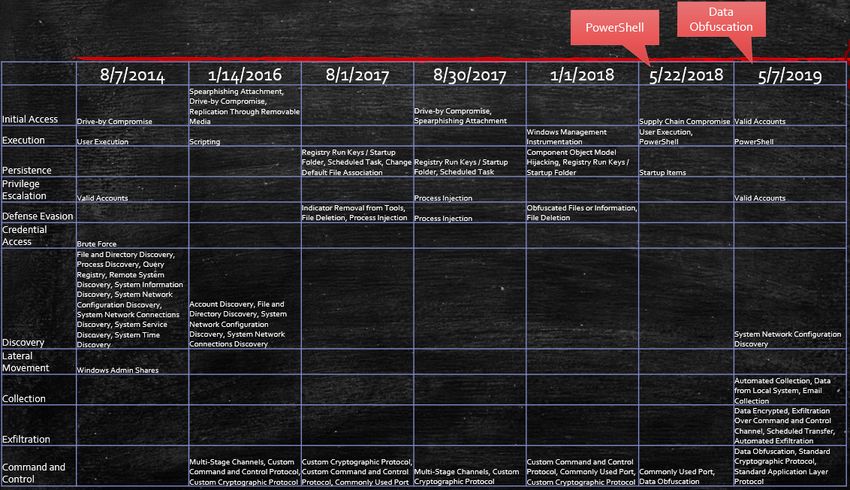
Additionally, the value of this data increases with the size of the dataset.
©
Therefore, further cataloging of threat reports will provide significant insight into the
evolution of threat actor TTPs over time. For example, analysts with a large dataset of
hundreds of incidents could develop actor timelines that visually depict when a specific
threat actor was observed using a new technique. Figure 14 below is an example of how
analysts can visualize an actor’s capabilities over time. It is worth stressing that this is
only a proof-of-concept timeline and that additional research into Turla’s historical
activity is required to accurately develop this model.
Andy Piazza, andy.c.piazza@gmail.com
© 2019 The SANS Institute Author retains full rights.ts
ATT&CKing Threat Management 21
gh
Ri
ll
Fu
ns
ai
et
rR
ho
ut
,A
te
itu
st
Figure 14: EXAMPLE- Turla Timeline
In
Timeline concepts are extendable to include demonstrating how long it takes for a
NS
newly discovered advanced technique to be employed by a threat actor that is assessed to
SA
be low-to-moderately skilled. That specific visualization is useful as it establishes an
adoption lifecycle. Additional data points for that timeline may include when an open-
e
Th
source or commercial exploit kit incorporates new capabilities rendering them more
accessible to low skilled actors.
19
20
Additional development is required surrounding CTI metrics and key
performance indicators (KPI) with regards to the MITRE ATT&CK framework. One
©
suggestion includes tracking changes made to the defense-in-depth coverage within the
enterprise based on threat intelligence analysis and hunting results. Gert-Jan Bruggink
provided useful insight into developing metrics and KPIs in his “GJ’s Cheat Sheet for
Cyber Threat Intelligence Metrics” (Bruggink, 2019). Tracking changes to the
environment based on this structured methodology aligns with his consideration for
classifying a metric as higher value or lower value based on “qualitative review of
existing metrics and quantitative tracking through a maturity model” (Bruggink, 2019).
Andy Piazza, andy.c.piazza@gmail.com
© 2019 The SANS Institute Author retains full rights.ts
ATT&CKing Threat Management 22
gh
Ri
ll
Fu
ns
ai
et
rR
ho
ut
,A
te
itu
st
Figure 15: “GJ’s Cheat Sheet for Cyber Threat Intelligence
Metrics (May 2019)” (Bruggink, 2019)
In
NS
The last area identified for further research and development is the ATT&CK
Matrix itself. The MITRE team is doing an outstanding job coordinating inputs from the
SA
community to add new capabilities, descriptions, and actor correlations. However, it is
e
time for this information security community to contribute additional details to the
Th
technique pages on how to explicitly detect, hunt, and mitigate these malicious
19
capabilities. Care must be taken to explain how to assess large datasets and how to
20
remove false positives. Current threat hunting blogs and conferences serve as amazing
resources for new threat hunters, but they are spread to the far corners of the internet.
©
Having direct links from the ATT&CK technique pages to specific training will go a long
way to increase the adoption of the framework.
6. Conclusion
Information security and cyber threat intelligence are highly demanding career
fields with new technologies, capabilities, and malicious actors emerging into the market
at a regular pace. Structured analytical methodologies, data models, and intelligence
frameworks are critical components of effective intelligence programs. These program
elements ensure that threat analysis focuses on providing timely, accurate, and contextual
Andy Piazza, andy.c.piazza@gmail.com
© 2019 The SANS Institute Author retains full rights.ts
ATT&CKing Threat Management 23
gh
Ri
products at the strategic, operational, and tactical levels of the decision-making hierarchy.
This paper demonstrated the effectiveness of the MITRE ATT&CK framework at each of
ll
Fu
those levels.
ns
Leveraging a structured analytical method to collect and catalog threat
ai
intelligence reports and cyber incidents within an analyst platform extends the utility of
et
that data beyond the value of individual events. Essentially, the ATT&CK techniques
rR
become a metadata layer that turns a collection of reporting into a dataset that can be
ho
analyzed and acted upon independently of the contents of the reports themselves. This
ut
data modeling provides analysts with the ability to conduct trends analysis based on
,A
specific threat actors and emerging capabilities. It elevates their daily workstreams
beyond the monotonous routine of endlessly reviewing threat feeds and pumping IOCs
te
itu
into the environment.
st
This research project adds to a remarkable canon of existing ATT&CK projects
In
while remaining fresh and unique in perspective. The information security community
NS
will continue to push this framework forward and explore new use-cases for this model.
SA
Implementing this model into additional analyst platforms, security tools, and business
processes will enable intelligence-based decision making at all levels of organizations
e
that adopt this structured methodology. This project demonstrated how the MITRE
Th
Adversarial Tactics Techniques & Common Knowledge (ATT&CK) framework
19
functions as a quantitative data model to prioritize resource management and security
20
engineering efforts, inform computer network defense and incident response procedures,
©
and guide technical threat hunts while informing decision makers at all three levels of
analysis.
Andy Piazza, andy.c.piazza@gmail.com
© 2019 The SANS Institute Author retains full rights.ts
ATT&CKing Threat Management 24
gh
Ri
ll
Fu
References
ns
Airtable. (2019). Airtable. Retrieved from Airtable: https://airtable.com/
ai
Applebaum, A. (2019, March 4). Visualizing ATT&CK. Retrieved from Medium:
et
https://medium.com/mitre-attack/visualizing-attack-f5e1766b42a6
rR
Bowen, P., Chew, E., & Hash, J. (2007). Information Security Guide for Government
ho
Executives. Gaithersburg: National Institute of Standards and Technology.
ut
Retrieved from
,A
https://csrc.nist.gov/CSRC/media/Publications/nistir/7359/final/documen
te
ts/CSD_ExecGuide-booklet.pdf
itu
Bruggink, G.-J. B. (2019, May 9). GJ’s Cheat Sheet for Cyber Threat Intelligence Metrics.
st
Retrieved from Twitter:
In
https://twitter.com/gertjanbruggink/status/1126434409383714816
NS
Caltagirone, S., Pendergast, A., & Betz, C. (2013). The Diamond Model of Intrusion
SA
Analysis. Hanover: Center for Cyber Intelligence Analysis and Threat
Research.
e
Carbon Black. (2019). Carbon Black Outperforms All Other EDR Solutions in MITRE
Th
ATT&CK™ Evaluation. Retrieved from Carbon Black:
19
https://www.carbonblack.com/why-cb/certifications-public-testing/mitre-
20
attack-matrix/
©
Carbon Black. (n.d.). What is Cyber Threat Hunting. Retrieved from Carbon Black:
https://www.carbonblack.com/resources/definitions/what-is-cyber-threat-
hunting/
Carreon, C. (2018, July 25). Applying Threat Intelligence to the Diamond Model for
Intrusion Analysis. Retrieved from Recorded Future:
https://www.recordedfuture.com/diamond-model-intrusion-analysis/
Gourley, B. (2018, March 19). Security Intelligence at the Strategic, Operational and
Tactical Levels. Retrieved from SecurityIntelligence:
Andy Piazza, andy.c.piazza@gmail.com
© 2019 The SANS Institute Author retains full rights.ts
ATT&CKing Threat Management 25
gh
Ri
https://securityintelligence.com/security-intelligence-at-the-strategic-
operational-and-tactical-levels/
ll
Fu
Lockheed Martin. (n.d.). The Cyber Kill Chain. Retrieved from Lockheed Martin:
https://www.lockheedmartin.com/en-us/capabilities/cyber/cyber-kill-
ns
chain.html
ai
et
Miller, S., Brubaker, N., Zafra, D. K., & Caban, D. (2019, April 10). TRITON Actor TTP
rR
Profile, Custom Attack Tools, Detections, and ATT&CK Mapping. Retrieved
ho
from FireEye: https://www.fireeye.com/blog/threat-
research/2019/04/triton-actor-ttp-profile-custom-attack-tools-
ut
,A
detections.html
MITRE. (2018). ATT&CK Evaluations. Retrieved from ATT&CK Evaluations:
te
itu
https://attackevals.mitre.org/
MITRE. (2018). MITRE ATT&CK Navigator. Retrieved from GitHub :
st
In
https://mitre.github.io/attack-navigator/enterprise/
NS
MITRE. (2018). MITRE ATT&CKcon. Retrieved from MITRE:
https://www.mitre.org/news/corporate-events/mitre-attckcon
SA
MITRE. (2019, May). CTI/Enterprise-Attack. Retrieved from GitHub:
e
https://github.com/mitre/cti/tree/master/enterprise-attack
Th
MITRE. (2019). MITRE ATT&CK. Retrieved from MITRE: https://attack.mitre.org/
19
MITRE. (2019, April). Updates - April 2019. Retrieved from MITRE ATT&CK:
20
https://attack.mitre.org/resources/updates/
©
MITRE. (n.d.). T1060: Registry Run Keys / Startup Folder. Retrieved from MITRE
ATT&CK: https://attack.mitre.org/techniques/T1060/
NCCIC. (2017). AR-17-20045: Enhanced Analysis of GRIZZLY STEPPE. Washington DC:
DHS.
NCCIC. (2017, April 27). TA17-117A: Intrusions Affecting Multiple Victims Across
Multiple Sectors. Retrieved from US-CERT: https://www.us-
cert.gov/ncas/alerts/TA17-117A
Office of the Director of National Intelligence. (n.d.). Cyber Threat Framework.
Retrieved from Office of the Director of National Intelligence:
https://www.dni.gov/index.php/cyber-threat-framework
Andy Piazza, andy.c.piazza@gmail.com
© 2019 The SANS Institute Author retains full rights.ts
ATT&CKing Threat Management 26
gh
Ri
Piazza, A. (2017, October 6). SlideShare. Retrieved from Putting the Human Back in
the Loop for Analysis: https://www.slideshare.net/AndyPiazza/putting-the-
ll
Fu
human-back-in-the-loop-for-analysis
Rodriguez, R. (2017, July 17). How Hot is Your Hunt Team. Retrieved from Cyber
ns
Wardog Lab: https://cyberwardog.blogspot.com/2017/07/how-hot-is-your-
ai
et
hunt-team.html
rR
ThreatConnect. (n.d.). Andrew Pendergast: Vice President of Product. Retrieved from
ho
ThreatConnect: https://threatconnect.com/team/andrew-pendergast/
ThreatConnect. (n.d.). The Diamond Model for Intrusion Analysis. Retrieved from
ut
,A
ThreatConnect: https://threatconnect.com/resource/the-diamond-model-
for-intrusion-analysis/
te
itu
Tilbury, C. (2019, May 7). Finding Registry Malware Persistence with RECmd.
Retrieved from SANS Digital Forensics and Incident Response Blog:
st
In
https://digital-forensics.sans.org/blog/2019/05/07/malware-persistence-
NS
recmd
Unit 42. (2019, February 20). PAN-unit 42 Playbook Viewer. Retrieved from GitHub:
SA
https://github.com/pan-unit42/playbook_viewer
e
Zimmerman, E. (2019). RECmd. Retrieved from GitHub:
Th
https://github.com/EricZimmerman/RECmd
19
20
Figures
©
Figure 1: Enterprise Matrix with Tactics, Techniques, and Procedures ............................ 4
Figure 2: Unit 42’s Playbook Viewer (Unit 42 2019) ................................................................. 7
Figure 3: ATT&CK Navigator Download to Excel Button .......................................................10
Figure 4: Navigator's Downloaded Excel File ..............................................................................10
Figure 5: Import a Spreadsheet view without (Left) and with data (Right) ..................11
Figure 6: Changing Field Properties to Multiple Select ...........................................................11
Figure 7: Multiple Select Example ....................................................................................................12
Andy Piazza, andy.c.piazza@gmail.com
© 2019 The SANS Institute Author retains full rights.ts
ATT&CKing Threat Management 27
gh
Ri
Figure 8: Airtable Form and Table views ......................................................................................12
ll
Figure 9: FireEye used ATT&CK in their Triton blog (Miller, Brubaker, Zafra, &
Fu
Caban, 2019) ..............................................................................................................................................14
ns
Figure 10: ATT&CK Extraction from TA-117A into the ATT&CK Tracker (NCCIC,
ai
et
2017) .............................................................................................................................................................15
rR
Figure 11: Notional Inc.’s Defense-in-Depth Enterprise Security Map ............................17
ho
Figure 12: Threat Activity Heat Map ...............................................................................................18
ut
,A
Figure 13: Activity Heat Map Overlaid onto Notional Inc.’s Defense-in-Depth Map
te
(zoomed section for clarity)................................................................................................................19
itu
Figure 14: EXAMPLE- Turla Timeline .............................................................................................21
st
In
Figure 15: “GJ’s Cheat Sheet for Cyber Threat Intelligence Metrics (May 2019)”
NS
(Bruggink, 2019) ......................................................................................................................................22
SA
e
Th
Tables
19
Table 1: Database field structure ......................................................................................... 9
20
Table 2: Top “Ten” Reported Techniques ......................................................................... 16
©
Andy Piazza, andy.c.piazza@gmail.com
© 2019 The SANS Institute Author retains full rights.ts
ATT&CKing Threat Management 28
gh
Ri
Appendix
Calculating Technique Prevalence
ll
Fu
1. Export the cataloged data from Airtable.
ns
ai
et
rR
ho
ut
,A
2. Open in Microsoft Excel and save a working copy as an .XLSX extension,
since .CSV does not support formatting and calculations.
te
itu
3. Create a new blank worksheet in this file titled “Technique Count.”
4. In a separate window, download the ATT&CK Navigator table to CSV.
st
In
NS
SA
5. Manually copy and paste each column of techniques from the Navigator data
and paste them in a single column within the new “Technique Count”
e
Th
worksheet that was created in step 3, above.
19
20
©
6. Close the ATT&CK Navigator CSV.
7. In the “Technique Count” spreadsheet, insert a new column to the left of the
Techniques column and name it “Rank.”
Andy Piazza, andy.c.piazza@gmail.com
© 2019 The SANS Institute Author retains full rights.ts
ATT&CKing Threat Management 29
gh
Ri
8. Insert a column to the right of the Techniques column and name it “Count.”
9. Select all three columns and all rows of data and click Format as Table.
ll
Fu
a. Note: do not select the entire worksheet.
ns
ai
et
rR
ho
ut
,A
te
10. In cell C2, which should be the first blank cell under “Count” column header,
itu
insert the formula:
st
In
=COUNTIF('Reports-Grid view'!G:Q,"*"& B2 &"*")
NS
a. “Reports-Grid view” is the name of the worksheet where the
SA
exported Airtable data resides.
b. This formula tells Excel to count every time the technique listed in
e
the Technique column (B2) of this worksheet is found in the data on
Th
the reports table’s columns G through Q (Reports-Grid view'!G:Q).
19
c. Since the data is formatted as a table, Excel will auto-extend the
20
formula for the rest of the calculations.
©
11. Sort column C to show the highest count on top.
12. Enter a 1-10 ranking in the “Rank” column to generate the Top Ten
Techniques list.
Andy Piazza, andy.c.piazza@gmail.com
© 2019 The SANS Institute Author retains full rights.Last Updated: January 4th, 2021
Upcoming SANS Forensics Training
SANS Security East 2021 , Jan 11, 2021 - Jan 16, 2021 CyberCon
SANS Threat Hunting Europe 2021 , United Kingdom Jan 11, 2021 - Jan 16, 2021 CyberCon
SANS Tokyo January 2021 Tokyo, Japan Jan 18, 2021 - Jan 23, 2021 CyberCon
SANS Security Fundamentals 2021 , Netherlands Jan 18, 2021 - Jan 29, 2021 CyberCon
SANS Cyber Security Central: Jan 2021 , Jan 18, 2021 - Jan 23, 2021 CyberCon
Cyber Threat Intelligence Summit & Training 2021 Virtual - US Eastern, Jan 21, 2021 - Feb 01, 2021 CyberCon
SANS Amsterdam January 2021 , Netherlands Jan 25, 2021 - Jan 30, 2021 CyberCon
SANS DFIR Europe Multi-Week 2021 , Netherlands Feb 01, 2021 - Feb 12, 2021 CyberCon
SANS Cyber Security West: Feb 2021 , Feb 01, 2021 - Feb 06, 2021 CyberCon
SANS South by Southeast Asia 2021 , Singapore Feb 01, 2021 - Feb 06, 2021 CyberCon
Open-Source Intelligence Summit & Training 2021 Virtual - US Eastern, Feb 08, 2021 - Feb 23, 2021 CyberCon
SANS Essentials Australia 2021 - Live Online , Australia Feb 15, 2021 - Feb 20, 2021 CyberCon
SANS Essentials Australia 2021 Melbourne, Australia Feb 15, 2021 - Feb 20, 2021 Live Event
SANS Scottsdale: Virtual Edition 2021 , Feb 22, 2021 - Feb 27, 2021 CyberCon
SANS Secure Japan 2021 , Japan Feb 22, 2021 - Mar 13, 2021 CyberCon
SANS London February 2021 , United Kingdom Feb 22, 2021 - Feb 27, 2021 CyberCon
SANS Cyber Security East: March 2021 , Mar 01, 2021 - Mar 06, 2021 CyberCon
SANS Secure Asia Pacific 2021 , Singapore Mar 08, 2021 - Mar 20, 2021 CyberCon
SANS Paris March 2021 , France Mar 08, 2021 - Mar 13, 2021 CyberCon
SANS Secure Asia Pacific 2021 Singapore, Singapore Mar 08, 2021 - Mar 20, 2021 Live Event
SANS Forensics Middle East March 2021 , United Arab Emirates Mar 13, 2021 - Mar 18, 2021 CyberCon
SANS Cyber Security West: March 2021 , Mar 15, 2021 - Mar 20, 2021 CyberCon
SANS Riyadh March 2021 , Kingdom Of Saudi Mar 20, 2021 - Apr 01, 2021 CyberCon
Arabia
SANS Secure Australia 2021 Canberra, Australia Mar 22, 2021 - Mar 27, 2021 Live Event
SANS 2021 , Mar 22, 2021 - Mar 27, 2021 CyberCon
SANS Secure Australia 2021 Live Online , Australia Mar 22, 2021 - Mar 27, 2021 CyberCon
SANS Munich March 2021 , Germany Mar 22, 2021 - Mar 27, 2021 CyberCon
SANS Cyber Security Mountain: April 2021 , Apr 05, 2021 - Apr 10, 2021 CyberCon
SANS Autumn Australia 2021 - Live Online , Australia Apr 12, 2021 - Apr 17, 2021 CyberCon
SANS Cyber Security East: April 2021 , Apr 12, 2021 - Apr 17, 2021 CyberCon
SANS London April 2021 , United Kingdom Apr 12, 2021 - Apr 17, 2021 CyberConYou can also read