The Landscape of R Packages for Automated Exploratory Data Analysis - arXiv
←
→
Page content transcription
If your browser does not render page correctly, please read the page content below
C ONTRIBUTED RESEARCH ARTICLE                                                                                          1

                                                     The Landscape of R Packages for
                                                     Automated Exploratory Data Analysis
                                                     by Mateusz Staniak and Przemysław Biecek

                                                     Abstract The increasing availability of large but noisy data sets with a large number of heterogeneous
                                                     variables leads to the increasing interest in the automation of common tasks for data analysis. The
                                                     most time-consuming part of this process is the Exploratory Data Analysis, crucial for better domain
                                                     understanding, data cleaning, data validation, and feature engineering.
                                                         There is a growing number of libraries that attempt to automate some of the typical Exploratory
                                                     Data Analysis tasks to make the search for new insights easier and faster. In this paper, we present a
                                                     systematic review of existing tools for Automated Exploratory Data Analysis (autoEDA). We explore
                                                     the features of twelve popular R packages to identify the parts of analysis that can be effectively
                                                     automated with the current tools and to point out new directions for further autoEDA development.
arXiv:1904.02101v1 [stat.CO] 27 Mar 2019

                                                     Introduction
                                                     With the advent of tools for automated model training (autoML), building predictive models is
                                                     becoming easier, more accessible and faster than ever. Tools for R such as mlrMBO (Bischl et al., 2017),
                                                     parsnip (Kuhn and Vaughan, 2019); tools for python such as TPOT (Olson et al., 2016), auto-sklearn
                                                     (Feurer et al., 2015), autoKeras (Jin et al., 2018) or tools for other languages such as H2O Driverless AI
                                                     (H2O.ai, 2019; Cook, 2016) and autoWeka (Kotthoff et al., 2017) supports fully- or semi-automated
                                                     feature engineering and selection, model tuning and training of high-performing models.
                                                         Yet, model building is always preceded by a phase of understanding the problem, understanding
                                                     of a domain and exploration of a data set. Usually, in the process of the data analysis much more
                                                     time is spent on data preparation and exploration than on model tuning. This is why the current
                                                     bottleneck in data analysis is in the EDA phase. Recently, a number of tools were developed to
                                                     automate or speed up the part of the summarizing data and discovering patterns. Since the process
                                                     of building predictive models automatically is referred to as autoML, we will dub the automation of
                                                     data exploration autoEDA. The surge in interest in autoEDA tools1 is evident in the Figure 1. Table 1
                                                     describes the popularity of autoEDA tools measured as the number of downloads from CRAN and
                                                     usage statistics from Github2 .
                                                         There is an abundance of R libraries that provide functions for both graphical and descriptive data
                                                     exploration. Here, we restrict our attention to packages that aim to automatize or significantly speed
                                                     up the process of exploratory data analysis for tabular data. Such tools usually work with full data
                                                     frames, which are processed in an automatic or semi-automatic manner, for example by guessing data
                                                     types and dropping variables that do not satisfy some criteria and return summary tables, groups of
                                                     plots or full reports.
                                                         This paper has two main goals. Firstly, to characterize existing R tools for automated exploratory
                                                     data analysis and their range of capabilities. To our best knowledge, this is first such a review.
                                                     Previously, a smaller comparison of seven packages was done in Putatunda et al. (2019). Secondly,
                                                     based on this summary, to identify areas, where automated data exploration could be improved. In
                                                     particular, we are interested in gauging the potential of AI-assisted EDA tools.
                                                         The first goal is addressed in Sections 2.2 R packages for automated EDA and 2.3 Feature comparison
                                                     where we first briefly describe each package and the compare, how are different EDA tasks are tackled
                                                     by these packages. Then, in Section 2.4 Summary, we compile a list of strong and weak points of the
                                                     automated EDA software and detail some open problems.

                                                     The tasks of Exploratory Data Analysis

                                                     The CRISP-DM standard (Wirth, 2000) lists the following phases of a data mining project:

                                                        1. Business understanding.
                                                        2. Data understanding.
                                                        3. Data preparation.
                                                        4. Modeling.
                                                        1 Access   the raw data with archivist::aread("mstaniak/autoEDA-resources/autoEDA-paper/52ec")
                                                        2 Access   the raw data with archivist::aread("mstaniak/autoEDA-resources/autoEDA-paper/006d")

                                                     The R Journal Vol. XX/YY, AAAA 20ZZ                                                    ISSN 2073-4859
C ONTRIBUTED RESEARCH ARTICLE                                                                                          2

                           Total number of package downloads
                           Based on CRAN statistics
              60,000
                                                                                          summarytools (58365)
                                                                                          DataExplorer (57762)
                                                                                          visdat (47334)
              40,000                                                                      funModeling (42079)
                                                                                          arsenal (30879)
                                                                                          dataMaid (17365)
              20,000                                                                      RtutoR (8804)
                                                                                          dlookr (8270)
                                                                                          exploreR (6644)

                       0                                                                  xray (5361)

                           2015      2016       2017        2018        2019              SmartEDA (3339)

          Figure 1: Trends in number of downloads of autoEDA packages available on CRAN since the first
          release. Data was gathered on 26.03.2019 with the help of the cranlogs package (Csardi, 2015).

             5. Evaluation.
             6. Deployment.
          Automated EDA tools aim to make the Data understanding phase as fast and as easy as possible.
          This part of a project can be further divided into smaller tasks. These include a description of a
          dataset, data exploration, and data quality verification. All these tasks can be achieved both by
          providing descriptive statistics and numerical summaries and by visual means. AutoEDA packages
          provide functions to deal with these challenges. Some of them are also concerned with simple feature
          engineering and data cleaning. Both these tasks belong in the Data preparation phase, which precedes
          and supports the model building phase. Let us notice that business understanding is affected by the
          data understanding, which makes this part of the analysis especially important.
              Goals of autoEDA tools are summarized in Table 2. The Phase and Tasks columns are taken
          from the CRISP-DM standard, while Type and Examples columns provide examples based on current
          functionalities of autEDA packages. Each task should be summarized in a report, which makes
          reporting another relevant problem of autoEDA. Uni- and bivariate data exploration is a part of
          the analysis that is most thoroughly covered by the existing autoEDA tools. The form of univariate
          summaries depends on the variable type. For numerical variables, most packages provide descriptive
          statistics such as centrality and dispersion measures. For categorical data, unique levels and associated
          counts are reported. Bivariate relationships descriptions display either dependency between one
          variable of interest and all other variables, which includes contingency tables, scatter plots, survival
          curves, plots of distribution by values of a variable (histograms, bar plots, box plots), or between all
          pairs of variables (correlation matrices and plots), or chosen pairs of variables.

          R packages for automated EDA
          In this section, twelve R libraries are shortly summarized. One of them is only available on GitHub
          (autoEDA), other packages are CRAN-based. The list is not exhaustive, but these are the most matured
          general-purpose packages. There are other libraries that are either restricted to one area of application,
          like the RBioPlot (Zhang and Storey, 2016) package for biomolecular data or ExPanDaR Gassen (2018)
          for panel data; designed for one specific task, for example creating tables, some of these packages
          are briefly discussed in Section 2.2.13; or not mature enough. The exact versions of packages that
          were used to create examples can be found in the reference. All examples are based on a subset
          of typical_data3 dataset from visdat package. Whenever possible, archivist (Biecek and Kosinski,
          2017) hooks are provided for easy access to the presented objects. When a function call only gives
          side-effects, a link is provided to the full result (PDF/PNG files). Tables were prepared with the xtable
          package (Dahl et al., 2018).
            3 Access   the data with archivist::aread("mstaniak/autoEDA-resources/autoEDA-paper/278c7")

          The R Journal Vol. XX/YY, AAAA 20ZZ                                                    ISSN 2073-4859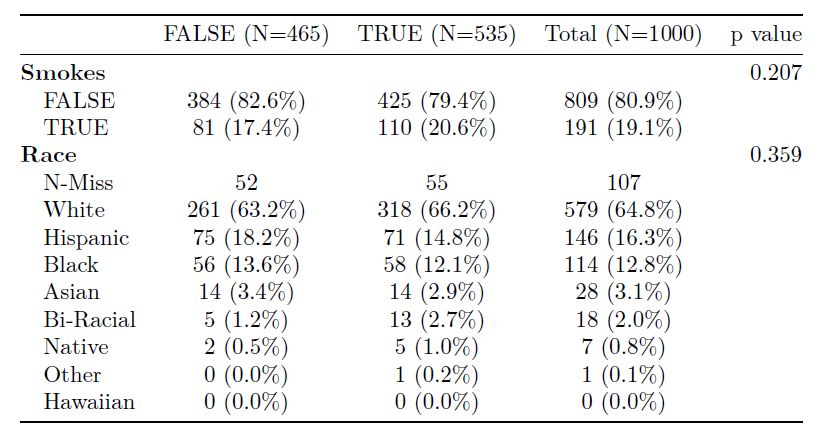
C ONTRIBUTED RESEARCH ARTICLE                                                                                            3

                                             CRAN                             GitHub
             package            downl.         debut         age stars commits contrib. issues forks
             summarytools         58365    2014-08-11     4y 7m      212          854          5       65      28
             DataExplorer         57762    2016-03-01         3y     212          186          2      112      37
             visdat               47334    2017-07-11     1y 8m      258          403         11      115      31
             funModeling          42079    2016-02-07     3y 1m       52          125          2       12      15
             arsenal              30879    2016-12-30     2y 2m       33          592          3      198       2
             dataMaid             17365    2017-01-02     2y 2m       62          468          2       43      18
             RtutoR                8804    2016-03-12         3y      12            7          1        4       8
             dlookr                8270    2018-04-27       10m       25           53          3        6      11
             exploreR              6644    2016-02-10     3y 1m        0            1          1        0       0
             xray                  5361    2017-11-22     1y 4m       61           33          4       10       5
             SmartEDA              3339    2018-04-06       11m        2            3          1        1       2
             autoEDA                  -             -          -      35           17          1        2       5

          Table 1: Popularity of R packages for autoEDA among users and package developers. First two
          columns summarise CRAN statistics, last five columns summarise package development at GitHub.
          When a repository owned by the author is not available, the data were collected from a CRAN mirror
          repository. Data was gathered on 26.03.2019.

                    Phase                      Task                        Type                    Examples
                                                                    dimensions                variables number
                                        Data description              variables                 variable type
                                                                      meta-data                  size in RAM
                                                                   invalid values                    typos
           Data understanding             Data validity           missing values                   NA count
                                                                  atypical values                   outliers
                                                                      univariate                  histogram
                                        Data exploration               bivariate                  scatter plot
                                                                    multivaraite             Parallel coord. plot
                                                                     Imputation                 Impute mean
                                          Data cleaning
                                                                 Outlier treatment             Impute median
                                                                Dimension reduction                   PCA
             Data preparation
                                                                                             Merge rare factors
                                       Derived attributes             Categorical
                                                                                                    Binning
                                                                      Continuous             Box-Cox transform

          Table 2: Early phases of data mining project according to CRISP-DM standard, their specific goals and
          examples of how they are aided by autoEDA tools. (Wirth, 2000)

          The dataMaid package

          The dataMaid (Petersen and Ekstrom, 2018) package has two central functions: the check function,
          which performs checks of data consistency and validity, and summarize, which summarizes each
          column. Another fmakeDataReport, which automatically creates a report in PDF, DOCX or HTML
          format. The goal is to detect missing and unusual - outlying or incorrectly encoded - values. The
          report contains whole dataset summary: variables and their types, number of missing values and if a
          problem was detected and univariate summaries in the form of descriptive statistics, histograms/bar
          plots and an indication of possible problems.
              User-defined checks and summaries can be also included in the analysis. The vignette Extending
          dataMaid explains how to define them. It is also possible to customize the report, in particular, it can
          only present variables with identified issued. An example report4 can be found in Figure 2.

          The xray package

          The xray (Seibelt, 2017) package has three functions for the analysis of data prior to statistical modeling:
             4 Find the full report at https://github.com/mstaniak/autoEDA-resources/blob/master/autoEDA-paper/

          plots/dataMaid/dataMaid_report.pdf

          The R Journal Vol. XX/YY, AAAA 20ZZ                                                      ISSN 2073-4859
C ONTRIBUTED RESEARCH ARTICLE 4
Figure 2: Two pages from a data validity report generated using the dataMaid::makeDataReport
function (dataMaid v. 1.2). Atypical values are listed under the variable summary.
1. detecting anomalies: missing data, zero values, blank strings, and infinite numbers (anomalies
function),
2. drawing and printing univariate distributions of each variable through histograms, bar plots
and quantile tables (distributions),
3. drawing plots of variables over time for a specified time variable (timebased).
Examples are presented in the readme file in the GitHub repository of the project (https://github.
com/sicarul/xray), but no vignette is attached to it. Plots5 generated by the package are presented in
Figure 3.
The visdat package
The package visdat (Tierney, 2017) is maintained by rOpenSci. It consists of six functions that help
visualize:
5 Access the associated table with archivist::aread("mstaniak/autoEDA-resources/autoEDA-paper/a3a3")
Bar Chart of Smokes Bar Chart of Age
NA
Others
35
Smokes
TRUE 33
Age
32
29
27
FALSE 26
23
22
21
0
0
0
0
0
0
0
0
0
20
40
60
80
10
20
30
Rows Rows
Bar Chart of Died Bar Chart of Race
NA
White
TRUE Other
Race
Died
Native
Hispanic
FALSE Black
Bi−Racial
Asian
0
0
0
0
0
0
0
20
40
20
40
60
Rows Rows
Figure 3: Example output from the xray::distributions function (xray v. 0.2). Such plots are created
for each variable in the dataset along with a table of descriptive statistics.
The R Journal Vol. XX/YY, AAAA 20ZZ ISSN 2073-4859C ONTRIBUTED RESEARCH ARTICLE 5
)
m
es
e
t(c
e
m
d
e
x
ok
ac
IQ
ID
ie
Se
Ag
co
gh
Sm
D
R
In
ei
0
H
250 Type
Observations
character
double
500
integer
logical
750 NA
1000
Figure 4: Example output of the visdat::vis_guess function (visdat 0.5.3), which displays types of
each value in the data frame and the missing values. We can see that the Age variable consists of
integer values, even though it is coded as a character.
1. variables types and missing data (vis_dat function),
2. types of each value in each column (vis_guess),
3. clusters of missing values (vis_miss),
4. differences between the two datasets (vis_compare),
5. where given conditions are satisfied in the data (vis_expect),
6. correlation matrix for the numerical variables (vis_cor).
Each of these functions returns a single ggplot2 (Wickham, 2016) plot that shows a rectangular
representation of the dataset where the expected information is denoted by colors. An example of this
visualization6 can be seen in Figure 4.
The package includes a vignette Using visdat that provides examples for all package options.
Interestingly, it is the only packages that use solely visual means of exploring the data.
The dlookr package
The dlookr (Ryu, 2019) package provides tools for 3 types of analysis: data diagnosis including
correctness, missing values, and outlier detection, exploratory data analysis, and feature engineering:
imputation, dichotomization, and transformation of continuous features. It can also automatically
generate a PDF report for all these analyses.
For data diagnosis, types of variables are reported along with counts of missing values and unique
values. Variables with a low proportion of unique values are described separately. All the typical
descriptive statistics are provided for each variable. Outliers are detected and distributions of variables
before and after outlier removal are plotted. Both missing values and outliers can be treated using
impute_na and impute_outlier functions.
In the EDA report, descriptive statistics are presented along with normality tests, histograms of
variables and their transformations that reduce skewness: logarithm and root square. Correlation plots
are shown for numerical variables. If the target variable is specified, plots that show the relationship
between the target and each predictor are also included.
Transformation report compares descriptive statistics and plots for each variable before and after
imputation, skewness-removing transformation and binning. If the right transformation is found
6 Access the plot object with archivist::aread("mstaniak/autoEDA-resources/autoEDA-paper/3cfd")
The R Journal Vol. XX/YY, AAAA 20ZZ ISSN 2073-4859C ONTRIBUTED RESEARCH ARTICLE 6
Figure 5: Two pages from a report generated by the dlookr::eda_report function (dlookr v. 0.3.8).
First, the dataset is summarized, than each variable is described. Optionally, plots of bivariate
relationships can be added.
among the candidate transformations, it can be applied to the feature through one of the binning,
binning_by, transform functions.
Every operation or summary presented in the reports can be also performed manually. A dedicated
vignette explains each of the main functionalities (Data quality diagnosis, Data Transformation, Exploratory
Data Analysis vignettes). An example7 taken from one of the reports can be found in Figure 5.
The DataExplorer package
DataExplorer (Cui, 2018) is a recent package that helps automatize EDA and simple feature engineer-
ing. It provides functions for:
1. whole dataset summary: dimensions, types of variables, missing values etc (introduce and
plot_intro functions),
2. missing values visualization as missing fraction per column and analysis (plot_missing and
profile_missing),
3. plotting distributions of variables, separately numerical and categorical (plot_histogram and
plot_bar),
4. QQ Plots (plot_qq),
5. plotting correlation matrices (plot_correlation function),
6. visualizing PCA results by plotting percentage of explained variance and correlations with each
original feature for every principal component (plot_prcomp),
7. plotting relationships between the target variable and predictors - scatterplots and boxplots
(plot_scatterplot and plot_boxplot functions),
8. replacing missing values by a constant (set_missing),
9. grouping sparse categories (group_category),
10. creating dummy variables and dropping features (dummify, drop_features).
The create_report function generates a report. By default, it consists of all the above points except
for feature engineering and it can be further customized. An introductory vignette Introduction to
DataExplorer that showcases all the functionalities is included in the package. It is noticeable that the
7 Access the full report at https://github.com/mstaniak/autoEDA-resources/blob/master/autoEDA-paper/
plots/dlookr/dlookr_eda.pdf
The R Journal Vol. XX/YY, AAAA 20ZZ ISSN 2073-4859C ONTRIBUTED RESEARCH ARTICLE 7
Figure 6: A visualization of PCA results - correlation with original variables for each principal
component - and a wall of bar plots taken from a report generated by the DataExplorer::create_report
function (DataExplorer v. 0.7).
package almost entirely relies on visual techniques. Plots taken from an example report8 are presented
in Figure 6.
The funModeling package
The package funModeling (Casas, 2019) is a rich set of tools for EDA connected to the book Casas
(2018). These tools include
1. dataset summary (df_status function),
2. plots and descriptive statistics for categorical and numerical variables (plot_num, profiling_num
and freq),
3. classical and information theory-based correlation analysis for target variable vs other variables
- numerical in the first case, all in the second case (correlation_table and var_rank_info
functions),
4. plots of distribution of target variables vs predictors (bar plots, box plots and histograms via
cross_plot and plotar functions),
5. quantitative analysis for binary target variables (categ_analysis),
6. different methods of binning continuous features (discretize_df, convert_df_to_categoric
and discretize_rgr),
7. variable scaling (range01),
8. outlier treatment (prep_outliers, tukey_outlier and hampel_outlier functions),
9. gain and lift curves (gain_lift).
It is the only library that encompasses visualizations related to predictive models and non-standard
correlation analysis. The range of tools contained by funModeling is very wide. The package
includes an exhaustive introduction vignette called funModeling quick-start. One of the bivariate
visualizations9 offered by the package can be found in Figure 7.
8 Access the full report https://github.com/mstaniak/autoEDA-resources/blob/master/autoEDA-paper/
plots/DataExplorer/dataexplorer_example.pdf
9 Find all the plots at https://github.com/mstaniak/autoEDA-resources/tree/master/autoEDA-paper/
plots/funmodeling
The R Journal Vol. XX/YY, AAAA 20ZZ ISSN 2073-4859C ONTRIBUTED RESEARCH ARTICLE 8
100% 425
400 384
75% 52.5 57.6
300
Died (count)
Died (%)
TRUE
50%
200 FALSE
25%
110
47.5 42.4 100 81
0% 0
E
E
E
E
LS
U
LS
U
TR
TR
FA
FA
Smokes Smokes
Figure 7: An example output from the funModeling::cross_plot function (funModeling v. 1.7). Such
a plot is drawn for every variable in the dataset (continuous features are discretized) or for a specified
subset of variables.
The autoEDA package
autoEDA package (Horn, 2018a) is a GitHub-based tool for univariate and bivariate visualizations and
summaries. The dataOverview function returns a data frame that describes each feature by its type,
number of missing values, outliers and typical descriptive statistics. Values proposed for imputation
are also included. Two outlier detection methods are available: Tukey and percentile-based. A PDF
report can be created using the autoEDA function. It consists of the plots of distributions of predictors
grouped by outcome variable or distribution of outcome by predictors.
The package can be found on Xander Horn’s GitHub: https://github.com/XanderHorn/autoEDA.
It does not include a vignette, but a short introduction article was published to LinkedIn (Horn, 2018b)
and similar examples can be found in the readme of the project. Plots from a report10 generated by
autoEDA are displayed in Figure 8.
The arsenal package
The arsenal package (Heinzen et al., 2019) is a set of four tools for data exploration:
1. table of descriptive statistics and p-values associated statistical tests grouped by levels of a
target variable (the so-called Table 1), also for paired observation, for example longitudinal data,
via functions tableby and paired, which is limited to comparisons at two times points,
2. comparison of two data frames that can detect shared variables (compare function),
3. frequency tables for categorical variables (freqlist function),
4. fitting and summarizing simple statistical models (linear regression, Cox model etc) in tables of
estimates, confidence intervals and p-values (modelsum function).
Results of each function can be saved to a short report using the write2 function. An example11 can
be found in 9.
A separate vignette is available for each of the functions. arsenal is the most statistically-oriented
package among reviewed libraries. It borrows heavily from SAS-style procedures used by the authors
at the Mayo Clinic.
The SmartEDA package
The SmartEDA package (Kondapalli, 2018), is focused entirely on data exploration through graphics
and descriptive statistics with no view on feature engineering. The range of tools it includes is wide:
10 Find the full report at https://github.com/mstaniak/autoEDA-resources/blob/master/autoEDA-paper/
plots/autoEDA/autoEDA_report.pdf
11 Access the table with archivist::aread("mstaniak/autoEDA-resources/autoEDA-paper/d951")
The R Journal Vol. XX/YY, AAAA 20ZZ ISSN 2073-4859C ONTRIBUTED RESEARCH ARTICLE 9
Figure 8: Sample pages from the report generated by the autoEDA::autoEDA function (autoEDA v. 1.0)
displaying bivariate relationships between the target and explanatory variable.
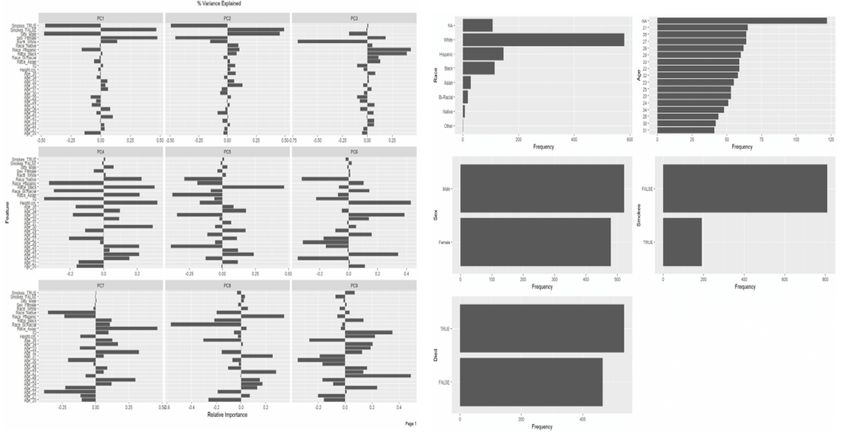
Figure 9: An example output from the arsenal::tableby function saved using arsenal::write2
(arsenal v 2.0). Smokes and Race variables are compared by the levels of Died variable.
The R Journal Vol. XX/YY, AAAA 20ZZ ISSN 2073-4859C ONTRIBUTED RESEARCH ARTICLE 10
Figure 10: Sample pages from a report generated by the SmartEDA::ExpReport function (SmartEDA v.
0.3), including dataset overview and bivariate dependency for categorical variables.
1. dataset summary (ExpData function),
2. descriptive statistics that may include correlation with target variable and density or bar plots
(ExpNumStat, ExpNumViz, ExpCatStat and ExpCatViz functions, all visualizations may include
the target variable),
3. QQ plots (ExpOutQQ),
4. contingency tables (ExpCTable function),
5. information value and Weight of the Evidence coding (ExpWoETable, ExpInfoValue),
6. parallel coordinate plot for multivariate visualization (ExpParcoord).
Plotting functions return grids of ggplot2 object. The results can be written to a HTML report
(ExpReport function). There are also additional functionalities dedicated to data.table objects from
data.table package (Dowle and Srinivasan, 2019). An introductory vignette called Explore data using
SmartEDA (Intro) is attached to the library. Another vignette Custom summary statistics describe cu-
tomizing output tables. The package is also described in the Putatunda et al. (2019) paper. Examples12
can be found in Figure 10.
The summarytools package
The summarytools package (Comtois, 2019) builds tables with whole data or univariate summaries,
frequency tables or cross-tabulations. In addition, the output can be formatted to be included in
knitr(Xie, 2015) or plain documents, HTML files and shiny apps (Chang et al., 2018). The are four
main functionalities:
1. whole dataset summary including variable types and a limited number of descriptive statistics,
counts of unique values and missing values and univariate plots within the output table
(dfSummary function),
2. descriptive statistics, including skewness and kurtosis, for numerical variables, possibly grouped
by levels of a factor (descr, stby),
3. counts and proportions for levels of categorical features (freq),
4. contingency tables for pairs of categorical variables (ctab).
All results can be saved and displayed in different formats. The package includes a vignette titled
Introduction to summarytools. An example of univariate summaries13 can be found in Figure 3.
12 A full report is available at https://github.com/mstaniak/autoEDA-resources/blob/master/autoEDA-
paper/plots/SmartEDA/smarteda_report_target.pdf
13 Access the R object with archivist::aread("mstaniak/autoEDA-resources/autoEDA-paper/9e12").
The R Journal Vol. XX/YY, AAAA 20ZZ ISSN 2073-4859C ONTRIBUTED RESEARCH ARTICLE 11
Height(cm) IQ
Mean 175.09 100.23
Std.Dev. 9.83 10.03
Min 146.30 68.00
Q1 168.20 93.00
Median 175.30 100.00
Q3 182.05 107.00
Max 207.20 137.00
MAD 10.38 10.38
IQR 13.83 14.00
CV 0.06 0.10
Skewness -0.08 0.08
SE.Skewness 0.08 0.08
Kurtosis -0.30 -0.04
N.Valid 1000.00 898.00
% Valid 100.00 89.80
Table 3: An example table of descriptive statistics generated by the summarytools::descr function
(summarytools v. 0.9.2).
140
120
get(dv.var)
100
80
160 180 200
IQ
Figure 11: Univariate regression plot created using the exploreR::massregplot (exploreR v. 0.1).
The exploreR package
The exploreR package (Coates, 2016) takes a unique approach to data exploration compared to other
packages. The analysis is based on linear regression. There are three functionalities:
1. fitting univariate regression model for each independent variable and summarizing the results
in a table that consists of estimated parameters, p-values, and R2 values (masslm function),
2. plotting target variable against each independent variable along with the fitted least squares
line (massregplot),
3. feature standardization by scaling to the interval [0, 1] or subtracting mean and dividing by
standard deviation.
Regression plots can be saved to a PDF file. A vignette called The How and Why of Simple Tools explains
all the functions and provides examples. One of the regression plots14 is presented in Figure 11.
14 A PDF file with all the plots can be found at https://github.com/mstaniak/autoEDA-resources/blob/
master/autoEDA-paper/plots/exploreR.pdf
The R Journal Vol. XX/YY, AAAA 20ZZ ISSN 2073-4859C ONTRIBUTED RESEARCH ARTICLE 12
The RtutoR package
The RtutoR package (Nair, 2018a) is a tool for automated reporting. There are three options for
creating a report that contains univariate and bivariate data summaries:
1. plots can be created interactively in a shiny app (launch_plotter function),
2. the whole report can be generated from a shiny app that allows the user to tweak the report
(gen_exploratory_report_app),
3. the report can be created by a direct call to the generate_exploratory_analysis_ppt function.
The report is saved in the PPTX format. Notably, this package can identify the top k relevant variables
based on a chosen criterion, for example, information gain, and display only plots for these variables.
An example report can be found in the GitHub repository of the package15 . The package was
introduced in an R-Bloggers blog post Nair (2018b).
Other packages
As mentioned before, there are numerous R packages that aim to make data exploration faster or make
the outputs more polished.
For table summaries of data that often include statistical tests, there are a few packages worth
mentioning. The package tableone (Yoshida and Bohn., 2018) provides a CreateTableOne function
to make publication-ready tables referred to as Table 1 - traditional name of tables that describe
patients’ characteristic, usually stratified and including p-values from significance tests. The describe
function from describer package (Hendricks, 2015) prints a summary of a data.frame or a vector
which includes data types, counts and descriptive statistics. A function of the same name from prettyR
(Lemon and Grosjean, 2018) returns descriptive statistics for each column in a data.frame. This
package is focused on improving the aesthetics of R statistical outputs. Similarly, the package Hmisc
(Harrell Jr et al., 2019) includes a describe function that displays typical descriptive statistics and
number of unique and missing values for each column. The plot method called on the result of the
describe function returns a dot plot for each categorical and a spike histogram for each continuous
column. The scope of this package is bigger than just Exploratory Data Analysis, as it includes many
tools related to regression models.
There are also many packages related to data visualization. Two of them are particularly worth
mentioning. The ggfortify package (Tang et al., 2016) serves as a uniform interface to plots of different
statistical objects, including PCA results that can be used for data exploration and time series plots.
The autoplotly library (Tang, 2018) was built on top of ggfortify to provide automatically generated,
interactive visualizations of many statistical models. While these two packages are focused on
statistical modeling, they can be helpful in exploratory analysis and exemplify the potential of quick
and interactive visualization in R.
Two more packages are relevant to our interest. gpairs (Emerson and Green, 2014) and GGally
(Schloerke et al., 2018) packages implement the generalized pairs plot (Emerson et al., 2013). This
type of plot extends well known scatter plot matrices, that visualize bivariate relationships for many
variables, by handling both numerical and categorical variables. It is helpful in data exploration and
shares similarities to walls of histograms that can be found in automated EDA libraries.
Feature comparison
In this section, I compare how different packages address autoEDA tasks as described in Section 2.1.1.
A quick overview of the functionalities of different packages can be found in Table 4.
Data description
Almost all packages contain functions for summarizing the dataset. Tools that support data validity
analysis are less common.
Whole dataset summaries
visdat package introduces the most original summaries of full dataset. The drawback of this approach
is that it is not well suited for high dimensional data. But for a smaller number of variables, it gives a
good overview of the dataset.
15 Find the report at https://github.com/anup50695/RtutoR/blob/master/titanic_exp_report_2.pptx
The R Journal Vol. XX/YY, AAAA 20ZZ ISSN 2073-4859C ONTRIBUTED RESEARCH ARTICLE 13
Most packages that provide a whole dataset summary take a similar approach and present names
and types of variables, number of missing values and sometimes unique values or other statistics.
This is true for summarytools (dfSummary function), autoEDA (dataOverview function), dataMaid
(makeDataReport result), funModeling (df_status function) and DataExplorer (introduce function),
which provides the information separately on two plots - one for dataset structure, one for missing
data. In the dlookr package, summaries for numerical variables and categorical variables are only
presented separately in the report (describe function).
Data validity
Some packages can perform automated checks for the data, including at least outlier detection. The
dataMaid package’s main purpose is to find inconsistencies and errors in the data. It finds possible
outliers, missing values, low-frequency and possibly miscoded levels of factors. All this information
can be summarized in a quality report. The dlookr package covers similar functionality. There are
two main differences, the report does not describe possible miscoded factors, but outlier analysis is
supplemented with plots showing variable distribution before and after removing the outliers. In all
cases, the analysis is rather simple, for example in zero-inflated variables non-zero values are treated
as outliers (dlookr). Other packages only provide information about the number of missing values,
outlier and identify columns that consist of a single value.
Data exploration
While multivariate analysis is rarely supported, there are many tools for descriptive and graphical
exploration uni- and bivariate patterns in the data.
Univariate statistics
All the tools that support univariate analysis take a similar approach to univariate analysis. For
categorical variables, counts are reported and bar plots are presented, while histogram or boxplots
and typical descriptive statistics (including quantiles, sometimes skewness) are used for continuous
variables.
In dataMaid and dlookr packages, these plots are presented variable-by-variable in the report.
In other packages (DataExplorer, funModeling, SmartEDA) groups of plots are shown together -
as a wall of histograms or bar plots. Notably, dlookr reports skewness of variables and in case a
skewed variable is found, it shows the distribution after some candidate transformations to reduce
the skewness. This package also reports normality. The SmartEDA package also reports skewness
and displays QQ plots against normal distribution, but it does not provide any means of reducing
skewness.
Bivariate statistics
The funModeling and SmartEDA packages only support calculating correlations between variables
and a specified target. DataExplorer, visdat and DataExplorer packages can plot correlation matrices.
They differ in categorical variables treatment. Some packages require only numerical features (visdat).
Interestingly, in DataExplorer16 , low-cardinality categorical features are converted to 0-1 variables
and plotted alongside numerical variables, as seen in Figure 12.
The arsenal package only presents variable summaries by levels of a chosen categorical variable.
The report from autoEDA package consists of a limited number of bar plots/boxplots with target
variable as one of the dimensions. Similarly, in DataExplorer, dlookr, funModeling and SmartEDA,
scatter plots and box plots or histograms with a specified target variable on one of the axis can be
plotted. Additionally, funModeling and dlookr draw histograms/densities of continuous features
by the target. The funModeling package also has unique options: drawing bar plots of discretized
variables by the target and quantitative analysis for binary outcome based on representativeness
and accuracy. arsenal, summarytools and SmartEDA also feature contingency tables. Moreover, the
exploreR package uses linear regression plots and statistics to find relationships between the target
and other variables.
16 Access the plot with archivist::ared("mstaniak/autoEDA-resources/autoEDA-paper/0526")
The R Journal Vol. XX/YY, AAAA 20ZZ ISSN 2073-4859C ONTRIBUTED RESEARCH ARTICLE 14
Died_TRUE 0.08 0.08 −0.08 −0.04 0.04 −1 1
Died_FALSE −0.08 −0.08 0.08 0.04 −0.04 1 −1
Smokes_TRUE 0.02 −0.04 0.04 −1 1 −0.04 0.04
Features
Smokes_FALSE −0.02 0.04 −0.04 1 −1 0.04 −0.04
Sex_Male 0.03 −1 1 −0.04 0.04 0.08 −0.08
Sex_Female −0.03 1 −1 0.04 −0.04 −0.08 0.08
IQ 1
Height_cm_ 1 −0.03 0.03 −0.02 0.02 −0.08 0.08
Smokes_FALSE
Smokes_TRUE
Died_FALSE
Sex_Female
Height_cm_
Died_TRUE
Sex_Male
IQ
Features
Correlation Meter
−1.0 −0.5 0.0 0.5 1.0
Figure 12: Correlation plot as returned by the DataExplorer::plot_correlation function.
Data cleaning and feature engineering
The dataMaid package assumes that every decision regarding the data should be made by the
analyst and does not provide any tools for data manipulation after diagnosis. Most of the packages
only provide exploration tools. Exceptions are dlookr, funModeling, DataExplorer and exploreR.
DataExplorer tools are limited to normalization, imputation by a constant, merging levels of factors
and creating dummy variables.
The dlookr package can create a report that presents different possible transformations of features.
Missing values can be imputed by mean/median/mode and distributions of variables before and after
the procedure compared. The same is done for imputation of outliers. Logarithmic and root square
transforms are proposed for skewed variables. Different methods of binning continuous variables are
also presented, including Weight of the Evidence.
The funModeling package can perform discretization of a variable using an equal frequency
criterion or gain ratio maximization. It can also scale variables to the interval [0, 1]. Outliers can be
treated using the Tukey or Hampel method.
Reporting
DataExplorer, dlookr, dataMaid, SmartEDA and RtutoR have an option of generating a report and
saving it to a file. They consist of all or most possible outputs of the package which are organized
either by variable (dataMaid, dlookr) or by type of variable (DataExplorer, SmartEDA) and the task.
autoEDA package generates a minimal report with bivariate plots. Packages arsenal, funModeling,
xray, summarytools and exploreR have an option of saving outputs - plots or tables - to files.
Summary
Automated EDA can be either directed towards a general understanding of a particular dataset or be
more model-oriented, serving as a foundation for good modeling. While presented packages include
some tools related to simple feature engineering, they are more focused on data understanding. For
this task, they have many advantages. In this section, we summarize the strong points of existing tools
and point out some possible improvements and new directions for autoEDA.
Strengths
1. The packages dlookr, dataMaid, DataExplorer, SmartEDA are capable of creating good quality
reports.
2. DataExplorer has very good visualizations for PCA.
The R Journal Vol. XX/YY, AAAA 20ZZ ISSN 2073-4859C ONTRIBUTED RESEARCH ARTICLE 15
3. DataExplorer handles categorical variables on correlation plots by creating dummy features,
which is a unique idea compared to other packages.
4. The visdat package, while probably not the best choice for high dimensional data, features
interesting take on initial whole dataset exploration.
5. The dlookr package is capable of selecting skewed variables and proposing transformations.
Some of the other packages display binned continuous variables, which can also help in seeing
visualizing dependencies.
6. dataMaid is a good tool for finding problems in the data. Thanks to the structure of check and
summarize functions results, discovered issues can be treated effectively.
7. For datasets with a moderate number of features, DataExplorer, funModeling, dlookr and
SmartEDA give a reasonable insight into variables distributions and simple relationships.
8. SmartEDA package provides a method of visualizing multivariate relationships - parallel
coordinate plot.
9. The exploreR package provides usefuls tool for assessing bivariate relationship through linear
regression.
We can see that tasks related to data quality and whole dataset summary are well by the existing
libraries. Getting the big picture of the data and finding possible data quality problems is easy,
especially due to the dataMaid package. Univariate exploration For classical applications, for example,
statistical analyses in medicine, the current tools provide very good tables, such as the ones from
tableone package, and uni-/bivariate plots. Univariate analysis can be performed either variable-
after-variable (dlookr, dataMaid), where we can see the statistical properties of each variable, or as
groups of plots based on variable type (DataExplorer, funModeling). Both ways can be useful for
a reasonable number of predictors. While multivariate tools are scarce, the available tools, PCA in
DataExplorer and PCP in SmartEDA, are very well done.
Weaknesses
1. All the presented tools are likely to fail in typical situations with imperfect data. In particular,
they are usually not robust to issues like zero-variance/constant variables (DataExplorer can’t
generate a report in this case). Error messages in some cases not uninformative.
2. In some situations, they lack flexibility. For example, in DataExplorer arguments can be passed
to cor function, but not to corrplot function.
3. In case of walls of histograms (or bar plots), no selection is being done and no specific order
is chosen to promote most interesting distributions. The same is true for automatically cre-
ated reports. Moreover, for high-dimensional data or high-cardinality factors, the plots are
unreadable or impractical. This is especially true for DataExplorer and funModeling func-
tions (e.g. cross_plot), even though DataExplorer removes too large factors from the panels.
This problem is only addressed by the RtutoR package, which allows to select top k relevant
variables.
4. Plots are limited to bivariate relationships. Exploring higher dimensional dependencies would
be interesting, for example by adding color and size dimensions to the plots. Since such an
addition would result in a large number of new plots, it would require a proper method of
finding the most relevant visualization.
5. Support for time-varying variables and non-classical (not IID) problems such as survival analysis
is limited or non-existent. For survival analysis, the automation level is low, but there are
two notable tools for summarizing dependencies. First is the recognized package survminer
(Kassambara and Kosinski, 2018), which helps visualize survival curves, while also displaying
survival tables and other information. The other tool is a no longer developed cr17 package
(Młynarczyk and Biecek, 2017), which includes summarizeCR function that returns several tables
and plots for competing risks analysis. More tools for fast visualization of at least bivariate
relationships in such problems would be a big help for analysts.
6. PCA, parallel coordinate plots and model summaries are supported, but each by a single,
separate package. It is evident that there is a shortage of multivariate tools. Cluster analysis is
not available in any of the packages.
7. Automated reports could be enriched by textual annotations and descriptions, either built from
simple templates or from a generative model.
8. Only one of the packages addresses the issue of skewed variables. Proposing transformations of
continuous features other than binning would be helpful and could improve visualizations, for
example, scatter plots with skewed variables.
The R Journal Vol. XX/YY, AAAA 20ZZ ISSN 2073-4859C ONTRIBUTED RESEARCH ARTICLE 16
9. Univariate regression models can be plotted by the exploreR package. Exploration based on
simple statistical models, for example, scatter plot smoothing, is not an option in any of the
other packages. Using regression models and feature transformations to identify and measure
relevant relationships could improve bivariate analyses supported by automated EDA.
10. None of the packages addresses issues such as multicollinearity.
11. Missing data imputation more advanced than imputing a constant is delegated to other packages,
although, it is known that imputation by a constant is usually not the best method of missing
values treatment.
12. Some of the above issues limit the packages’ usefulness in iterative work. Though, the compar-
isons of transform and original features and the possibility of applying discovered transforma-
tions to data in dlookr package are steps in the right direction.
The tools available in R have similar range to other languages’ libraries, for example from Python.
Python packages such as Dora (Epstein, 2017) or lens (Zabalza and Engineers, 2018) also cover
feature-by-feature descriptive statistics and plots, bivariate visualizations of the relationships between
predictors and target variable, contingency tables, basic feature engineering, and imputation.
Since EDA is both closely connected to feature engineering and based on visual insights, automated
EDA can draw from existing tools for automated feature extraction (in autoML tools like TPOT (Olson
et al., 2016)) and visualization recommendations. When it comes to aiding visual exploration of a
dataset, standalone software carries possibilities beyond what we can expect from R packages or
analogous libraries in other languages. A recent notable example is DIVE (Hu et al., 2018). It is an
example of a growing number of tools for visual data exploration that aim to distinguish between
relevant and irrelevant visualization and help the analyst find the most interesting plots. DIVE is one
of the mixed-initiative visualization systems, meaning it uses both statistical properties of the dataset and
user interactions to find the relevant plots. Building recommendation systems into autoEDA tools
can help address the issue of dealing with high-dimensional data and multivariate dependencies by
letting the ML-based system deal with the complexity of a large number of candidate visualizations.
AI-assisted data exploration can be even faster and more efficient.
Acknowledgement
This work was financially supported by the NCN Opus grant 2016/21/B/ST6/02176.
Bibliography
P. Biecek and M. Kosinski. archivist: An R package for managing, recording and restoring data analysis
results. Journal of Statistical Software, 82(11):1–28, 2017. doi: 10.18637/jss.v082.i11. [p]
B. Bischl, J. Richter, J. Bossek, D. Horn, J. Thomas, and M. Lang. mlrMBO: A Modular Framework for
Model-Based Optimization of Expensive Black-Box Functions, 2017. [p]
P. Casas. Data Science Live Book. https://livebook.datascienceheroes.com/, 2018. Retrieved on
14 March 2019. [p]
P. Casas. funModeling: Exploratory Data Analysis and Data Preparation Tool-Box Book, 2019. URL
https://CRAN.R-project.org/package=funModeling. R package version 1.7. [p]
W. Chang, J. Cheng, J. Allaire, Y. Xie, and J. McPherson. shiny: Web Application Framework for R, 2018.
URL https://CRAN.R-project.org/package=shiny. R package version 1.2.0. [p]
M. Coates. exploreR: Tools for Quickly Exploring Data, 2016. URL https://CRAN.R-project.org/
package=exploreR. R package version 0.1. [p]
D. Comtois. summarytools: Tools to Quickly and Neatly Summarize Data, 2019. URL https://CRAN.R-
project.org/package=summarytools. R package version 0.9.2. [p]
D. Cook. Practical Machine Learning with H2O: Powerful, Scalable Techniques for Deep Learning and AI.
O’Reilly Media, 2016. [p]
G. Csardi. cranlogs: Download Logs from the ’RStudio’ ’CRAN’ Mirror, 2015. URL https://CRAN.R-
project.org/package=cranlogs. R package version 2.1.0. [p]
B. Cui. DataExplorer: Data Explorer, 2018. URL https://CRAN.R-project.org/package=DataExplorer.
R package version 0.7.0. [p]
The R Journal Vol. XX/YY, AAAA 20ZZ ISSN 2073-4859C ONTRIBUTED RESEARCH ARTICLE 17
D. B. Dahl, D. Scott, C. Roosen, A. Magnusson, and J. Swinton. xtable: Export Tables to LaTeX or HTML,
2018. URL https://CRAN.R-project.org/package=xtable. R package version 1.8-3. [p]
M. Dowle and A. Srinivasan. data.table: Extension of ‘data.frame‘, 2019. URL https://CRAN.R-project.
org/package=data.table. R package version 1.12.0. [p]
J. W. Emerson and W. A. Green. gpairs: gpairs: The Generalized Pairs Plot, 2014. URL https://CRAN.R-
project.org/package=gpairs. R package version 1.2. [p]
J. W. Emerson, W. A. Green, B. Schloerke, J. Crowley, D. Cook, H. Hofmann, and H. Wickham. The
generalized pairs plot. Journal of Computational and Graphical Statistics, 22(1):79–91, 2013. doi:
10.1080/10618600.2012.694762. [p]
N. Epstein. Dora: Exploratory data analysis toolkit for python, 2017. URL https://github.com/
NathanEpstein/Dora. Python library version 0.0.2. [p]
M. Feurer, A. Klein, K. Eggensperger, J. Springenberg, M. Blum, and F. Hutter. Efficient and robust
automated machine learning. In C. Cortes, N. D. Lawrence, D. D. Lee, M. Sugiyama, and R. Garnett,
editors, Advances in Neural Information Processing Systems 28, pages 2962–2970. Curran Associates,
Inc., 2015. [p]
J. Gassen. ExPanDaR: Explore Panel Data Interactively, 2018. URL https://CRAN.R-project.org/
package=ExPanDaR. R package version 0.3.0. [p]
H2O.ai. H2O, march 2019. version 3.22.1.6. [p]
F. E. Harrell Jr, with contributions from Charles Dupont, and many others. Hmisc: Harrell Miscellaneous,
2019. URL https://CRAN.R-project.org/package=Hmisc. R package version 4.2-0. [p]
E. Heinzen, J. Sinnwell, E. Atkinson, T. Gunderson, and G. Dougherty. arsenal: An Arsenal of ’R’
Functions for Large-Scale Statistical Summaries, 2019. URL https://CRAN.R-project.org/package=
arsenal. R package version 2.0.0. [p]
P. Hendricks. describer: Describe Data in R Using Common Descriptive Statistics, 2015. URL https:
//CRAN.R-project.org/package=describer. R package version 0.2.0. [p]
X. Horn. autoEDA: Automated univariate and bivariate exploratory data analysis, 2018a. R package version
1.0. [p]
X. Horn. Automated exploratory data analysis in r. https://www.linkedin.com/pulse/automated-
exploratory-data-analysis-r-xander-horn/, 2018b. Retrieved on 14 March 2019. [p]
K. Hu, D. Orghian, and C. Hidalgo. Dive: A mixed-initiative system supporting integrated data
exploration workflows. In ACM SIGMOD Workshop on Human-In-the-Loop Data Analytics (HILDA).
ACM, 2018. doi: 10.1145/3209900.3209910. [p]
H. Jin, Q. Song, and X. Hu. Auto-Keras: Efficient Neural Architecture Search with Network Morphism.
arXiv e-prints, Jun 2018. [p]
A. Kassambara and M. Kosinski. survminer: Drawing Survival Curves using ’ggplot2’, 2018. URL
https://CRAN.R-project.org/package=survminer. R package version 0.4.3. [p]
D. U. K. R. R. P. Kondapalli. SmartEDA: Summarize and Explore the Data, 2018. URL https://CRAN.R-
project.org/package=SmartEDA. R package version 0.3.0. [p]
L. Kotthoff, C. Thornton, H. H. Hoos, F. Hutter, and K. Leyton-Brown. Auto-weka 2.0: Automatic
model selection and hyperparameter optimization in weka. Journal of Machine Learning Research, 18
(1):826–830, Jan. 2017. [p]
M. Kuhn and D. Vaughan. parsnip: A Common API to Modeling and Analysis Functions, 2019. URL
https://CRAN.R-project.org/package=parsnip. R package version 0.0.2. [p]
J. Lemon and P. Grosjean. prettyR: Pretty Descriptive Stats, 2018. URL https://CRAN.R-project.org/
package=prettyR. R package version 2.2-2. [p]
M. Młynarczyk and P. Biecek. cr17: Testing Differences Between Competing Risks Models and Their
Visualisations, 2017. URL https://CRAN.R-project.org/package=cr17. R package version 0.1.0. [p]
A. Nair. RtutoR: Shiny Apps for Plotting and Exploratory Analysis, 2018a. URL https://CRAN.R-project.
org/package=RtutoR. R package version 1.2. [p]
The R Journal Vol. XX/YY, AAAA 20ZZ ISSN 2073-4859C ONTRIBUTED RESEARCH ARTICLE 18
A. Nair. Automating basic eda. https://www.r-bloggers.com/automating-basic-eda/, 2018b. Re-
trieved on 25 March 2019. [p]
R. S. Olson, R. J. Urbanowicz, P. C. Andrews, N. A. Lavender, L. C. Kidd, and J. H. Moore. Applications
of Evolutionary Computation: 19th European Conference, EvoApplications 2016, Porto, Portugal, March 30
– April 1, 2016, Proceedings, Part I, chapter Automating Biomedical Data Science Through Tree-Based
Pipeline Optimization, pages 123–137. Springer International Publishing, 2016. doi: 10.1007/978-3-
319-31204-0_9. [p]
A. H. Petersen and C. T. Ekstrom. dataMaid: A Suite of Checks for Identification of Potential Errors in a
Data Frame as Part of the Data Screening Process, 2018. URL https://CRAN.R-project.org/package=
dataMaid. R package version 1.2.0. [p]
S. Putatunda, K. Rama, D. Ubrangala, and R. Kondapalli. SmartEDA: An R Package for Automated
Exploratory Data Analysis. arXiv e-prints, art. arXiv:1903.04754, Mar 2019. [p]
C. Ryu. dlookr: Tools for Data Diagnosis, Exploration, Transformation, 2019. URL https://CRAN.R-
project.org/package=dlookr. R package version 0.3.8. [p]
B. Schloerke, J. Crowley, D. Cook, F. Briatte, M. Marbach, E. Thoen, A. Elberg, and J. Larmarange.
GGally: Extension to ’ggplot2’, 2018. URL https://CRAN.R-project.org/package=GGally. R package
version 1.4.0. [p]
P. Seibelt. xray: X Ray Vision on your Datasets, 2017. URL https://CRAN.R-project.org/package=xray.
R package version 0.2. [p]
Y. Tang. autoplotly: An r package for automatic generation of interactive visualizations for statistical
results. Journal of Open Source Software, 3, 2018. doi: 10.21105/joss.00657. [p]
Y. Tang, M. Horikoshi, and W. Li. ggfortify: Unified Interface to Visualize Statistical Results of Popular
R Packages. The R Journal, 8(2):474–485, 2016. doi: 10.32614/RJ-2016-060. [p]
N. Tierney. visdat: Visualising whole data frames. JOSS, 2(16):355, 2017. doi: 10.21105/joss.00355. [p]
H. Wickham. ggplot2: Elegant Graphics for Data Analysis. Springer-Verlag New York, 2016. ISBN
978-3-319-24277-4. doi: 10.1007/978-0-387-98141-3. URL http://ggplot2.org. [p]
R. Wirth. Crisp-dm: Towards a standard process model for data mining. In Proceedings of the Fourth
International Conference on the Practical Application of Knowledge Discovery and Data Mining, pages
29–39, 2000. doi: 10.1.1.198.5133. [p]
Y. Xie. Dynamic Documents with R and knitr. Chapman and Hall/CRC, Boca Raton, Florida, 2nd edition,
2015. doi: 10.18637/jss.v056.b02. [p]
K. Yoshida and J. Bohn. tableone: Create ’Table 1’ to Describe Baseline Characteristics, 2018. URL https:
//github.com/kaz-yos/tableone. R package version 0.9.3. [p]
V. Zabalza and F. Engineers. lens, Dec. 2018. Python library version 0.4.5. [p]
J. J. Zhang and K. B. Storey. Rbioplot: An easy-to-use r pipeline for automated statistical analysis
and data visualization in molecular biology and biochemistry. PeerJ, 2016(9), Jan. 2016. doi:
10.7717/peerj.2436. [p]
Mateusz Staniak
Faculty of Mathematics and Information Science
Warsaw University of Technology
Poland
m.staniak@mini.pw.edu.pl
Przemysław Biecek
Faculty of Mathematics, Informatics and Mechanics
University of Warsaw
Faculty of Mathematics and Information Science
Warsaw University of Technology
Poland
ORCiD: 0000-0001-8423-1823
przemyslaw.biecek@gmail.com
The R Journal Vol. XX/YY, AAAA 20ZZ ISSN 2073-4859C ONTRIBUTED RESEARCH ARTICLE 19
Task type task D. dM. fM. v. a. x. aE. d. SE. s. e. R.
Variable types x x x x x x x x
Dataset size x x x x x x x
Dataset
Other info x x
Compare datasets x x x
Missing values x x x x x x x x x
Redundant columns x x x x x x x
Validity Outliers x x x x
Atypical values x x x
Level encoding x
Descriptive stat. x x x x x x x x
Histograms x x x x x x x x
Univar. Boxplots x
Bar plots x x x x x x x x
QQ plots x x x
Descriptive stat. x x x x x
Correlation matrix x x x
1-vs-each corr. x x x x
Time-dependent x x
Bivar. Bar plots by target x x x x x x
Histograms by target x x x x
Scatter plots x x x x
Contigency tables x x x x
Other (factors) x x
PCA x
Multivar. Stat. models x
Parallel coord. Plot x
Imputation x x
Scaling x x x
Skewness reduction x
Feat. eng.
Outlier treatment x x
Binning x x x
Merging levels x x
PDF/HTML reports x x x x x x
Reporting
Saving outputs x x x x x
Table 4: Overview of functionalities of all described packages. Package names were shortened to make
the table as compact as possible. D. denotes DataExplorer, dM. - dataMaid, fM. - funModeling, v. -
visdat, a. - arsenal, x. - xray, aE. - autoEDA, d. denotes dlookr, SE. - SmartEDA, s. - summarytools,
e. - exploreR, R. denotes RtutoR. Num. plots by target refers to either histogram, density or box plot.
The R Journal Vol. XX/YY, AAAA 20ZZ ISSN 2073-4859You can also read