BRISTOL RESILIENCE ACTION PLAN 2020 - 2025 RESILIENCE TO CLIMATE CHANGE WITH FOCUS ON URBAN WATER CYCLE - RESCCUE Toolkit
←
→
Page content transcription
If your browser does not render page correctly, please read the page content below

BRISTOL
RESILIENCE
ACTION PLAN

RESILIENCE TO CLIMATE CHANGE WITH
FOCUS ON URBAN WATER CYCLE

2020 – 2025

Bristol City Council

   i
BRISTOL RESILIENCE ACTION PLAN

Bristol City Council
100 Temple Street, Bristol, BS1 6AG
Bristol, United Kingdom
Tel. 0117 35 25893
E-mail: flood.data@bristol.gov.uk

https://www.bristol.gov.uk/

Authors and contributors

   AUTHORS                                      ROLE                           INSTITUTION

   Coordinator: John Stevens                    Bristol Research Site          Bristol City Council
                                                contributions and
   Team: Patrick Goodey                         development                    https://bristol.gov.uk/

   Coordinator: Maria Adriana Cardoso           Methodology, contributions     LNEC
                                                and development
   Team: Rita Brito, Cristina Pereira           coordination                   http://www.lnec.pt/en

                                                                               RESCCUE UK partners:
   Rob Henderson                                Stakeholders contribution
                                                                               Wessex Water, https://wessexwater.co.uk
   Graham Colclough                             and development
                                                                               Urban DNA, https://urbandna.eu

   CONTRIBUTORS                                  INSTITUTION
   Barry Evans, Albert Chen, Mike Gibson,
                                                RESCCUE UK partners            University of Exeter, www.exeter.ac.uk
   Slobodan Djordjevic
   Robert Monjo                                 RESCCUE other partners         FIC, https://www.ficlima.org/
   Beniamino Russo                                                             Aquatec, https://suez-advanced-solutions-spain.es/
   Eduardo Martinez, Maria Guerrero,                                           Cetaqua, https://www.cetaqua.com/en/home
   Giovanni Pagani, Hélène Fourniere                                           UN-Habitat, https://unhabitat.org/

   DATE                    VERSION
   29/08/2019              1.0 - Proposal of RAP 1st part
   17/10/2019              2.0 - Revision and update of RAP 1st part
   5/12/2019               3.0 - Addition of proposal of RAP 2nd part
   08/01/2020              4.0 - Revision and update of RAP 2nd part
   28/04/2020              5.0 - Revision and update of pre-final complete version
   28/07/2020              6.0 - Complete version for revision
   11/09/2020              Revised version

This plan is based on a template provided by RESCCUE Project (H2020 RESCCUE - RESilience to cope with Climate Change
in Urban arEas - a multisectorial approach focusing on water, Grant Agreement no.700174): www.resccue.eu

All images including cover photo are from Bristol City Council. Back cover by Maria do Céu Almeida.
                                                                  ii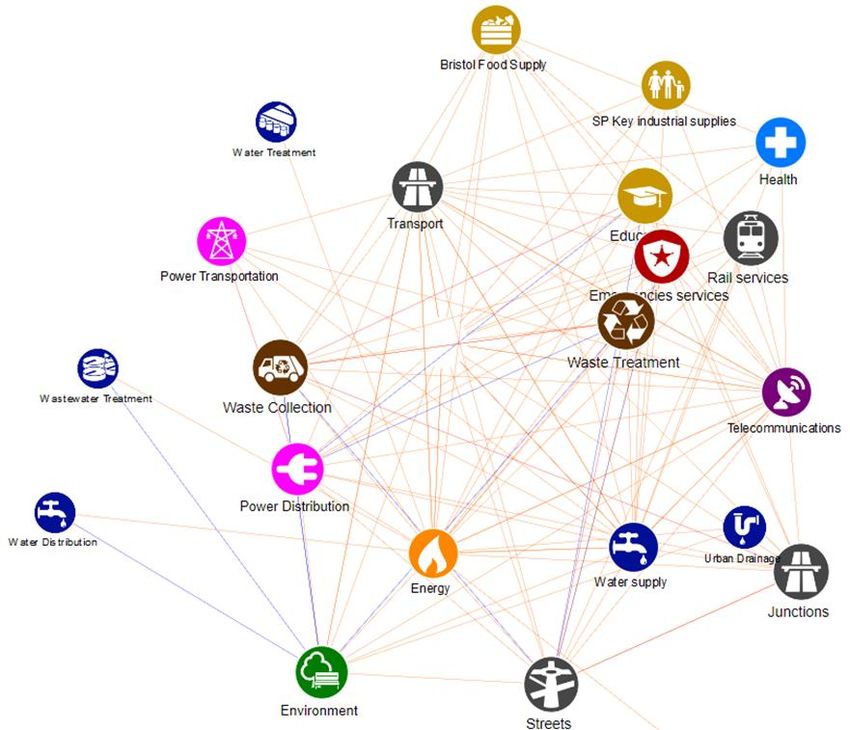
To cite this document:

Stevens, J., Goodey, P., Cardoso, M.A., Brito, R.S., Pereira, C., Henderson, R., Colclough, G., Evans, B., Chen, A., Gibson, M.,
Djordjevic, S., Monjo, R., Russo, B., Martinez, E., Guerrero, M., Pagani, G., Fourniere, H. (2020). Bristol Resilience Action
Plan. In Resilience Action Plans of the RESCCUE cities. D6.2 RESCCUE project (Public).

Disclaimer

This RAP was developed within the RESCCUE project, solely by the authors and contributors and it has not (at the time of
writing) followed an official approval process within Bristol City Council. Therefore, whilst the findings from the RAP process
will feed into the Council’s ongoing resilience plans, the specific action cannot at this time be considered as Council policy.

                                                              iii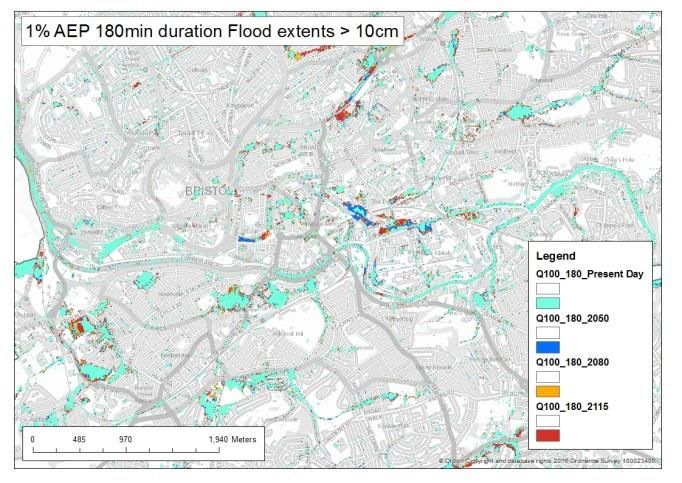
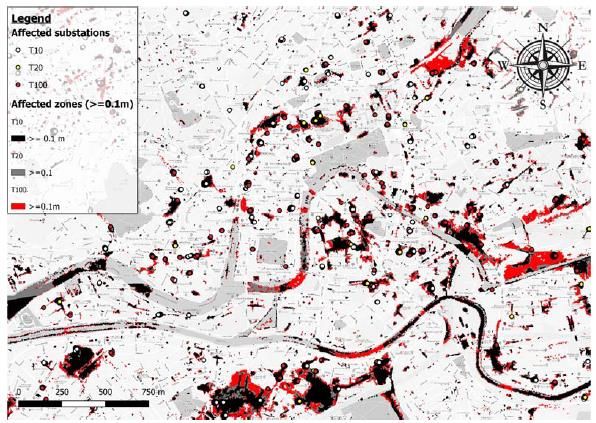
TABLE OF CONTENTS
ACRONYMS AND ABBREVIATIONS ............................................................................ vii
EXECUTIVE SUMMARY ............................................................................................... ix
1. INTRODUCTION.......................................................................................................1
   BACKGROUND............................................................................................................ 1
   ABOUT THE PLAN ....................................................................................................... 2
     Plan scope, focus and time horizon ........................................................................ 2
     Addressed urban services ...................................................................................... 2
     Planning process .................................................................................................... 3
     Document structure ............................................................................................... 4
2. CITY CHARACTERIZATION ........................................................................................5
   CITY PROFILE .............................................................................................................. 5
   SERVICE PROFILE ........................................................................................................ 8
3. CLIMATE CHANGE SCENARIOS AND RISK ASSESSMENT .........................................11
   HAZARDS SOURCES AND PLANNING SCENARIOS ..................................................... 11
   RISK ASSESSMENT .................................................................................................... 15
4. RESILIENCE ASSESSMENT AND SWOT ANALYSIS ....................................................17
   RESILIENCE ASSESSMENT ......................................................................................... 17
   SWOT ANALYSIS ....................................................................................................... 22
5. RESILIENCE STRATEGIES ........................................................................................24
   IDENTIFICATION OF STRATEGIES .............................................................................. 24
   STRATEGIES TO IMPLEMENT .................................................................................... 25
   CO-BENEFITS AND IMPACT ON RESILIENCE OBJECTIVES .......................................... 34
   PRIORITIZATION ....................................................................................................... 36
   IMPLEMENTATION PLAN .......................................................................................... 37
6. RAP MONITORING AND REVIEW PROCESS ............................................................38
   MONITORING ........................................................................................................... 38
   REVIEW .................................................................................................................... 38
7. FINAL REMARKS ....................................................................................................40
   MAIN BENEFITS AND FUTURE CHALLENGES ............................................................. 40
   Acknowledgements.................................................................................................. 40
REFERENCES .............................................................................................................41
                                                             v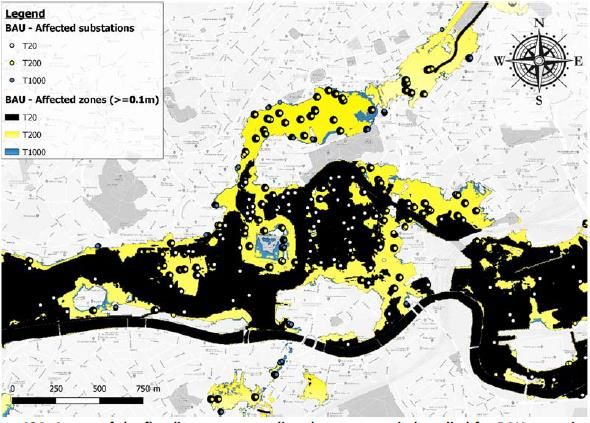
vi
ACRONYMS AND ABBREVIATIONS
AEP             Annual Exceedance Probability
ASA             Association of SuDS Authorities
BCC             Bristol City Council
CBA             Cost-Benefit Analysis
CC              Climate change
CEA             Cost-effectiveness analysis
CSO             Combined Sewer Overflow
GDP             Gross Domestic Product
GIS             Geographic Information System
ICLEI           Local Governments for Sustainability global network
Infoworks ICM   InfoWorks Integrated Catchment Modelling
Mx              Measure reference number x
MAOD            Metres Above Ordnance Datum
MCA             Multi-Criteria Analysis
MVA             Megavolt amperes
NBS             Nature Based Solutions
RAF App         Resilience Assessment Framework web-based tool
RAF             Resilience Assessment Framework
RAP             Resilience Action Plan
RCP             Representative Concentration Pathway
RESCCUE         RESilience to cope with Climate Change in Urban arEas
SO              Strategies that use the strengths to exploit opportunities
ST              Strategies that exploit strengths to overcome any potential threats
SUDS            Sustainable Drainage Systems
SUMO            Simulation of Urban Mobility
SWOT            SWOT analysis (or SWOT matrix) to identify strengths (S), weaknesses (W),
                opportunities (O), and threats (T)

                                               vii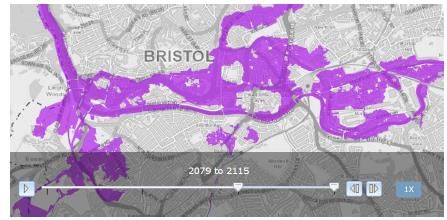
TOWS     TOWS analysis to link the different components of a SWOT together to come out
         with clear actions (SO, WO, ST, WT)
Tx       Return period of x years
UK       United Kingdom
UNISDR   Presently UNDRR, United Nations Office for Disaster Risk Reduction
WO       Strategies that mitigate weaknesses, by exploiting opportunities
WT       Strategies attempting to minimise weaknesses to avoid the impact of threats

                                       viii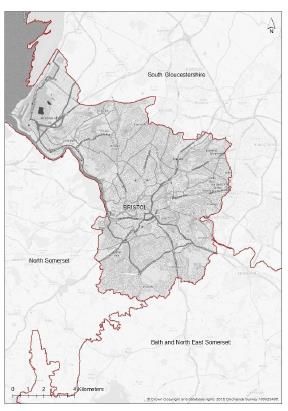
EXECUTIVE SUMMARY
Bristol developed this resilience action plan (RAP) for the Bristol City Council administrative area and
metropolitan area. The present planning has a medium-term horizon of five years, from 2020 to 2025, in
articulation with the strategic planning horizons for Bristol.
The objective of this plan is to provide a roadmap to improve the resilience to climate change with focus on
water.
The Bristol vision is to be a flourishing, welcoming and sustainable city. Bristol aims to have safe and affordable
neighbourhoods, with a high quality of life, sustainable economic and housing growth and an accessible
transport system that meets the city needs. Bristol intends to be a city with low carbon emissions addressing the
challenges of climate change, with infrastructures and services flexibly designed and managed to cope with
uncertainty.
The objectives considered to assess resilience to climate change, including the urban services and their
infrastructure, are to achieve:
City collective engagement, awareness of citizens and communities, leadership and management,
preparedness for basic conditions, climate change, disaster response and recovery and build back for
the organisational dimension of the city;
Spatial risk management and provision of protective infrastructure and ecosystems for the spatial
dimension of the city;
Services planning and risk management, autonomy and preparedness for climate change, disaster
response and recovery and build back for the functional dimension of the city;
Safe, autonomous, flexible as well as prepared infrastructures for the physical dimension of the city.
The plan considers the interactions and contributions to city’s resilience of the following strategic urban services:
water supply, wastewater drainage and treatment, storm water drainage, waste collection and treatment,
electric energy supply and mobility.
The most critical climate-related hazard for Bristol is flooding. Consideration of future climate scenarios were
therefore undertaken in respect of sea level rise, heightened river flows and extreme precipitation for pluvial,
fluvial and tidal river flooding.
The main concerns for the incoming years are flooding and combined sewer overflow, but also drought, heat
waves, wind storms, due to temperature, precipitation or wind extreme events occurrence, that have always
represented a threat to Bristol’s resilience which are expected to be aggravated by climate change (Pagani et al.,
2018). Bristol intends to achieve the above-mentioned resilience objectives, particularly reducing the risk
regarding these hazards, preparing the population and the services for their occurrence and promoting a better
articulation between urban services.
The planned strategies expected to have greater impact on the city are to develop community flood plans, to
keep identification of high-risk areas updated by conducting studies involving flood-modelling analysis, to build
riverside flood defence walls and to reduce surface water runoff and sewer overload by adding raingardens
before sewer inlets. With this planned set of strategies, Bristol aims to achieve a significant part of its long-term
resilience objectives regarding climate change, with focus on the urban water cycle.
ix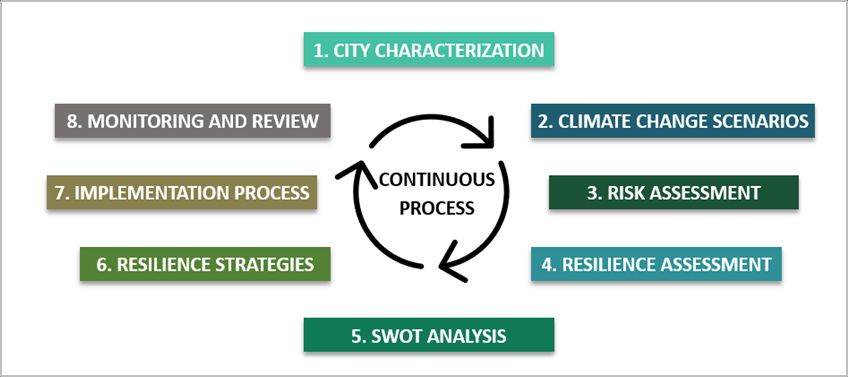
1. INTRODUCTION
BACKGROUND
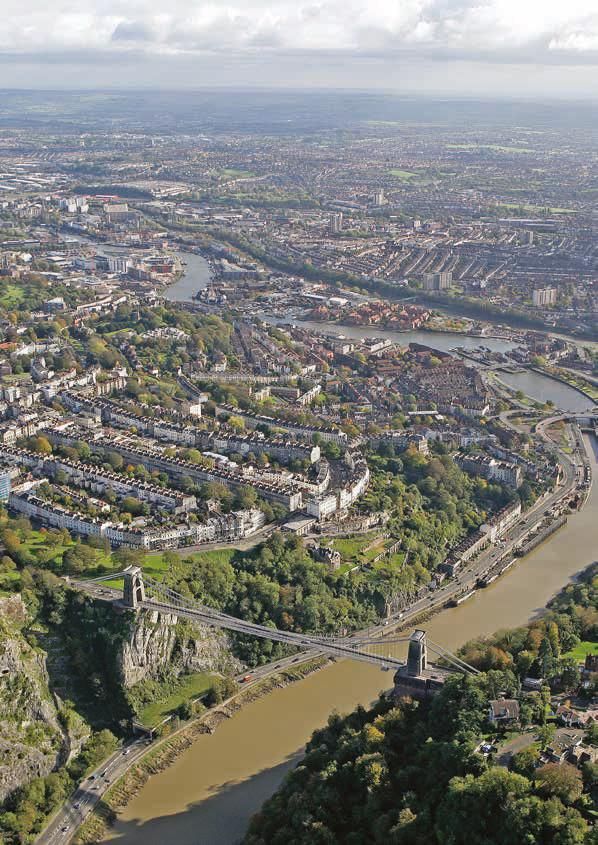
Located in the south-west England, predominantly on a limestone area, Bristol is one of the most densely
populated parts of the UK and, after London, the second largest city in the southern region. Most of the urban
extent of Bristol is based around the watercourses and river network, with two major rivers flowing through
the city (Avon and Frome rivers) resulting in a characteristically hilly landscape. It is one of the warmest cities
in the UK and there is a relatively even distribution of rainfall throughout the year, although the autumn and
winter seasons tend to be the wettest. Bristol’s urban environment encompasses a medieval city centre and a
historic dockland, high density housing located in the inner city, large-scale industry strategically situated near
the docklands, and the suburban quarters remain mostly residential with vast amounts of green space. Within
this context, Bristol has been investing in plans to create and improve resilient systems to tackle its various
urban challenges. Based on the analyses conducted by local and international actors working on resilience, the
main urban challenges in Bristol can be profiled firstly in terms of natural and environmental hazards and
secondly with regards to broader socio-economic issues, all of which are exacerbated when coupled with
climate change effects and unplanned urbanisation (Pagani et al., 2018). The resilience of the city to climate
change can be highly related to its urban services’ resilience, their interdependencies and cascade effects.
The Bristol vision is to be a flourishing, welcoming and sustainable city. Bristol aims to have safe and affordable
neighbourhoods, with a high quality of life, sustainable economic and housing growth and an accessible
transport system that meets the city needs. Bristol intends to be a city with low carbon emissions addressing
the challenges of climate change, with infrastructures and services flexibly designed and managed to cope
with uncertainty.
Bristol City Council has already developed an intensive work towards resilience and it is proactively committed
to increase Bristol’s resilience: from social cohesion to economic stresses and by enhancing resilience to all
sources of flooding. An example is the implemented Ashton strategy of identification of high-risk areas by
conducting studies involving flood-modelling analysis. Bristol’s commitment to resilience is evident in The
Bristol Resilience strategy. The Bristol Green Capital Partnership established in 2014, proceeding with diverse
initiatives, with the city work in Core City UK and ICLEI, with 100 Resilient Cities, as well as the 2019 One City
Plan amongst others (Pagani et al., 2018).
RESCCUE Local Flood
Pitt Review of Flood and Water Bristol Green Capital Bristol Resilience project Risk
2007 floods Management Act Partnership Strategy Develop a Management
2010 RAP Strategy
2007 2008 2010 2013 2014 2015 2017 2019 2020
….. Corporate Strategy
1The urban water cycle is the scope for this plan, due to the importance of water-related risks in the functioning
of the city. This resilience action plan (RAP) is a thematic plan that contributes to the city’s global planning and
relates to other planning instruments in Bristol such as:
City Master Plan;
100 Resilient cities (Rockefeller Foundation);
Emergency and contingency city plans;
Local Flood Risk Management Strategy (2018).
ABOUT THE PLAN
Plan scope, focus and time horizon
Bristol developed this resilience action plan (RAP) for the Bristol City Council (BCC) administrative area. The
present planning has a medium-term horizon of 5 years, from 2020 to 2025. The scope of this plan is resilience
to climate change (CC) with focus on the urban water cycle.
Geographical scope of the
plan
Addressed urban services
There is consideration of the following urban services, their interactions and contributions to city’s resilience
in the plan: water supply, wastewater drainage and treatment, storm water drainage, waste collection and
treatment, electric energy supply and mobility. These services are within the scope of this plan as they relate
with the water cycle, either providing a water service, being affected by these services’ performance or
affecting their performance.
In the resilience assessment, the services consider the BCC administrative area.
2Planning process
3Document structure
This document provides a five years’ roadmap for resilience, defining a path to enhance resilience of the city
and its services regarding climate change, with focus on the urban water cycle. It is based on the intense work
and background already existing in Bristol, the establishment of climate change planning scenarios, the
characterisation of the city context and hazards, the risk and resilience assessment and on the development
of the strategies that need to be implemented to enhance the resilience of the city to climate change with
focus on water. It was supported on the RESCCUE's template, guidelines and results obtained using tools and
approaches developed in this project (www.resccue.eu).
The plan is structured in 7 sections. This first introductory section provides the city background, an overview
of the plan scope, focus, time horizon, planning process and structure.
In section 2, a brief characterization of the city and addressed urban services is provided, focusing on the plan
scope.
In section 3, the climate change scenarios considered for the city in this plan are briefly presented, as well as
the related hazards, risk and vulnerabilities.
The resilience assessment and a SWOT analysis are presented in section 4, followed by the description and
planning of the adaptation strategies selected, in section 5.
In section 6, steps for plan monitoring and review are acknowledged and scheduled.
Section 7 presents the final remarks of the plan, with a brief list of identified benefits and future challenges,
as well as any relevant acknowledgments.
Detailed or confidential information regarding the assessment or description of the strategies are included as
confidential annexes.
42. CITY CHARACTERIZATION
CITY PROFILE
Bristol is located in the south west of England and is the eighth most populous city in the country and one of
the warmest in the United Kingdom. Throughout the year, rainfall is relatively evenly spread, although the
autumn and winter seasons tend to be the wettest; extreme heat waves and extreme cold spells do not occur
regularly.
Economically, Bristol developed strong advancements in the manufacturing and aerospace sector, continuing
to have the fastest growing economy of any British city outside of London. The main urban challenges in Bristol
can be profiled firstly in terms of natural and environmental hazards and secondly with regards to broader
socio-economic issues, all of which are exacerbated when coupled with climate change effects and unplanned
urbanisation (Pagani et al., 2018). The city characterization focuses on the scope of this plan.
BRISTOL
CLIMATE
GEOGRAPHICAL CHARACT ERISTICS
Climate type: Marine West Coast Climate
Country: England (Köppen climate classification)
Average temperature:
Altitude: 4.05-113.00 m
annual | hottest month | coldest month
Metropolitan area: 1 000 km2
10.5ᵒC | 18.0ᵒC | 6.0ᵒC
Average rainfall:
2
Urban area: 110 km
annual | wettest month | driest month
800-900 mm | 94.0 mm | 50.8 mm
Sea level – Max tidal amplitude: 14 m
- Tidally influenced rivers
(tidal range)
- Varied topography
Local mean (Cumberland Basin 2015): 7.5 m
Cold wave average annual
duration: 5 days
5POPULATION ECONOMY & GOVERNANCE
Urban population density: 3 910
inhabitants/km2
GDP: 92 560 000 €
Urban permanent population: 449 300
inhabitants
Urban population – commuters: 80 982 GINI index: 0.40
Population of the metropolitan area:
724 000 inhabitants Political cycle: 4 years
BUILT AND NATURAL EXISTING CLIMATE-RELATED
ENVIRONMENT & INFRASTRUCTURE HAZARDS IN THE CITY
Services in the city: Water, wastewater, Flooding - rainfall and sea level
storm water, waste, energy, mobility (road, Drought
train, air) Heat wave
Protected areas in the city: Ecological or Wind storm
sensitive, cultural or historical heritage Combined sewer overflow (CSO)
Ecosystem services: SuDS, highway bio-
retention pods, attenuation basins, green
roofs, tree planting, green spaces and
sewage treatment plant
HISTORICAL RELEVANT EVENTS AND TIME SCOPE OF ANALYSIS
Looking at historical relevant events, Bristol has suffered from significant flooding in the past.
The flood of 1968 was one of the most damaging in Bristol’s recent history, caused by both surface
water and fluvial flooding that resulted in high damages and impacts to the city and its inhabitants.
The construction of large interceptor tunnels in response to this, to divert exceedance flows higher up
in the catchment, reduced fluvial flood risk in the city (Pagani et al., 2018).
2012 saw significant flooding occurred across most of the UK due to some of the highest rainfall events
since record collection began. During this time, the most notable single flood event lasted two days
(November 21-22, 2012), with 30 houses internally flooded and many more suffering flooding of
gardens, garages and driveways (Pagani et al., 2018).
Looking at historical data records used in the RAP analysis, they refer to the last 100 years.
6EXTREMES COMPASS ROSE FOR BRISTOL
Marking the maximum change in climate
extreme events throughout the century (return
periods between 2 and 100 years) (Monjo et al.,
2018).
The edge corresponds to an increase of 100%. For
heat wave days (border is +1000%) for extreme
temperature (border is +10°C).
Median scenario
Uncertainty region (5-95%)
Note that this RAP focuses the flooding hazard in
Bristol. Consequently, it considers only the flooding
related variables that affect the city and services.
PLAYERS AND STAKEHOLDERS
Given this resilience plan thematic scope and focus (climate change and urban water cycle), Bristol identified
all the players and stakeholders involved in this resilience process. Several players from very different areas -
both public and private - participate in the management of the services and infrastructures, and several
stakeholders are involved in strengthening Bristol’s resilience-building efforts (Canalias et al., 2017).
Group name Players
Strategic group Bristol City Council, Wessex Water, Environment Agency
Steering group Bristol City Council, Wessex Water, Environment Agency
Action group Bristol City Council (community, flood management, civil
contingency, mobility – city roads and general transport)
Bristol Water (water supply service)
Wessex Water (urban drainage and wastewater treatment)
Environment Agency (flood management)
Western Power (electrical energy supply)
National Grid (power transmission)
First Bus (mobility – bus services)
Bristol Waste Company (waste collection)
Highways England (motorways)
Network Rail (railway network)
Lower Severn Internal Drainage Board (Avonmouth rhine
network)
British Telecomm (telecommunications)
7Stakeholders
Met office (weather services)
Wales & West Utility (gas distribution)
SSE (electricity and telecommunications)
EE (telecommunications)
Openreach (telecommunications)
SERVICE PROFILE
Urban services play a very relevant role in city resilience. The services considered in this plan interact and face
their own specific challenges due to climate change. Their resilience contributes to Bristol’s resilience.
INTERDEPENDENCIES ANALYSIS FOR BRISTOL
8ASSESSED SERVICES
SERVICES CONTEXT CHA RACTERIZATION
Water Wastewater Storm water Waste Energy Mobility
Utilities No. 1 1 1 1 2 4
Inhabitants
1.2 million 671 000 671 000 459 500 459 500 1.0 million
covered
Area
covered 2 589.988 241 241 110 110 1 000
(km2)
Relevant 1 783 GWh of
31 400 000 31 400 000
info. energy
kWh of kWh of
consumption
energy energy
- consumption consumption - - 432 960 ton
CO2
14 400 000 14 400 000
emissions
kgCO2e kgCO2e
(transport
emissions emissions
sector)
Scope of Bristol city Greater Greater Bristol
analysis and Bristol urban Bristol urban BCC area BCC area commuter
surrounds extent extent catchment
SERVICE INFRASTRUCTURE
WATER WASTEWATER
Total length of conduits (km) 6 700 Total length of sewers (km) 11 990
Water abstractions (No.) - Pumping stations (No.) 19
Pumping stations (No.) 164 Treatment plants (No.) 1
Treatment plants (No.) 16 Combined sewer overflows (No.) 278
Storage tanks (No.) 139 Marine outfall (No.) 1
9STORMWATER WASTE
Total length of sewers (km) 10 945 Waste containers (No.) 200 000
Pumping stations (No.) 29 Waste collection vehicles (No.) 180
Treatment plants (No.) 0 Recycling centres (No.) 1
SUDS (No.) 11 Transfer stations (No.) 2
Rainwater sewer overflows (No.) 278 Composting plants (No.) 1
Detention tanks (No.) - Incinerators (No.) 1
Sanitary landfills (No.) 10
ENERGY MOBILITY
Total length of aerial network Total length of road network
Unavailable 1162
(km) (km)
Total length of cycling network
Total length of subterranean (km) 610
Unavailable
network (km) Total length of train network
(km) 42
Power stations (No.) 1 Airports (No.) 1
Installed power (MVA) Unavailable Airport passengers (No.) 8 700 000
EXISTING HAZARDS IN THE SERVICES
Water Wastewater Storm water Waste Energy Mobility
Flooding - Flooding - Flooding - Flooding – Flooding -
Flooding - Rainfall
Rainfall Rainfall Rainfall Rainfall Rainfall
Flooding – Sea Flooding – Sea Flooding – Sea Flooding – Sea Flooding – Sea Cold wave -
level level level level level Temperature
Cold wave - Cold wave - Cold wave - Cold wave - Cold wave - Cold wave -
Snowfall Snowfall Snowfall Snowfall Snowfall Snowfall
Heat wave Heat wave Heat wave Heat wave Heat wave Heat wave
Drought Drought Drought Drought Drought Drought
Wind storm Wind storm Wind storm Wind storm Wind storm Wind storm
Combined sewer Combined sewer Combined Combined Combined
overflow overflow sewer overflow sewer overflow sewer overflow
103. CLIMATE CHANGE SCENARIOS AND RISK
ASSESSMENT
HAZARDS SOURCES AND PLANNING SCENARIOS
Several hazards may affect the city, services and infrastructures. In Bristol, this RAP focuses on the flooding
from intense precipitation and from sea level rise for the assessment of the city and the water related services,
waste and energy services. The mobility service considers flooding from intense precipitation. For these
hazards and related variables, climate change scenarios in line with UK national guidance for assessment are
agreed (Monjo et al., 2018).
A planning scenario corresponds to a hazard condition, described by the characterization of its trigger variables
by experts, for comprehensive assessment of the severity, probability of occurrence and its total impact. As a
minimum, cities would ideally define two planning scenarios. The Most Probable relates to a hazardous event
that causes disruption, assessed by experts to be the most likely to occur. The Most Severe relates to a
hazardous event that causes greater disruption, assessed by experts to be the worst case to plan for (based
on UNISDR, 2015).
CLIMATE CHANGE SCENARIOS FOR THE CITY AND SERVICES
CITY CITY
FLOODING – INTENSE PRECIPITATION FLOODING – SEA LEVEL RISE
MOST PROBABLE 1-5 years return period MOST PROBABLE Tide level = 8.5 mAOD
SCENARIO Aggravation of 40 % to SCENARIO (Metres Above Ordnance
account for CC Datum)
10-20 mm Aggravation of 1.0 m rise
RCP 8.5 for 2115 to account for CC
RCP 4.5 for 2120
MOST SEVERE 100 years return period MOST SEVERE Tide level = 9.4 mAOD
SCENARIO Aggravation of 40 % to SCENARIO (Metres Above Ordnance
account for CC Datum)
200 mm in 3 hours 0.5% AEP (Annual
RCP 8.5 for 2115 Exceedance Probability)
Aggravation of 1.0 m rise
to account for CC
RCP 4.5 for 2120
11WATER W AT E R
FLOODING – INTENSE PRECIPITATION FLOODING – SEA LEVEL RISE
MOST PROBABLE 5 years return period MOST PROBABLE Tide level = >8.0 mAOD
SCENARIO Aggravation of 40% to SCENARIO Aggravation of 1.0 m rise
account for CC to account for CC
>30 mm RCP 4.5 for 2120
RCP 8.5 for 2115
MOST SEVERE 30 years return period MOST SEVERE Tide level = >9.0 mAOD
SCENARIO Aggravation of 40 % to SCENARIO Aggravation of 1.0 m rise
account for CC to account for CC
>50 mm RCP 4.5 for 2120
RCP 8.5 for 2115
WASTEWATER AND STORMWATER W A ST E W AT E R A ND ST O R M W AT E R
FLOODING – INTENSE PRECIPITATION FLOODING – SEA LEVEL RISE
MOST PROBABLE 5 years return period MOST PROBABLE Tide level = >8.0 mAOD
SCENARIO Aggravation of 40% to SCENARIO Aggravation of 1.0 m rise
account for CC to account for CC
>30 mm RCP 4.5 for 2120
RCP 8.5 for 2115
MOST SEVERE 30 years return period MOST SEVERE Tide level = >9.0 mAOD
SCENARIO Aggravation of 40 % to SCENARIO Aggravation of 1.0 m rise
account for CC to account for CC
>50 mm RCP 4.5 for 2120
RCP 8.5 for 2115
12WASTE W A ST E
FLOODING – INTENSE PRECIPITATION FLOODING – SEA LEVEL RISE
MOST PROBABLE 5 years return period MOST PROBABLE Tide level = 9.0 mAOD
SCENARIO Aggravation of 40% to SCENARIO (Metres Above Ordnance
account for CC Datum)
>30 mm Aggravation of 1.0 m rise
RCP 8.5 for 2115 to account for CC
RCP 4.5 for 2120
MOST SEVERE 30 years return period MOST SEVERE Tide level = 9.4 mAOD
SCENARIO Aggravation of 40 % to SCENARIO (Metres Above Ordnance
account for CC Datum)
>50 mm 0.5% AEP (Annual
RCP 8.5 for 2115 Exceedance Probability)
Aggravation of 1.0 m rise
to account for CC
RCP 4.5 for 2120
ENERGY E NE R G Y
FLOODING – INTENSE PRECIPITATION FLOODING – SEA LEVEL RISE
MOST PROBABLE 30 years return period MOST PROBABLE Tide level = 9.0 mAOD
SCENARIO Aggravation of 40% to SCENARIO (Metres Above Ordnance
account for CC Datum)
RCP 8.5 for 2115 Aggravation of 1.0 m rise
to account for CC
RCP 4.5 for 2120
MOST SEVERE 100 years return period MOST SEVERE Tide level = 9.4 mAOD
SCENARIO Aggravation of 40 % to SCENARIO (Metres Above Ordnance
account for CC Datum)
>100 mm 0.5% AEP (Annual
RCP 8.5 for 2115 Exceedance Probability
Aggravation of 1.0 m rise
to account for CC
RCP 4.5 for 2120
13MOBILITY
FLOODING – INTENSE PRECIPITATION
MOST PROBABLE 10 years return period
SCENARIO Aggravation of 40 % to
account for CC
RCP 8.5 for 2115
MOST SEVERE 100 years return period
SCENARIO Aggravation of 40 % to
account for CC
RCP 8.5 for 2115
BRISTOL CAN EXPECT MORE CLIMATE-RELATED EVENTS
IN THE FUTURE. IN THIS PLAN:
Flooding from intense precipitation can cause damage to people,
buildings and other facilities as well as infrastructures; affect mobility
and disrupt transport services; overwhelm stormwater drainage
systems and affect wastewater treatment; and may cause other
Flooding damages and collapses resulting in interruption of energy supply,
affecting all other services and infrastructures' components.
Flooding from sea level rise can cause damage to people, buildings
and other facilities as well as infrastructures; affect mobility and
disrupt transport services (less travels and more delays) and affect
Flooding wastewater treatment.
Coldwaves from snowfall can affect the transport service (traffic),
cause damages and collapses in buildings and other facilities as well as
infrastructures, such as the energy infrastructure, resulting in
Cold wave
interruption of energy supply, affecting all other services.
Wind storm from intense wind can cause temporary disruption to waste and
energy services and infrastructures, that may result in waste containers
Wind storm
displacement and in interruptions of energy supply, affecting all other services.
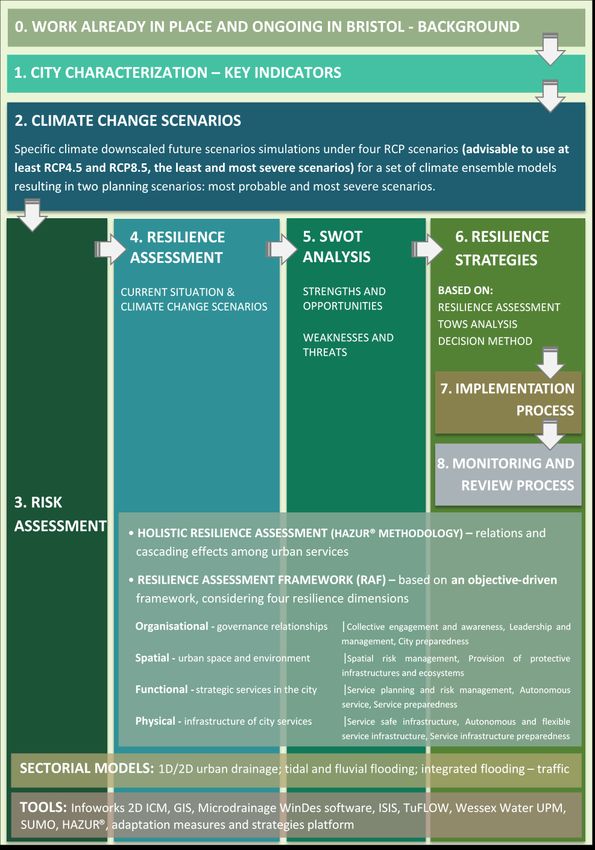
14RISK ASSESSMENT
SECTORIAL MODELS IN THE CITY
The sectorial models used in Bristol were based on historical data and on projections of future climate
scenarios. They provide a thorough characterization of the urban services, their relations with climate
variables, as well as detailed analysis of interdependencies and elaboration of hazard maps.
Mathematical modelling was developed using Infoworks 2D ICM, GIS, Microdrainage WinDes Software, ISIS,
TuFLOW and Wessex Water UPM to the whole Bristol administrative area, to the water, wastewater and storm
water services. For the mobility service, SUMO and GIS was used (Russo et al., 2019).
For different scenarios, considering both the current situation and the future with climate change, flooding
exposure and vulnerability of each urban service were characterised and the respective hazard maps were
produced (Russo et al., 2019) and may be visualised in https://csis.myclimateservice.eu/studies.
The effects of multiple hazards in the city were also studied, namely tidal and fluvial flooding and integrated
flooding-traffic and flooding-electrical relations (Evans et al., 2019).
MOST PROBABLE SCENARIO
Exposure map for flooding – rainfall Exposure map for flooding – tidal induced
induced scenario 2019-2115 scenario 2079-2115
15RISK-RELATED MAPS FOR MOBILITY SERVICE
CLIMATE CHANGE SCENARIOS
Risk map for rainfall induced flooding – Risk map for rainfall induced flooding –
Most probable for 2115 (return period of 20 Most severe for 2115 (return period of 100
years) years)
RISK-RELATED MAPS FOR ENERGY SERVICE
CLIMATE CHANGE SCENARIOS
Exposure map for rainfall induced flooding Exposure map for tidal induced flooding –
– Most probable and most severe (return Most probable and most severe (return
period of 20 and 100 years, respectively) period of 200 and 1000 years, respectively)
164. RESILIENCE ASSESSMENT AND SWOT
ANALYSIS
RESILIENCE ASSESSMENT
Resilience assessment enables to highlight where Bristol and the urban services stand today (reference
situation), regarding resilience to climate change, and to identify the most critical aspects to be improved,
taking into account both the reference situation and the expected impacts of climate change scenarios. The
integration of the resilience assessment results provided by all sources of analysis is presented in the SWOT
analysis. This supports the identification of resilience measures and strategies for this RAP to implement in the
city and services.
HOLISTIC APPROACH ASSESSMENT IN THE CITY
The HAZUR® methodology and tool conducted the holistic approach implemented in the resilience
assessment. It analyses the cascading effects that have collateral impacts on other strategic urban services and
the city. The identification of players, the description of the water related services and infrastructure, the
dependencies, the hazards and impacts on recovery time were all analysed (Canalias et al., 2017). This was a
result of collaborative workshops and a collection of historical data and data from the sectorial models.
BRISTOL OVERALL ASSESSMENT– RESILIENCE ASSESSMENT FRAMEWORK
An overall resilience to climate change was assessed based on an objective-driven framework, considering four
resilience dimensions for CC, with focus on urban water cycle: organisational, spatial, functional and physical.
The resilience assessment framework (RAF) applied to Bristol, including the services, was the RESCCUE RAF
(Cardoso et al., 2018; Cardoso et al., 2020a) supported by the RAF App tool (Cardoso et al., 2020b). These
provide the percentage of assessment metrics assigned to a resilience development level – incipient,
progressing or developed (represented respectively from a lighter to a darker colour in the figures) – as well
as those without information, that were not answered, and the ones not applicable to the city. The following
results illustrate the overall assessment for pluvial flooding. Similar results were obtained for tidal river flood.
In Bristol, overall resilience development in the city is advanced in nearly half of the aspects assessed. Around
a quarter shows as progressing and the remainder incipient, unanswerable or not applicable. Organisational
resilience is overall the most advanced resilience dimension, followed by the functional dimension. The
physical dimension presents the highest percentage of metrics that were not answered, followed by the
functional dimension, what may be due to data that is not easily applicable to the metrics provided in the RAF,
in some cases, and to lack of information in other cases.
17OVERALL RESILIENCE DEVELOPMENT LEVEL IN RESILIENCE DEVELOPMENT IN EACH
THE CITY DIMENSION
RAF ASSESSMENT FOR THE ORGANISATIONAL AND SPATIAL RESILIENCE DIMENSIONS
Organisational dimension focuses on city level, analysing governance structures, the stakeholder’s
involvement and the city’s resilience engagement and preparedness for climate change.
Spatial dimension also focuses on city level, analysing herein the urban space, protective infrastructures and
ecosystems.
DETAILED DEVELOPMENT LEVEL FOR THE CITY
ORGANISATIONAL SPATIAL
18In the Organisational dimension, the overall resilience development level of the City Preparedness objective is
significantly advanced, followed by the Leadership and Management objective, where it is also evident a
relevant progressing development. The Collective Engagement and Awareness objective is the one presenting
a lower advanced level while the progressing development level is the most expressive. Overall, this dimension
still presents some opportunities for improvement.
In the Spatial dimension, both objectives Risk Management and Protective Infrastructures and Ecosystems
present already around one third of the aspects with advanced development level, while also presenting
significant opportunities for improvement.
RAF ASSESSMENT FOR THE FUNCTIONAL AND PHYSICAL RESILIENCE DIMENSIONS
Functional dimension emphasizes each urban service management, autonomy and preparedness for CC. Also,
for each urban service, the Physical dimension attends infrastructure resilience regarding its safety, autonomy
and preparedness for CC. These dimensions also inform about the contribution of each service to Bristol's
resilience. The mobility service and the water, energy and mobility infrastructures present generally some
shortage in the available information regarding the RAF assessment approach.
DETAILED DEVELOPMENT LEVEL FOR EACH SERVICE – Services contribution to city resilience
FUNCTIONAL
Functional resilience of all services, except the mobility, is advanced in about half of the aspects assessed. It is
also evident a relevant progressing development, while presenting significant opportunities for improvement.
The mobility service is the one translating significant percentage of metrics that were not answered, may be
due to data that is not easily applicable to the metrics provided in the RAF, in some cases, and to lack of
information in other cases.
Physical resilience is advanced in about half of the aspects assessed for the water related services, while energy
and mobility present a lower percentage of advanced metrics. It is evident the significant progressing
development level in all services. This dimension translates the highest percentage of metrics that were not
answered, namely regarding the water, energy and mobility services, for the same reasons above mentioned.
19DETAILED DEVELOPMENT LEVEL FOR EACH SERVICE – Services contribution to city resilience
PHYSICAL
A more detailed assessment for these two dimensions and by service is presented. A more detailed analysis of
all dimensions and also by service is described in the SWOT analysis, linking the most advanced objectives to
the city main strengths, and the most incipient to the main weaknesses. Other information was also integrated
in the SWOT coming from the different assessments carried out as well as from the analysis of context.
WATER
FUNCTIONAL
PHYSICAL
20FUNCTIONAL FUNCTIONAL FUNCTIONAL
WASTE
WASTEWATER
STORMWATER
21
PHYSICAL PHYSICAL PHYSICALENERGY
FUNCTIONAL
PHYSICAL
MOBILITY
FUNCTIONAL
PHYSICAL
More complete graphical analysis for each objective, namely by assessment criteria for each urban service, is
presented in a confidential annex.
SWOT ANALYSIS
The diagnosis includes the integration of the resilience assessment results provided by all sources of analysis
(Russo et al., 2018, Russo et al., 2019, Evans et al., 2018, Evans et al., 2019, Canalias et al., 2017, Pagani et al.,
2018, Cardoso et al., 2020a,b). Aligned with the objectives, a SWOT analysis (Strengths, Weakness,
Opportunities and Threats) summarizes this information by identifying the city’s and the service’s internal
strengths and weaknesses, as well as the external opportunities and main threats (McClinton, 2015), following
the planning process presented before, as proposed in Cardoso et al. (2020a). From a resilience to climate
change perspective, a SWOT analysis for Bristol is presented. This SWOT analysis, whenever referring to
detailed hazards assessment, applies to pluvial and tidal river flooding. Whenever any of these hazards results
22in a different assessment, the hazard is specifically mentioned. A more detailed SWOT analysis is presented in
a confidential annex.
SWOT ANALYSIS FOR BRISTOL FROM A RESILIENCE TO CLIMATE CHANGE PERSPECTIVE
This SWOT table identifies the aspects related to the city’s main strengths and main weaknesses, in the
respective columns. Those that are underlined are included in the TOWS analysis that follows.
MAIN STRENGHTS MAIN WEAKNESSES
- Existing background on resilience
- Leadership and management - Collective engagement and awareness
- City preparedness
- Spatial risk management regarding hazard and exposure for
- Spatial risk management regarding general hazard and CC and impacts of climate related events
exposure mapping - Dependence and autonomy of protective infrastructures and
ecosystems services (regarding other services) considering CC
- Waste, energy and mobility services autonomy
- Water, wastewater, storm water, waste, energy services - Data gaps:
planning and risk management Wastewater, storm water and mobility services
- Water, wastewater, storm water, waste, energy services preparedness
preparedness Mobility service planning and risk management
- Data gaps:
Safe water, storm water, energy and mobility
- Safe wastewater, storm water and waste infrastructures infrastructures
- Wastewater, storm water and waste infrastructures Water and energy infrastructures autonomy and
preparedness flexibility
- Autonomous and flexible storm water and mobility - Wastewater and waste infrastructures autonomy and
infrastructures flexibility
- Water, energy and mobility infrastructures preparedness
- Significant historical records of meteorological events - Expected increased number of flooded electrical substations
- Recently constructed flood defences
- Identification of high-risk areas and hydraulic deficiencies
- Significant investments in CSO improvement and strategic
sewer projects
OPPORTUNITIES THREATS
- Coastal area - Coastal area
- Social cohesion, poor health infrastructure and social and
- Financial opportunities economic inequalities
- National and international recognition and awareness of - Temperature increase by 2050
resilience to CC emergency
- Heat waves
- Extreme precipitation increase
- Sea level rise
- Wind storms
- Drought
- Combined sewer overflows (CSO)
235. RESILIENCE STRATEGIES
IDENTIFICATION OF STRATEGIES
The identification of the strategies that reduce Bristol’s threats (T), overcome weaknesses (W) and exploit
strengths (S) and opportunities (O) was supported by a TOWS analysis (Weihrich, 1982), following the planning
process presented before, as proposed in Cardoso et al. (2020a). The topics addressed are underlined in the
SWOT table to facilitate identification. In this RAP, to address these aspects, the city aims to exploit its
strengths and to minimise its weaknesses in order to face the threats, by planning ST and WT strategies to be
implemented, mainly targeted for flooding hazard reduction.
TOWS ANALYSIS FOR THE CITY FROM A RESILIENCE TO CLIMATE CHANGE PERSPECTIVE
SO ST
STRENGHTS/ STRENGHTS/THREATS
a) Exploit the recently constructed flood defences to avoid threats
OPPORTUNITIES related to the coastal area, namely due to sea level rise.
Not identified for this RAP b) Exploit the existing identification of high-risk areas and hydraulic
deficiencies as well as the water infrastructures preparedness, to
overcome threats related to extreme precipitation increase and
CSO.
c) Exploit the identification of high-risk areas and hydraulic
deficiencies, strong city leadership and management, and spatial
risk management to overcome threats related to the extreme
precipitation increase and sea level rise.
WO WT
WEAKNESSES/ WEAKNESSES/THREATHS
OPPORTUNITIES d) Minimise weaknesses regarding collective engagement and awareness
to avoid the impact of threats related to social cohesion and inequalities.
Not identified for e) Minimise weaknesses regarding spatial risk management regarding
this RAP hazard and exposure, namely to CC and impacts of climate related events,
to avoid the impact of coastal area threats.
f) Minimise the expected increased number of flooded electrical
substations to avoid the impact of extreme precipitation increase and
CSO.
g) Minimise the expected increase number of flooded electrical
substations and need of enhancing energy and mobility infrastructure
preparedness to avoid the impact of threats related to the extreme
precipitation increase and sea level rise.
24As ST strategies that exploit strengths to avoid threats (a, b and c in the previous table), the city identified
respectively “Build riverside flood defence walls”, “Adding rain gardens before sewer inlet points” and “Keep
identification of high-risk areas updated by conducting studies involving flood-modelling analysis”.
As WT strategies that minimise weaknesses and avoid threats (d, e, f and g in the previous table), the city
considered respectively “Develop community flood plans”, “Build riverside flood defence walls”, “Adding
rain gardens before sewer inlet points” and “Keep identification of high-risk areas updated by conducting
studies involving flood-modelling analysis”.
Some challenges identified in the SWOT are still to be addressed in the future, namely some threats (poor
health infrastructure and economic inequalities, wind and temperature increase related events) and
weaknesses (related to data gaps, to some services and infrastructure autonomy and preparedness). Also,
strategies that take advantage of Bristol’s opportunities were not identified for this RAP.
STRATEGIES TO IMPLEMENT
DESCRIPTION
The strategies to implement are further detailed in the following tables, supported by information from
Martínez-Gomariz et al. (2017) and Martínez-Gomariz et al. (2019).
251 – Develop community flood plans
DESCRIPTION
Empowering communities to take action themselves in preparation for and during and after a
flood event enhances personal resilience.
Reliance on emergency services and responders can only span so far to a large population. Raising
awareness and promoting self-motivated actions helps reduce this reliance.
Typology: Citizens and stakeholders TOWS perspective: WT
Implementation: Planned Timeline: 2020-2023
Variables: Intense precipitation, sea level
Hazard: Flooding
rise
Institution: Bristol City Council Players: BCC Flood Risk Management team
Services:
Civil Protection Unit Highways Mobility
Waste
Costs:
Short-term: staff time Mid-term: staff time
MEASURES:
M009FLOOD Develop community flood plans
CO-BENEFITS: Relevant contribution | Slight contribution
ECONOMIC SOCIAL ENVIRONMENTAL
Cost savings Reduced mortality impacts Reduced water pollution
Increased property values Reduced health impacts Reduced land contamination
Reduced mortality from diseases Improved biodiversity and ecosystems
Enhanced public amenity Maintained and increased green space
Reduced impacts on vulnerable Reduced environmental impacts
groups through associated awareness
Reduced number of householders, Increased biodiversity and ecosystem
businesses forced from homes, places services
of work
Social inclusion
26Other resources Environment Agency
Relevant info. Community engagement strategies
272 – Build riverside flood defence walls
DESCRIPTION
Increase the height of existing defences or build new walls in places to future design flood levels
inclusive of climate change predictions.
Rising sea level and high tides further encroaching on riverside land.
Typology: Protective infrastructures TOWS perspective: ST, WT
Timeline: 2020 - 2025 approvals and design
Implementation: Planned
2025 onwards construction
Hazard: Flooding Variables: Sea level rise
Players: BCC Flood Risk Management team
Institution: Bristol City Council
and Environment Agency
Services:
Multiple
Costs:
Short-term: > 1.000.000 € Mid-term: > 1.000.000 €
MEASURES:
M001SLRISE Build riverside flood defence walls
CO-BENEFITS: Relevant contribution | Slight contribution
ECONOMIC SOCIAL ENVIRONMENTAL
Cost savings Reduced mortality impacts Improved water quantity
Reduced energy losses Reduced health impacts Reduced aquifer depletion
Job creation Reduced mortality from diseases Reduced water pollution
Possible reduction in prices Enhanced public amenity Reduced land contamination
Increased labour productivity Reduced impacts on vulnerable Improved biodiversity and ecosystems
Increased economic groups Maintained and increased green space
production Reduced number of householders, Reduced environmental impacts
Increased property values businesses forced from homes, places through associated awareness
of work Increased biodiversity and ecosystem
Social inclusion services
Effective/uninterrupted water
collection and security
Erosion control
28Other resources Consultants
Relevant info. River Avon project team fed RESCCUE analysis
293 – Keep identification of high-risk areas updated by
conducting studies involving flood-modelling analysis
DESCRIPTION
Tidal, fluvial and rainfall computer simulation and analysis of extreme flood events helps
identify potential problematic areas.
Realising where flood prone areas could be may not be apparent unless there has been an extreme flood
of that nature experienced in the past. This helps to figure that out and quantify the impacts.
Typology: Modelling studies TOWS perspective: ST, WT
Implementation: Implemented / Planned
Timeline: Ongoing
continuous updating
Variables: Intense precipitation, Sea level
Hazard: Flooding
rise
Institution: Bristol City Council Players: BCC Flood Risk Management team
Services:
Urban drainage – wastewater and stormwater
Tidal river influences and flood defence operation
Costs:
Short-term: 5.000 – 25.000€ Mid-term: 5.000 – 25.000€
MEASURES:
M008FLOOD Identify high risk areas by conducting studies involving flood
modelling analysis
CO-BENEFITS: Relevant contribution | Slight contribution
ECONOMIC SOCIAL ENVIRONMENTAL
Cost savings Reduced mortality impacts Reduced water pollution
Job creation Reduced health impacts Reduced land contamination
Possible reduction in prices Reduced mortality from diseases Improved biodiversity and ecosystems
Increased labour productivity Enhanced public amenity Maintained and increased green space
Increased economic Reduced impacts on vulnerable Reduced environmental impacts
production groups through associated awareness
Increased property values Reduced number of householders, Increased biodiversity and ecosystem
businesses forced from homes, places services
of work
Social inclusion
30Other resources Flood modeller consultancies
Relevant info. Additional information on risk assessment impacts may
be visualised in https://csis.myclimateservice.eu/studies
314 – Adding rain gardens before sewer inlet points
DESCRIPTION
An additional point of connection from the roof drainage rainwater down pipe. Removing the
first few millimetres of rain before discharging to the sewage network via an overflow system.
Addresses surface water runoff and sewer overload.
Typology: NBS and ecosystems services TOWS perspective: ST, WT
Implementation: Planned Timeline: 2020 - 2025
Hazard: Flooding Variables: Intense precipitation
Institution: Bristol City Council Players: BCC Flood Risk Management team
Services:
Mobility
Costs:
Short-term: - € Mid-term: - €
MEASURES:
M011FLOOD Adding rain gardens before sewer inlet points
CO-BENEFITS: Relevant contribution | Slight contribution
ECONOMIC SOCIAL ENVIRONMENTAL
Cost savings Reduced health impacts Improved air quality
Reduced energy losses Enhanced public amenity Improved water quantity
Increased labour productivity Social inclusion Reduced water pollution
Increased economic Reduced land contamination
production Improved biodiversity and ecosystems
Increased property values Maintained and increased green space
Reduced environmental impacts
through associated awareness
Increased biodiversity and ecosystem
services
Effective/uninterrupted water
collection and security
32Other resources Traffic management schemes
Relevant info. SuDS Manual, ASA
33CO-BENEFITS AND IMPACT ON RESILIENCE OBJECTIVES
CO-BENEFITS OF IDENTIFIED STRATEGIES
The identified strategies have several co-benefits, namely within the economic, social and environmental
components. Within each component, the expected co-benefits contribute differently in each strategy.
Depending on the relative contributions, the location of the strategy in the scheme below varies.
2
1
4
3
Strategy 1 – “Develop community flood plans” is more related to the social co-benefits and it also contributes
to some environmental aspects. Strategy 2 – “Build riverside flood defence walls” is quite balanced regarding
the three components. It is more related to the social co-benefits and also highly related to the economic co-
benefits, the environmental co-benefits have less relative relevance. Strategy 3 – “Keep identification of high-
risk areas updated by conducting studies involving flood-modelling analysis” is essentially related to the social
co-benefits, and Strategy 4 – “Adding rain gardens before sewer inlet points” is more related to the
environmental co-benefits.
IMPACT OF IDENTIFIED STRATEGIES ON EACH RESILIENCE DIMENSION
The impact of the identified strategies on the RAF resilience objectives for Bristol is highly significant. The
identified strategies address all the resilience dimensions as well as all services considered in this RAP.
IMPACT OF IDENTIFIED STRATEGIES ON THE CITY’S RESILIENCE OBJECTIVES, FOR EACH RESILIENCE DIMENSION
STRATEGIES
1. DEVELOP COMMUNITY FLOOD PLANS 2. BUILD RIVERSIDE FLOOD DEFENCE WALLS
3. UPDATE HIGH-RISK AREAS BY FLOOD MODELLING
4. RAIN GARDENS BEFORE SEWER INLET POINTS
ANALYSIS
34ORGANISATIONAL SPATIAL
COLLECTIVE
LEADERSHIP & CITY SP AT I AL R I SK P R O T E C T I V E I NFR A . &
ENGAGEMENT
MANAGEMENT P R E P AR E D NE S S M A N AG E M E NT E C O SY ST E M S
& AWARENESS
FUNCTIONAL
PHYSICAL
35Strategy 1 - “Develop community flood plans” will contribute to improve
organisational resilience, namely regarding the collective engagement and
DEVELOP awareness objective, as well as spatial resilience, regarding the spatial risk
COMMUNITY FLOOD management objective. This strategy is also related to functional resilience of
PLANS stormwater and energy services.
Strategy 2 - “Build riverside flood defence walls” will contribute to both objectives
BUILD RIVERSIDE of spatial resilience, and it is related to functional and physical dimensions of all
FLOOD DEFENCE services.
WALLS
Strategy 3 - “Keep identification of high-risk areas updated by conducting studies
involving flood-modelling analysis” will contribute to improve organisational
UPDATE HIGH-RISK
resilience, namely regarding the leadership and management objective, and
AREAS BY FLOOD
MODELLING ANALYSIS spatial resilience, regarding the spatial risk management objective and it is related
to functional and physical dimensions of all services.
Strategy 4 - “Adding rain gardens before sewer inlet points” will contribute to
RAIN GARDENS spatial resilience regarding the protective infrastructures and ecosystems
BEFORE SEWER INLET objective, and to functional and physical dimensions of the stormwater service.
POINTS
PRIORITIZATION
Prioritization of strategies is mandatory whenever resources are limited or when different strategies compete
for the same resources. Bristol is committed to implement the strategies “Develop community flood plans”,
“Build riverside flood defence walls”, “Keep identification of high-risk areas updated by conducting studies
involving flood-modelling analysis” and “Adding rain gardens before sewer inlet points”. Strategies considered
for prioritization are developing community flood plans and following the identification of high-risk areas by
conducting studies involving flood-modelling analysis an Ashton flood relief strategy to be researched. This
was following the method identified in the planning process that includes the application of Cost-Effectiveness
Analysis (CEA) and ranking of the co-benefits for given sets of measures. These inputs were provided by the
RESCCUE web-based platform for strategies and measures. The next step was a Cost-Benefit Analysis (CBA).
The social oriented strategies (Develop community flood plans) were ranked using a Multi-Criteria Analysis
(MCA), as it emphasises the judgement of the decision-making team and has the ability to prioritize without
the provision of monetary values (Evans et al., 2020).
36You can also read